Two component heat pipe
95
Scholars' Mine Scholars' Mine Masters Theses Student Theses and Dissertations 1971 Two component heat pipe Two component heat pipe Surapol Chandsawangbhuvana Follow this and additional works at: https://scholarsmine.mst.edu/masters_theses Part of the Mechanical Engineering Commons Department: Department: Recommended Citation Recommended Citation Chandsawangbhuvana, Surapol, "Two component heat pipe" (1971). Masters Theses. 5101. https://scholarsmine.mst.edu/masters_theses/5101 This thesis is brought to you by Scholars' Mine, a service of the Missouri S&T Library and Learning Resources. This work is protected by U. S. Copyright Law. Unauthorized use including reproduction for redistribution requires the permission of the copyright holder. For more information, please contact [email protected].
Transcript of Two component heat pipe
Scholars' Mine Scholars' Mine
Masters Theses Student Theses and Dissertations
1971
Two component heat pipe Two component heat pipe
Surapol Chandsawangbhuvana
Follow this and additional works at: https://scholarsmine.mst.edu/masters_theses
Part of the Mechanical Engineering Commons
Department: Department:
Recommended Citation Recommended Citation Chandsawangbhuvana, Surapol, "Two component heat pipe" (1971). Masters Theses. 5101. https://scholarsmine.mst.edu/masters_theses/5101
This thesis is brought to you by Scholars' Mine, a service of the Missouri S&T Library and Learning Resources. This work is protected by U. S. Copyright Law. Unauthorized use including reproduction for redistribution requires the permission of the copyright holder. For more information, please contact [email protected].
TWO COMPONENT HEAT PIPE
by
SURAPOL ~NC~J.lWANGBHUVANA, 1941 -~ ---·-·---~ ... -~-"·· .. -····--·--.
A THESIS
Presented to the Faculty of the Graduate School of the
UNIVERSITY OF MISSOURI-ROLLA
in partial fulfillment of the requirements for the
Degree of
MASTER OF SCIENCE IN MECHANICAL ENGINEERING
Rolla, Missouri
1971
ii
ABSTRACT
A two component heat pipe with water and ethanol as
the working fluid was investigated at different angles
of inclination and various ethanol concentration for two
power loads. The heat pipe was 15 inches long and 0.75
inches in diameter with a 100 mesh stainless steel screen
wick. The wall and the vapor temperatures were measured
at different stations along the length of the heat pipe by
copper-constantan thermocouples. The results were used to
evaluate an existing model which includes the constraint
of thermodynamic phase equilibrium of the solution on the
governing equations. Based on the measured pressure and
temperature distribution complete separation of the two
components does not normally take place during the operation
of such a heat pipe.
iii
ACKNOWLEDGEMENT
The author is deeply indebted to his research advisor,
Dr. B.F. Armaly, for his continuous guidance and counsel
during the course of this investigation. His stimulating
discussions and invaluable assistance have made this thesis
possible.
The constructive criticism of Dr. R.L. Reisbig and
Dr. C.Y. Ho is appreciated.
Sincere thanks go to my brothers, Natchalada, Sarid
Sriphirom and friends for their help.

iv
TABLE OF CONTENTS Page
ABSTRACT . . . . . . . . . . ii
ACKNOWLEDGEMENT . . . . . . . . . . . . . iii
LIST OF FIGURES . . . . . . . . . . . . . . . v
LIST OF TABLES vii
NOMENCLATURE . ix
I. INTRODUCTION • 1
II. REVIEW OF LITERATURE . 6
III. THERMODYNAMIC PHASE EQUILIBRIUM 12
IV. DESCRIPTION OF APPARATUS AND EXPERIMENTAL PROCEDURE • . . . • . . . . . . . . . . 22
v. RESULTS AND DISCUSSION . . . 28
VI. CONCLUSIONS AND RECOMMENDATIONS 49
BIBLIOGRAPHY • 51
VITA .. 55
APPENDIX A. PROPERTIES OF ETHANOL • • • . 56
APPENDIX B. EXPERIMENTAL RESULTS FOR THE HORIZONTAL AND VERTICAL MODE OF OPERATION AT VARIOUS CONCENTRATION . . . • . . . . 61
APPENDIX C. EXPERIMENTAL RESULTS FOR DIFFERENT CONCENTRATIONS AND ANGLE OF INCLINATION . 70

Figure
1
2
3
4
5
6
7
8
9
10
11
12
13
14
15
16
17
18
LIST OF FIGURES
Phase Equilibrium Diagram for Water Ethanol
Phase Equilibrium Diagram for Water Ethanol by Interpolation • • • • • • • • • • • •
Saturated Pressure of Ethanol . . . . . . . Latent Heat for Water-Ethanol Solution
Latent Heat for Water-Ethanol Solution by Interpolation • • • • • • • • • • • • • •
External Thermocouple Location . . . . . . . . Internal Thermocouple Location
Schematic of Apparatus • •
Surface Temperature for Different Angles of Inclination, 50 Watts, Pure Water • • . • • •
Surface Temperature for Different Angles of Inclination, 50 Watts, Pure Ethanol ••
Surface Temperature for Different Angles of Inclination, 75 Watts, Pure Water • • •
Surface Temperature for Different Angles of Inclination, 75 Watts, Pure Ethanol ••••••
Surface Temperature for Different Concentration, 50 Watts, Horizontal Level ••
Surface Temperature for Different Concentration, 75 Watts, Horizontal Level •••
Inside Temperature for Different Concentration, 50 Watts, Horizontal Level ••••
Inside Temperature for Different Concentration, 75 Watts, Horizontal Level
Variation of Partial Pressure of Ethanol With Initial Concentration • • • • • •
variation of Partial Pressure of Water With Initial Concentration • • • • • • • • • • • . .
v
Page
14
15
17
20
21
23
25
26
29
30
33
34
36
37
38
39
43
44

Figure
19
20
LIST OF FIGURES (continued)
Surface Temperature for Different Angles of Inclination, 50 Watts, 10.00 Percent Ethanol •
Surface Temperature for Different Angles of Inclination, 75 Watts, 10.00 Percent Ethanol
vi
Page
47
48

vii
LIST OF TABLES
Table Page
1 Experimental and Theoretical Results for Horizontal Level at 50 Watts . . 41
2 Experimental and Theoretical Results for Horizontal Level at 75 Watts . . 42
B-1 Deduced Experimental Results, Horizontal Level, 50 Watts . . 62
B-2 Deduced Experimental Results, Horizontal Level, 75 Watts . 64
B-3 Deduced Experimental Results, Vertical Level, ·so Watts • 66
B-4 Deduced Experimental Results, Vertical Level, 75 Watts • . • . . 68
C-1 Deduced Experimental Results, Pure Water, 50 Watts . . 71
C-2 Deduced Experimental Results, Pure Water 75 Watts . 72
C-3 Deduced Experimental Results, 5.05 Percent Ethanol Concentration, 50 Watts . 73
C-4 Deduced Experimental Results, 5.05 Percent Ethanol Concentration, 75 Watts . 74
C-5 Deduced Experimental Results, 10.00 Percent Ethanol Concentration, 50 Watts . 75
C-6 Deduced Experimental Results, 10.00 Percent Ethanol Concentration, 75 Watts . 76
C-7 Deduced Experimental Results, 15.20 Percent Ethanol Concentration, 50 Watts . 77
C-8 Deduced Experimental Results, 15.20 Percent Ethanol Concentration, 75 Watts . 78
C-9 Deduced Experimental Results, 21.02 Percent Ethanol Concentration, 50 and 75 Watts • • 79
C-10 Deduced Experimental Results, 24.06 Percent Ethanol Concentration, 50 and 75 Watts • • • 80

Table
C-11
C-12
C-13
viii
LIST OF TABLES (continued)
Deduced Experimental Results, 40.04 Percent Ethanol Concentration, 50 and 75 Watts ....
Deduced Experimental Results, Pure Ethanol, 50 Watts . . . • . . . . . . . . . . . . . .
Deduced Experimental Results, Pure Ethanol, 75 Watts . . . . . . . . . . . . . . ...
Page
81
82
83
Symbol
A
H s
H w
K
L
I m
M
LlP c
LlP g
p ve
LlP m
Q
r
NOMENCLATURE
Quantity
Cross sectional area of wick
Acceleration due to gravity
Latent heat of vaporization
Enthalpy of ethanol
Enthalpy of Solution
Enthalpy of water
Wick permeability
Total length of wicking material
Mass of flow rate
Mass of liquid saturating the wick
Capillary pumping pressure drop
Pressure drop due to gravity force
Pressure drop in liquid phase
Pressure drop in vapor phase
Actual pressure
Pure ethanol vapor pressure at Tvc
Pure water vapor pressure at Tve
Pressure drop due to momentum changes
Heat transfer rate
Mean pore radius of wicking material
Units
ft 2
ft/sec 2
Btu/lbm
Btu/mole
Btu/mole
Btu/mole
ft2
ft
lbm/hr
lbm
lbf/ft2
lbf/ft2
lbf/ft2
lbf/ft2
atm.
atm
atm.
lbf/ft2
Btu/hr
ft
ix

Symbol
r c
r v
t
T es
T ve
T ws
v
e
].l
p
cr
NOMENCLATURE (continued)
Quantity
Capillary wick pore radius
Radius of vapor space
Temperature
Saturated temperature of ethanol at P a
Vapor temperature at condenser
Vapor temperature at evaporator
Saturated temperature of water at Pa
Velocity
Mole fraction of ethanol
Mole fraction of water
Inclination angle of heat pipe
Time
Viscosity of liquid
Viscosity of vapor
Density of liquid
Density of vapor
Surface tension of liquid
X
Units
ft
ft
centigrade
fahrenheit
fahrenheit
fahrenheit
fahrenheit
ft/sec
dimensionless
dimensionless
degree
sec
lbm/ft-hr
lbm/ft-hr
lbm/ft3
lbm/ft3
lbf/ft

1
I. INTRODUCTION
The heat pipe is an effective heat transfer device
which has received considerable research efforts since 1964
when Grover and his co-workers [1] reported its successful
operation. Its main advantage is that large quantities of
heat can be transferred across a small temperature difference
and over a long distance resulting in a very large effective
thermal conductivity. It has been employed in many aspects
of thermal design. It has been used for precision measure
ments of radiant emissivity of surfaces [2], as a thermo
stat for measurement of vapor pressure of liquid metal [3],
and as a thermal conductor and heat flux transformer [4].
It is used in electronic circuits and in space applications
requiring thermal control; space and weight being the major
influencing factor for choosing the heat pipe against con
ventional devices. Many applications connected with high
temperature and direct energy conversion are also cited in
the literature [5].
In general, the heat pipe is a self contained structure
made of a thin walled sealed tube. The tube acts as a con
tainer enclosing the functioning parts of the heat pipe,
wick and working fluid, which lends it structural rigidity.
The inner wall of the tube is lined with a thin layer of
porous material, called a wick, which is usually saturated

2
with the working fluid. The heat pipe length is usually
divided into an evaporator section, adiabatic section and
a condenser section. The adiabatic section when present,
separates the evaporator from the condenser section.
Thermal energy from an external source is introduced through
the evaporator wall to the saturated working fluid causing
it to evaporate. The vapor moves, under the influence of
small pressure gradient, to the condenser section through
the core of the heat pipe. The vapor condenses at the
condenser section and the thermal energy released during
this process is transferred to an external sink through the
tube wall. The condensate, from the condenser, returns to
the evaporator section through the capillary wick utilizing
the surface tension forces of the liquid. This cycle, of
evaporization and condensation, is repeated continuously
during the steady state operation of the heat pipe.
The above described heat pipe cycle where thermal
energy is transferred from a source to a sink by continuous
mass cycling and phase change of a suitable working fluid
is common in many engineering systems. The coffee percula
tor, gravity induced mass cycling, and distillation column
pump induced mass cycling, are a sample of these systems.
The unique feature of the heat pipe is the fact that the
mass cycling is achieved by the surface tension forces of
the fluid and thus eliminating the need for a pump or
gravity field. The operating pressure in a heat pipe is
3
dependent on the vapor temperature, where it is an inde
pendent parameter (usually constant at one atmosphere) for
the other type of similar systems. The high energy trans
fer associated with the phase changes of the cycling fluid
makes this device suitable for application where high
rates of energy are required to be transferred across a
small temperature difference. The temperature range covered
by a given heat pipe depend on the operating fluid and can
cover the range from the triple point to the critical point.
Heat pipes have been shown to operate successfully at very
high temperatures with liquid metals [6] and at cryogenic
temperatures with liquid nitrogen [7-8].
In principle by providing a sufficient heat transfer
area for both the condenser and evaporator sections the
heat pipe can transport a wide range of heat transfer rates.
A heat transfer rate is eventually reached at which the
heat pipe starts to suffer from a rise in temperature at
the evaporator section and as a result the heat pipe ceases
to be practically pperable. The maximum capability is
usually characterized by this limiting heat transfer rate.
This limitation could be due to many factors such as, the
limiting capacity of the wick capillary pumping head, vapor
lock in the evaporator section, shocked vapor flow in the
core and the presence of non-condensable foreign gas. The
last cause may be due to chemical reaction between the fluid
and the remaining structure resulting in gas generation or

4
due to accidentally or purposely introducing foreign gas
during the filling process. In order to detect and control
the behavior of such a device when the foreign gas is
present it is essential to examine the operating character
istics of multi-component (more than one working fluid)
heat pipe.
The present study examines the operating characteris-
tics of a two component heat pipe. Water and ethanol at
various concentration was used as a working fluid. The
operating principles of such a heat pipe is the same as
those governing the operation of a single component heat
pipe with the exception that two components are actively
participating in the heat pipe processes, such as evapora-
tion and condensation. This modification will add the con-
straint of phase equilibrium to the governing parameters.
The operating temperature range (usually characterized for
a single component by the range between the critical and
the triple point) for two component heat pipe will be in
the overlapping region of the individual component. For
example, a water-ethanol heat pipe could have both components
participating as heat pipe fluids in the temperature range
from 930°R to 492°R, in which the two operating temperature
0 0 0 ranges (for water 1165 - 492 R, and for ethanol 930 -
113°R) overlap. Outside the specified temperature range
the heat pipe cannot be regarded as a functioning two
component heat pipe. At steady state partial separation of

5
the two components will take place leaving a rich water
solution, less volatile, at the evaporator section and rich
ethanol solution, more volatile, at the condenser section.
Due to differences in concentrations an appreciable tem
perature difference will exist between the two sections.
In effect two zones of approximately constant but different
temperatures could exist along its length. The heat pipe
will operate in such a manner as to maintain• constant total
pressure along its length and the temperature will vary in
accordance with the thermodynamic phase equilibrium of the
binary mixture.
The object of this experimental study is to evaluate
the above model and to examine the condition where complete
separation can exist by considering different concentrations
of water ethanol solutions.

6
II. REVIEW OF LITERATURE
In recent years a large number of articles, well
over a hundred, on heat pipes have appeared in the
literature. The major portion deal with one component heat
pipes operating at high or moderate temperatures. Only a
few articles dealt with low temperature or two component
heat pipes. A detailed review of the literature can be
found in an article by Winter and Barsch [5]. The following
is.only a few of the major references describing the develop
ment in this area.
The first concept of a heat pipe was proposed by
Gaugler [9] in 1944 and re-evaluated by Trefethen [10] in
1962. Unfortunately, neither one pursued its complete
development and the verification of its principles. In
1964 Grover [1] and Cotter [11] experimentally and theoreti
cally formulated and verified the principle of such a
device. The work of Cotter still is the basis for most
theoretical work in this area. The heat pipe was then
defined as a closed structure containing some working fluid
which transport thermal energy from one part of the structure
to another part by means of vaporization of the liquid,
transport and condensation of the vapor, and subsequent
return of the condensate from the condenser by capillary
action to the evaporator.
7
The basic theory for heat pipe design which was formu
lated and verified by Cotter balances the pressure drop in
the system as
b.P c (1)
where b.Pc is the capillary pumping pressure head, b.Pv is
the vapor pressure drop, b.PL liquid pressure drop, b.Pm
momentum pressure drop and b.P is the pressure drop due to g
gravity. The heat pipe will operate successfully if the
capillary pumping pressure is sufficient to overcome the
pressure losses caused by vapor transport, viscous drag,
gravity field and momentum changes. Each of these pressure
drops could be predicted using the following relations.
For example, the capillary pumping head is given by
!J.P c = 2cr r c
The viscous pressure drop based on laminar flow through
porous media is given by
I
l.!Lm b.P = L pKA
The vapor pressure drop based on laminar flow through a
tube is given by
b.P = v
(2)
(3)
(4)

8
This value has been shown to be small in relation to other
terms in the pressure balance equation and usually is
neglected. The pressure drop due to gravity field is given
by
~P = + pgL cos~ g (5)
The (+) sign is used when the evaporator is below the con-
denser section and (-) sign when the condenser is below
the evaporator section. The pressure drop due to momentum
changes is given by
~p m = M dv
Ad9 (6)
This term has been shown to be small relative to the other
pressure drop terms and usually is neglected.
By substituting the significant pressure drop terms
~PL' ~P , ~P , in equation (l) an expression for the c g
maximum flow rate in the wick can be obtained as
~ = pKA (2cr + pgL cos~) ~L r
(7)
By assuming that the total energy transfer across the length
of the heat pipe is only due to the mass cycling. through
the evaporation and condensation processes, the maximum
heat transfer can be predicted by
Q = m hfg max (8)

9
The above theoretical development is limited by the
fact that some of the properties appearing in the equations
could not be determined and are not readily available. For
example, the permeability of the wick and the capillary
wick radius have to be evaluated experimentally for the
geometry under consideration. Also the above formulation
assumes uniform temperature along the length of the heat
pipe, a case which is violated in most investigations.
These limitations indicate that for accurate prediction of
the heat pipe performance, an experimental evaluation is
needed.
The capability of the heat pipe could be limited or
controlled by various means which have been used effectively
in thermal design applications. For example, the flow of
the vapor or the liquid could be restricted [1] resulting
in reducing the heat flow capability and thus using the
heat pipe as variable thermal conductivity link. Another
technique is the intentional introduction of noncondensable
gas into the vapor space. The gas tends to collect in the
condenser where it forms a relatively stagnant gas zone
which effectively reduces the condensation area and rate.
Katzoff [12], Wyatt [13], and Anand [14] have suggested
the use of a thermostatically controlled valve to supply or
withdraw the noncondensable gas. Such an arrangement would
allow the effective condenser area to be varied independently
of the Qperating pressure prevailing in the pipe and could

10
be used to control its operation.
The heat pipe may be applied to a number of thermal
transport problems. Katzoff together with several other
investigators [12] recommended the use of long heat pipes,
wrapped around the circumference of spacecraft, to accom
plish the necessary equalization of the temperature dis
tribution. Anand [15] reported the successful employment
of two Freon-11 heat pipes. Deverall [2] utilized the
heat pipe to measure the hemispherical emissivity of
variously prepared surface. Schretzmann [16] employed the
isothermal surface of a heat pipe as a source in a study
of the effect of electromagnetic fields on the evaporation
of metals. Bohdansky and Schins [3] used a heat pipe to
determine pressure-temperature relations of vapor metal at
high temperatures and pressures. Feldman and Whitney [17]
suggested the construction of an isothermal flat for the
installation of electronic components. Many investi
gators [18] have considered its application to energy
dissipating systems and have cited numerous advantages
including greater heat transfer per unit weight. Deverall
[2] reported that a silver heat pipe was 520 times more
effective than an equivalent solid tantalum rod.
At cryogenic temperatures the heat pipe has been inves
tigated experimentally by Haskin [7] and Dudheker [8] and
theoretically by Chi [19]. The experimental investigation
dealt mainly with nitrogen heat pipe and it indicates that

such a heat pipe could be used effectively as a thermal
link with a conductivity better than copper.
The two component heat pipe was first evaluated by
Cotter [11] and Katzoff [12] for the purpose of thermal
control. Neither one, however, performed experimental
evaluation of such a device. Both assumed that the two
components will separate completely and the heat pipe
11
will perform as two individual heat pipes. Tien [20] was
the first to realize and confirm that the above model was
wrong, and proposed a new one based on thermodynamic phase
equilibrium where complete separation will rarely take
place. Water-ethanol heat pipe was evaluated by Tien [22]
and Feldman [23] examined experimentally water-methanol
heat pipe.

12
III. THERMODYNAMIC PHASE EQUILIBRIUM
The composition of the phase in equilibrium when two
or more components are in solution is of paramount impor
tance in a great number of physical processes. The most
common of these processes is in the fractional distillation
where the more volatile component in the solution is
separated from the bulk by successive condensation and
vaporization. The two component heat pipe which is under
consideration here, uses a process similar to the frac
tional distillation. The main difference between the two
is the role of the pressure which is maintained constant,
in the fractional distillation and is usually atmospheric.
In a heat pipe the pressure is a variable, corresponding
to the equilibrium pressure, and is dependent on the tem
perature and the composition of the vapor phase. This
difference makes the heat pipe process a more difficult one
to analyze and to predict. The two component heat pipe
involves a continuous process of evaporation and condensa
tion, resulting in a liquid and vapor phase in equilibrium.
The properties of the phase will dictate the operating
characteristics of such a heat pipe. Unfortunately, pro
perties such as enthalpy and latent heat are not usually
tabulated for a two component solution and the calculations
should be performed for the specific case under consideration.
This section deals with the method of obtaining the magnitude
13
of these properties using thermodynamic relations and some
existing experimental phase equilibrium data.
The treatment of equilibrium between gas and liquid in
a two component solution could be quite simple if each phase
exhibited the properties of an ideal solution. Under these
ideal conditions the composition of the phase in equilibrium
could be computed by using the fugacities of the pure com-
ponent. The behavior of most solutions, however, deviate
markedly from that of ideal solution and as such experimen-
tal results are needed to obtain accurate phase equilibrium
composition. For water-ethanol solution this information
can be found in reference [23] and is presented graphically
for different pressure in Fig. 1 and Fig. 2. The data in
Fig. 2 was interpolated from Fig. 1 for the pressures used
in the experiment. For any given temperature and a fixed
pressure the composition in the liquid and the vapor phase
can be read directly from the· figures.
Using thermodynamic relations the enthalpy of the
solution can be expressed as
= y H e e + y H
w w (9)
where H stands for the enthalpy and Y stands for the mole
fraction. The subscripts s, e and w stand for the solution,
the ethanol and the water, respectively. The latent heat
can be calculated by subtracting the enthalpy of the gas
from that of the liquid at the same temperature and
pressure resulting in the following relation.

-p:; 0
~ :::::::» E-t
~ ~ ~ ~ I'Ll E-t
780
760
740
720
700
680
660
640
620 0.0
Pressure (Atm.)
5.092
3.401
2.842
1.000
0.2 0.4 0.6 0.8 MASS COMPOSITION OF ETHANOL
Fig. 1 Phase Equilibrium Diagram for Water-Ethanol
14
1.0

_.... p::
0
r:il p:: ::> 8
~ r:il p.
~ 8
780
760
740
720
700
680
660
640
Pressure (Atm.)
5.092
4.750
4.200 3.860
3.460
2.300
2.000
1.820
1.340
15
620 ~--------~---------L--------~--------~~------~ 0.2 0.4 0.6 0.8 1.0 0
MASS COMPOSITION OF ETHANOL
Fig. 2 Phase Equilibrium Diagram for Water-Ethanol by Interpolation

= H g - H f
Yef Ywf = Y (H - y-- H f) + Y (H - ---y Hwf) eg eg eg e wg wg wg
16
(10)
where the subscripts g and f refer to the gas and the liquid
phase respectively. For the calculation of latent heat from
the above equation, the properties of both water and ethanol
and the composition of vapor and liquid phase should be known.
The composition in the gaseous phase Y and Y and the eg wg
liquid phase Yef and Ywf can be taken from Fig. 1 for a
specified pressure and equilibrium temperature. The pro-
perties of water can be taken directly from reference [24]
and the ethanol properties will be calculated using the fol-
lowing outline procedure. (Ethanol properties are not
readily available in tabulated form in the literature).
The saturated pressure for ethanol can be calculated
using Antonine [25] formula which is given by
(11)
where for ethanol A = 8.04494, B = 1554.3, C = 222.65, t
is in degrees centigr~de and P is in millimeter of mercury.
Fig. 3 shows a plot·oi the saturation pressure versus tem
perature resulting from the above expression. The enthalpy
of the saturated liquid ethanol at a given pressure can be
calculated using parabolic relation for the specific heat
[25] which is valid over the experimental temperature range
and is given by

17
740
700
660 -p::; 0
~ ::>
~ 620
~
~ ~ 8
580
540
500 0 1 2 3 4 5
PRESSURE (Atm.)
Fig. 3 Saturated Pressure of Ethanol

C = -10.83 + O.ll8T + 0.000025 T2 p
18
(12)
where Tis in degrees Kelvin and c is in (Cal/mol-°C). p
The enthalpy of the liquid at any given temperature can
then be evaluated from
273
C dT = -10.83(T-273) + 0.059[T2 p
0.0000083[T3 - (273) 3 ]
(273) 2 ] +
(13)
where as a reference, the enthalpy at temperature 273°K was
taken as zero H273 = 0.
The enthalpy of the pure enthanol saturated vapor can
be calculated by adding the latent heat to the liquid
enthalpy resulting in
H = H f + H f eg e e g
where Hefg is the latent heat calculated from the modified
Clausius Clapeyron equation [25] which is given by
H efg = RT
2 (dP)
p dt s [1 - ( 15)
where R is the universal gas constant (1.986 Cal/gm-mol-°K),
P saturated pressure (atm.), T saturated temperature (°K),
Tc critical temperature (°K), Pc critical pressure (atm.).
Using Antonine formula, equation (11) , the derivative of

19
the saturated pressure with respect to temperature appearing
in the above equation can be evaluated resulting in
= 2.303 BP (16)
(T + C- 273.15) 2
and by substituting in the governing equation and using
appropriate constants for ethanol, it is possible to deduce
the following relation for the latent heat
H = efg (T + C - 273.15) 2
1/2 (516) 3P [1 - ]
T 3 X 63
(17)
Appendix A contains the ethanol properties versus tempera-
ture calculated using the above procedure.
The properties of ethanol and the properties of water
were used to calculate the latent heat of the solution for
a fixed pressure while varying the concentration by using
equation (10). The results of these calculations for dif-
ferent equilibrium pressure are presented graphically in
Fig. 4 and Fig. 5. It is interesting to note that the
latent heat has a peak for a given saturated pressure and
that the magnitude of the latent heat decreases with
increasing pressure and with increasing ethanol concentra-
tion beyond the peak value.

(""')
0 M
~
Q) M
~ ........... ::l +I r:cl
8 F3! r:r:l ::r: 8 z r:r:l
~ ....:!
18
17
16
15 o.o 0.2
Fig. 4
0.4 0.6
Pressure (Atm.)
0.8
MOLE PERCENT OF ETHANOL
20
1.0
Latent Heat for Water-Ethanol Solution

M 0 r-f
X
Q) r-f
~ ......... ::I +I lXI
E-t ~ rz:l :I::
E-t z rz:l E-t ~ ....::1
18
17
16
15 0.0 0.2
Fig. 4
0.4 0.6
Pressure (Atm.)
0.8
MOLE PERCENT OF ETHANOL
20
1.0
Latent Heat for Water-Ethanol Solution

18
15 o.o 0.2
Fig. 5
Pressure (Atm.)
21
0.4 0.6 0.8 1.0
MOLE PERCENT OF ETHANOL
Latent Heat for Water-Ethanol Solution by Interpolation

IV. DESCRIPTION OF APPARATUS AND EXPERIMENTAL PROCEDURE
22
The heat pipe was constructed from a 22 guage stainless
steel, type 304, tubing with an outside diameter of 0.75
inches and was 15 inches long. Two stainless steel flanges
were soldered at the two ends to form a closed containing
tube. A 100 mesh stainless steel screen, three layers
thick, was used as a wick and was held tightly to the inner
wall of the containing tube by a helical spring.
The evaporator section of the pipe was 4 inches long
at one end of the tube. A copper sleeve, 0.25 inches wall
thickness, was fitted tightly over that section to maintain
temperature uniformity along its length. Three holes, 0.5
inches in diameter, were drilled into the sleeve wall, and
were distributed uniformly along its length. to allow ther-
mocouples connections to the heat pipe surface. Electrical
energy can be dissipated through a nichrome wire resistance
heater which was wrapped uniformly and cemented to the
outer surface of the sleeve by General Electric high tern-
perature cement. The remaining 11 inches of the heat pipe
acted as a condenser section.
The axial temperature distribution along the outside
surface of the heat pipe was measured by fifteen copper
constantan thermocouples located along the heat pipe length
as shown in Fig. 6. The axial vapor temperature distribution

~-------------14.25'~' ------------------------------~ ~----------12.75'~'----------------------------~
1---------.11. 7 5 "----------------------------1 1· 10.7~'~'----------------------~
~-------10.0~'~'--------------------~
~ 9 o 2 5 II ---------------1 I· 8. 50 II ---------------.-.1
,.. 7 • 2 5 "------------""' ,.. 6 • 50';....' --------~~
~ 5.75~"------~
WORKING FLUID SUPPLY 1· s.oo"-----..
,.. 4. 25 11-----t
1.. 3. so" WICK
HYPODERMIC NEEDLE
CONDENSER EVAPORATOR
TO VACUUM LINE
Fig. 6 External Thermocouple Location
N w

24
inside the heat pipe was measured by an additional eight
copper-constantan thermocouples. These thermocouples were
placed inside a 0.125 inches diameter thin wall stainless
steel tubing (a long hypodermic needle) , which was in the
center of the heat pipe and extended over its entire length
as shown in Fig. 7. All thermocouples were 5 mils in
diameter and were soldered at the appropriate section along
the length of the heat pipe.
The heat pipe was constructed in such a manner as to
permit its support in a device which can be rotated and
fixed at any angle of inclination. This assembly was used
to investigate the affect of inclination angle on the
operating characteristics of the heat pipe. A valving
arrangement was designed at the end of the condenser
section to allow for fluid addition and vacuum connection.
A schematic of the apparatus is shown in Fig. 8.
Prior to each experimental run, the heat pipe was
evacuated to approximately 5 microns for a period of 24
hours to remove most of the foreign gases. The heat pipe
was then charged with a 30 cubic centimeters of the
appropriate water-ethanol solution. This amount was suf
ficient to saturate the entire wick structure. Electrical
energy was added to the evaporator section to initiate the
heat pipe cycle. For a given angle of inclination, the
steady state temperature distribution in the vapor and at
the wall of the heat pipe was measured. The above was

, ..
PRESSURE GAUGE
TO SELECTOR SWITCH AND POTENTIOMETER
12.7~"------------------------------~
1 ~·--------10.50"------------------------~ J-olll ~------- 8 0 2 5 11-------------.1 1-41•-- 6 • 0 O" ___________ _,
r I~
CONTAINING TUBE
CONDENSER I EVAPORATOR
Fig. 7 Internal Thermocouple Location

PRESSURE GAUGE
BURETTE CONTAINED WORKING FLUID
VACUUM GAUGE
0 0 0
TO
~--~--~THERMOCOUPLES
CONNECTION
CONDENSER
VACUUM PUMP
ROTATING DEVICE
t-----10
Fig. 8 Schematic of Apparatus
POTENTIOMETER
0 0
0
EVAPORATOR
SELECTO SWITCH

27
performed for two evaporator power loads 50 and 75 watts.
The entire procedure was repeated for several water ethanol
concentrations.

28
V. RESULTS AND DISCUSSION
Experimental evaluation of the two component heat
pipe was performed using two power loads, 50 and 75 watts,
and several concentration levels of water-ethanol mixture
as the working fluid. The effect of inclination angle on
its operating characteristic was determined. As overall
experimental performance data consisting of the operating
pressure, surface and vapor temperature distribution are
summarized in Appendix B and C.
The performance of the heat pipe with a single com
ponent, water and ethanol, was performed first as a check
and as a reference to the performance of the two component
heat pipe. The surface temperature distribution for the
100% water and 100% ethanol heat pipe at a power load of
50 watts is shown in Fig. 9 and Fig. 10 respectively for
various angles of inclination. Their performance exhibit
the characteristics of a wick limited heat pipe. The per
formance of such a heat pipe is limited primarily by the
ability of the wick to deliver liquid continuously and at
a sufficient rate to the evaporator section. As can be
seen for an angle of inclination beyond 3 degrees, when
evaporator is above condenser, the temper~ture drop along
the heat pipe length increases rapidly as an indication
of partial drying out of the wick.

...... ~
0 -~ 0
~ ~
~ ~ 8
• ~ \) 0 0 0 280
90° 45° 00 -30 -60 -10° ANGLE:
50 WATTS
PURE WATER 260
240
220
200 o~------~2------~4------~6~------s~------~1~o------~1~2------~1~4~_j
Fig. 9
DISTANCE ALONG HEAT PIPE (IN.)
Surface Temperature for Different Angles of Inclination 50 Watts, Pure Water

280
260
-114 0 -~ ~ 240
~ ~
~ ~ 8
220
200
• ~ \l 0 0
ANGLE: 90° 45° 00 -30 -60
50 WATTS PURE ETHANOL
t---EVAPORATOR--+------------ CONDENSER -----------i
0 2
Fig. 10
4 6 8 10 12 14
DISTANCE ALONG HEAT PIPE (IN.)
Surface Temperature for Different Angles of Inclination, 50 Watts, Pure Ethanol
w 0

31
For the horizontal case, the water heat pipe
experienced a 10°F temperature drop along its length
while operating at a pressure level of 1.54 atm. and the
ethanol heat pipe experienced a drop of 16°F at an
operating pressure of 3.45 atm. for the same power load
of 50 watts. The condenser temperature was 225°F for the
water heat pipe and 219°F for the ethanol heat pipe. The
higher temperature drop for the ethanol case is in agree
ment with what could be predicted and is due to the lower
ethanol molar latent heat and its lower surface tension.
This behavior is evident in all the experimental results.
The latent heat, governs the amount of mass flow required
through the wick for a given power load as indicated in
equation (8). An increase in the capillary pumping head
is required to increase the mass flow otherwise a larger
drop in temperature will take place. It is interesting
to note that the vapor temperature as shown in Appendix B
is approximately constant for the horizontal operating
case and corresponds to the saturated temperatures of the
working fluid at the operating pressure. This agreement
indicates that the heat pipe and the measuring instrument
were operating satisfactorily.
At the higher power load (75 watts) the evaporator
temperature increased substantially causing a- l~~ge tem
perature drop along the heat pipe length for cases when
evaporator is inclined beyond 3 degrees below the
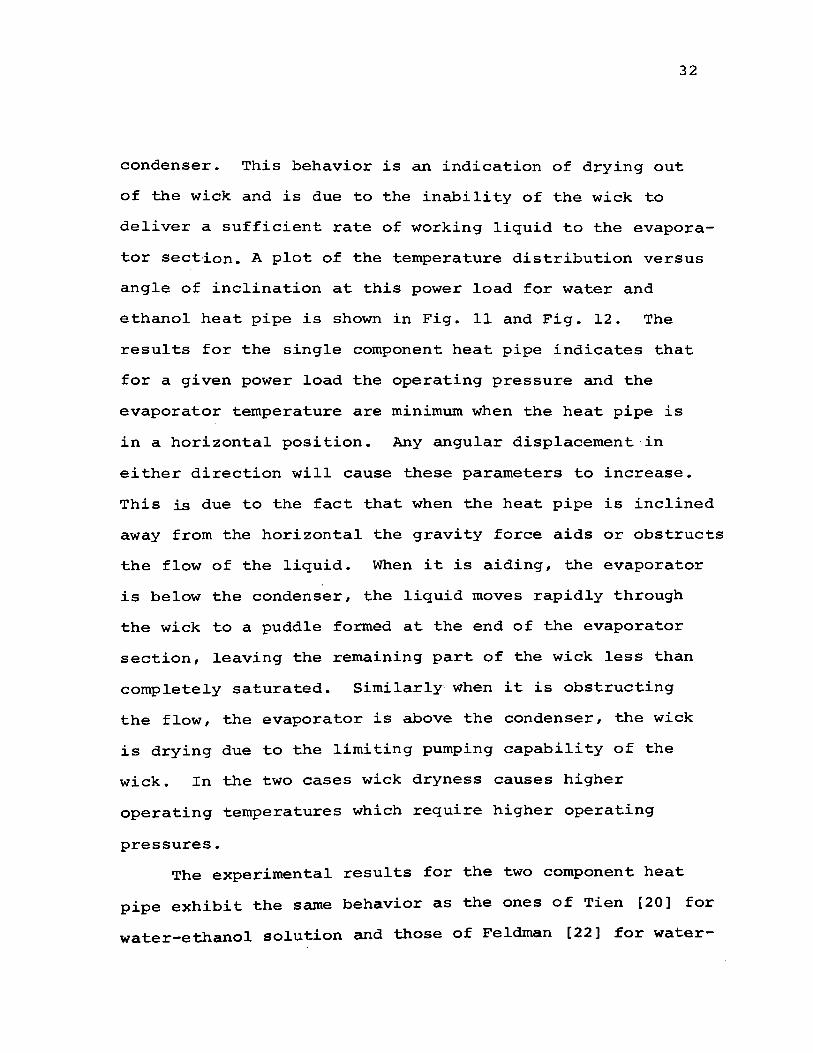
32
condenser. This behavior is an indication of drying out
of the wick and is due to the inability of the wick to
deliver a sufficient rate of working liquid to the evapora
tor section. A plot of the temperature distribution versus
angle of inclination at this power load for water and
ethanol heat pipe is shown in Fig. 11 and Fig. 12. The
results for the single component heat pipe indicates that
for a given power load the operating pressure and the
evaporator temperature are minimum when the heat pipe is
in a horizontal position. Any angular displacement in
either direction will cause these parameters to increase.
This is due to the fact that when the heat pipe is inclined
away from the horizontal the gravity force aids or obstructs
the flow of the liquid. When it is aiding, the evaporator
is below the condenser, the liquid moves rapidly through
the wick to a puddle formed at the end of the evaporator
section, leaving the remaining part of the wick less than
completely saturated. Similarly· when it is obstructing
the flow, the evaporator is above the condenser, the wick
is drying due to the limiting pumping capability of the
wick. In the two cases wick dryness causes higher
operating temperatures which require higher operating
pressures.
The experimental results for the two component heat
pipe exhibit the same behavior as the ones of Tien [20] for
water-ethanol solution and those of Feldman [22] for water-

-I':Lt 0 -~ :::>
~ rll
~ rll E-4
340
• D. \] 0 0 0
ANGLE: 90° 45° 00 -30 -60 -10
320 75 WATTS PURE WATER
300
280
260 ~--EVAPORATOR----~--------------------CONDENSER ------------------~
250~------~--------L--------L--------L--------L--------L--------L--~ 0 2 4 6 8 10 12 14
DISTANCE ALONG HEAT PIPE (IN.)
Fig. 11 Surface Temperature for Different Angles of Inclination, 75 Watts, Pure Water
w w


35
methanol solution. A comparison with their results could
not be made since they operated at different power loads.
The isothermal characteristic of the one component heat
pipe do not exist in two component heat pipe. Instead, in
most cases, two different isothermal regions will exist
along the length of the heat pipe. The results for the
horizontal operating condition are treated in detail in
the remainder of this discussion. Data on its performance
for different angles of inclination are tabulated in
Appendix B and C.
The performance of the two component heat pipe with
various levels of water-ethanol concentration is shown
in Fig. 13 through 16. The surface and the vapor tem
perature are presented for the 50 watts and 75 watts power
load. It is apparent that the temperature drop across the
length of the heat pipe is greater than the drop for
either of the single fluid heat pipe. The result can be
characterized in general by a relatively constant high tem
perature region in the evaporator and similar low tempera
ture region in the condenser. The differences in results
between the one and the two component heat pipe indicate a
possible difference in the mode of their operation.
The experimental results will be analyzed based on
the two existing hypotheses. The first, formulated by
Cotter [11], indicating that the fluids separate into
relatively distinct regions, each operating at its own

260
--~ 0 240 -
200
• ~ Q 0 0 0 • ETHANOL CONCENTRATION: 0 10.00 15.20 21.02 24.06 40.04 100
50 WATTS
HORIZONTAL LEVEL
~--EVAPORATOR----~--------------------CONDENSER------------------~
190 0 2
Fig. 13
4 6 8 10 12
DISTANCE ALONG HEAT PIPE (IN.)
Surface Temperature for Different Concentration, 50 Watts, Horizontal Level
14
w m

320
- 300 rx.. 0 -
260
240 0
• 0 0 0 • ETHANOL CONCENTRATION: 0 10.00 15.20 21.02 24.06 40.04 100
EVAPORATO
2
Fig. 14
4 6 8
DISTANCE ALONG HEAT PIPE
75 WATTS HORIZONTAL LEVEL
CONDENSER
10 12
(IN.)
Surface Temperature for Different Concentrations, 75 Watts, Horizontal Level
14
VJ -.J

~ 0 -~ 0 E-t
~ ~ Pot ~ ~ E-t
280~------------------------------------------------------------------~
260
240
220
200
190 0
• 0 0 0 • ETHANOL CONCENTRATION: 0 10.00 15.20 21.02 24.06 40.04 100
VAPORATOR ·I· 2 4 6
DISTANCE
CONDENSER
8 10
50 WATTS HORIZONTAL LEVEL
12
ALONG HEAT PIPE {IN.)
Fig. 15 Inside Temperature for Different Concentration, 50 Watts, Horizontal Level
14
w 00

320
300
r... 0
~ et: :::::> E-t 280 ~ ril ~ ::E! ril E-t
260
240 0
• 0 0 0 • ETHANOL CONCENTRATION: 0 lODO 15.20 21.02 24.06 40.06 100
EVAPORATOR
2
Fig. 16
75 WATTS HORIZONTAL LEVEL
~I-- CONDENSER----------------------~
4 6 8 10
DISTANCE ALONG HEAT PIPE (IN.)
12
Inside Temperature for Different Concentration, 75 Watts, Horizontal Level
14
w \0

40
saturated temperature. The second hypothesis, formulated
by Tien [20], claims that separation of the two fluids
will not take place and the phase equilibrium of the solu
tion will govern the concentration of each component at
any section of the heat pipe. Neither one of these have
been proved or critically verified by an experiment.
The first hypothesis indicates that the fluid having
the higher saturation temperature, in this case water, will
occupy the higher temperature evaporator region. The other
fluid having a lower saturation temperature will occupy the
lower temperature condenser region. Heat then would trans
fer from higher to lower temperature region by conduction
and mixing at the interface between the two regions. This
hypothesis is evaluated by comparing the temperatures
measured with the theoretical saturation vapor temperatures
of the two fluids at the measured operating pressure. As
shown in Table 1 and 2, large discrepancies exist between
the measured and the saturated temperatures specially for
the medium range of initial concentration. This fact indi
cates that the hypothesis of complete separation is not
valid for the present experimental two component heat pipe.
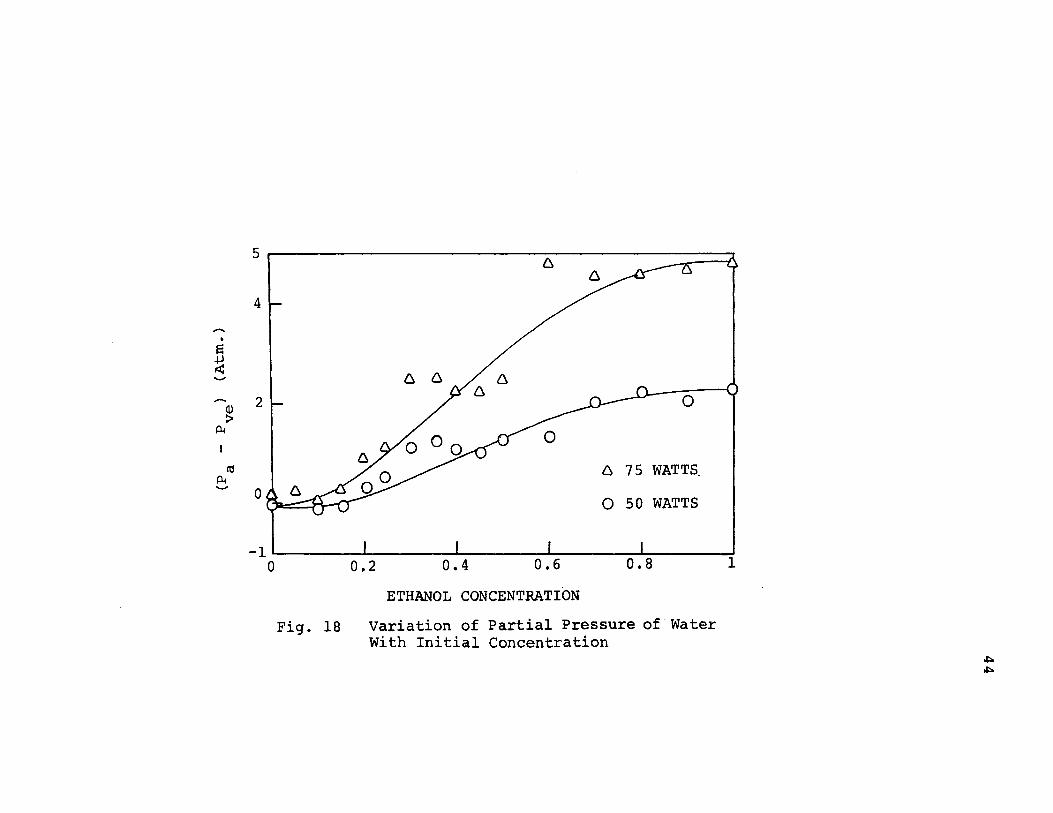
The second hypothesis is evaluated by examining Fig. 17
and Fig. 18 where the experimental ethanol partial pressure
in the evaporator section and the experimental water
partial pressure in the condenser section are presented
for different initial concentration. These figures clearly

Table 1
Run Initial Number Cone.
1 0 2 5.05 3 10.00 4 15.20 5 21.02 6 24.06 7 30.00 8 35.04 9 40.04
10 45.31 11 50.16 12 60.30 13 70.10 14 80.62 15 91.00 16 100.00
Experimental and Theoretical Results for Horizontal Level at 50 Watts
Pressure T OF T OF T OF {Atm.) ve ws vc
1. 54 227 227 227 1. 92 237 242 228 1. 82 246 244 226 1.82 245 250 224 1. 95 234 250 218 2.09 234 252 201 2.97 244 273 234 3.04 243 274 235 2.29 223 257 217 2.10 217 252 213 2.56 225 265 223 2.50 219 262 220 3.72 240 287 224 3.86 238 289 236 3.38 226 281 228 3.45 220 282 220
T OF es
194 200 202 202 205 209 228 229 214 210 220 220 240 242 234 235

Run Number
1 2 3 4 5 6 7 8 9
10 11 12 13 14 15 16
Table 2 Experimental and Theroetical Results for Horizontal Level at 75 Watts
Initial Pressure T OF T OF T OF Cone. (Atm.)
ve ws VC
0 3.86 282 289 284 5.05 4.06 288 292 275
10.00 5.08 304 307 281 15.20 3.73 282 287 262 21.02 4.20 277 294 261 24.06 4.74 284 302 265 30.00 7.25 298 332 287 35.04 6.58 293 325 280 40.04 5.08 270 307 262 45.31 5.15 270 308 265 50.16 5.56 273 313 269 60.30 9.10 296 350 293 70.10 8.25 288 342 283 80.62 8.00 282 340 283 91.00 8.00 280 340 283
100.00 9.06 280 341 278
T OF es
242 246 258 240 248 254 281 275 259 260 264 296 290 287 287 297

4
-. s +J < 2
-u :>
PI
liS 0 PI
-1 0
Fig. 17
6 75 WATTS
0 50 WATTS
0.2 0.4 0.6 0.8 1
ETHANOL CONCENTRATION
Variation of Partial Pressure of Ethanol With Initial Concentration
-. s ~ -
(!) :>
~
I'd ~ -
5
4
2 0
WATTS_
0 WATTS
-1_~----~------~~----~~----~------~ 0 0.2 0.4 0.6 0.8 1
Fig. 18
ETHANOL CONCENTRATION
Variation of Partial Pressure of Water With Initial Concentration

45
demonstrate that separation of the two fluids does not
take place. For the case when the initial concentration
is rich in water, almost pure water occupies the
evaporator (partial pressure of ethanol is almost zero)
but the condenser is filled with water ethanol mixture.
When the initial concentration is rich in ethanol, almost
pure ethanol occupies the condenser (partial pressure of
water is almost zero) but the evaporator is filled with
water ethanol mixture. The figures also indicate that
for any other initial concentration complete separation
will not take place. This, however, does not mean that
the local concentration is governed by the thermodynamic
phase equilibrium. Some more results are needed to
validate this fact.
The axial temperature distribution appear to depend
strongly on the initial concentration. The functional
dependence is quite complicated and may depend on the
properties of the solution and the wick. The evaporator
temperature fluctuate as the ethanol concentration
increases. The most sensitive region appears to exist
within the range of initial concentrations 0-20 percent
ethanol. It is interesting to note that the properties
of water-ethanol solution behave strangely and in a
unique way in this range of ethanol concentration. As can
be seen from section III the latent heat reaches a maximum
and the mass diffusion coefficient reaches a minimum [27]

in this range. Other properties are not available for
this solution, however it is believed that the strange
behavior will exist in most of the properties in this
46
range of concentration. Further theoretical investigations
regarding the properties of the solution and the behavior
of the two component heat pipe are needed in order to
predict the functional relation between the initial con
centration and the temperature distribution.
The e£fect of the angle of inclination on the tem
perature distribution for a two component heat pipe is pre
sented in Fig. 19 and Fig. 20 for the case of 10 percent
ethanol. Appendix B and C contain data for other concen
trations. The effect is similar to the case of a one
component heat pipe which have been discussed earlier.

290
270
-~ 250 0 -~ ::::> E-1
~ ril 230 §! ril 8
210
190 0 2
Fig. 19
ANGLE:
50 WATTS 10.0 PERCENT ETHANOL
4 6 8 10 12 14
DISTANCE ALONG HEAT PIPE (IN.)
surface Temperature for Different Angles of Inclination, 50 Watts, 10.00 Percent Ethanol

350~------------------------------------------------------------------,
330
-1":11 0- 310
270
ANGLE:
75 WATTS 10.0 PERCENT ETHANOL
.__---F.VAPORATOR ---+------------cONDENSER
2 4 6 8 10 12 14 DISTANCE ALONG HEAT PIPE (IN.)
Fig. 20 Surface Temperature for Different Angles of Inclination, 75 Watts, 10.00 Percent Ethanol
49
VI. CONCLUSIONS AND RECOMMENDATIONS
The operating characteristics of a two-component heat
pipe have been demonstrated. The results indicate that
in most cases complete separation of the two components
does not take place in the heat pipe. At low ethanol
concentration the evaporator contains almost pure water
while the condenser contains a mixture of water and ethanol.
At high ethanol concentration the condenser contains pure
ethanol while the evaporator contains a mixture of water
and ethanol. The effect of inclination angle on the tem
perature distribution of a two component heat pipe is
similar to the case of the one component heat pipe. Wick
dryness starts to take place at angles beyond 3 degrees
with the condenser below evaporator.
It is recommended that further experimentation be made
with a Pyrex glass heat pipe, to permit some visual aid,
for the purpose of examining the flow patterns within the
heat pipe. Sampling stations, where fluid can be extracted
and chemically analyzed, should be installed in order to
examine if the phase equilibrium actually governs the con
centration of the solution at different sections of the
heat pipe. It is essential to perform experiments with
other types of fluids since the properties of water-ethanol
solutions behave in some what strange fashion at low

50
concentration. The additional results would help to
formulate the functional relationship between the fluid
properties and the axial temperature distribution of the
heat pipe.

51
BIBLIOGRAPHY
1. Grover, G.M., et al., "Structures of Very High Thermal
Conductance", Journal Applied Physics, Vol. 35,
1990-1, 196-4.
2. Deverall, J.E., "Total Hemispherical Emissivity
Measurements by the Heat Pipe Method", Aviation
and Space: Progress and Prospects Annual
Aviation and Space Conference., 649-54, 1968.
3. Bohdansky, J., and Schins, H.E.J., "New Method for
Vapor Pressure Measurements at High Temperatures
and High Pressure", Journal Applied Physics,
Vol. 36, No. 11, 3683-4, 1965.
4. Lee fer, B. I. , "Nuclear Thermionic Energy Converter" ,
Proceeding of the 20th Annual Power Source Con
ference, 172-75, 1966.
5. Winter, E.R.F. ,· and Barch, B.O., "Advances in Heat
Transfer", Vol. 7, Academic Press, New York,
219-313, 1971.
6. Johnson, G.D., "Compatibility of Various High Tempera
ture Heat Pipe Alloys Working Fluids", IEEE
conf. Record of Thermionic Conversion Specialist
Conf., 258-65, 1968.

52
7. Haskin, W.L., "Cryogenic Heat Pipe", Air Force Flight
Dynamics Laboratory, Technical Report AFEDL-TR-
66-228, 1967.
8. Dudheker, J.G., "A Study of Nitrogen Heat Pipe", Thesis,
University of Missouri-Rolla, 1971.
9. Gaugler, R.S., "Heat Transfer Devices", General Motors
Corporation Research, 1944.
10. Trefethen, L., "On the Surface Tension Pumping of
Liquids, or, Possible Role of the Candlework in
Space Exploration", General Electric Tech. Inform.
Service, No. 615Dll4, 1962.
11. Cotter, T.P., "Theory of Heat Pipes", Los Alamos Sci.
Lab., LA-3246-MS, 1965.
12. Katzoff, D., "Heat Pipes and Vapor Chambers for
Thermal Control of Spacecraft", AIAA Thermophysics
Specialist Con£., 310, 1967.
13. Wyatt, T., "Controllable Heat Pipe Experiment",
Applied Physics Laboratory, Johns Hopkins Univer-
sity, SC0-1134, 1965.
14 d D K et al "Heat Pipe Application for Space..,. o Anan 1 o • I • I
craft Thermal Control", Johns Hopkins Univ.,
Appl. Phys. Lab., AD 662241.

53
15. Anand, D.K., 11 Heat Pipe Application to a Gravity
Gradient Satellite .. , Aviation and Space: Progress
and Prospects-Annual Aviation and Space Conf.,
634-38, 1968.
16. Schretzmann, 11 The Effect of Electromagnetic Fields
on the Evaporation of Metals 11, Physic Letter
24 A, No. 9, 478-79, 1967.
17. Feldman Jr., F. I., and Whiting, G.H., 11 Applications
of the Heat Pipe 11, Mech. Eng., 48-53, 1968.
18. Langston, L.S., and Kunz, H.R., 11 Vapor Chamber Fin
Studies .. , NASA CR-54882, 1965.
19. Chi, S. W. , and Cygnavowicz, T .A. , "Theroetical Analysis
of Cryogenic Heat Pipes", ASME Paper No. 70 HT/
SPT-6, 1970
20. Tien, c. L., 11 Two Component Heat Pipes 11, AIAA Paper No.
69-631, 1969.
21. Tien, c.L., and Rohani, A.R., To be Presented at the
1971 ASME Winter Annual Meeting.
2 2. Feldman Jr. , K. T. , and Wi thnow, G. L. , 11 Experimen ts
with a Two-Fluid Heat Pipe", Proceedings of the
4th Intersociety Energy Conversion Engineering
Conference, 1969.

54
23. Chu, J .c., et al., "Vapor-Liquid Eguilibrium Da;ta",
J.W. Edwards, Ann Arbor, Michigan, 269-76, 1954.
24. Keenan, J.H., "Steam Tables, Thermodynamics Properties
of Water", John Wiley & Sons, Inc., 2-13, 1969.
25. Stull, Daniel R., et al., "The Chemical Thermodynamic
of Organic Compound", John Wiley & Sons, Inc.,
14-16, 55-56, 1969.
26. Lange, N .A., 11 Langes' s Handbook of Chemistry", Handbook
Publishers, Inc. Sandusky, Ohio, 1429, 1956.
27. Smith & Venness, "Introduction to Chemical Engineering
Thermodynamic", McGraw-Hill Book Company, Inc.,
357-401, 1959.
28. Bird, R. Byron, et al., "Transport Phenomena", John
Wiley & Sons, Inc., 504, 1965.

55
VITA
Surapol Chandsawangbhuvana was born April 17, 1941,
in Bangkok, Thailand, where he attended elementary, secondary
and high school.
He entered Chulalongkorn University, Bangkok, in 1962
and received the Diploma of Science in Bio-Chemistry, in
1965. In 1968 he received the Bachelor of Science degree in
Mechanical Engineering.
He came to the United States to the University of
Kansas in September 2, 1969 and transferred to the Univer
sity of Missouri-Rolla in the Fall of 1970.

56
APPENDIX A
PROPERTIES OF ETHANOL
Enthalpy (Btu/lb)
Temp. Temp. Press. Sat. Latent Heat Sat. Cent. Fahr. Atm. Liquid hfg Vapor
t T p hf h g
26 78.80 0.08 25.39 401.55 426.94
27 80.60 0.09 26.44 400.94 427.38
28 82.40 0.09 27.49 400.33 427.82
29 84.20 0.10 28.55 399.73 428.27
30 86.00 0.10 29.61 399.12 428.73
31 87.80 0.11 30.67 398.52 429.20
32 89.60 0.11 31.75 397.92 429.67
33 91.40 0.12 32.82 397.33 4 30 .15
34 93.20 0.13 33.91 396.73 430.64
35 95.00 0.14 35.00 396.14 431.13
36 96.80 0.14 36.09 395.54 431.63
37 98.60 0.15 37.19 394.95 432.14
38 100.40 0.16 38.29 394.36 432.65
39 102.20 0.17 39.40 393.7 7 433.17
40 104.00 0.18 40.52 393.18 433.70
41 105.80 0.19 41.63 392.59 434.23
42 107.60 0.20 42.76 392.00 434.76
43 109.40 0.21 43.89 391.42 435.31
44 111.20 0.22 45.02 390.83 435.85
45 113.00 0.23 46.17 390.24 436.41
46 114.80 0.24 47.31 389.66 436.97
47 116.60 0.25 48.46 389.07 437.53
48 118.40 0.26 49.62 388.48 438.10
49 120.20 0.28 50.78 387.89 438.67
50 122.00 0.29 51.95 387.30 439.25
57
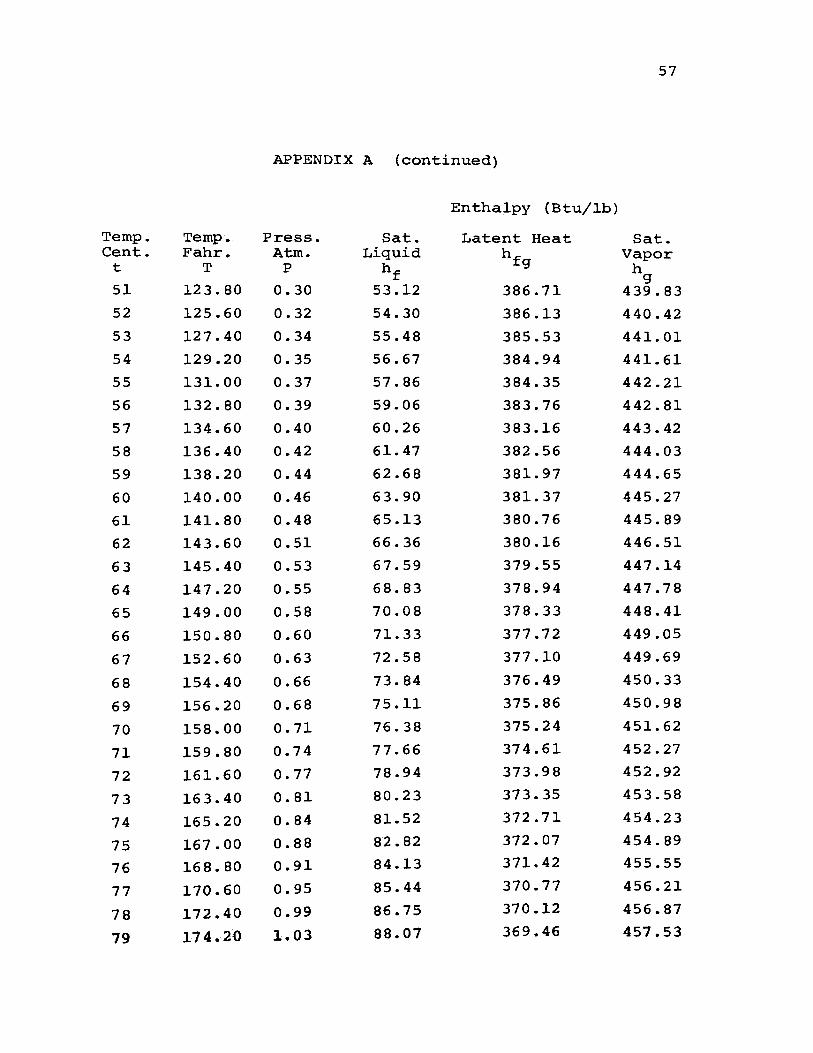
APPENDIX A (continued)
Enthalpy (Btu/lb)
Temp. Temp. Press. Sat. Latent Heat Sat. Cent. Fahr. Atm. Liquid hfg Vapor
t T p hf h g 51 12 3. 80 0.30 53.12 386.71 439.83
52 125.60 0.32 54.30 386.13 440.42
53 127.40 0.34 55.48 385.53 441.01
54 129.20 0.35 56.67 384.94 441.61
55 131.00 0.37 57.86 384.35 442.21
56 132.80 0.39 59.06 383.76 442.81
57 134.60 0.40 60.26 383.16 443.42
58 136.40 0.42 61.47 382.56 444.03
59 138.20 0.44 62.68 381.97 444.65
60 140.00 0.46 63.90 381.37 445.27
61 141.80 0.48 65.13 380.76 445.89
62 143.60 0.51 66.36 380.16 446.51
63 145.40 0.53 67.59 379.55 447.14
64 147.20 0.55 68.83 378.94 447.78
65 149.00 0.58 70.08 378.33 448.41
66 150.80 0.60 71.33 377.72 449.05
67 152.60 0.63 72.58 377.10 449.69
68 154.40 0.66 73.84 376.49 450.33
69 156.20 0.68 75.11 375.86 450.98
70 158.00 0.71 76.38 375.24 451.62
71 159.80 0.74 77.66 37 4. 61 452.27
72 161.60 0.77 78.94 373.98 452.92
73 163.40 0.81 80.23 373.35 453.58
74 165.20 0.84 81.52 372.71 454.23
75 167.00 0.88 82.82 372.07 454.89
76 16 8. 80 0.91 84.13 371.42 455.55
77 170.60 0.95 85.44 370.77 456.21
78 172.40 0.99 86.75 370.12 456.87
79 174.20 1.03 88.07 369.46 457.53

58
APPENDIX A (continued)
Enthalpy (Btu/lb)
Temp. Temp. Press. Sat. Latent Heat Sat. Cent. Fahr. Atm. Liquid hfg Vapor
t T p hf h I g
80 176.00 1.07 89.39 368.80 458.19
81 177.80 1.11 90.72 368.13 458.86
82 179.60 1.15 92.06 367.46 459.52
83 181.40 1.20 93.40 366.79 460.19
84 183.20 1.25 94.7 5 366.11 460.85
85 185.00 1.29 96.10 365.42 461.52
86 186.80 1.34 97.46 364.7 3 462.19
87 188.60 1.40 98.82 364.04 462.85
88 190.40 1.45 100.18 363.34 463.52
89 192.20 1.50 101.56 362.63 464.19
90 194.00 1.56 102.94 361.92 464.85
91 195.80 1.62 104.32 361.20 465.52
92 197.60 1.68 105.71 360.48 466.18
93 199.40 1.74 107.10 359.75 466.85
94 201.20 1.80 108.50 359.01 467.51
95 203.00 1.87 109.91 358.27 468.18
96 204.80 1.93 111.32 357.52 468.24
97 206.60 2.00 112.73 356.77 469.50
98 208.40 2.07 114.15 356.01 470.16
99 210.20 2.15 115.58 355.24 470.82
100 212.00 2.22 117.01 354.46 471.47
101 213.80 2.30 118.45 353.68 472.13
102 215.60 2.38 119.89 352.89 472.78
103 217.40 2.46 121.34 352.10 473.43
104 219.20 2.55 122.79 351.2 9 474.08
105 221.00 2.63 124.25 350.48 474.73
106 222.80 2.72 125.71 349.66 475.37
107 224.60 2.81 127.18 348.83 476.01
108 226.40 2.91 128.65 348.00 476.65
59
APPENDIX A (continued)
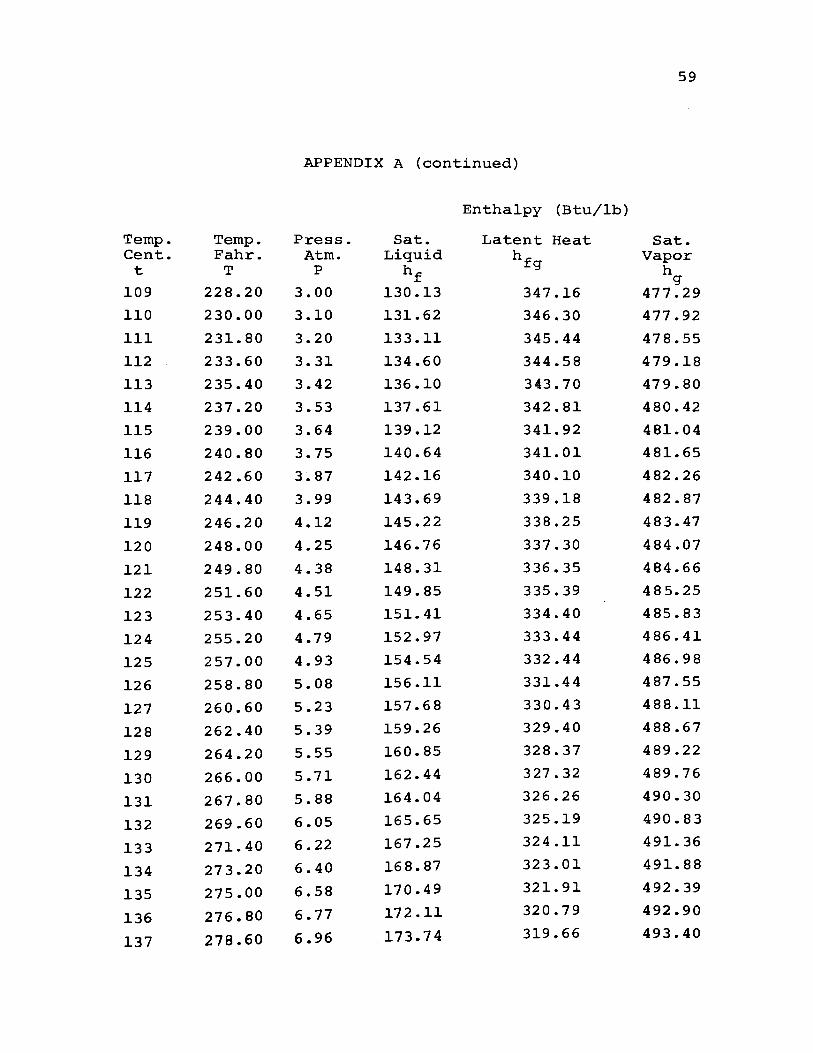
Enthalpy (Btu/lb)
Temp. Temp. Press. Sat. Latent Heat Sat. Cent. Fahr. Atm. Liquid hfg Vapor
t T p hf h g 109 228.20 3.00 130.13 347.16 477.29
110 230.00 3.10 131.62 346.30 477.92
111 231.80 3.20 133.11 345.44 478.55
112 233.60 3.31 134.60 344.58 479.18
113 235.40 3.42 136.10 343.70 479.80
114 237.20 3.53 137.61 342.81 480.42
115 239.00 3.64 139.12 341.92 481.04
116 240.80 3.75 140.64 341.01 481.65
117 242.60 3.87 142.16 340.10 482.26
118 244.40 3.99 143.69 339.18 482.87
119 246.20 4.12 145.22 338.25 483.47
120 248.00 4.25 146.76 337.30 484.07
121 249.80 4.38 148.31 336.35 484.66
122 251.60 4.51 149.85 335.39 485.25
123 253.40 4.65 151.41 334.40 485.83
124 255.20 4.79 152.97 333.44 486.41
125 257.00 4.93 154.54 332.44 486.98
126 258.80 5.08 156.11 331.44 487.55
127 260.60 5.23 157.68 330.43 488.11
128 262.40 5.39 159.26 329.40 488.67
129 264.20 5.55 160.85 328.37 489.22
130 266.00 5.71 162.44 327.32 489.76
131 267.80 5.88 164.04 326.26 490.30
132 269.60 6.05 165.65 325.19 490.83
133 271.40 6.22 167.25 324.11 491.36
134 273.20 6.40 168.87 323.01 491.88
135 275.00 6.58 170.49 321.91 492.39
136 276.80 6.77 172.11 320.79 492.90
137 278.60 6.96 173.7 4 319.66 493.40

60
APPENDIX A (continued)
Enthalpy (Btu/lb)
Temp. Temp. Press. Sat. Latent Heat Sat. Cent. Fahr. Atm. Liquid hfg Vapor
t T p hf h g 138 280.40 7.15 175.38 318.51 493.89
139 282.20 7.35 177.02 317.36 494.38
140 284.00 7.55 178.67 316.19 494.85
141 285.80 7.76 180.32 315.01 495.32
142 287.60 7.97 181.98 313.81 495.79
143 289.40 8.19 183.64 312.60 496.24
144 291.20 8.41 185.31 311.38 496.68
145 293.00 8.64 186.98 310.14 497.12
146 294.20 8.87 188.66 30 8. 89 497.55
147 296.60 9.11 190.35 307.62 497.97
148 298.40 9.35 192.04 306.34 498.38
149 300.20 9.59 193.7 3 305.05 498.78
150 302.00 9.84 195.43 303.74 499.17

APPENDIX B
EXPERIMENTAL RESULTS FOR THE HORIZONTAL
AND VERTICAL MODE OF OPERATION
AT VARIOUS CONCENTRATION
61

Run Number
1
2
3
4
5
6
7
8
9
10
11
12
13
14
15
16
Table B-1 Deduced Experimental Results, Horizontal Level, 50 Watts
External Surface Temperature of Heat Pipe Initial Pressure Cone. (Atm.) T °F T °F T °F T °F 1 2 3 4 T °F
5 T °F 6
T °F 7
T °F 8 T °F 9
0 1. 54 234 234 232 227 227 227 223 225 225
5.05 1. 92 240 240 240 236 234 233 231 231 231
10.00 1.82 251 250 249 244 241 238 235 235 234
15.20 1. 82 250 248 246 242 237 235 231 231 229
21.02 1.95 241 238 236 230 226 223 223 223 218
24.06 2.09 238 238 235 230 222 221 218 218 218
30.00 2.97 249 250 246 233 232 228 228 228 227
35.04 3.04 248 248 245 249 232 230 228 228 228
40.04 2.29 227 228 226 221 215 214 213 211 212
45.31 2.10 221 220 219 208 200 205 203 204 203 50.16 2.56 232 231 230 211 209 212 211 212 209
60.30 2.50 228 227 226 208 208 208 208 212 206
·70.10 3.72 246 248 244 231 226 228 228 228 204
80.62 3.86 245 248 245 232 226 228 227 229 229
91.00 3.38 234 235 234 221 223 227 228 228 228
100.00 3.45 235 235 235 228 228 224 224 224 224
0 TlO F
223
22 9
230 225
214
216
22 5
226
209
200
211
206
227
226
216
221

Table B-1
Ext. Surface Temperature
Run 0 0 0 0
Number Tll F Tl2 F Tl3 F Tl4 F
1 223 224 224 225 2 226 226 226 224
3 229 224 224 224
4 221 221 220 219
5 212 212 212 238
6 214 214 214 214
7 225 225 225 224
8 225 225 225 224
9 207 210 210 210
10 201 201 200 201
11 209 205 197 200
12 207 204 205 205
13 227 226 209 200
14 226 222 216 206
15 220 215 218 217
16 220 220 221 219
(continued)
Internal Vapor
T °F 1 T °F 2 T °F 3
227 227 227
237 237 237 247 246 244
248 245 245
238 234 234
235 234 233
244 244 243
243 243 242
222 223 222
217 217 217
225 225 225
219 219 222
240 240 241
237 238 238
226 226 227
220 220 220
Temperature of Heat Pipe
T °F 4 T °F 5 T °F
6 T °F 7 T °F 8
227 227 227 227 227
237 237 236 230 228 243 242 236 229 226
243 240 233 236 224
233 230 222 218 218
231 228 203 201 201
240 237 235 234 234
241 234 236 235 235
223 221 218 218 217
217 216 214 213 213
225 224 224 223 223
222 219 220 220 220
240 240 240 239 224
238 238 238 237 236
227 228 228 228 228
220 220 220 220 220 m w

Run Number
1
2
3
4
5
6
7
8
9
10
11
12
13
14
15
16
Table B-2 Deduced Experimental Results Horizontal Level, 75 Watts
Initial Pressure External Surface Temperature of Heat Pipe
Cone. (Atm.) T °F T °F T °F T °F T °F T °F T °F T °F T °F 1 2 3 4 5 6 7 8 9
0 3.86 288 287 286 281 279 280 277 277 277
5.05 4.06 295 293 294 288 284 284 280 283 282
10.00 5.08 306 305 304 297 295 294 290 290 290
15.20 3.73 290 289 288 279 276 276 273 269 267
21.02 4.20 286 285 282 275 269 266 262 262 262
24.06 4.74 292 291 289 281 272 270 266 266 265
30.00 7.25 307 305 298 294 286 286 281 281 281
35.04 6.58 298 297 291 287 280 279 275 275 276
40.04 5.08 276 278 274 267 261 259 258 259 258
45.31 5.15 277 275 273 253 253 253 250 252 219
50.16 5.56 281 278 276 257 254 254 252 254 224
60.30 9.10 307 310 302 282 280 283 279 282 280
70.10 8.25 298 302 294 281 275 277 277 278 280
80.62 8.00 289 290 286 275 269 269 270 272 272
91.00 8.00 285 283 283 283 268 268 269 269 267
100.00 9.06 298 298 291 277 276 276 277 275 273
0 TlO F
277
279
285
263
287
262
278
272
255
249
253
280
274
268
265
273

Table B-2 (continued)
Run Ext. Surface Temperature Internal Vapor Temperature of Heat Pipe
Number 0 0 0 0 T °F T °F T °F T °F T °F T °F T °F T °F Tll F Tl2 F Tl3 F Tl4 F 1 2 3 4 5 6 7 8
1 274 274 274 274 282 282 283 283 283 284 284 284 2 274 274 274 274 288 288 288 288 288 287 280 275
3 280 279 278 278 304 304 300 300 295 292 283 281 4 260 261 261 259 283 282 282 281 280 273 263 262 5 253 253 254 254 279 277 277 275 272 264 261 261 6 258 258 258 258 286 284 283 280 273 271 265 265 7 277 277 278 277 300 298 298 294 291 289 287 287 8 269 270 273 270 294 293 290 289 285 282 280 280 9 253 254 254 254 270 271 270 267 266 264 263 262
10 248 243 256 256 270 270 270 269 268 266 265 265 11 253 248 260 259 273 273 273 272 270 269 269 269 12 279 278 281 270 296 296 296 296 296 297 296 293 13 272 272 272 251 288 288 290 289 289 289 288 283 14 268 263 263 256 282 282 284 284 284 285 285 283
15 265 260 260 260 280 280 282 283 283 283 283 283 16 263 273 273 273 280 280 278 278 278 278 280 278

Run Number
1
2
3
4
5
6
7
8
9
10
11
12
13
Table B-3 Deduced Experimental Results Vertical Level, 50 Watts
External Surface Temperature of Heat Pipe Initial Pressure Cone. (Atm.} T °F 1 T °F 2
T °F 3 T °F
4 T °F
5 T °F
6 T °F
7 T °F
8 T °F 9
0 2.16 250 250 248 242 241 243 242 243 244
5.05 2.26 256 255 255 248 248 248 245 245 245
10.00 3.72 284 284 284 277 275 275 269 269 269
15.20 3.72 281 280 279 271 269 257 246 244 243
21.02 4.40 286 285 283 268 258 246 245 248 245
24.06 3.72 274 273 271 254 239 239 236 236 236
30.00 4.33 272 272 268 258 247 246 246 243 246
35.04 5.08 271 271 268 251 246 246 246 246 246
40.04 3.38 247 246 244 235 225 225 224 226 220
45.31 3.65 246 245 244 227 221 221 218 218 218
50.16 2.97 236 235 234 214 211 213 214 213 213
60.30 3.72 248 245 245 234 226 226 225 225 222
100.00 5.15 259 259 259 251 252 252 250 253 252
0 TlO F
244
244
266
239
243
236
244
246
224
215
212
223 250
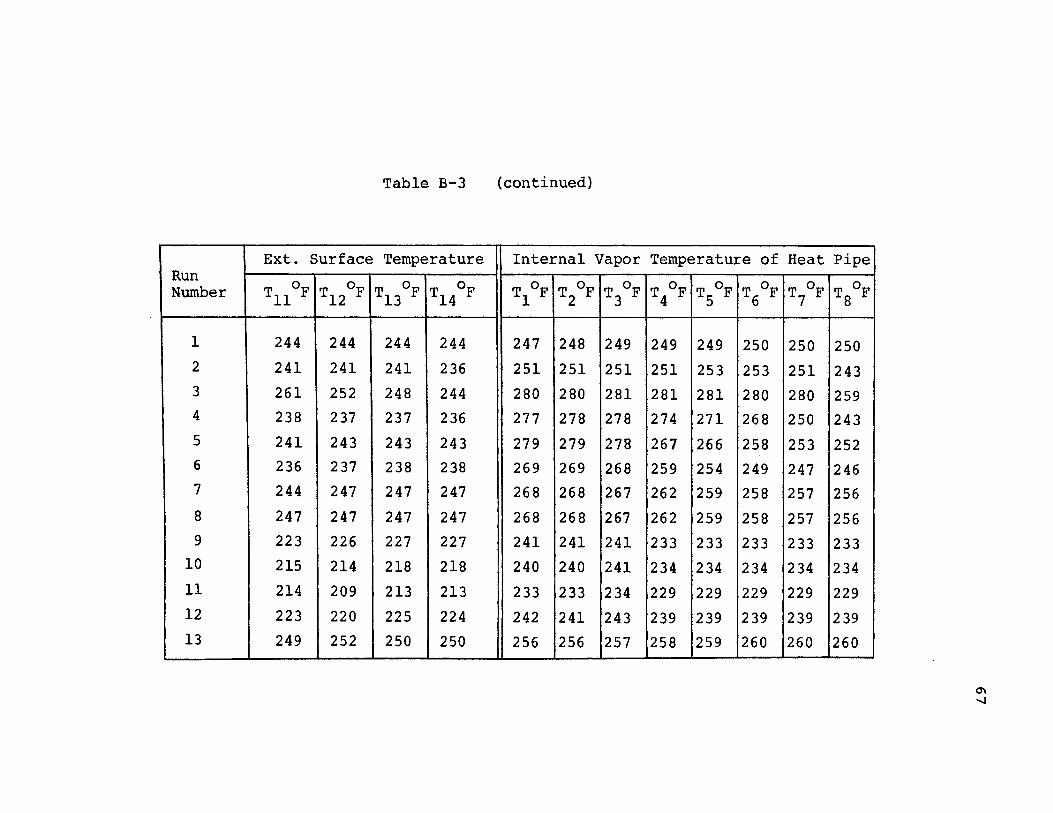
Table B-3 {continued)
Ext. Surface Temperature Internal Vapor Run
0 0 T °F T °F T °F Number 0 0 Tll F Tl2 F Tl3 F Tl4 F 1 2 3
1 244 244 244 244 247 248 249 2 241 241 241 236 251 251 251 3 261 252 248 244 280 280 281 4 238 237 237 236 277 278 278 5 241 243 243 243 279 279 278 6 236 237 238 238 269 269 268 7 244 247 247 247 268 268 267
8 247 247 247 247 268 268 267 9 223 226 227 227 241 241 241
10 215 214 218 218 240 240 241 11 214 209 213 213 233 233 234 12 223 220 225 224 242 241 243 13 249 252 250 250 256 256 257
Temperature of
T °F 4 T °F 5 T °F 6
249 249 250
251 253 253 281 281 280
274 271 268
267 266 258
259 254 249
262 259 258
262 259 258
233 233 233
234 234 234
229 229 229
239 239 239
258 259 260
Heat
T °F 7
250
251
280
250
253
247
257
257
233
234
229
239
260
Pipe
T °F 8
250
243
259
243
252
246
256
256
233
234
229
239
260
0\ ...J

Run Number
1
2
3
4
5
6
7
8
9
10
11
12
13
Table B-4 Deduced Experimental Results, Vertical Level, 75 Watts
Initial Pressure External Surface Temperature of Heat Pipe
Cone. (Atm.) T °F T °F T °F ~4oF ~ OF rr °F T °F T °F T °F 1 2 3 5 6 7 8 9
0 5.84 314 312 311 306 305 305 300 301 302
5.05 6.45 321 319 319 313 311 311 309 310 308
10.00 7.88 341 339 339 331 329 330 325 327 322 15.20 6.70 319 316 315 305 295 293 282 283 282
21.02 9.84 338 339 337 321 297 295 290 292 293 24.06 6.57 309 307 305 290 290 270 267 270 268
30.00 10.88 334 332 330 313 297 296 294 294 295
35.04 11.05 334 333 327 314 303 303 302 302 305
40.04 7.80 304 302 299 288 277 277 275 278 275
45.31 11.00 325 322 321 300 289 292 290 294 289
50.16 8.95 309 305 305 283 281 280 276 276 275
60.30 345 347 340 338 318 321 321 318 318
100.00 14.00 324 324 324 315 315 315 313 314 315
0 TlO F
302
308
320
278
291
265
294
303
272
292
273
317
312

Table B-4 (continued)
~xt. Surface Temperature Internal Vapor Temperature of Heat Pipe Run Number 0 0 0 0
T °F T °F T °F T °F T °F T °F T °F T °F Tll F Tl2 F Tl3 F Tl4 F 1 2 3 4 5 6 7 8
1 300 301 301 301 309 310 311 312 312 313 313 313 2 308 307 307 307 316 317 319 319 319 319 317 311 3 315 315 311 306 331 331 332 332 332 332 326 314 4 274 272 275 272 331 312 313 295 286 281 277 276 5 290 290 290 291 334 335 334 317 315 306 302 300 6 264 266 268 268 300 301 301 300 300 312 311 311 7 294 295 295 295 318 329 329 317 314 310 308 307 8 301 302 302 302 328 329 322 318 317 315 314 314 9 273 270 270 270 294 295 294 283 283 283 282 282
10 293 293 303 301 318 318 315 311 311 310 310 310 11 275 272 285 284 298 298 298 290 290 289 289 289 12 317 320 320 320 336 336 336 336 336 336 336 336 13 312 312 307 306 319 320 320 322 324 324 324 324

APPENDIX C
EXPERIMENTAL RESULTS FOR DIFFERENT
CONCENTRATIONS AND ANGLES OF
INCLINATION
70
Run Number
1
2
3
4
5
6
Run Number
1
2
3
4
5
6
Angle
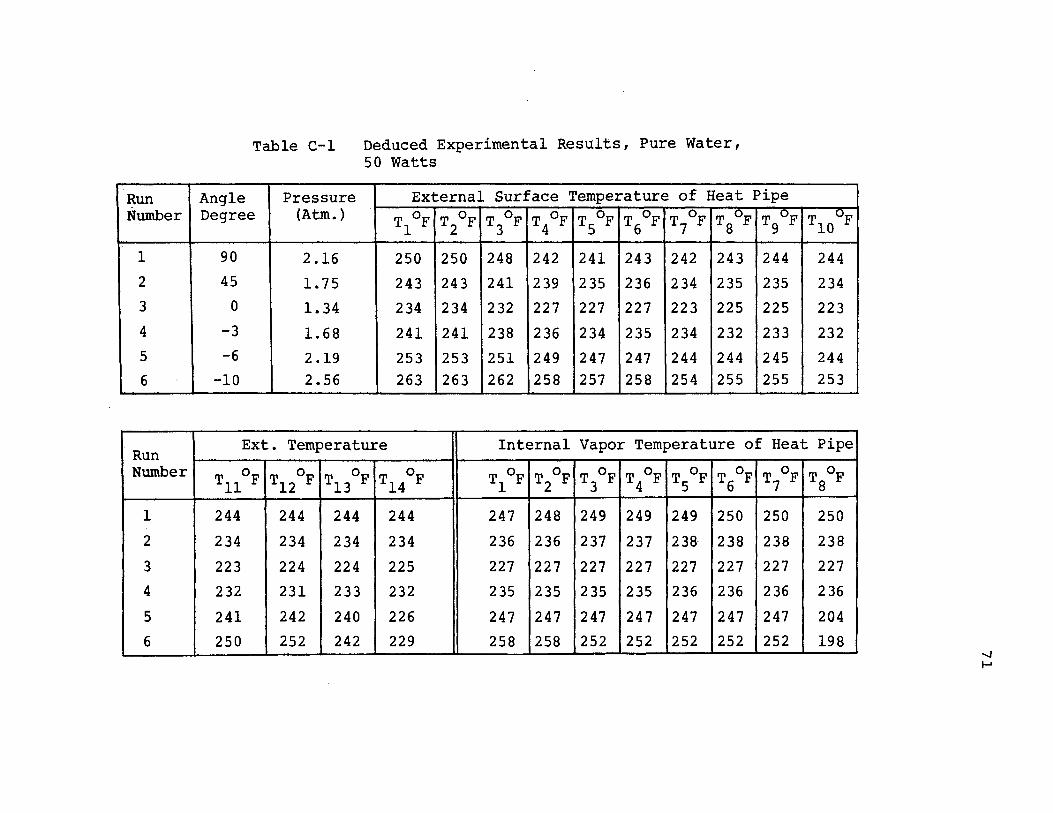
Table c-1 Deduced Experimental Results, Pure Water, 50 Watts
Pressure External Surface Temperature of Heat Pipe Degree (Atm.) T °F T °F T °F T °F T °F T °F T °F T °F T °F
1 2 3 4 5 6 7 8 9
90 2.16 250 250 248 242 241 243 242 243 244 45 1. 75 243 243 241 239 235 236 234 235 235
0 1.34 234 234 232 227 227 227 223 225 225 -3 1.68 241 241 238 236 234 235 234 232 233 -6 2.19 253 253 251 249 247 247 244 244 245
-10 2.56 263 263 262 258 257 258 254 255 255
TlOuF
244
234
223
232
244 253
Ext. Temperature Internal Vapor Temperature of Heat Pipe
0 0 0 0 T °F T °F T °F T °F T °F T °F T °F T °F Tl1 F Tl2 F Tl3 F Tl4 F 1 2 3 4 5 6 7 8
244 244 244 244 247 248 249 249 249 250 250 250
234 234 234 234 236 236 237 237 238- 238 238 238
223 224 224 225 227 227 227 227 227 227 227 227
232 231 233 232 235 235 235 235 236 236 236 236
241 242 240 226 247 247 247 247 247 247 247 204
250 252 242 229 258 258 252 252 252 252 252 198

Run Number
1
2
3
4
5
6
Run Number
1
2
3
4
5 6
Table C-2 Deduced Experimental Results, Pure Water, 75 Watts
Angle Pressure External Surface Temperature of Heat Pipe
Degree {Atm.) T °F T2~ T °F T °F ~ OF ~ OF T °F tr', OF IT °F 0
"1 3 4 5 6 7 8 9 TlO F
90 5.84 314 312 311 306 305 305 300 301 302 302
45 4.40 297 296 294 290 288 288 285 286 286 286
0 3.86 288 287 286 281 279 280 277 277 277 277
-3 4.47 299 298 295 291 289 291 286 287 288 286
-6 5.35 310 307 306 302 301 300 296 296 300 296
-10 6.90 326 325 323 319 316 319 312 315 313 313
Ext. Temperature Internal Vapor Temperature of Heat Pipe
0 0 0 0 T °F T °F T °F T °F rr' °F IT °F T °F T °F Tll F Tl2 F Tl3 F Tl4 F 1 2 3 4 5 6 7 8
300 301 301 301 309 310 311 312 312 313 313 313
282 285 285 285 290 292 292 293 293 293 293 293
274 274 274 274 282 282 283 283 283 284 284 284
282 285 286 286 292 292 293 293 293 293 293 290
293 293 287 282 303 304 305 305 305 306 306 263
309 308 304 290 322 322 322 322 322 322 317 269

Run Number
1
2
3 4
5
6
Run Number
1
2
3
4
5
6
Angle
Table C-3 Deduced Experimental Results, 5.05 Percent Ethanol Concentration, 50 Watts
Pressure External Surface Temperature of Heat Pipe
Degree (Atm.) T °F T °F T °F T °F T °F T °F T °F T °F T °F 1 2 3 4 5 6 7 ·s "9
90 2.26 256 255 255 248 248 248 245 245 245 45 1.92 248 246 245 241 239 239 237 238 238
0 1.92 240 240 240 236 234 233 231 231 231
-3 1.95 246 246 245 241 238 238 235 236 237
-6 2.19 253 253 252 248 246 246 243 245 245
-10 2.70 266 266 265 262 259 259 257 257 257
0 TlO F
244
236
229
235
243
257
Ext. Temperature Internal Vapor Temperature of Heat Pipe
0 0 0 0 T °F IT °F IT °F T °F ~ OF ~ OF T °F T °F Tll F Tl2 F Tl3 F Tl4 F 1 2 3 4 5 6 7 8
241 241 241 236 251 251 251 251 253 253 251 243 230 230 230 229 242 242 242 242 243 240 229 230 226 226 226 224 237 237 237 237 237 236 230 228 233 232 232 230 240 241 242 242 242 242 234 231 239 239 238 228 248 248 249 249 249 249 245 221 255 255 250 234 261 262 262 262 263 263 260 220

Run Number
1
2
3
4
5
6
Run Number
1
2
3
4
5
6
Angle
Table C-4 Deduced Experimental Results, 5.05 Percent Ethanal Concentration, 75 Watts
Pressure External Surface Temperature of Heat Pipe
Degree (Atm.) T °F 1 fr °F 2 T °F 3 ~ OF 4 T °F 5 T °F 6 T °F 7 T °F 8 T9oF
90 6.45 321 319 319 313 311 311 309 310 308
45 4.75 300 299 298 291 289 289 286 287 287
0 4.06 295 293 294 288 284 284 280 283 282
-3 4.20 297 294 294 288 285 286 283 284 284
-6 5.00 302 301 301 298 296 297 296 296 246
-10 6.45 322 322 321 317 313 313 312 313 313
rr'looF
308
284
279
280
293
312
Ext. Temperature Internal Vapor Temperature of Heat Pipe 0 0 Tl3~ 0 T °F T-. °F T °F T °F T
1 °F T, °F T. °F T, °F Tll F Tl2 F Tl4 F 1 2 3 4 5 6 7 8
308 307 307 307 316 317 319 319 319 319 317 311
278 278 278 272 295 296 294 292 291 287 281 283
274 274 274 274 288 288 288 288 288 287 280 275
278 278 278 276 289 290 291 291 291 291 284 277
292 292 289 278 301 302 302 303 303 303 299 268
307 308 306 289 323 323 322 318 313 314 308 312

Run Number
1
2
3
4
5
6
Run Number
1
2
3
4
5 6
Angle
Table C-5 Deduced Experimental Results, 10.00 Percent Ethanol Concentration, 50 Watts
Pressure External Surface Temperature of Heat Pipe
Degree (Atm.) T °F 1 T °F 2
T °F 3
T °F 4 ~OF
5 rr °F 6 T °F 7
T °F 8
T °F 9
90 3.72 284 284 284 277 275 275 269 269 269
45 2.26 253 252 251 243 238 234 230 230 227
0 1. 82 251 250 249 244 241 238 235 235 234
-3 2.09 254 254 253 244 242 242 239 241 242
-6 2.36 257 256 256 254 251 251 248 251 250
-10 2.87 269 269 269 266 263 263 263 262 263
TlOoF
266
223
230
239
247
261
Ext. Temperature Internal Vapor Temperature of Heat Pipe
0 0 0 0 T °F T °F T °F T °F T °F T °F T °F T °F Tll F Tl2 F Tl3 F Tl4 F 1 2 3 4 5 6 7 8
261 252 248 240 280 280 281 281 281 280 280 259
217 217 219 217 248 248 248 242 241 227 223 222
229 224 224 224 247 246 244 243 242 236 229 226
234 233 228 218 253 253 250 250 250 248 238 217
244 242 216 202 254 254 254 255 255 255 244 196
258 243 224 202 265 266 267 267 267 267 262 197 ...J U1

Run Number
1
2
3
4
5 6
Run Number
1
2
3
4
5
6
Angle
Table C-6 Deduced Experimental Results, 10.00 Percent Ethanol Concentration, 75 Watts
Pressure External Surface Temperature of Heat Pipe
Degree (Atm.} T °F T °F T °F T °F T °F T °F T °F T °F T °F 1 2 3 4 5 6 7 8 9
90 7.88 341 339 339 331 329 330 325 327 322
45 5.70 309 309 307 297 289 290 285 287 284
0 5.08 306 305 304 297 245 294 290 290 240
-3 5.22 310 310 304 299 297 297 296 295 294
-6 5.97 315 315 315 310 307 307 306 306 307
-10 7.47 331 331 331 325 321 321 320 321 320
0 TlO F
320
283
285
291
303
318
Ext. Temperature Internal Vapor Temperature of Heat Pipe
0 0 0 0 T °F T °F T °F T °F T °F T °F T °F T °F Tll F Tl2 F Tl3 F Tl4 F 1 2 3 4 5 6 7 8
315 315 311 306 331 331 332 332 332 332 326 214
277 277 277 278 303 303 299 297 293 286 286 284
280 279 278 278 304 304 300 300 295 292 283 281
285 283 280 267 300 300 301 301 301 299 287 268
299 297 287 266 311 311 312 312 313 313 301 262
315 313 304 272 326 326 326 326 320 320 312 255

Run Number
1
2
3
4
5
6
Run Number
1
2
3
4
5
6
Table C-7 Deduced Experimental Results, 15.20 Percent Ethanol Concentration, 50 Watts
Angle Pressure External Surface Temperature of Heat P1pe
Degree (Atm.) T °F 1 ir. °F 2 T °F 3
T °F 4 T °F 5 T °F 6
T °F 7 ~ OF
8 T °F 9
90 3.72 281 280 279 271 262 257 246 244 243
45 2.50 257 257 255 243 229 225 222 222 221
0 1. 82 250 248 246 242 237 235 231 231 229
-3 2.25 254 254 253 248 246 245 242 243 243
-6 2.36 258 258 258 250 248 249 246 247 247
-10 2.98 272 272 271 267 265 265 264 264 264
Ext. Temperature Internal Vapor Temperature of Heat
0 0 0 0 T °F T °F T °F T °F T °F T °F T °F Tll F Tl2 F Tl3 F Tl4 F 1 2 3 4 5 6 7
238 237 237 236 277 278 278 274 271 268 250
215 218 200 219 253 252 248 239 238 228 223
221 221 220 219 248 245 245 243 240 233 226
231 231 228 225 249 249 250 250 250 246 230
236 235 230 221 253 253 254 254 254 254 238
258 253 244 228 268 268 268 269 269 269 257
0 TlO F
239
218
225
237
245
263
Pipe
T °F 8
243
223
224
226
208
203
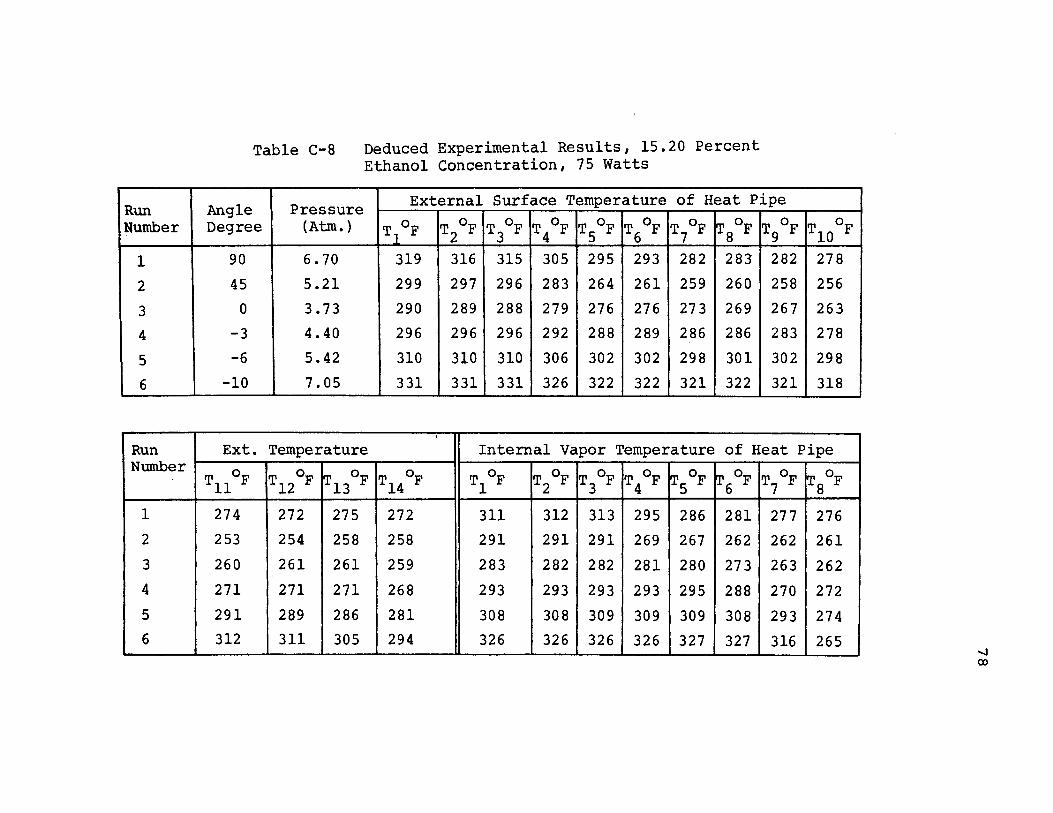
Run Number
1
2
3
4
5
6
Run Number
1
2
3
4
5
6
Angle
Table C-8 Deduced Experimental Results, 15.20 Percent Ethanol Concentration, 75 Watts
Pressure External Surface Temperature of Heat Pipe
Degree (Atm.) T °F T °F 1 2 T °F 3 T °F 4 T °F 5 T °F 6 T °F 7 T, °F 8 T °F 9
90 6.70 319 316 315 305 295 293 282 283 282
45 5.21 299 297 296 283 264 261 259 260 258
0 3.73 290 289 288 279 276 276 27 3 269 267
-3 4.40 296 296 296 292 288 289 286 286 283
-6 5.42 310 310 310 306 302 302 298 301 302
-10 7.05 331 331 331 326 322 322 321 322 321
'
0 TlO F
278
256
263
278
298
318
Ext. Temperature Internal Vapor Temperature of Heat Pipe 0 0 0 0 T °F T °F T °F T °F rr'~ OF T °F T °F T °F Tll F Tl2 F Tl3 F Tl4 F 1 2 3 4 5 6 7 8
274 272 275 272 311 312 313 295 286 281 27 7 276 253 254 258 258 291 291 291 269 267 262 262 261
260 261 261 259 283 282 282 281 280 27 3 263 262
271 271 271 268 293 293 293 293 295 288 270 272
291 289 286 281 308 308 309 309 309 308 293 274 312 311 305 294 326 326 326 326 327 327 316 265
-...]
00
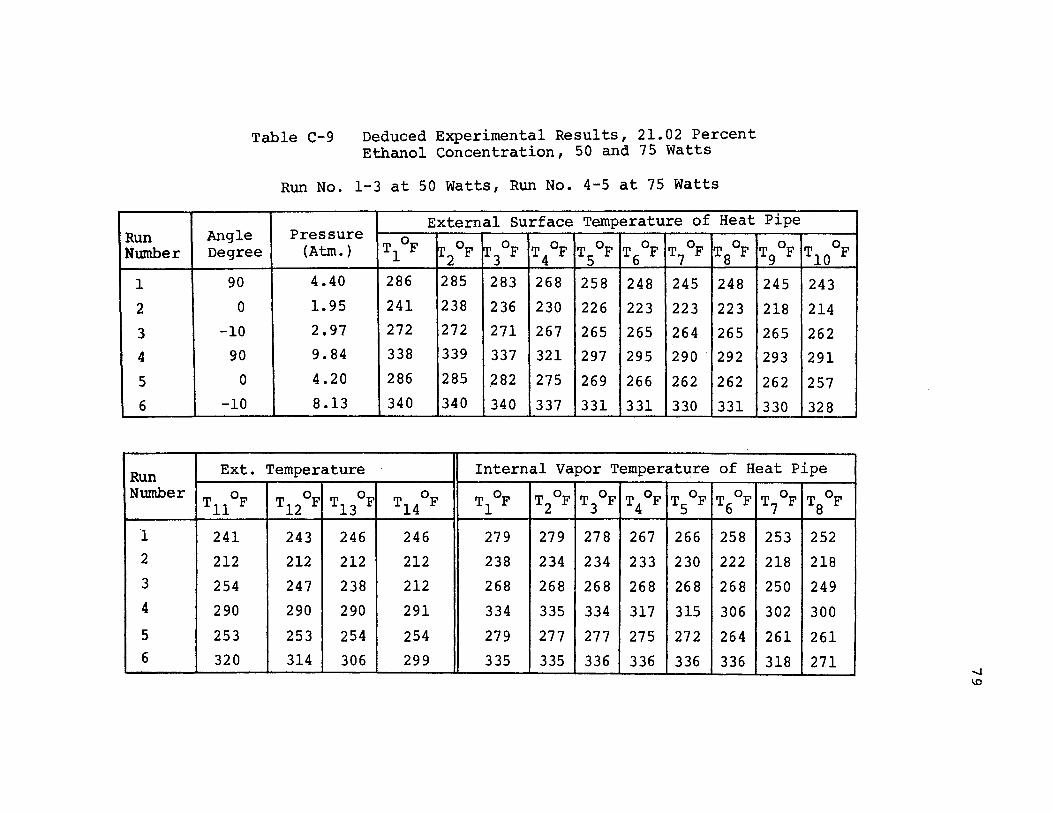
Run Number
1
2
3
4
5
6
Run Number
1 2
3
4
5 6
Table C-9 Deduced Experimental Results, 21.02 Percent Ethanol Concentration, 50 and 75 Watts
Run No. 1-3 at 50 Watts, Run No. 4-5 at 75 Watts
External Surface Temperature of Heat Pipe Angle Pressure
T °F T °F Degree (Atm.) ~ OF 'r OF T °F T °F T °F T °F T °F 1 2 3 4 5 6 7 8 9 90 4.40 286 285 283 268 258 248 245 248 245
0 1.95 241 238 236 230 226 223 223 223 218 -10 2.97 272 272 271 267 265 265 264 265 265
90 9.84 338 339 337 321 297 295 290 292 293 0 4.20 286 285 .282 275 269 266 262 262 262
-10 8.13 340 340 340 337 331 331 330 331 330
0 TlO F
243
214
262
291
257
328
Ext. Temperature Internal Vapor Temperature of Heat Pipe
0 0 0 0 T °F T °F T °F T °F T °F T °F T °F T °F Tll F Tl2 F Tl3 F Tl4 F 1 2 3 4 5 6 7 8
241 243 246 246 279 279 278 267 266 258 253 252
212 212 212 212 238 234 234 233 230 222 218 218
254 247 238 212 268 268 268 268 268 268 250 249
290 290 290 291 334 335 334 317 315 306 302 300 253 253 254 254 279 277 277 275 272 264 261 261 320 314 306 299 335 335 336 336 336 336 318 271

Run Number
1
2
3
4
5
6
Run NUll\ber
1
2
3
4
5
6
Angle
Table C-10 Deduced Experimental Results, 24.06 Percent Ethanol Concentration, 50 and 75 Watts
Run No. 1-3 at 50 Watts, Run No. 4-6 at 75 Watts
Pressure External Surface Temperature of Heat PJ.pe
Degree (Atm.) T °F 1
T °F 2 T °F 3 T °F 4 T °F 5 T °F
6 T °F 7 ITa oF T °F 9
90 3.72 274 273 271 254 239 239 236 236 236
0 2.09 238 238 235 230 222 221 218 218 218
-10 3.18 275 275 275 272 268 268 268 267 267
90 6.57 309 307 305 290 290 270 267 270 268
0 4.74 292 291 289 281 272 270 266 266 265
-10 8.50 340 340 339 335 330 330 326 326 328
0 TlO F
236
216
265
265
262
325
Ext. Temperature Internal Vapor Temperature of Heat Pipe
0 0 T 13 Cl_r
0 T °F T °F IT °F IT °F tr5oF ~. OF T °F tr °F Tll F Tl2 F Tl4 F 1 2 3 4 6 7 8
236 237 238 238 269 269 268 259 254 249 247 246
214 214 214 214 435 234 233 231 228 203 201 201
253 244 237 227 270 271 271 272 272 212 249 205
264 266 268 268 300 301 301 300 300 312 311 311
258 258 258 258 286 234 283 280 273 271 265 265
318 312 303 294 332 222 334 330 335 335 316 263 (X)
0

Run Number
1
2
3
4
5
6
Run Number
1
2
3
4
5 6
Angle
Table C-11 Deduced Experimental Results, 40.04 Percent Ethanol Concentration, 50 and 75 Watts
Run No. 103 at 50 Watts, Run No. 4-6 at 75 Watts
External Surface Temperature of Heat Pipe Pressure
Degree (Atm.) T °F 1 T °F 2
T °F 3 IT °F 4
~ OF 5
~ OF 6
T °F 7 rr °F 8 ~ OF
9
90 3.38 247 246 244 235 225 225 224 226 226
0 2.29 227 228 226 221 215 214 213 211 212
-10 3.38 274 275 274 272 268 269 265 267 263
90 7.80 304 302 299 288 277 277 275 278 275
0 5.08 276 278 274 267 261 259 258 259 258
-10 8.55 343 344 343 339 334 336 332 333 332
~lOoF
224
209
250
272
255
323
Ext. Temperature Internal Vapor Temperature of Heat Pipe
0 0 0 0 T °F T °F T °F T °F T °F T °F T °F T °F Tll F Tl2 F Tl3 F Tl4 F 1 2 3 4 5 6 7 8
223 226 227 227 241 241 241 233 233 233 233 233
207 210 210 210 222 223 222 223 221 218 218 217
233 228 226 219 273 273 274 274 275 264 237 196
273 270 270 270 294 295 294 283 283 283 282 282
253 254 254 254 270 271 270 267 266 264 263 262
301 300 202 286 330 338 341 341 342 332 301 247 00 I-'

Run Number
1
2
3
4
5
6
Run ·Number
1
2
3
4
5
6
Angle
Table C-12 Deduced Experimental Results, Pure Ethanol, 50 Watts
Pressure External Surface Temperature of Heat Pipe
Degree (Atm.) T °F 1 tr2oF T °F 3 . T °F 4 T °F
5 T °F 6
T °F 7 T °F 8
T °F 9
90 5.15 259 259 259 251 252 252 250 253 252
45 4.20 247 246 246 239 239 239 235 235 238
0 3.45 235 235 235 228 228 224 224 224 224
-3 3.72 241 240 239 233 232 232 227 227 226
-6 4.40 267 253 248 243 241 241 235 235 236
-10 2.09 332 332 302 236 200 198 198 197 197
0 TlO F
250
237
221
225
235
192
Ext. Temperature Internal Vapor Temperature of Heat Pipe
T °F T °F 0 0 0 0 T °F T °F T °F 0 T °F T °F Tll F Tl2 F Tl3 F Tl4 F 1 2 3 4 5 T6 F 7 8
249 252 250 250 256 256 257 258 259 260 260 260
236 237 237 237 241 242 243 243 243 244 244 244
220 220 221 219 220 220 220 220 220 220 220 220
225 225 224 223 234 234 235 235 234 235 235 231
235 230 226 224 258 250 249 248 248 248 247 204
186 185 179 175 322 287 241 220 212 206 202 201

Run Number
1
2
3
4
5
6
Run Number
1
2
3
4
5
6
Table C-13 Deduced Experimental Results, Pure Ethanol, 75 Watts
External Surface Temperature of Heat Pipe Angle Pressure Degree (Atm.) T °F T °F T °F T °F T °F T °F T °F T °F T °F
1 2 3 4 5 6 7 8 9
90 14.00 324 324 324 315 315 316 313 314 315
45 8.50 302 303 297 292 290 286 285 283 283
0 8.06 298 298 291 277 276 276 277 275 273
-3 9.57 310 299 296 291 290 290 280 281 282
-6 7.25 381 387 330 291 271 270 261 264 264
-10 - - - - - - - - - - - - - - - - - - - -
0 TlO F
312
283
273
282
263
- -
Ext. Temperature Internal Vapor Temperature of Heat Pipe
0 0 0 0 T °F T °F T °F T °F T °F T °F T °F T °F Tll F Tl2 F Tl3 F Tl4 F 1 2 3 4 5 6 7 8
312 312 307 306 319 320 320 322 324 324 324 324
278 278 278 275 294 294 294 295 295 295 295 295
273 273 273 273 280 280 278 278 278 278 280 278
277 277 277 276 296 295 295 295 295 295 295 286
258 257 256 255 360 314 289 282 278 27 4 272 222
- - - - - - - - - - - - - - - - - - - - - - - -(X)
w