Twitter Trending Topic Classification -...
8
Twitter Trending Topic Classification Kathy Lee, Diana Palsetia, Ramanathan Narayanan, Md. Mostofa Ali Patwary, Ankit Agrawal, and Alok Choudhary Department of Electrical Engineering and Computer Science Northwestern University, Evanston, IL 60208 USA Email: {kml649, drp925, ran310, mpatwary, ankitag, choudhar}@eecs.northwestern.edu Abstract—With the increasing popularity of microblogging sites, we are in the era of information explosion. As of June 2011, about 200 million tweets are being generated every day. Although Twitter provides a list of most popular topics people tweet about known as Trending Topics in real time, it is often hard to understand what these trending topics are about. Therefore, it is important and necessary to classify these topics into general categories with high accuracy for better information retrieval. To address this problem, we classify Twitter Trending Topics into 18 general categories such as sports, politics, technology, etc. We experiment with 2 approaches for topic classification; (i) the well-known Bag-of-Words approach for text classification and (ii) network-based classification. In text-based classification method, we construct word vectors with trending topic defi- nition and tweets, and the commonly used tf-idf weights are used to classify the topics using a Naive Bayes Multinomial classifier. In network-based classification method, we identify top 5 similar topics for a given topic based on the number of common influential users. The categories of the similar topics and the number of common influential users between the given topic and its similar topics are used to classify the given topic using a C5.0 decision tree learner. Experiments on a database of randomly selected 768 trending topics (over 18 classes) show that classification accuracy of up to 65% and 70% can be achieved using text-based and network-based classification modeling respectively. Keywords-Social Networks, Twitter, Topic Classification I. I NTRODUCTION Twitter 1 is an extremely popular microblogging site, where users search for timely and social information such as breaking news, posts about celebrities, and trending topics. Users post short text messages called tweets, which are limited by 140 characters in length and can be viewed by user’s followers. Anyone who chooses to have other’s tweets posted on one’s timeline is called a follower. Twit- ter has been used as a medium for real-time information dissemination and it has been used in various brand cam- paigns, elections, and as a news media. Since its launch in 2006, the popularity of its use has been dramatically increasing. As of June 2011, about 200 million tweets are being generated every day [1]. When a new topic becomes popular on Twitter, it is listed as a trending topic, which may take the form of short phrases (e.g., Michael Jackson) 1 http://www.twitter.com or hashtags (e.g., #election). What the Trend 2 provides a regularly updated list of trending topics from Twitter. It is very interesting to know what topics are trending and what people in other parts of the world are interested in. However, a very high percentage of trending topics are hashtags, a name of an individual, or words in other languages and it is often difficult to understand what the trending topics are about. It is therefore important to classify these topics into general categories for easier understanding of topics and better information retrieval. Figure 1. Tweets related to Trending Topic Boone Logan. The trending topic names may or may not be indicative of the kind of information people are tweeting about unless one reads the trend text associated with it. For example, #hap- pyvalentinesday indicates that people are tweeting about Valentines Day. A trend named Boone Logan is indicative that tweets are about person named Boone Logan. Anyone who does not follow American Major League Baseball 2 http://www.whatthetrend.com 2011 11th IEEE International Conference on Data Mining Workshops 978-0-7695-4409-0/11 $26.00 © 2011 IEEE DOI 10.1109/ICDMW.2011.171 251
Transcript of Twitter Trending Topic Classification -...
Twitter Trending Topic Classification
Kathy Lee, Diana Palsetia, Ramanathan Narayanan, Md. Mostofa Ali Patwary, Ankit Agrawal, and Alok Choudhary
Department of Electrical Engineering and Computer ScienceNorthwestern University, Evanston, IL 60208 USA
Email: {kml649, drp925, ran310, mpatwary, ankitag, choudhar}@eecs.northwestern.edu
Abstract—With the increasing popularity of microbloggingsites, we are in the era of information explosion. As of June2011, about 200 million tweets are being generated everyday. Although Twitter provides a list of most popular topicspeople tweet about known as Trending Topics in real time,it is often hard to understand what these trending topics areabout. Therefore, it is important and necessary to classify thesetopics into general categories with high accuracy for betterinformation retrieval.
To address this problem, we classify Twitter Trending Topicsinto 18 general categories such as sports, politics, technology,etc. We experiment with 2 approaches for topic classification;(i) the well-known Bag-of-Words approach for text classificationand (ii) network-based classification. In text-based classificationmethod, we construct word vectors with trending topic defi-nition and tweets, and the commonly used tf-idf weights areused to classify the topics using a Naive Bayes Multinomialclassifier. In network-based classification method, we identifytop 5 similar topics for a given topic based on the number ofcommon influential users. The categories of the similar topicsand the number of common influential users between the giventopic and its similar topics are used to classify the given topicusing a C5.0 decision tree learner. Experiments on a databaseof randomly selected 768 trending topics (over 18 classes)show that classification accuracy of up to 65% and 70% canbe achieved using text-based and network-based classificationmodeling respectively.
Keywords-Social Networks, Twitter, Topic Classification
I. INTRODUCTION
Twitter1 is an extremely popular microblogging site,
where users search for timely and social information such as
breaking news, posts about celebrities, and trending topics.
Users post short text messages called tweets, which are
limited by 140 characters in length and can be viewed
by user’s followers. Anyone who chooses to have other’s
tweets posted on one’s timeline is called a follower. Twit-
ter has been used as a medium for real-time information
dissemination and it has been used in various brand cam-
paigns, elections, and as a news media. Since its launch
in 2006, the popularity of its use has been dramatically
increasing. As of June 2011, about 200 million tweets are
being generated every day [1]. When a new topic becomes
popular on Twitter, it is listed as a trending topic, which
may take the form of short phrases (e.g., Michael Jackson)
1http://www.twitter.com
or hashtags (e.g., #election). What the Trend2 provides a
regularly updated list of trending topics from Twitter. It is
very interesting to know what topics are trending and what
people in other parts of the world are interested in. However,
a very high percentage of trending topics are hashtags, a
name of an individual, or words in other languages and
it is often difficult to understand what the trending topics
are about. It is therefore important to classify these topics
into general categories for easier understanding of topics and
better information retrieval.
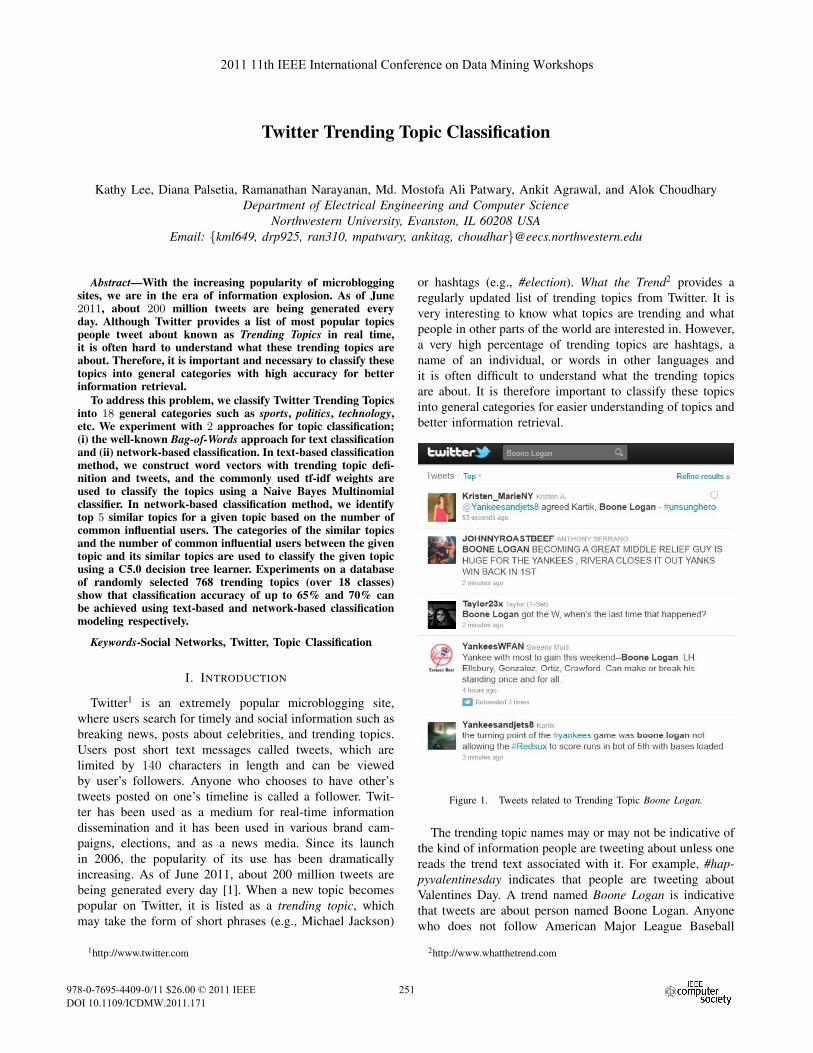
Figure 1. Tweets related to Trending Topic Boone Logan.
The trending topic names may or may not be indicative of
the kind of information people are tweeting about unless one
reads the trend text associated with it. For example, #hap-pyvalentinesday indicates that people are tweeting about
Valentines Day. A trend named Boone Logan is indicative
that tweets are about person named Boone Logan. Anyone
who does not follow American Major League Baseball
2http://www.whatthetrend.com
2011 11th IEEE International Conference on Data Mining Workshops
978-0-7695-4409-0/11 $26.00 © 2011 IEEE
DOI 10.1109/ICDMW.2011.171
251

(MLB), however, will not know that the information is
regarding Boone Logan, who is a pitcher for the New York
Yankees unless a few tweets are read from this trending
topic as shown in Figure 1. We find that trend names are not
indicative of the information being transmitted or discussed
either due to obfuscated names or due to regional or domain
contexts. To address this problem, we defined 18 general
classes: arts & design, books, business, charity & deals,
fashion, food & drink, health, holidays & dates, humor,
music, politics, religion, science, sports, technology, tv &movies, other news, and other. Our goal is to aid users
searching for information on Twitter to look at only smaller
subset of trending topics by classifying topics into general
classes (e.g., sports, politics, books) for easier retrieval of
information. To classify trending topics into these prede-
fined classes, we propose two approaches: the well-known
Bag-of-Words text classification, and using social network
information.
In this paper, we use supervised learning techniques to
classify the twitter trending topics. First, we employ a well-
known text classification technique called Naive Bayes (NB)
[2]. A document in NB would model as the presence and
absence of particular words. A variation of NB is Naive
Bayes Multinomial (NBM), which considers the frequency
of words and can be denoted as:
P (c|d) ∝ P (c)∏
1≤k≤nd
P (tk|c), (1)
where P (c|d) is the probability of a document d being in
class c, P (c) is the prior probability of a document occurring
in class c, and P (tk|c) is the conditional probability of term
tk occurring in a document of class c. A document d in our
case is trend definition or tweets related to each trending
topic.
Apart from text-based classification, we also incorporate
twitter social network information for topic classification.
For the latter we make use of topic-specific influential
users [3], which are identified using twitter friend-follower
network. The influence rank is calculated per topic using a
variant of the Weighted Page Rank algorithm [4]. In general,
a tweeter is said to have high influence if the sum of the
influence of those following him/her is high. The key idea
of the proposed network-based approach is to predict the
category of a topic knowing the categories of its similar top-
ics. Similar topics are identified using user-similarity metric,
which is the cardinality of the intersection of influential users
between two topics ti and tj divided by the cardinality of
top s influencers of topic ti [3]. We experimented using
different classifiers, for example, C5.0 (an improved version
of C4.5) [5], k-Nearest Neighbor (kNN) [6], Support Vector
Machine (SVM) [7], Logistic Regression [8], and ZeroR (the
baseline classifier), and found that C5.0 classifier resulted in
the best accuracy on our data set. Experimental results show
that both our approaches effectively classify trending topics
with high accuracy, given that it is a 18-class classification
problem.
The remainder of this paper is organized as follows.
Section II describes some of the related works. Section
III presents details of the data and the proposed twitter
trending topic classification system. Section IV describes
experimental results. Finally, the conclusion and some future
directions are presented in Section V.
II. RELATED WORKS
A number of recent papers have addressed the classifica-
tion of tweets.
Sriram et al. [9] classified tweets to a predefined set of
generic classes such as news, events, opinions, deals, and
private messages based on author information and domain-
specific features extracted from tweets such as presence of
shortening of words and slangs, time-event phrases, opin-
ionated words, emphasis on words, currency and percentage
signs, “@username” at the beginning of the tweet, and
“@username” within the tweet. Genc et al. [10] introduced a
wikipedia-based classification technique. The authors clas-
sified tweets by mapping message into their most similar
Wikipedia pages and calculating semantic distances between
messages based on the distances between their closest
wikipedia pages. Kinsella et al. [11] included metadata
from external hyperlinks for topic classification on a social
media dataset. Whereas all these previous works use the
characteristics of tweet texts or meta-information from other
information sources, our network-based classifier uses topic-
specific social network information to find similar topics,
and uses categories of similar topics to categorize the target
topic.
Sankaranarayanan et al. [12] have built a news processing
system that identifies the tweets corresponding to late break-
ing news. Issues addressed in their work include removing
the noise, determining tweet cluster of interest using online
methods, and identifying relevant locations associated with
the tweets. Yerva et al. [13] classify tweet messages to
identify whether they are related to a company or not using
company profiles that are generated semi-automatically from
external web sources. Whereas all these previous works
classify tweets or short text messages into 2 classes, our
work classify tweets into 18 general classes such as sports,
technology, politics, etc.
Becker et al. [14] explored approaches for distinguishing
tweet messages between messages about real-world events
and non-event messages. The authors used an online clus-
tering technique to group topically similar tweets together,
and computed features that can be used to train a classifier
to distinguish between event and non-event clusters.
There has been a lot of research in sentiment classifi-
cation of short text messages. Go et al. [15] introduced a
approach for automatically classifying sentiment of tweets
with emoticons using distant supervised learning. Pang et
252

������
������������� ����������������������
������������
�
��������������
�
���������
��������������
�����������
��������������
��������
��������������
�����������������������
��
������������������
������������
���������������
��������������
��!�����������"�����!�
���������
��!�����!�#�
��������
�"��������
������!�������!�
"�����
"����
$��%������
�����%����!�
�&�'� �&����
�������
��%��������
��!����
����������������
(���)������
��
�������
�
������� ������������� ���%���� �������
Figure 2. System Architecture. The proposed classification system consists of four stages: (1) Data Collection stage - trending topic, topic definition andtweets are downloaded to compose a document; (2) Labeling stage - over 3000 topics are manually labeled into 18 general classes; (3) Data Modeling stage- (i) Text-based Modeling stage - documents are run through a string-to-word vector kernel and converted to tokens with tf-idf weights (ii) Network-basedModeling stage - for each trending topic, 5 most similar topics are computed; (4) Machine Learning stage - various classification schemes are appliedusing 10-fold cross validation to find the best classifier.
al. [16] classified movie reviews determining whether a
review is positive or negative. But none of these classify
twitter trending topics.
III. DATA AND METHODS
As shown in Figure 2, the proposed classification system
consists of four stages: Data Collection, Labeling, Data
Modeling, and Machine Learning. In our experiments, we
use two data modeling methods: (1) Text-based data mod-
eling; and (2) Network-based data modeling.
A. Data Collection
The website What the Trend provides a regularly updated
list of ten most popular topics called “trending topics” from
Twitter. A trending topic may be a breaking news story or
it may be about a recently aired TV show. The website
also allows thousands of users across the world to define,
in a few short sentences, why this term is interesting or
important to people, which we refer to as “trend definition”
in the paper. The Twitter API3 allows high-throughput near
real-time access to various subsets of public Twitter data.
We downloaded trending topics and definitions every 30
minutes from What the Trend and all tweets that contain
trending topics from Twitter while the topic is trending.
All the tweets containing a trending topic constitutes a
document. For example, while the topic “superbowl” is
trending, we keep downloading all tweets that contain the
word “superbowl” from Twitter, and save the tweets in
a document called “superbowl”. In case a tweet contains
more than two trending topics, the tweet is saved in all
relevant documents. For example, if a tweet contains two
trending topics “superbowl” and “NFL”, the same tweet is
3https://dev.twitter.com/
��
������
��� ��� �����
��� ���
���
���
�� ���
����
���
����
���
�
��
��
��
��
��
���
���
���� �
�����
�����
����
Figure 3. Distribution of 768 topics across 18 classes. The sports categoryhad the highest number of topics (19.3%), followed by other category(12%). Except for categories other news, tv & movies, and music, all othercategories contained less than 6.8% of topics.
saved into two documents called “superbowl” and “NFL”.
From 23000+ trending topics that we have downloaded since
February 2010, we randomly selected 768 topics as our
dataset.
B. Labeling
We identified 18 classes for topic classification. The
classes are art & design, books, charity & deals, fashion,food & drink, health, humor, music, politics, religion, hol-idays & dates, science, sports, technology, business, tv &movies, other news, and other. Since twitter is a primary
source of news or information, the news related to political
253

Figure 4. Trending topics in class technology.
events are classified as politics. If the topic is about news
that is not in any of the categories, it is classified as othernews. If the trend definition or tweet text is gibberish or if
it is in a language other than English, then we classify the
topic as other category. The data was labeled by reading
topic’s trend definition and few tweets.
We used two annotators to label all topics. In case of
disagreement, a third annotator intervened. For the labeling
task, a random sample of 1000 topics was selected. From
the 1000, we narrowed the data set down to 768 topics for
mainly two reasons. First, the topic had no trend definition.
Second, the third annotator could not finalize the label. For
each of the 768 topics in our dataset, its five most similar
topics were also labeled, which are required for the network-
based modeling as described in Section III-C2. We ended up
manually labeling 3005 topics because some of the similar
topics were common to more than one topic. Figure 8 shows
the web-interface we deployed for the labeling task.4
The distribution of data over the 18 classes is provided
in Figure 3. The sports category had the highest number of
topics (19.3%), followed by other category (12%). Except
for categories other news, tv & movies, and music, all other
categories contained less than 6.8% of the topics. Figure 4
shows examples of trending topics that were classified as
technology.
C. Data Modeling
1) Text-based Data Modeling: In order to use text-based
document models, the data which comprises of topic’s trend
definition, tweets and label is processed in two stages. In
the first stage, for each topic, a document is made from
trend definition and varying number of tweets (30, 100,
300, and 500). From the document text, all tokens with
hyperlinks are removed. This document is then assigned
a label corresponding to the topic. In the next stage, the
document is run through a string-to-word vector kernel,
which consists of two components. The first component is
the tokenizer that removes delimited characters and stop
words to give the words in the document. Due to limitations
of tweet size (140 characters) stipulated by Twitter, overtime
4http://pulse.eecs.northwestern.edu/trendingtopic/
specialize vocabulary (lingo) has formed and is commonly
used by the users when tweeting. For e.g. BR is acronym
used for conveying Best Regards. We used a customized stop
words list catered to Twitter lingo5. The second component
transforms the tokens into tf-idf (term frequency–inverse
document frequency) weights [2]. The tf-idf measure allows
us to evaluate the importance of a word(term) to a document.
The importance is proportional to the number of times a
word appears in the document but is offset by the frequency
of the word in the document. Thus tf-idf is used to filter
out common words. For the experiment we use top 500 and
1000 frequent terms per category. For each of the 18 labels,
top most frequent words with their tf-idf weights are used
to build the dataset for machine learning in the next step.
2) Network-based Data Modeling: As an alternate to
text-based data modeling, in network-based data modeling,
we use Twitter specific social network information. An
interesting aspect of Twitter network structure is that a
linkage indicates common interest between two users and is
directed and asymmetric. User A can freely choose to follow
user B without B’s consent and B does not necessarily have
to follow A.
We use the algorithm from User Similarity Model [3] to
find five most similar topics for trending topic X. User simi-
larity is a metric that denotes the similarity among the users
commenting on topics ti and tj . Topic-specific influential
users are computed using a variant of Weighted Page Rank
Algorithm [4] and Twitter social network information such
as tweet time, number of tweets made on a topic, and friend-
follower relationship. Then, using the number of common
influential users between two topics, most similar topics are
calculated. The user similarity model assumes that if there
is significant overlap among users generating tweets on two
topics, then it implies a close relationship between the topics.
For example, if a higher number of users who tweet about
topic ta also tweet about topic tb than they do about topic
tc, then the topics ta and tb are more closely related than
topics ta and tb and can be computed as follows:
user similarity(ti, tj) =|Us
influencerti∩ Us
influencertj|
s(2)
where Usinfluencerti
is the set of top s influencers of topic
ti.Network-based data modeling uses the class of similar
topics that are manually labeled in section III-B to predict
the class of topic X. Although the User Similarity model
captures different dimensions of similarity such as temporal
and geographical, our assumption is that majority of the
similar topics will fall into the same category as the target
topic and hence we can predict the category of target topic
using the categories of its similar topics.
5http://www.twithawk.com/
254
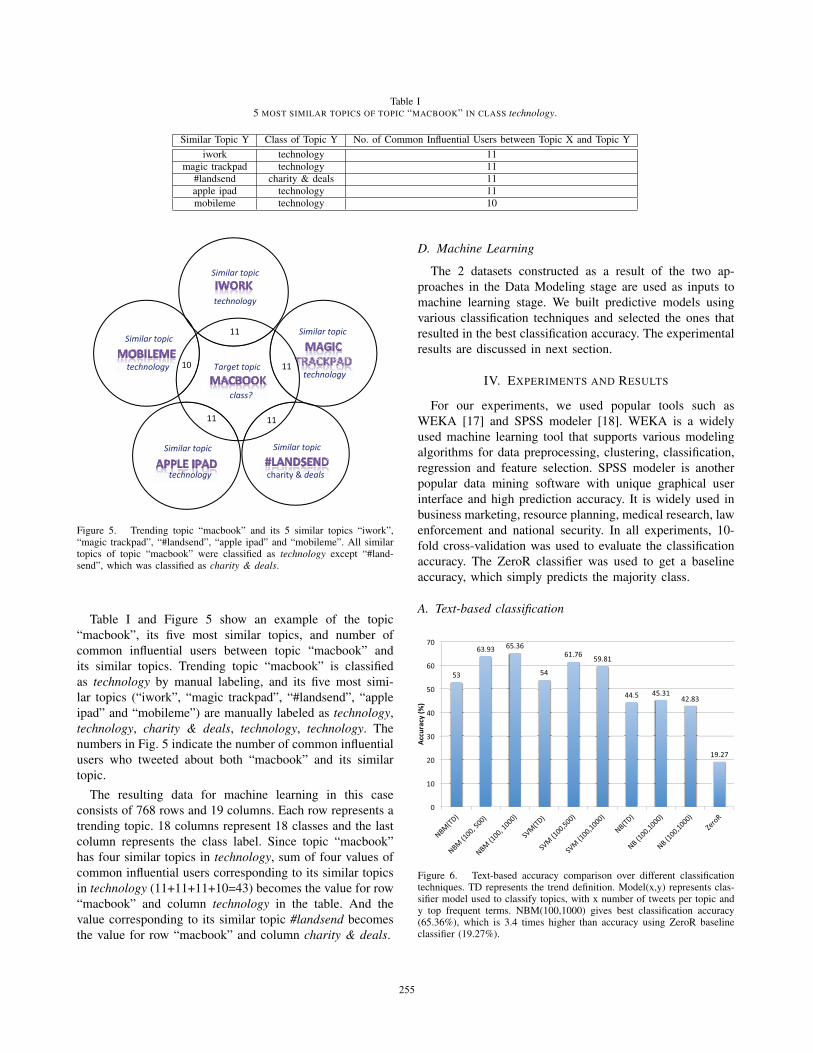
Table I5 MOST SIMILAR TOPICS OF TOPIC “MACBOOK” IN CLASS technology.
Similar Topic Y Class of Topic Y No. of Common Influential Users between Topic X and Topic Y
iwork technology 11magic trackpad technology 11
#landsend charity & deals 11apple ipad technology 11mobileme technology 10
���
��� ���
���
���
���������������
������ ��
������ ��
������ ��
������ ��
�������������
��������������
��� ��������
��������������
�������������� ��������������
��������������
Figure 5. Trending topic “macbook” and its 5 similar topics “iwork”,“magic trackpad”, “#landsend”, “apple ipad” and “mobileme”. All similartopics of topic “macbook” were classified as technology except “#land-send”, which was classified as charity & deals.
Table I and Figure 5 show an example of the topic
“macbook”, its five most similar topics, and number of
common influential users between topic “macbook” and
its similar topics. Trending topic “macbook” is classified
as technology by manual labeling, and its five most simi-
lar topics (“iwork”, “magic trackpad”, “#landsend”, “apple
ipad” and “mobileme”) are manually labeled as technology,
technology, charity & deals, technology, technology. The
numbers in Fig. 5 indicate the number of common influential
users who tweeted about both “macbook” and its similar
topic.
The resulting data for machine learning in this case
consists of 768 rows and 19 columns. Each row represents a
trending topic. 18 columns represent 18 classes and the last
column represents the class label. Since topic “macbook”
has four similar topics in technology, sum of four values of
common influential users corresponding to its similar topics
in technology (11+11+11+10=43) becomes the value for row
“macbook” and column technology in the table. And the
value corresponding to its similar topic #landsend becomes
the value for row “macbook” and column charity & deals.
D. Machine Learning
The 2 datasets constructed as a result of the two ap-
proaches in the Data Modeling stage are used as inputs to
machine learning stage. We built predictive models using
various classification techniques and selected the ones that
resulted in the best classification accuracy. The experimental
results are discussed in next section.
IV. EXPERIMENTS AND RESULTS
For our experiments, we used popular tools such as
WEKA [17] and SPSS modeler [18]. WEKA is a widely
used machine learning tool that supports various modeling
algorithms for data preprocessing, clustering, classification,
regression and feature selection. SPSS modeler is another
popular data mining software with unique graphical user
interface and high prediction accuracy. It is widely used in
business marketing, resource planning, medical research, law
enforcement and national security. In all experiments, 10-
fold cross-validation was used to evaluate the classification
accuracy. The ZeroR classifier was used to get a baseline
accuracy, which simply predicts the majority class.
A. Text-based classification
���
������ ������
���
����� �����
����� �����������
�����
��
���
���
���
���
���
���
��
���������
��
Figure 6. Text-based accuracy comparison over different classificationtechniques. TD represents the trend definition. Model(x,y) represents clas-sifier model used to classify topics, with x number of tweets per topic andy top frequent terms. NBM(100,1000) gives best classification accuracy(65.36%), which is 3.4 times higher than accuracy using ZeroR baselineclassifier (19.27%).
255

Using Naive Bayes Multinomial (NBM), Naive Bayes
(NB), and Support Vector Machines (SVM-L) with linear
kernels classifiers, we find that the accuracy of classification
is a function of number of tweets and frequent terms. Fig.
6 presents the comparison of classification accuracy using
different classifiers for text-based classification. TD repre-
sents the trend definition. Model(x,y) represents classifier
model used to classify topics, with x number of tweets per
topic and y top frequent terms. For example, NB(100,1000)
represents the accuracy using NB classifier with 100 tweets
per topic and 1000 most frequent terms (from text-based
modeling result).
NB model always provides lower accuracy over NBM
model because it models the word counts and adjusts the
underlying calculations. SVM-L performs better than NB
but has slightly lower accuracy compared to NBM. If only
trend definition is used, irrespective of the most frequent
word terms, the accuracy is much lower for all three clas-
sifiers compared to using trend definition plus tweets. The
experimental results suggest that NBM classifier using text
from trend definition, 100 tweets, and a maximum of 1000
word tokens per category gives the best accuracy of 65.36%.
B. Network-based classification
* �+��
���,-�
������ ������
�+�,*�
�
� �
, �
� �
� �
� �
� �
* �
- �
���� � �.���������������
� ��������������������
�������������������
������
��� ����
��/��
Figure 7. Network-based accuracy comparison over different classificationtechniques. C5.0 decision tree classifier gives best classification accuracy(70.96%), which is 3.68 times higher than accuracy using ZeroR baselineclassifier (19.27%).
Fig.7 presents the comparison of classification accuracy
using different classifiers for network-based classification.
Clearly, C5.0 decision tree classifier gives best classifica-
tion accuracy (70.96%) followed by k-Nearest Neighbor
(63.28%), Support Vector Machine (54.349%), Logistic Re-
gression (53.457%). C5.0 decision tree classifier achieves
3.68 times higher accuracy compared to the ZeroR baseline
classifier. The 70.96% accuracy is very good considering
that we categorize topics into 18 classes. To the best of our
knowledge, the number of classes used in our experiment
is much larger than the number of classes used in any
earlier research works (two-class classification is the most
common).
V. CONCLUSION
In this paper, we used two different classification schemes
for Twitter trending topic classification. Apart from using
text-based classification, our key contribution is the use
of social network structure rather than using just textual
information, which can be often noisy given in the context
of social media such as Twitter due the heavy use of Twitter
lingo and the limit on the number of characters that users are
allowed to generate for their messages. Our results show that
network-based classifier performed significantly better than
text-based classifier on our dataset. Considering tweets are
not as grammatically structured as regular document texts,
text-based classification using Naive Bayes Multinomial
provides fair results and can be leveraged in cases where
we may not be able to perform network-based analysis.
In our future work, we would like to integrate text-based
classification using Naive Bayes Multinomial (NBM) and
network-based classification. The idea would be to integrate
these two classifiers such that if we have all five similar top-
ics classified then use network-based classification otherwise
use text-based classification. During our experiments we
found some topics could fall under more than one category.
For example, news about a famous actor’s biography would
fall under tv & movies and books. Hence, we would also
like to explore the use of multiple labels in categorization.
ACKNOWLEDGMENT
We thank Christopher Moran for helping us in de-
signing the web-interface for labeling trending topics.
This work is supported in part by NSF award num-
bers CCF-0621443, OCI-0724599, CCF-0833131, CNS-
0830927, IIS-0905205, OCI-0956311, CCF-0938000, CCF-
1043085, CCF-1029166, and OCI-1144061, and in part by
DOE grants DE-FC02-07ER25808, DE-FG02-08ER25848,
DE-SC0001283, DE-SC0005309, and DE-SC0005340.
REFERENCES
[1] MarketingGum, http://www.marketinggum.com/twitter-statistics-2011-updated-stats/.
[2] C. D. Manning, P. Raghavan, and H. Schtze, Introduction toInformation Retrieval. New York, NY, USA: CambridgeUniversity Press, 2008.
[3] R. Narayanan, “Mining Text for Relationship Extraction andSentiment Analysis,” Ph.D. dissertation, 2010.
[4] W. Xing and A. Ghorbani, “Weighted pagerank algorithm,”2004.
[5] J. Quinlan, “Improved use of continuous attributes in c4.5,”Arxiv preprint cs/9603103, 1996.
256

[6] D. Aha, D. Kibler, and M. Albert, “Instance-based learningalgorithms,” Machine learning, vol. 6, no. 1, pp. 37–66, 1991.
[7] N. Cristianini and J. Shawe-Taylor, An introduction to supportVector Machines: and other kernel-based learning methods.Cambridge Univ Pr, 2000.
[8] S. Le Cessie and J. Van Houwelingen, “Ridge estimators inlogistic regression,” Applied Statistics, pp. 191–201, 1992.
[9] B. Sriram, D. Fuhry, E. Demir, H. Ferhatosmanoglu, andM. Demirbas, “Short text classification in twitter to improveinformation filtering,” in Proceeding of the 33rd internationalACM SIGIR conference on Research and development ininformation retrieval, 2010, pp. 841–842.
[10] Y. S. Yegin Genc and J. V. Nickerson, “Discovering context:Classifying tweets through a semantic transform based onwikipedia,” in Proceedings of HCI International, 2011.
[11] S. Kinsella, A. Passant, and J. G. Breslin, “Topic classificationin social media using metadata from hyperlinked objects,” inProceedings of the 33rd European conference on Advancesin information retrieval, 2011, pp. 201–206.
[12] J. Sankaranarayanan, H. Samet, B. E. Teitler, M. D. Lieber-man, and J. Sperling, “Twitterstand: news in tweets,” inProceedings of the 17th ACM SIGSPATIAL InternationalConference on Advances in Geographic Information Systems,2009, pp. 42–51.
[13] S. R. Yerva, Z. Miklos, and K. Aberer, “What have fruitsto do with technology?: the case of orange, blackberry andapple,” in Proceedings of the International Conference onWeb Intelligence, Mining and Semantics, 2011.
[14] M. N. Hila Becker and L. Gravano, “Beyond trending topics:Real-world event identification on twitter,” in Proceedings ofAAAI, 2011.
[15] A. Go, R. Bhayani, and L. Huang, “Twitter sentiment classi-fication using distant supervision,” 2009.
[16] B. Pang, L. Lee, and S. Vaithyanathan, “Thumbs up?: sen-timent classification using machine learning techniques,” inProceedings of the ACL-02 conference on Empirical methodsin natural language processing-Volume 10. Association forComputational Linguistics, 2002, pp. 79–86.
[17] Weka 3: Data Mining Software in Java, http://www.cs.waikato.ac.nz/ml/weka/.
[18] IBM SPSS Modeler, http://www-01.ibm.com/software/analytics/spss/products/modeler/.
257

Figure 8. Screenshot of web interface deployed for manual labeling. Annotators read the trend definition and tweets before labeling trending topics asone of the 18 classes.
258