Twists and turns ahead - Sharekhan...Twists and turns ahead TradeTiger better and faster every...
58
ValueGuide January 2018 Intelligent Investing Market Outlook Stock Updates Sector Updates Viewpoints Regular Features Report Card Earnings Guide Products & Services PMS Top Picks MF Picks Advisory Trader’s Edge Technical View Currencies F&O Insights For Private Circulation only www.sharekhan.com Twists and turns ahead
Transcript of Twists and turns ahead - Sharekhan...Twists and turns ahead TradeTiger better and faster every...

ValueGuideJanuary 2018
Intelligent Investing
Market OutlookStock Updates
Sector UpdatesViewpoints
Regular Features
Report CardEarnings Guide
Products & Services
PMSTop PicksMF PicksAdvisory
Trader’s Edge
Technical ViewCurrencies
F&O Insights
For Private Circulation only www.sharekhan.com
Twists and turns ahead
TradeTiger better and faster
every quarter
What’s new in the latest version of TradeTiger
Registered Office: Sharekhan Limited, 10th Floor, Beta Building, Lodha iThink Techno Campus, Off. JVLR, Opp. Kanjurmarg Railway Station, Kanjurmarg (East), Mumbai – 400042, Maharashtra. Tel: 022 - 61150000. Sharekhan Ltd.: SEBI Regn. Nos.: BSE: INB/INF011073351 / BSE-CD ; NSE: INB/INF/INE231073330 ; MSEI: INB/INF261073333 / INE261073330 ; DP: NSDL-IN-DP-NSDL-233-2003 ; CDSL-IN-DP-CDSL-271-2004 ; PMS-INP000005786 ; Mutual Fund-ARN 20669 ; Research Analyst: INH000000370 ; For any complaints email at [email protected] ; Disclaimer: Client should read the Risk Disclosure Document issued by SEBI & relevant exchanges and the T & C on www.sharekhan.com before investing.
Disclaimer: Investment in securities market are subject to market risks, read all the related documents carefully before investing. read more
[email protected] 1800227500
Marketwatch with sectors: Bifurcate stocks according to sectors and track performance easily
Minimum margin display: Say good bye to punching orders repeatedly asrequired margin is now available upfront
Draw on charts: Do free hand drawing or marking on any part of the chart for better analysis
Ichimoku on scanner: The most reliable indicator, Ichimoku is now available on Stock scanner, go ahead make those technical calls!
Net rupee change on HeatMap: You can now get both percentage as well as Net Rupee change on the HeatMap
`%
Dynamic OCF with moneyness filter: With moneyness (ITM, ATM, OTM) filter, option traders can now identify the moneyness of scanned contracts
CONTENTS
3January 2018 Sharekhan ValueGuide3June 2017 Sharekhan ValueGuide
disclaimer
DISCLAIMER: This document has been prepared by Sharekhan Ltd. (SHAREKHAN) and is intended for use only by the person or entity to which it is addressed to. This Document may contain confiden-
tial and/or privileged material and is not for any type of circulation and any review, retransmission, or any other use is strictly prohibited. This Document is subject to changes without prior notice. This
document does not constitute an offer to sell or solicitation for the purchase or sale of any financial instrument or as an official confirmation of any transaction. Though disseminated to all customers
who are due to receive the same, not all customers may receive this report at the same time. SHAREKHAN will not treat recipients as customers by virtue of their receiving this report.
The information contained herein is obtained from publicly available data or other sources believed to be reliable and SHAREKHAN has not independently verified the accuracy and completeness of
the said data and hence it should not be relied upon as such. While we would endeavour to update the information herein on reasonable basis, SHAREKHAN, its subsidiaries and associated compa-
nies, their directors and employees (“SHAREKHAN and affiliates”) are under no obligation to update or keep the information current. Also, there may be regulatory, compliance, or other reasons that
may prevent SHAREKHAN and affiliates from doing so. This document is prepared for assistance only and is not intended to be and must not alone be taken as the basis for an investment decision.
Recipients of this report should also be aware that past performance is not necessarily a guide to future performance and value of investments can go down as well. The user assumes the entire risk
of any use made of this information. Each recipient of this document should make such investigations as it deems necessary to arrive at an independent evaluation of an investment in the securities of
companies referred to in this document (including the merits and risks involved), and should consult its own advisors to determine the merits and risks of such an investment. The investment discussed
or views expressed may not be suitable for all investors. We do not undertake to advise you as to any change of our views. Affiliates of Sharekhan may have issued other reports that are inconsistent
with and reach different conclusions from the information presented in this report.
This report is not directed or intended for distribution to, or use by, any person or entity who is a citizen or resident of or located in any locality, state, country or other jurisdiction, where such distribution,
publication, availability or use would be contrary to law, regulation or which would subject SHAREKHAN and affiliates to any registration or licencing requirement within such jurisdiction. The securities
described herein may or may not be eligible for sale in all jurisdictions or to certain category of investors. Persons in whose possession this document may come are required to inform themselves of
and to observe such restriction.
The analyst certifies that the analyst has not dealt or traded directly or indirectly in securities of the company and that all of the views expressed in this document accurately reflect his or her personal
views about the subject company or companies and its or their securities and do not necessarily reflect those of SHAREKHAN. The analyst further certifies that neither he nor his relatives has any
direct or indirect financial interest nor have actual or beneficial ownership of 1% or more in the securities of the company nor have any material conflict of interest nor has served as officer, director or
employee or engaged in market making activity of the company. Further, the analyst has also not been a part of the team which has managed or co-managed the public offerings of the company and
no part of the analyst’s compensation was, is or will be, directly or indirectly related to specific recommendations or views expressed in this document.
Either SHAREKHAN or its affiliates or its directors or employees / representatives / clients or their relatives may have position(s), make market, act as principal or engage in transactions of purchase or
sell of securities, from time to time or may be materially interested in any of the securities or related securities referred to in this report and they may have used the information set forth herein before
publication. SHAREKHAN may from time to time solicit from, or perform investment banking, or other services for, any company mentioned herein. Without limiting any of the foregoing, in no event shall
SHAREKHAN, any of its affiliates or any third party involved in, or related to, computing or compiling the information have any liability for any damages of any kind.
Compliance Officer: Mr. Joby John Meledan; Tel: 022-61150000; For any queries or grievances kindly email
[email protected] or contact: [email protected]
Registered Office: Sharekhan Limited, 10th Floor, Beta Building, Lodha iThink Techno Campus, Off. JVLR, Opp. Kanjurmarg Railway Station, Kanjurmarg (East), Mumbai – 400042, Maharashtra. Tel: 022 - 61150000. Sharekhan Ltd.: SEBI Regn. Nos.: BSE: INB/INF011073351 / BSE-CD; NSE: INB/INF/INE231073330 ; MSEI: INB/INF261073333 / INE261073330 ; DP: NSDL-IN-DP-NSDL-233-2003 ; CDSL-IN-DP-CDSL-271-2004; PMS-INP000005786 ; Mutual Fund-ARN 20669 ; Research Analyst: INH000000370; For any complaints email at [email protected] ; Disclaimer: Client should read the Risk Disclosure Document issued by SEBI & relevant exchanges and the T & C on www.sharekhan.com ; Investment in securities market are subject to market risks, read all the related documents carefully before investing.
In December, the
markets continued
to rise, braving firm
interest rates, the
continued spike in
inflation, concerns of
fiscal slippages an its
fallout on bond yields and financial markets....
From the Editor’s Desk EQUITY
06
RESEARCH-BASED EQUITY PRODUCTS
PMS DESKWealthOptimizer PMS 30
ProPrime - Diversified Equity 31
ProTech - Index Futures Fund 32
ProTech - Trailing Stops 33
FUNDAMENTALS
TECHNICALS DERIVATIVES
Nifty 26 View 27
ADVISORY DESK DERIVATIVES
MID Trades 34 Derivatives Ideas 34
CURRENCY
FUNDAMENTALS USD-INR 28 GBP-INR 28
EUR-INR 28 JPY-INR 28
TECHNICALS
USD-INR 29 GBP-INR 29
EUR-INR 29 JPY-INR 29
MUTUAL FUND DESK
Top MF Picks (equity) 35
Top SIP Fund Picks 36
Market Outlook 07
Top Picks Basket 11
REGULAR FEATURES
Stock Update 16 Report Card 4
Sector Update 25 Earnings Guide 37
EQUITY FUNDAMENTALSREPORT CARD
4January 2018 Sharekhan ValueGuide
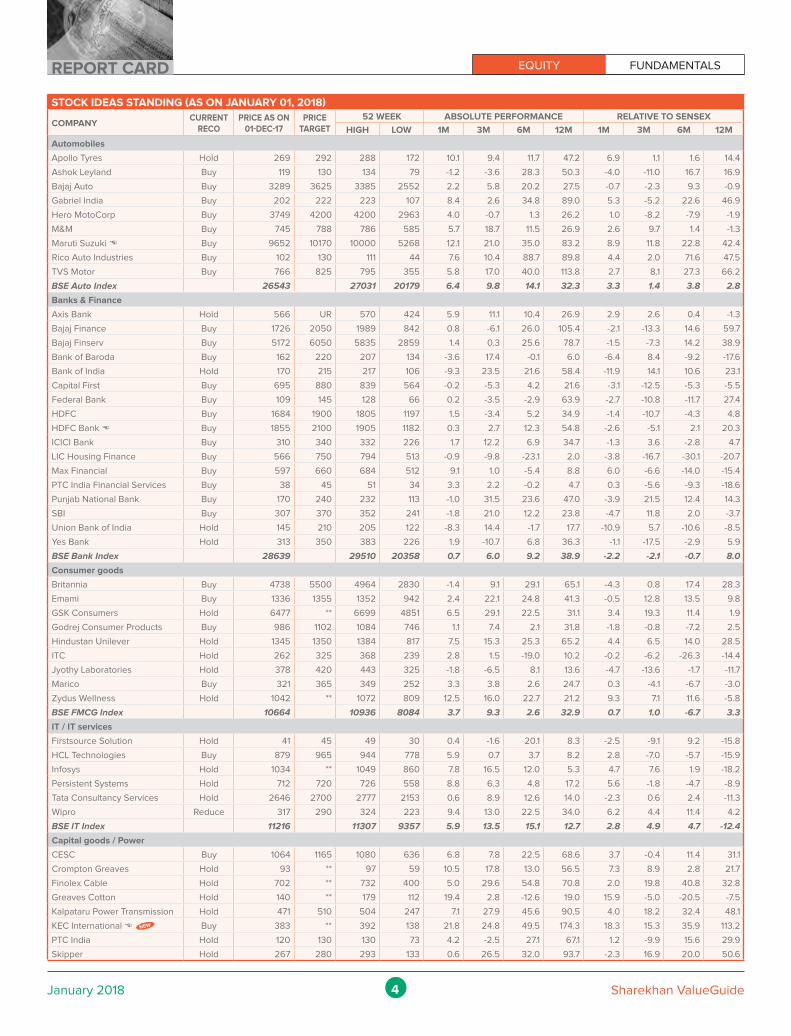
STOCK IDEAS STANDING (AS ON JANUARY 01, 2018)
COMPANYCURRENT
RECOPRICE AS ON
01-DEC-17PRICE
TARGET
52 WEEK ABSOLUTE PERFORMANCE RELATIVE TO SENSEX
HIGH LOW 1M 3M 6M 12M 1M 3M 6M 12M
Automobiles
Apollo Tyres Hold 269 292 288 172 10.1 9.4 11.7 47.2 6.9 1.1 1.6 14.4
Ashok Leyland Buy 119 130 134 79 -1.2 -3.6 28.3 50.3 -4.0 -11.0 16.7 16.9
Bajaj Auto Buy 3289 3625 3385 2552 2.2 5.8 20.2 27.5 -0.7 -2.3 9.3 -0.9
Gabriel India Buy 202 222 223 107 8.4 2.6 34.8 89.0 5.3 -5.2 22.6 46.9
Hero MotoCorp Buy 3749 4200 4200 2963 4.0 -0.7 1.3 26.2 1.0 -8.2 -7.9 -1.9
M&M Buy 745 788 786 585 5.7 18.7 11.5 26.9 2.6 9.7 1.4 -1.3
Maruti Suzuki E Buy 9652 10170 10000 5268 12.1 21.0 35.0 83.2 8.9 11.8 22.8 42.4
Rico Auto Industries Buy 102 130 111 44 7.6 10.4 88.7 89.8 4.4 2.0 71.6 47.5
TVS Motor Buy 766 825 795 355 5.8 17.0 40.0 113.8 2.7 8.1 27.3 66.2
BSE Auto Index 26543 27031 20179 6.4 9.8 14.1 32.3 3.3 1.4 3.8 2.8
Banks & Finance
Axis Bank Hold 566 UR 570 424 5.9 11.1 10.4 26.9 2.9 2.6 0.4 -1.3
Bajaj Finance Buy 1726 2050 1989 842 0.8 -6.1 26.0 105.4 -2.1 -13.3 14.6 59.7
Bajaj Finserv Buy 5172 6050 5835 2859 1.4 0.3 25.6 78.7 -1.5 -7.3 14.2 38.9
Bank of Baroda Buy 162 220 207 134 -3.6 17.4 -0.1 6.0 -6.4 8.4 -9.2 -17.6
Bank of India Hold 170 215 217 106 -9.3 23.5 21.6 58.4 -11.9 14.1 10.6 23.1
Capital First Buy 695 880 839 564 -0.2 -5.3 4.2 21.6 -3.1 -12.5 -5.3 -5.5
Federal Bank Buy 109 145 128 66 0.2 -3.5 -2.9 63.9 -2.7 -10.8 -11.7 27.4
HDFC Buy 1684 1900 1805 1197 1.5 -3.4 5.2 34.9 -1.4 -10.7 -4.3 4.8
HDFC Bank E Buy 1855 2100 1905 1182 0.3 2.7 12.3 54.8 -2.6 -5.1 2.1 20.3
ICICI Bank Buy 310 340 332 226 1.7 12.2 6.9 34.7 -1.3 3.6 -2.8 4.7
LIC Housing Finance Buy 566 750 794 513 -0.9 -9.8 -23.1 2.0 -3.8 -16.7 -30.1 -20.7
Max Financial Buy 597 660 684 512 9.1 1.0 -5.4 8.8 6.0 -6.6 -14.0 -15.4
PTC India Financial Services Buy 38 45 51 34 3.3 2.2 -0.2 4.7 0.3 -5.6 -9.3 -18.6
Punjab National Bank Buy 170 240 232 113 -1.0 31.5 23.6 47.0 -3.9 21.5 12.4 14.3
SBI Buy 307 370 352 241 -1.8 21.0 12.2 23.8 -4.7 11.8 2.0 -3.7
Union Bank of India Hold 145 210 205 122 -8.3 14.4 -1.7 17.7 -10.9 5.7 -10.6 -8.5
Yes Bank Hold 313 350 383 226 1.9 -10.7 6.8 36.3 -1.1 -17.5 -2.9 5.9
BSE Bank Index 28639 29510 20358 0.7 6.0 9.2 38.9 -2.2 -2.1 -0.7 8.0
Consumer goods
Britannia Buy 4738 5500 4964 2830 -1.4 9.1 29.1 65.1 -4.3 0.8 17.4 28.3
Emami Buy 1336 1355 1352 942 2.4 22.1 24.8 41.3 -0.5 12.8 13.5 9.8
GSK Consumers Hold 6477 ** 6699 4851 6.5 29.1 22.5 31.1 3.4 19.3 11.4 1.9
Godrej Consumer Products Buy 986 1102 1084 746 1.1 7.4 2.1 31.8 -1.8 -0.8 -7.2 2.5
Hindustan Unilever Hold 1345 1350 1384 817 7.5 15.3 25.3 65.2 4.4 6.5 14.0 28.5
ITC Hold 262 325 368 239 2.8 1.5 -19.0 10.2 -0.2 -6.2 -26.3 -14.4
Jyothy Laboratories Hold 378 420 443 325 -1.8 -6.5 8.1 13.6 -4.7 -13.6 -1.7 -11.7
Marico Buy 321 365 349 252 3.3 3.8 2.6 24.7 0.3 -4.1 -6.7 -3.0
Zydus Wellness Hold 1042 ** 1072 809 12.5 16.0 22.7 21.2 9.3 7.1 11.6 -5.8
BSE FMCG Index 10664 10936 8084 3.7 9.3 2.6 32.9 0.7 1.0 -6.7 3.3
IT / IT services
Firstsource Solution Hold 41 45 49 30 0.4 -1.6 20.1 8.3 -2.5 -9.1 9.2 -15.8
HCL Technologies Buy 879 965 944 778 5.9 0.7 3.7 8.2 2.8 -7.0 -5.7 -15.9
Infosys Hold 1034 ** 1049 860 7.8 16.5 12.0 5.3 4.7 7.6 1.9 -18.2
Persistent Systems Hold 712 720 726 558 8.8 6.3 4.8 17.2 5.6 -1.8 -4.7 -8.9
Tata Consultancy Services Hold 2646 2700 2777 2153 0.6 8.9 12.6 14.0 -2.3 0.6 2.4 -11.3
Wipro Reduce 317 290 324 223 9.4 13.0 22.5 34.0 6.2 4.4 11.4 4.2
BSE IT Index 11216 11307 9357 5.9 13.5 15.1 12.7 2.8 4.9 4.7 -12.4
Capital goods / Power
CESC Buy 1064 1165 1080 636 6.8 7.8 22.5 68.6 3.7 -0.4 11.4 31.1
Crompton Greaves Hold 93 ** 97 59 10.5 17.8 13.0 56.5 7.3 8.9 2.8 21.7
Finolex Cable Hold 702 ** 732 400 5.0 29.6 54.8 70.8 2.0 19.8 40.8 32.8
Greaves Cotton Hold 140 ** 179 112 19.4 2.8 -12.6 19.0 15.9 -5.0 -20.5 -7.5
Kalpataru Power Transmission Hold 471 510 504 247 7.1 27.9 45.6 90.5 4.0 18.2 32.4 48.1
KEC International E Buy 383 ** 392 138 21.8 24.8 49.5 174.3 18.3 15.3 35.9 113.2
PTC India Hold 120 130 130 73 4.2 -2.5 27.1 67.1 1.2 -9.9 15.6 29.9
Skipper Hold 267 280 293 133 0.6 26.5 32.0 93.7 -2.3 16.9 20.0 50.6
NEW
EQUITY FUNDAMENTALS REPORT CARD
5January 2018 Sharekhan ValueGuide
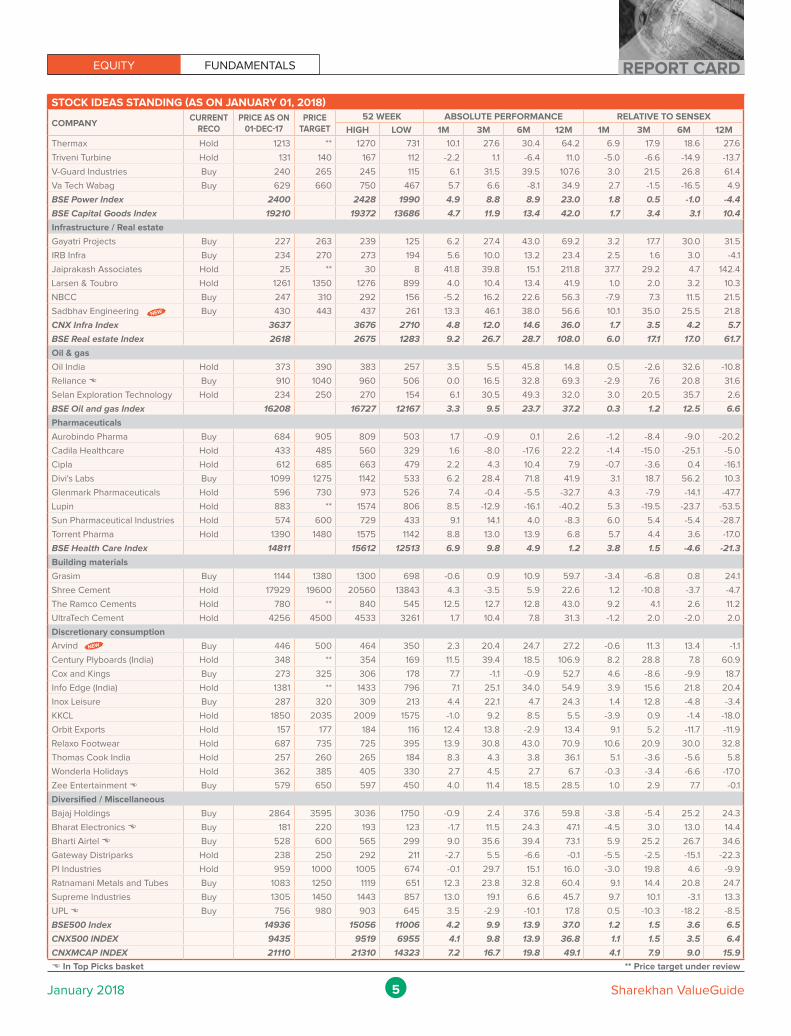
STOCK IDEAS STANDING (AS ON JANUARY 01, 2018)
COMPANYCURRENT
RECOPRICE AS ON
01-DEC-17PRICE
TARGET
52 WEEK ABSOLUTE PERFORMANCE RELATIVE TO SENSEX
HIGH LOW 1M 3M 6M 12M 1M 3M 6M 12M
Thermax Hold 1213 ** 1270 731 10.1 27.6 30.4 64.2 6.9 17.9 18.6 27.6
Triveni Turbine Hold 131 140 167 112 -2.2 1.1 -6.4 11.0 -5.0 -6.6 -14.9 -13.7
V-Guard Industries Buy 240 265 245 115 6.1 31.5 39.5 107.6 3.0 21.5 26.8 61.4
Va Tech Wabag Buy 629 660 750 467 5.7 6.6 -8.1 34.9 2.7 -1.5 -16.5 4.9
BSE Power Index 2400 2428 1990 4.9 8.8 8.9 23.0 1.8 0.5 -1.0 -4.4
BSE Capital Goods Index 19210 19372 13686 4.7 11.9 13.4 42.0 1.7 3.4 3.1 10.4
Infrastructure / Real estate
Gayatri Projects Buy 227 263 239 125 6.2 27.4 43.0 69.2 3.2 17.7 30.0 31.5
IRB Infra Buy 234 270 273 194 5.6 10.0 13.2 23.4 2.5 1.6 3.0 -4.1
Jaiprakash Associates Hold 25 ** 30 8 41.8 39.8 15.1 211.8 37.7 29.2 4.7 142.4
Larsen & Toubro Hold 1261 1350 1276 899 4.0 10.4 13.4 41.9 1.0 2.0 3.2 10.3
NBCC Buy 247 310 292 156 -5.2 16.2 22.6 56.3 -7.9 7.3 11.5 21.5
Sadbhav Engineering Buy 430 443 437 261 13.3 46.1 38.0 56.6 10.1 35.0 25.5 21.8
CNX Infra Index 3637 3676 2710 4.8 12.0 14.6 36.0 1.7 3.5 4.2 5.7
BSE Real estate Index 2618 2675 1283 9.2 26.7 28.7 108.0 6.0 17.1 17.0 61.7
Oil & gas
Oil India Hold 373 390 383 257 3.5 5.5 45.8 14.8 0.5 -2.6 32.6 -10.8
Reliance E Buy 910 1040 960 506 0.0 16.5 32.8 69.3 -2.9 7.6 20.8 31.6
Selan Exploration Technology Hold 234 250 270 154 6.1 30.5 49.3 32.0 3.0 20.5 35.7 2.6
BSE Oil and gas Index 16208 16727 12167 3.3 9.5 23.7 37.2 0.3 1.2 12.5 6.6
Pharmaceuticals
Aurobindo Pharma Buy 684 905 809 503 1.7 -0.9 0.1 2.6 -1.2 -8.4 -9.0 -20.2
Cadila Healthcare Hold 433 485 560 329 1.6 -8.0 -17.6 22.2 -1.4 -15.0 -25.1 -5.0
Cipla Hold 612 685 663 479 2.2 4.3 10.4 7.9 -0.7 -3.6 0.4 -16.1
Divi's Labs Buy 1099 1275 1142 533 6.2 28.4 71.8 41.9 3.1 18.7 56.2 10.3
Glenmark Pharmaceuticals Hold 596 730 973 526 7.4 -0.4 -5.5 -32.7 4.3 -7.9 -14.1 -47.7
Lupin Hold 883 ** 1574 806 8.5 -12.9 -16.1 -40.2 5.3 -19.5 -23.7 -53.5
Sun Pharmaceutical Industries Hold 574 600 729 433 9.1 14.1 4.0 -8.3 6.0 5.4 -5.4 -28.7
Torrent Pharma Hold 1390 1480 1575 1142 8.8 13.0 13.9 6.8 5.7 4.4 3.6 -17.0
BSE Health Care Index 14811 15612 12513 6.9 9.8 4.9 1.2 3.8 1.5 -4.6 -21.3
Building materials
Grasim Buy 1144 1380 1300 698 -0.6 0.9 10.9 59.7 -3.4 -6.8 0.8 24.1
Shree Cement Hold 17929 19600 20560 13843 4.3 -3.5 5.9 22.6 1.2 -10.8 -3.7 -4.7
The Ramco Cements Hold 780 ** 840 545 12.5 12.7 12.8 43.0 9.2 4.1 2.6 11.2
UltraTech Cement Hold 4256 4500 4533 3261 1.7 10.4 7.8 31.3 -1.2 2.0 -2.0 2.0
Discretionary consumption
Arvind Buy 446 500 464 350 2.3 20.4 24.7 27.2 -0.6 11.3 13.4 -1.1
Century Plyboards (India) Hold 348 ** 354 169 11.5 39.4 18.5 106.9 8.2 28.8 7.8 60.9
Cox and Kings Buy 273 325 306 178 7.7 -1.1 -0.9 52.7 4.6 -8.6 -9.9 18.7
Info Edge (India) Hold 1381 ** 1433 796 7.1 25.1 34.0 54.9 3.9 15.6 21.8 20.4
Inox Leisure Buy 287 320 309 213 4.4 22.1 4.7 24.3 1.4 12.8 -4.8 -3.4
KKCL Hold 1850 2035 2009 1575 -1.0 9.2 8.5 5.5 -3.9 0.9 -1.4 -18.0
Orbit Exports Hold 157 177 184 116 12.4 13.8 -2.9 13.4 9.1 5.2 -11.7 -11.9
Relaxo Footwear Hold 687 735 725 395 13.9 30.8 43.0 70.9 10.6 20.9 30.0 32.8
Thomas Cook India Hold 257 260 265 184 8.3 4.3 3.8 36.1 5.1 -3.6 -5.6 5.8
Wonderla Holidays Hold 362 385 405 330 2.7 4.5 2.7 6.7 -0.3 -3.4 -6.6 -17.0
Zee Entertainment E Buy 579 650 597 450 4.0 11.4 18.5 28.5 1.0 2.9 7.7 -0.1
Diversified / Miscellaneous
Bajaj Holdings Buy 2864 3595 3036 1750 -0.9 2.4 37.6 59.8 -3.8 -5.4 25.2 24.3
Bharat Electronics E Buy 181 220 193 123 -1.7 11.5 24.3 47.1 -4.5 3.0 13.0 14.4
Bharti Airtel E Buy 528 600 565 299 9.0 35.6 39.4 73.1 5.9 25.2 26.7 34.6
Gateway Distriparks Hold 238 250 292 211 -2.7 5.5 -6.6 -0.1 -5.5 -2.5 -15.1 -22.3
PI Industries Hold 959 1000 1005 674 -0.1 29.7 15.1 16.0 -3.0 19.8 4.6 -9.9
Ratnamani Metals and Tubes Buy 1083 1250 1119 651 12.3 23.8 32.8 60.4 9.1 14.4 20.8 24.7
Supreme Industries Buy 1305 1450 1443 857 13.0 19.1 6.6 45.7 9.7 10.1 -3.1 13.3
UPL E Buy 756 980 903 645 3.5 -2.9 -10.1 17.8 0.5 -10.3 -18.2 -8.5
BSE500 Index 14936 15056 11006 4.2 9.9 13.9 37.0 1.2 1.5 3.6 6.5
CNX500 INDEX 9435 9519 6955 4.1 9.8 13.9 36.8 1.1 1.5 3.5 6.4
CNXMCAP INDEX 21110 21310 14323 7.2 16.7 19.8 49.1 4.1 7.9 9.0 15.9
E In Top Picks basket ** Price target under review
NEW
NEW
6January 2018 Sharekhan ValueGuide
Twists and turns ahead
In December, the markets continued to rise, braving firm interest rates, the continued spike in inflation, concerns of fiscal slippages an its fallout on bond yields and financial markets. The Sensex and Nifty ended the month and year at all-time highs above 34000 and 10500, respectively, riding on the BJP’s electoral wins and positive macroeconomic data such as a rise in core sector output and a higher reading on the Nikkei Manufacturing Purchasing Manager’s Index (PMI).
For the whole of 2017, the benchmark indices gained 29-30% in their best run since 2014. Major movers and shakers were the onset of the Goods and Services Tax (GST) regime, upgrades from Moody’s and World Bank, a stellar series of initial public offers, bank recapitalisation and the amendment to the Insolvency and Bankruptcy Code. Steady investments by domestic institutional investors added the liquidity push. A gradual revival in GDP growth and corporate earnings, as effects of demonetisation and GST fades away also supported markets.
After a happy ending to 2017, the new-year has also begun on an optimistic note. Equity markets continue to scale new heights in the initial days itself. The street is hoping for better times ahead. And rightly so, the domestic policy driven disruption is behind us, the corporate earnings revival could finally materialise in 2018 and finally, the global environment is also expected to remain supportive in 2018.
The US economy is expected to build on the recovery of 2017 and the US Federal Reserve expects the economy to grow by 2.5% in 2018. In fact, the World Manufacturing PMI is surging and promises 2018 to be one of the strongest growth years in the last one decade. On the other hand, the liquidity conditions are comfortable and bond yields of many countries are yielding negative returns. No wonder, the leading global markets are at all time high levels.
But all is not well. There are challenges ahead. Domestically, the government has to play a difficult balancing act in the forthcoming Union Budget. On one hand, there is a need to make higher allocations to ease rural stress and continue to scale up public spending in infrastructure development to support the economy. On the other hand, the revenue collections post implementation of GST continues to remain weak. Thus, it would be a challenge to stick within the prescribed target on fiscal deficit under the FRBM Act. It would be difficult for the government to resist populist measures given the fact that 2018 would see elections in many important states like Rajasthan, Madhya Pradesh, Chhattisgarh and Karnataka. Lastly, the rising crude oil prices would put additional pressure on government’s fiscal position.
Globally, the US Federal Reserve’s planned rate hikes, geopolitical tensions and the movement in crude oil prices will be key factors to keep an eye on. Rate hikes by the US Federal Reserve may make FII inflows unpredictable, though domestic inflows are likely to remain healthy due to lack of better investment opportunities.
Overall, the research team believes that the returns could be much sober in 2018 and the volatility could increase in the second half of the year. However, the year would offer many money making opportunities including the resurgence of some of the lagging stocks and/or sectors/pockets of stocks. Stay tuned to our research recommendations and subscribe to our investment products to make the best of your investments in 2018. Wish you a happy and a profitable New Year!
To read our Market Outlook for 2018, turn to page 7.Fro
m t
he
Ed
ito
r’s
De
skFrom the Editor’s Desk
EQUITY FUNDAMENTALS MARKET OUTLOOK
7January 2018 Sharekhan ValueGuide
5
10
15
20
Dec
-07
Dec
-08
Dec
-09
Dec
-10
Dec
-11
Dec
-12
Dec
-13
Dec
-14
Dec
-15
Dec
-16
Dec
-17
Sensex PE 10 Year average
Market Outlook December 26, 2017
Winds of changeReturns to sober down in 2018, expect some of the laggards to lead the rally
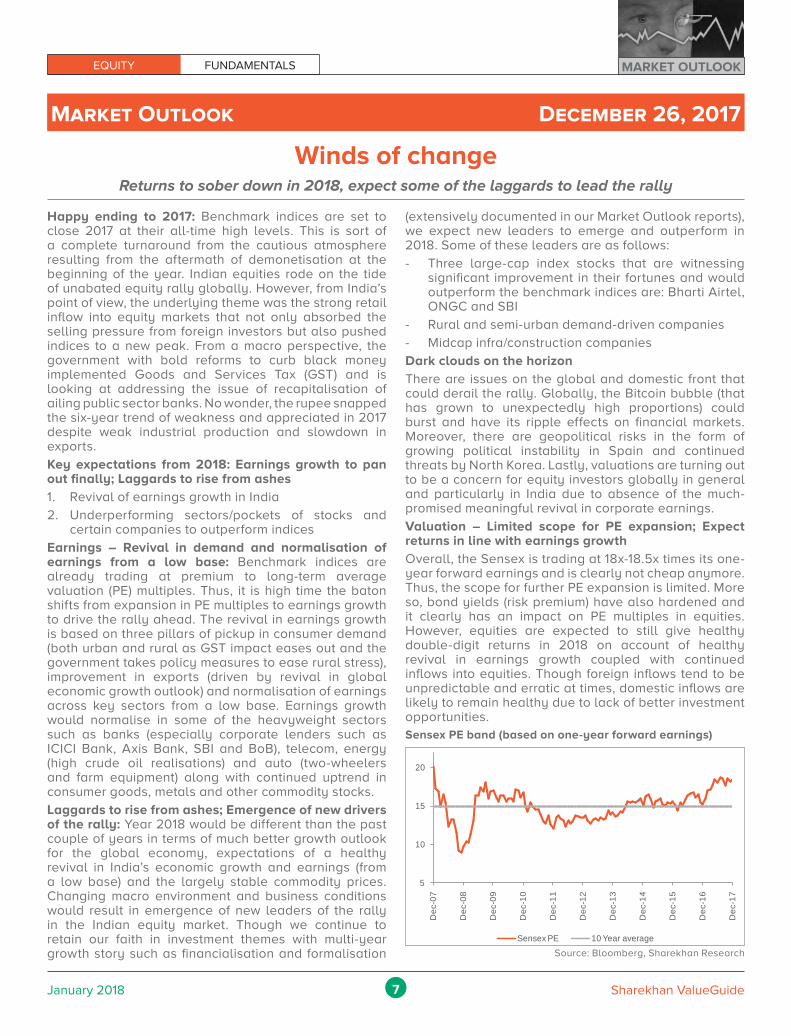
Happy ending to 2017: Benchmark indices are set to close 2017 at their all-time high levels. This is sort of a complete turnaround from the cautious atmosphere resulting from the aftermath of demonetisation at the beginning of the year. Indian equities rode on the tide of unabated equity rally globally. However, from India’s point of view, the underlying theme was the strong retail inflow into equity markets that not only absorbed the selling pressure from foreign investors but also pushed indices to a new peak. From a macro perspective, the government with bold reforms to curb black money implemented Goods and Services Tax (GST) and is looking at addressing the issue of recapitalisation of ailing public sector banks. No wonder, the rupee snapped the six-year trend of weakness and appreciated in 2017 despite weak industrial production and slowdown in exports.
Key expectations from 2018: Earnings growth to pan out finally; Laggards to rise from ashes1. Revival of earnings growth in India
2. Underperforming sectors/pockets of stocks and certain companies to outperform indices
Earnings – Revival in demand and normalisation of earnings from a low base: Benchmark indices are already trading at premium to long-term average valuation (PE) multiples. Thus, it is high time the baton shifts from expansion in PE multiples to earnings growth to drive the rally ahead. The revival in earnings growth is based on three pillars of pickup in consumer demand (both urban and rural as GST impact eases out and the government takes policy measures to ease rural stress), improvement in exports (driven by revival in global economic growth outlook) and normalisation of earnings across key sectors from a low base. Earnings growth would normalise in some of the heavyweight sectors such as banks (especially corporate lenders such as ICICI Bank, Axis Bank, SBI and BoB), telecom, energy (high crude oil realisations) and auto (two-wheelers and farm equipment) along with continued uptrend in consumer goods, metals and other commodity stocks.
Laggards to rise from ashes; Emergence of new drivers of the rally: Year 2018 would be different than the past couple of years in terms of much better growth outlook for the global economy, expectations of a healthy revival in India’s economic growth and earnings (from a low base) and the largely stable commodity prices. Changing macro environment and business conditions would result in emergence of new leaders of the rally in the Indian equity market. Though we continue to retain our faith in investment themes with multi-year growth story such as financialisation and formalisation
(extensively documented in our Market Outlook reports), we expect new leaders to emerge and outperform in 2018. Some of these leaders are as follows:
- Three large-cap index stocks that are witnessing significant improvement in their fortunes and would outperform the benchmark indices are: Bharti Airtel, ONGC and SBI
- Rural and semi-urban demand-driven companies
- Midcap infra/construction companies
Dark clouds on the horizonThere are issues on the global and domestic front that could derail the rally. Globally, the Bitcoin bubble (that has grown to unexpectedly high proportions) could burst and have its ripple effects on financial markets. Moreover, there are geopolitical risks in the form of growing political instability in Spain and continued threats by North Korea. Lastly, valuations are turning out to be a concern for equity investors globally in general and particularly in India due to absence of the much-promised meaningful revival in corporate earnings.
Valuation – Limited scope for PE expansion; Expect returns in line with earnings growthOverall, the Sensex is trading at 18x-18.5x times its one-year forward earnings and is clearly not cheap anymore. Thus, the scope for further PE expansion is limited. More so, bond yields (risk premium) have also hardened and it clearly has an impact on PE multiples in equities. However, equities are expected to still give healthy double-digit returns in 2018 on account of healthy revival in earnings growth coupled with continued inflows into equities. Though foreign inflows tend to be unpredictable and erratic at times, domestic inflows are likely to remain healthy due to lack of better investment opportunities. Sensex PE band (based on one-year forward earnings)
Source: Bloomberg, Sharekhan Research
EQUITY FUNDAMENTALSMARKET OUTLOOK
8January 2018 Sharekhan ValueGuide
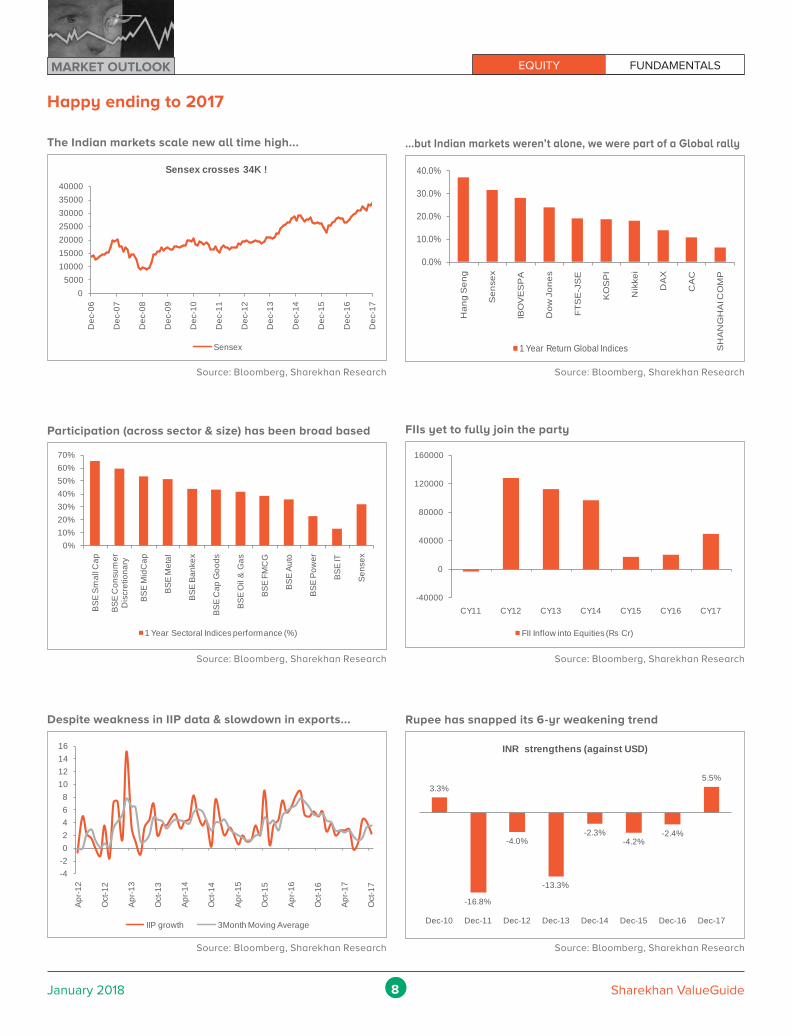
The Indian markets scale new all time high...
Despite weakness in IIP data & slowdown in exports...
...but Indian markets weren’t alone, we were part of a Global rally
Rupee has snapped its 6-yr weakening trend
Participation (across sector & size) has been broad based FIIs yet to fully join the party
Happy ending to 2017
05000
10000150002000025000300003500040000
Dec
-06
Dec
-07
Dec
-08
Dec
-09
Dec
-10
Dec
-11
Dec
-12
Dec
-13
Dec
-14
Dec
-15
Dec
-16
Dec
-17
Sensex crosses 34K !
Sensex
0%10%20%30%40%50%60%70%
BS
E S
mal
l Cap
BS
E C
onsu
mer
D
iscr
etio
nary
BS
E M
idC
ap
BS
E M
etal
BS
E B
anke
x
BSE
Cap
Goo
ds
BS
E O
il &
Gas
BS
E F
MC
G
BS
E A
uto
BS
E P
ower
BS
E IT
Sen
sex
1 Year Sectoral Indices performance (%)
-40000
0
40000
80000
120000
160000
CY11 CY12 CY13 CY14 CY15 CY16 CY17
FII Inflow into Equities (Rs Cr)
-4-202468
10121416
Apr
-12
Oct
-12
Apr
-13
Oct
-13
Apr
-14
Oct
-14
Apr
-15
Oct
-15
Apr
-16
Oct
-16
Apr
-17
Oct
-17
IIP growth 3Month Moving Average
3.3%
-16.8%
-4.0%
-13.3%
-2.3%-4.2%
-2.4%
5.5%
Dec-10 Dec-11 Dec-12 Dec-13 Dec-14 Dec-15 Dec-16 Dec-17
INR strengthens (against USD)
Source: Bloomberg, Sharekhan Research
Source: Bloomberg, Sharekhan Research
Source: Bloomberg, Sharekhan Research
Source: Bloomberg, Sharekhan Research
Source: Bloomberg, Sharekhan Research
Source: Bloomberg, Sharekhan Research
0.0%
10.0%
20.0%
30.0%
40.0%
Han
g S
eng
Sen
sex
IBO
VE
SP
A
Dow
Jon
es
FTS
E-J
SE
KO
SP
I
Nik
kei
DA
X
CA
C
SH
AN
GH
AI C
OM
P
1 Year Return Global Indices
EQUITY FUNDAMENTALS MARKET OUTLOOK
9January 2018 Sharekhan ValueGuide
State elections results set priorities for Union Budget:
Results of Gujarat state elections saw BJP maintaining
its citadel. The margin of victory has, however, left alarm
bells ringing. The show is likely to compel the NDA
Government to deliver faster and more visible results on
the growth and employment front (since jobless growth is
the key niggle). Hence, intuitively, one expects political
expediency in determining economic policy direction
and higher public spending. The FY2018-FY2019 Union
Budget is likely to be pro-growth and employment with
special focus on rural and middle income groups with
greater focus on things such as doubling of farm and rural
income, job creation, boosting of disposable income and
housing for all. We opine that the government’s stance is
likely to continue till 2019 General Elections. Moreover,
we believe there is less probability of disruptive reforms
coming up in 2019, as the government may look to
consolidate on its earlier initiatives.
Fiscal deficit – Slippage not a big concern if done
for the right reason: As subsequent elections loom
over the horizon, the spectre of farm loan waivers and
implementation of Pay Commission recommendations
may skew the fiscal discipline going forward. Moreover,
measures such as UDAY, PSU Bank Recapitalisation
and GST slab reductions are likely to impact the fiscal
consolidation roadmap.
FY2017A FY2018E
FISCAL DEFICIT TARGET (as % of
GVA)
3.50 3.20
TILL APR-AUG (as % of GVA) 2.67 3.08
Source: Sharekhan Research
While acknowledging that fiscal deficit financing fiscal
slippage generally comes with its share of negative
externalities, we believe, in the present context of India,
some amount of deficit financing, as counter cyclical
measures could support recovery, will not only be
welcomed but crucial to support growth. Notably, the
deficit will be due to higher capital expenditure rather
than due to revenue shortfall, which should be growth
supportive in the long term.
US Fed hike finally arrives, indicates growing strength
of the US economy: With the recent Federal Reserve
rate hike (increased by 25 bps) for the U.S., the U.S.
Fed has indicated that the U.S. economy has not only
improved, it is also in line with its planned trajectory. The
move in the U.S. will most likely create an environment
where probability of further rate cuts by the Reserve
Bank of India (RBI) decreases as the hike puts a kind of
floor for Indian interest rates in the near term. The Indian
markets (especially debt and equity) are in a different
risk category with respect to developed economies
(especially the U.S.). Hence, we believe there should
be minimal impact on Indian markets due to the rate
hike. Significant capital flow between disparate risk
baskets, especially equities, while is possible, has a low
probability in our view.
Nonetheless, with the hike, U.S. treasuries will become
attractive and will strengthen the U.S. dollar. Hence,
India’s exports may benefit with a weaker rupee, though
imports may become dearer.
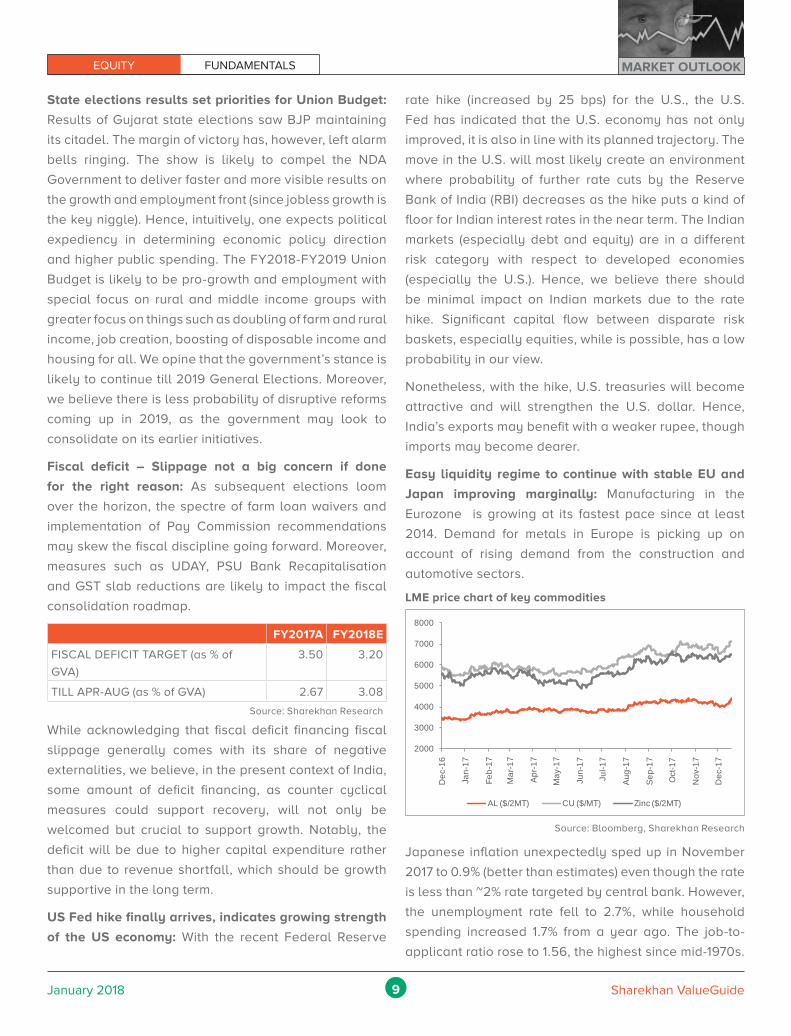
Easy liquidity regime to continue with stable EU and
Japan improving marginally: Manufacturing in the
Eurozone is growing at its fastest pace since at least
2014. Demand for metals in Europe is picking up on
account of rising demand from the construction and
automotive sectors.
Japanese inflation unexpectedly sped up in November
2017 to 0.9% (better than estimates) even though the rate
is less than ~2% rate targeted by central bank. However,
the unemployment rate fell to 2.7%, while household
spending increased 1.7% from a year ago. The job-to-
applicant ratio rose to 1.56, the highest since mid-1970s.
LME price chart of key commodities
Source: Bloomberg, Sharekhan Research
2000
3000
4000
5000
6000
7000
8000
Dec
-16
Jan-
17
Feb-
17
Mar
-17
Apr
-17
May
-17
Jun-
17
Jul-1
7
Aug
-17
Sep
-17
Oct
-17
Nov
-17
Dec
-17
AL ($/2MT) CU ($/MT) Zinc ($/2MT)
EQUITY FUNDAMENTALSMARKET OUTLOOK
10January 2018 Sharekhan ValueGuide
Sharekhan Limited, its analyst or dependant(s) of the analyst might be holding or having a position in the companies mentioned in the article.
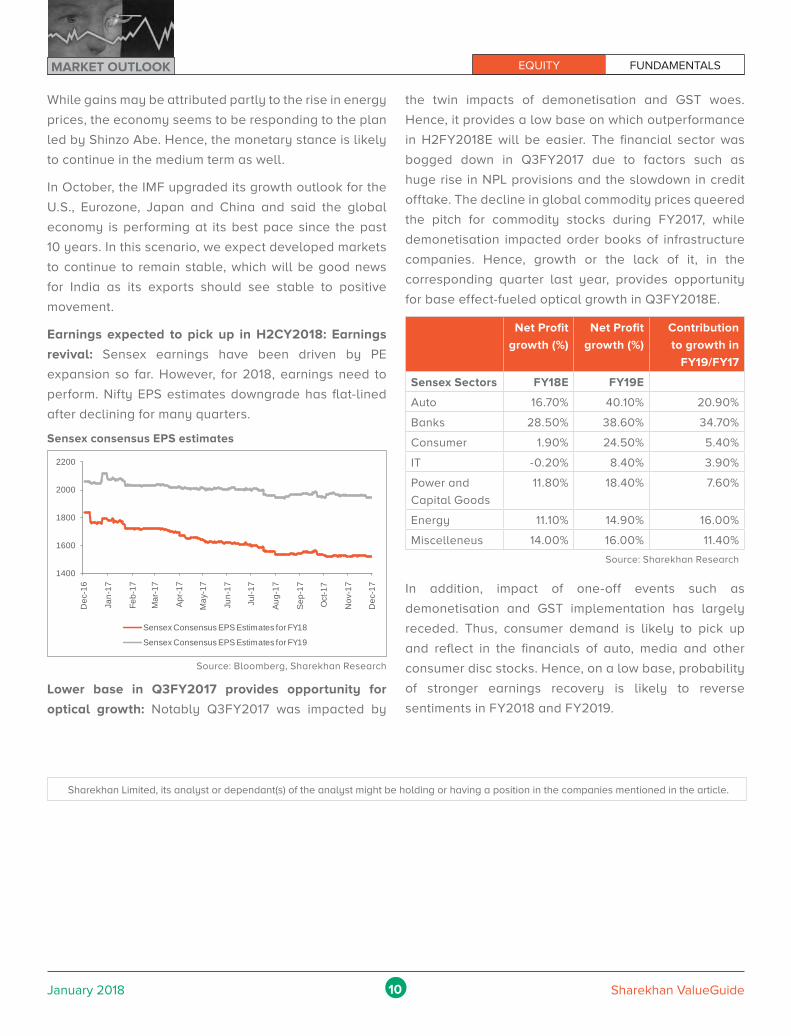
Sensex consensus EPS estimates
1400
1600
1800
2000
2200
Dec
-16
Jan-
17
Feb-
17
Mar
-17
Apr
-17
May
-17
Jun-
17
Jul -1
7
Aug
-17
Sep
-17
Oct
-17
Nov
-17
Dec
-17
Sensex Consensus EPS Estimates for FY18
Sensex Consensus EPS Estimates for FY19
Source: Bloomberg, Sharekhan Research
While gains may be attributed partly to the rise in energy
prices, the economy seems to be responding to the plan
led by Shinzo Abe. Hence, the monetary stance is likely
to continue in the medium term as well.
In October, the IMF upgraded its growth outlook for the
U.S., Eurozone, Japan and China and said the global
economy is performing at its best pace since the past
10 years. In this scenario, we expect developed markets
to continue to remain stable, which will be good news
for India as its exports should see stable to positive
movement.
Earnings expected to pick up in H2CY2018: Earnings
revival: Sensex earnings have been driven by PE
expansion so far. However, for 2018, earnings need to
perform. Nifty EPS estimates downgrade has flat-lined
after declining for many quarters.
the twin impacts of demonetisation and GST woes.
Hence, it provides a low base on which outperformance
in H2FY2018E will be easier. The financial sector was
bogged down in Q3FY2017 due to factors such as
huge rise in NPL provisions and the slowdown in credit
offtake. The decline in global commodity prices queered
the pitch for commodity stocks during FY2017, while
demonetisation impacted order books of infrastructure
companies. Hence, growth or the lack of it, in the
corresponding quarter last year, provides opportunity
for base effect-fueled optical growth in Q3FY2018E.
Net Profit
growth (%)
Net Profit
growth (%)
Contribution
to growth in
FY19/FY17
Sensex Sectors FY18E FY19E
Auto 16.70% 40.10% 20.90%
Banks 28.50% 38.60% 34.70%
Consumer 1.90% 24.50% 5.40%
IT -0.20% 8.40% 3.90%
Power and
Capital Goods
11.80% 18.40% 7.60%
Energy 11.10% 14.90% 16.00%
Miscelleneus 14.00% 16.00% 11.40%
Source: Sharekhan Research
In addition, impact of one-off events such as
demonetisation and GST implementation has largely
receded. Thus, consumer demand is likely to pick up
and reflect in the financials of auto, media and other
consumer disc stocks. Hence, on a low base, probability
of stronger earnings recovery is likely to reverse
sentiments in FY2018 and FY2019.
Lower base in Q3FY2017 provides opportunity for
optical growth: Notably Q3FY2017 was impacted by
EQUITY FUNDAMENTALS Sharekhan Top Picks
11January 2018 Sharekhan ValueGuide
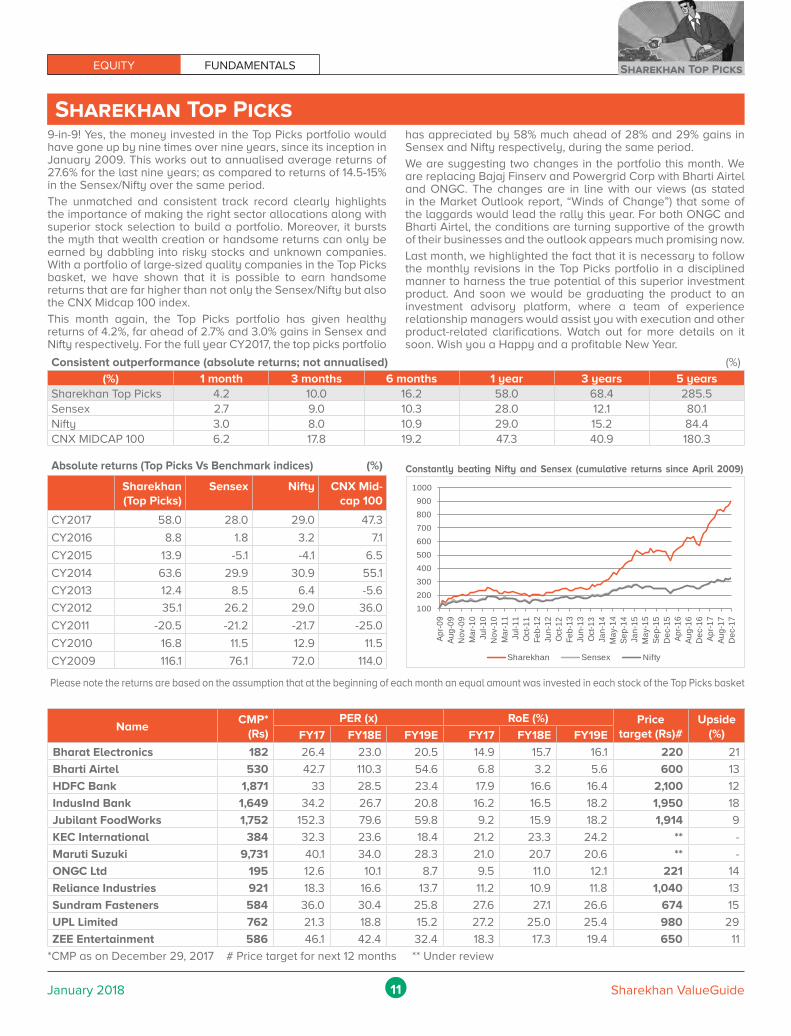
Sharekhan Top Picks9-in-9! Yes, the money invested in the Top Picks portfolio would have gone up by nine times over nine years, since its inception in January 2009. This works out to annualised average returns of 27.6% for the last nine years; as compared to returns of 14.5-15% in the Sensex/Nifty over the same period.
The unmatched and consistent track record clearly highlights the importance of making the right sector allocations along with superior stock selection to build a portfolio. Moreover, it bursts the myth that wealth creation or handsome returns can only be earned by dabbling into risky stocks and unknown companies. With a portfolio of large-sized quality companies in the Top Picks basket, we have shown that it is possible to earn handsome returns that are far higher than not only the Sensex/Nifty but also the CNX Midcap 100 index.
This month again, the Top Picks portfolio has given healthy returns of 4.2%, far ahead of 2.7% and 3.0% gains in Sensex and Nifty respectively. For the full year CY2017, the top picks portfolio
has appreciated by 58% much ahead of 28% and 29% gains in Sensex and Nifty respectively, during the same period.
We are suggesting two changes in the portfolio this month. We are replacing Bajaj Finserv and Powergrid Corp with Bharti Airtel and ONGC. The changes are in line with our views (as stated in the Market Outlook report, “Winds of Change”) that some of the laggards would lead the rally this year. For both ONGC and Bharti Airtel, the conditions are turning supportive of the growth of their businesses and the outlook appears much promising now.
Last month, we highlighted the fact that it is necessary to follow the monthly revisions in the Top Picks portfolio in a disciplined manner to harness the true potential of this superior investment product. And soon we would be graduating the product to an investment advisory platform, where a team of experience relationship managers would assist you with execution and other product-related clarifications. Watch out for more details on it soon. Wish you a Happy and a profitable New Year.
Consistent outperformance (absolute returns; not annualised) (%)
(%) 1 month 3 months 6 months 1 year 3 years 5 yearsSharekhan Top Picks 4.2 10.0 16.2 58.0 68.4 285.5Sensex 2.7 9.0 10.3 28.0 12.1 80.1Nifty 3.0 8.0 10.9 29.0 15.2 84.4CNX MIDCAP 100 6.2 17.8 19.2 47.3 40.9 180.3
NameCMP*
(Rs)PER (x) RoE (%) Price
target (Rs)#Upside
(%)FY17 FY18E FY19E FY17 FY18E FY19E
Bharat Electronics 182 26.4 23.0 20.5 14.9 15.7 16.1 220 21
Bharti Airtel 530 42.7 110.3 54.6 6.8 3.2 5.6 600 13
HDFC Bank 1,871 33 28.5 23.4 17.9 16.6 16.4 2,100 12
IndusInd Bank 1,649 34.2 26.7 20.8 16.2 16.5 18.2 1,950 18
Jubilant FoodWorks 1,752 152.3 79.6 59.8 9.2 15.9 18.2 1,914 9
KEC International 384 32.3 23.6 18.4 21.2 23.3 24.2 ** -
Maruti Suzuki 9,731 40.1 34.0 28.3 21.0 20.7 20.6 ** -
ONGC Ltd 195 12.6 10.1 8.7 9.5 11.0 12.1 221 14
Reliance Industries 921 18.3 16.6 13.7 11.2 10.9 11.8 1,040 13
Sundram Fasteners 584 36.0 30.4 25.8 27.6 27.1 26.6 674 15
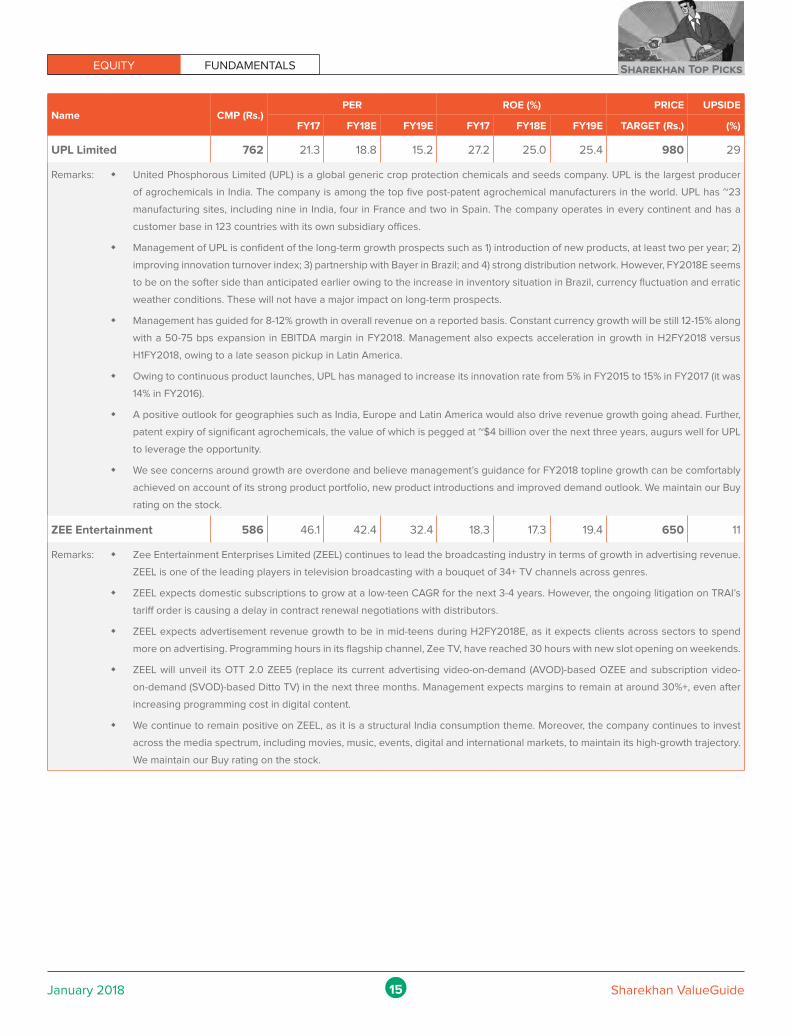
UPL Limited 762 21.3 18.8 15.2 27.2 25.0 25.4 980 29
ZEE Entertainment 586 46.1 42.4 32.4 18.3 17.3 19.4 650 11
*CMP as on December 29, 2017 # Price target for next 12 months ** Under review
Absolute returns (Top Picks Vs Benchmark indices) (%)
Sharekhan (Top Picks)
Sensex Nifty CNX Mid-cap 100
CY2017 58.0 28.0 29.0 47.3
CY2016 8.8 1.8 3.2 7.1
CY2015 13.9 -5.1 -4.1 6.5
CY2014 63.6 29.9 30.9 55.1
CY2013 12.4 8.5 6.4 -5.6
CY2012 35.1 26.2 29.0 36.0
CY2011 -20.5 -21.2 -21.7 -25.0
CY2010 16.8 11.5 12.9 11.5
CY2009 116.1 76.1 72.0 114.0
Constantly beating Nifty and Sensex (cumulative returns since April 2009)
Please note the returns are based on the assumption that at the beginning of each month an equal amount was invested in each stock of the Top Picks basket
100200300400500600700800900
1000
Apr-0
9Au
g-09
Nov
-09
Mar
-10
Jul-1
0N
ov-1
0M
ar-1
1Ju
l-11
Oct
-11
Feb-
12Ju
n-12
Oct
-12
Feb-
13Ju
n-13
Oct
-13
Jan-
14M
ay-1
4Se
p-14
Jan-
15M
ay-1
5Se
p-15
Dec
-15
Apr-1
6Au
g-16
Dec
-16
Apr-1
7Au
g-17
Dec
-17
Sharekhan Sensex Nifty

Sharekhan Top Picks EQUITY FUNDAMENTALS
12January 2018 Sharekhan ValueGuide
Name CMP (Rs.)PER ROE (%) PRICE UPSIDE
FY17 FY18E FY19E FY17 FY18E FY19E TARGET (Rs.) (%)
Bharat Electronics 182 26.4 23.0 20.5 14.9 15.7 16.1 220 21
Remarks: � Bharat Electronics Limited (BEL), a PSU that manufactures electronic, communication and defence equipment, stands to benefit from enhanced budgetary outlay for strengthening and modernising India’s security.
� The government’s ‘Make in India’ initiative and rising spends for modernising defence equipment will support earnings growth in the coming years, as it is the only player with strong research and manufacturing capabilities in the country.
� Current order book of the company at ~Rs. 41,746 crore provides revenue visibility over the next 3-4 years. We expect revenue to report a CAGR of 16.5% over FY2017-FY2020E, led by strong order wins and an impressive execution rate.
� BEL remains our preferred pick in the defence sector on account of its strong manufacturing and R&D base, good cost control, growing indigenisation and strong balance sheet with improving return ratios.
Bharti Airtel 530 42.7 110.3 54.6 6.8 3.2 5.6 600 13
Remarks: � Bharti Airtel (Airtel) is the largest mobile operator with over 280 million subscribers in India and over 80 million subscribers across 15 countries in Africa. In India, the company provides mobile services in 22 telecom circles along with fixed line, enterprise data and DTH services.
� Airtel owns 53.5% of Bharti Infratel (a towers company), which holds 42% of Indus Towers. Airtel has recently offloaded shares of Bharti Infratel for Rs. 3,325 crore to reduce its debt profile.
� Continuous focus of Airtel on remodeling activities in African business has resulted in steady improvement in operating margin (up 730 bps) over the last four quarters.
� Of late, the telecom sector is witnessing pricing sanity and diminishing competitive intensity. Further, with media reports suggesting Reliance Jio going public in late 2018 or early 2019, we expect a favourable competitive environment and lesser predatory pricing action.
� Industry consolidation (three-player market, with the exit of smaller players) will help Airtel to maintain its leading position in revenue market share with improving profitability. We have a Buy rating on the stock.
HDFC Bank 1,871 33 28.5 23.4 17.9 16.6 16.4 2,100 12
Remarks: � HDFC Bank has a pre-eminent presence in the retail banking segment (~50% of loan book) and has been able to maintain strong and consistent loan book growth, gradually gaining market share. Going forward, economic recovery and improved consumer sentiments would be positive growth drivers for the bank’s loan growth, which will in turn drive profitability.
� Backed by a current account and savings account (CASA) ratio of over 40% and a high proportion of retail deposits, the bank’s cost of funds remains among the lowest in the system, helping it maintain higher net interest margin (NIM). In addition, the bank’s loan book growth is driven by high-yielding retail products such as personal loans, vehicle loans, credit cards and mortgages, mostly to its own customers (which is also positive for NIM).
� HDFC Bank has been maintaining near impeccable asset quality, with its NPA ratios consistently being among the lowest versus comparable peers. The bank has been able to maintain robust asset quality, owing to stringent credit appraisal procedures and negligible exposure to troubled sectors.
� Going ahead, HDFC Bank is well poised to tap the growth opportunities due to strong capital ratios, healthy asset quality and a steady revival in consumer spending. As lending and transactions through formal routes increase, HDFC Bank would benefit since it is a leading private sector bank and will likely gain market share in this segment. The bank is expected to maintain healthy RoE of 18-20% and RoA of 1.8% on a sustainable basis. Therefore, we expect it to maintain the valuation premium that it enjoys vis-à-vis other private banks.
IndusInd Bank 1,649 34.2 26.7 20.8 16.2 16.5 18.2 1,950 18
Remarks: � IndusInd Bank is among the fastest-growing banks (25%+ CAGR over FY2012-FY2017), with a loan book of ~Rs. 1.23 lakh crore and 1,250 branches across the country. About 55% of the bank’s loan book comprises retail finance, which is a high-yielding category, and is showing signs of growth.
� Given the aggressive measures taken by the management, the deposit profile has improved considerably (CASA ratio of ~42%). Going ahead, the bank would follow a differentiated branch expansion strategy (5% branch market share in identified centres) to help ensure healthy growth in savings accounts and retail deposits.
� IndusInd Bank has maintained its asset quality despite sluggish economic growth and higher proportion of retail finance in its loan book. The bank’s asset quality is among the best in the industry, with total stressed loans (restructured loans + gross NPAs) forming less than 1.50% of the loan book.
� A likely revival in the Indian economy will further fuel growth in the bank’s consumer finance division, while strong capital ratios will support future growth plans. Although demonetisation has raised questions regarding delinquencies in certain lending segments, management expects asset quality to remain under control. The stock should continue to trade at a premium valuation, underpinned by strong loan growth, quality management, high RoAs and healthy asset quality. We have a positive outlook on IndusInd Bank.
EQUITY FUNDAMENTALS Sharekhan Top Picks
13January 2018 Sharekhan ValueGuide
Name CMP (Rs.)PER ROE (%) PRICE UPSIDE
FY17 FY18E FY19E FY17 FY18E FY19E TARGET (Rs.) (%)
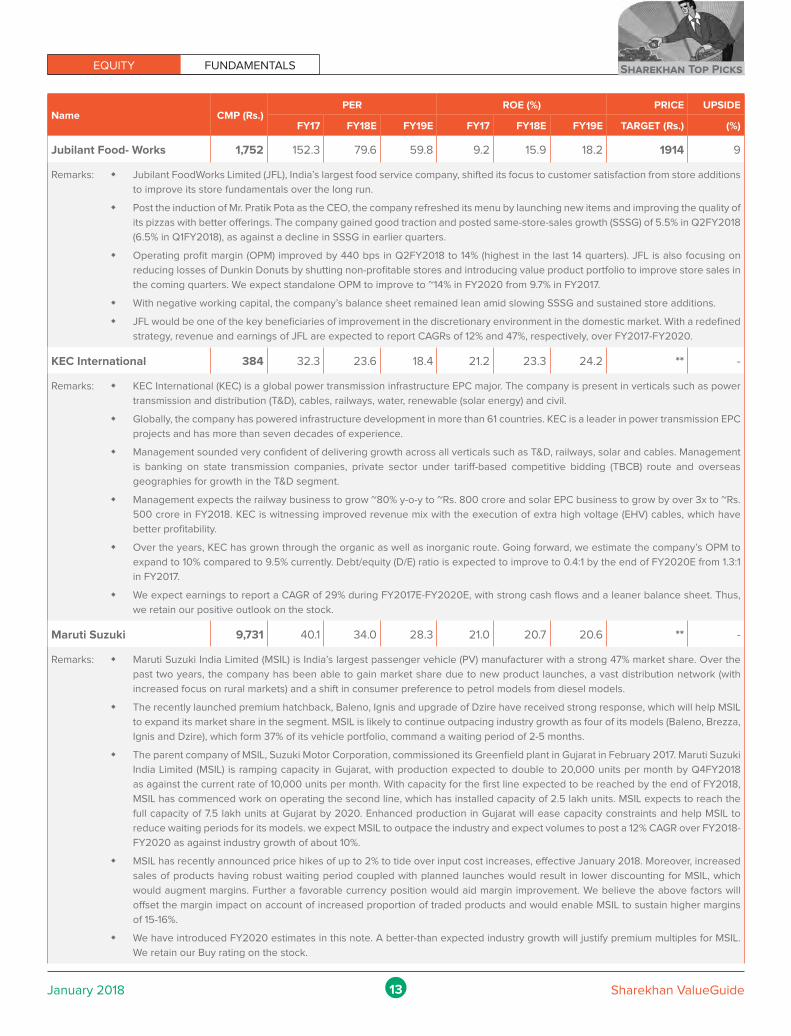
Jubilant Food- Works 1,752 152.3 79.6 59.8 9.2 15.9 18.2 1914 9
Remarks: � Jubilant FoodWorks Limited (JFL), India’s largest food service company, shifted its focus to customer satisfaction from store additions
to improve its store fundamentals over the long run.
� Post the induction of Mr. Pratik Pota as the CEO, the company refreshed its menu by launching new items and improving the quality of
its pizzas with better offerings. The company gained good traction and posted same-store-sales growth (SSSG) of 5.5% in Q2FY2018
(6.5% in Q1FY2018), as against a decline in SSSG in earlier quarters.
� Operating profit margin (OPM) improved by 440 bps in Q2FY2018 to 14% (highest in the last 14 quarters). JFL is also focusing on
reducing losses of Dunkin Donuts by shutting non-profitable stores and introducing value product portfolio to improve store sales in
the coming quarters. We expect standalone OPM to improve to ~14% in FY2020 from 9.7% in FY2017.
� With negative working capital, the company’s balance sheet remained lean amid slowing SSSG and sustained store additions.
� JFL would be one of the key beneficiaries of improvement in the discretionary environment in the domestic market. With a redefined
strategy, revenue and earnings of JFL are expected to report CAGRs of 12% and 47%, respectively, over FY2017-FY2020.
KEC International 384 32.3 23.6 18.4 21.2 23.3 24.2 ** -
Remarks: � KEC International (KEC) is a global power transmission infrastructure EPC major. The company is present in verticals such as power
transmission and distribution (T&D), cables, railways, water, renewable (solar energy) and civil.
� Globally, the company has powered infrastructure development in more than 61 countries. KEC is a leader in power transmission EPC
projects and has more than seven decades of experience.
� Management sounded very confident of delivering growth across all verticals such as T&D, railways, solar and cables. Management
is banking on state transmission companies, private sector under tariff-based competitive bidding (TBCB) route and overseas
geographies for growth in the T&D segment.
� Management expects the railway business to grow ~80% y-o-y to ~Rs. 800 crore and solar EPC business to grow by over 3x to ~Rs.
500 crore in FY2018. KEC is witnessing improved revenue mix with the execution of extra high voltage (EHV) cables, which have
better profitability.
� Over the years, KEC has grown through the organic as well as inorganic route. Going forward, we estimate the company’s OPM to
expand to 10% compared to 9.5% currently. Debt/equity (D/E) ratio is expected to improve to 0.4:1 by the end of FY2020E from 1.3:1
in FY2017.
� We expect earnings to report a CAGR of 29% during FY2017E-FY2020E, with strong cash flows and a leaner balance sheet. Thus,
we retain our positive outlook on the stock.
Maruti Suzuki 9,731 40.1 34.0 28.3 21.0 20.7 20.6 ** -
Remarks: � Maruti Suzuki India Limited (MSIL) is India’s largest passenger vehicle (PV) manufacturer with a strong 47% market share. Over the
past two years, the company has been able to gain market share due to new product launches, a vast distribution network (with
increased focus on rural markets) and a shift in consumer preference to petrol models from diesel models.
� The recently launched premium hatchback, Baleno, Ignis and upgrade of Dzire have received strong response, which will help MSIL
to expand its market share in the segment. MSIL is likely to continue outpacing industry growth as four of its models (Baleno, Brezza,
Ignis and Dzire), which form 37% of its vehicle portfolio, command a waiting period of 2-5 months.
� The parent company of MSIL, Suzuki Motor Corporation, commissioned its Greenfield plant in Gujarat in February 2017. Maruti Suzuki
India Limited (MSIL) is ramping capacity in Gujarat, with production expected to double to 20,000 units per month by Q4FY2018
as against the current rate of 10,000 units per month. With capacity for the first line expected to be reached by the end of FY2018,
MSIL has commenced work on operating the second line, which has installed capacity of 2.5 lakh units. MSIL expects to reach the
full capacity of 7.5 lakh units at Gujarat by 2020. Enhanced production in Gujarat will ease capacity constraints and help MSIL to
reduce waiting periods for its models. we expect MSIL to outpace the industry and expect volumes to post a 12% CAGR over FY2018-
FY2020 as against industry growth of about 10%.
� MSIL has recently announced price hikes of up to 2% to tide over input cost increases, effective January 2018. Moreover, increased
sales of products having robust waiting period coupled with planned launches would result in lower discounting for MSIL, which
would augment margins. Further a favorable currency position would aid margin improvement. We believe the above factors will
offset the margin impact on account of increased proportion of traded products and would enable MSIL to sustain higher margins
of 15-16%.
� We have introduced FY2020 estimates in this note. A better-than expected industry growth will justify premium multiples for MSIL.
We retain our Buy rating on the stock.
Sharekhan Top Picks EQUITY FUNDAMENTALS
14January 2018 Sharekhan ValueGuide
Name CMP (Rs.)PER ROE (%) PRICE UPSIDE
FY17 FY18E FY19E FY17 FY18E FY19E TARGET (Rs.) (%)
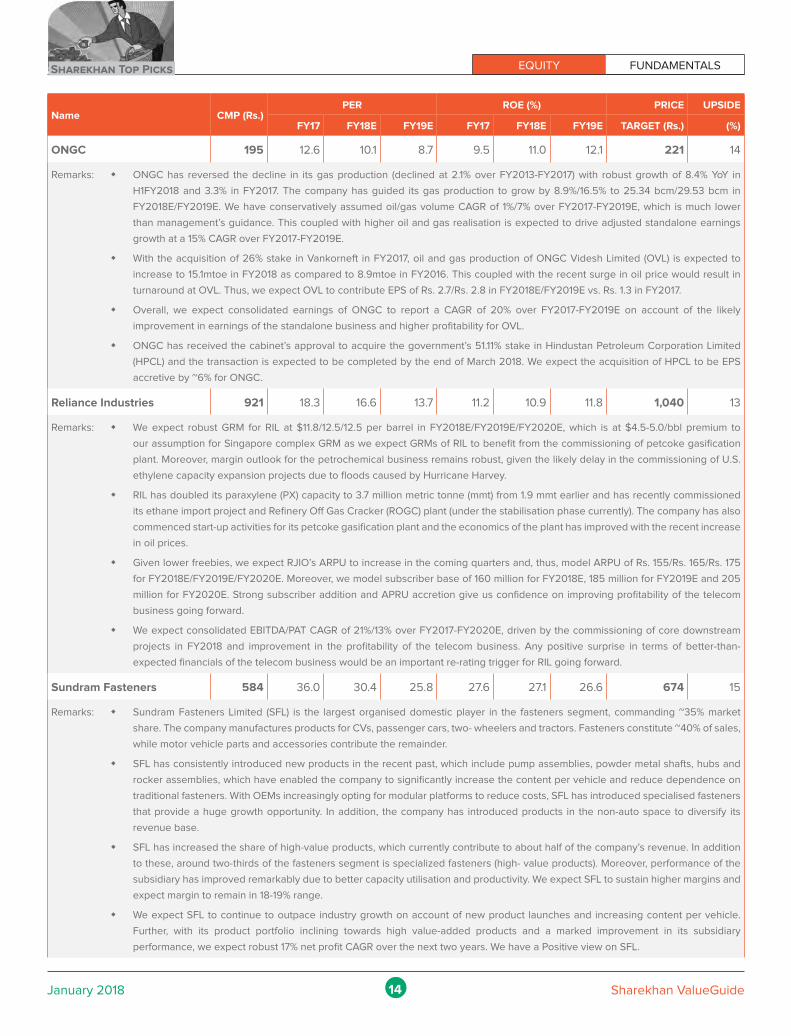
ONGC 195 12.6 10.1 8.7 9.5 11.0 12.1 221 14
Remarks: � ONGC has reversed the decline in its gas production (declined at 2.1% over FY2013-FY2017) with robust growth of 8.4% YoY in
H1FY2018 and 3.3% in FY2017. The company has guided its gas production to grow by 8.9%/16.5% to 25.34 bcm/29.53 bcm in
FY2018E/FY2019E. We have conservatively assumed oil/gas volume CAGR of 1%/7% over FY2017-FY2019E, which is much lower
than management’s guidance. This coupled with higher oil and gas realisation is expected to drive adjusted standalone earnings
growth at a 15% CAGR over FY2017-FY2019E.
� With the acquisition of 26% stake in Vankorneft in FY2017, oil and gas production of ONGC Videsh Limited (OVL) is expected to
increase to 15.1mtoe in FY2018 as compared to 8.9mtoe in FY2016. This coupled with the recent surge in oil price would result in
turnaround at OVL. Thus, we expect OVL to contribute EPS of Rs. 2.7/Rs. 2.8 in FY2018E/FY2019E vs. Rs. 1.3 in FY2017.
� Overall, we expect consolidated earnings of ONGC to report a CAGR of 20% over FY2017-FY2019E on account of the likely
improvement in earnings of the standalone business and higher profitability for OVL.
� ONGC has received the cabinet’s approval to acquire the government’s 51.11% stake in Hindustan Petroleum Corporation Limited
(HPCL) and the transaction is expected to be completed by the end of March 2018. We expect the acquisition of HPCL to be EPS
accretive by ~6% for ONGC.
Reliance Industries 921 18.3 16.6 13.7 11.2 10.9 11.8 1,040 13
Remarks: � We expect robust GRM for RIL at $11.8/12.5/12.5 per barrel in FY2018E/FY2019E/FY2020E, which is at $4.5-5.0/bbl premium to
our assumption for Singapore complex GRM as we expect GRMs of RIL to benefit from the commissioning of petcoke gasification
plant. Moreover, margin outlook for the petrochemical business remains robust, given the likely delay in the commissioning of U.S.
ethylene capacity expansion projects due to floods caused by Hurricane Harvey.
� RIL has doubled its paraxylene (PX) capacity to 3.7 million metric tonne (mmt) from 1.9 mmt earlier and has recently commissioned
its ethane import project and Refinery Off Gas Cracker (ROGC) plant (under the stabilisation phase currently). The company has also
commenced start-up activities for its petcoke gasification plant and the economics of the plant has improved with the recent increase
in oil prices.
� Given lower freebies, we expect RJIO’s ARPU to increase in the coming quarters and, thus, model ARPU of Rs. 155/Rs. 165/Rs. 175
for FY2018E/FY2019E/FY2020E. Moreover, we model subscriber base of 160 million for FY2018E, 185 million for FY2019E and 205
million for FY2020E. Strong subscriber addition and APRU accretion give us confidence on improving profitability of the telecom
business going forward.
� We expect consolidated EBITDA/PAT CAGR of 21%/13% over FY2017-FY2020E, driven by the commissioning of core downstream
projects in FY2018 and improvement in the profitability of the telecom business. Any positive surprise in terms of better-than-
expected financials of the telecom business would be an important re-rating trigger for RIL going forward.
Sundram Fasteners 584 36.0 30.4 25.8 27.6 27.1 26.6 674 15
Remarks: � Sundram Fasteners Limited (SFL) is the largest organised domestic player in the fasteners segment, commanding ~35% market
share. The company manufactures products for CVs, passenger cars, two- wheelers and tractors. Fasteners constitute ~40% of sales,
while motor vehicle parts and accessories contribute the remainder.
� SFL has consistently introduced new products in the recent past, which include pump assemblies, powder metal shafts, hubs and
rocker assemblies, which have enabled the company to significantly increase the content per vehicle and reduce dependence on
traditional fasteners. With OEMs increasingly opting for modular platforms to reduce costs, SFL has introduced specialised fasteners
that provide a huge growth opportunity. In addition, the company has introduced products in the non-auto space to diversify its
revenue base.
� SFL has increased the share of high-value products, which currently contribute to about half of the company’s revenue. In addition
to these, around two-thirds of the fasteners segment is specialized fasteners (high- value products). Moreover, performance of the
subsidiary has improved remarkably due to better capacity utilisation and productivity. We expect SFL to sustain higher margins and
expect margin to remain in 18-19% range.
� We expect SFL to continue to outpace industry growth on account of new product launches and increasing content per vehicle.
Further, with its product portfolio inclining towards high value-added products and a marked improvement in its subsidiary
performance, we expect robust 17% net profit CAGR over the next two years. We have a Positive view on SFL.
EQUITY FUNDAMENTALS Sharekhan Top Picks
15January 2018 Sharekhan ValueGuide
Name CMP (Rs.)PER ROE (%) PRICE UPSIDE
FY17 FY18E FY19E FY17 FY18E FY19E TARGET (Rs.) (%)
UPL Limited 762 21.3 18.8 15.2 27.2 25.0 25.4 980 29
Remarks: � United Phosphorous Limited (UPL) is a global generic crop protection chemicals and seeds company. UPL is the largest producer
of agrochemicals in India. The company is among the top five post-patent agrochemical manufacturers in the world. UPL has ~23
manufacturing sites, including nine in India, four in France and two in Spain. The company operates in every continent and has a
customer base in 123 countries with its own subsidiary offices.
� Management of UPL is confident of the long-term growth prospects such as 1) introduction of new products, at least two per year; 2)
improving innovation turnover index; 3) partnership with Bayer in Brazil; and 4) strong distribution network. However, FY2018E seems
to be on the softer side than anticipated earlier owing to the increase in inventory situation in Brazil, currency fluctuation and erratic
weather conditions. These will not have a major impact on long-term prospects.
� Management has guided for 8-12% growth in overall revenue on a reported basis. Constant currency growth will be still 12-15% along
with a 50-75 bps expansion in EBITDA margin in FY2018. Management also expects acceleration in growth in H2FY2018 versus
H1FY2018, owing to a late season pickup in Latin America.
� Owing to continuous product launches, UPL has managed to increase its innovation rate from 5% in FY2015 to 15% in FY2017 (it was
14% in FY2016).
� A positive outlook for geographies such as India, Europe and Latin America would also drive revenue growth going ahead. Further,
patent expiry of significant agrochemicals, the value of which is pegged at ~$4 billion over the next three years, augurs well for UPL
to leverage the opportunity.
� We see concerns around growth are overdone and believe management’s guidance for FY2018 topline growth can be comfortably
achieved on account of its strong product portfolio, new product introductions and improved demand outlook. We maintain our Buy
rating on the stock.
ZEE Entertainment 586 46.1 42.4 32.4 18.3 17.3 19.4 650 11
Remarks: � Zee Entertainment Enterprises Limited (ZEEL) continues to lead the broadcasting industry in terms of growth in advertising revenue.
ZEEL is one of the leading players in television broadcasting with a bouquet of 34+ TV channels across genres.
� ZEEL expects domestic subscriptions to grow at a low-teen CAGR for the next 3-4 years. However, the ongoing litigation on TRAI’s
tariff order is causing a delay in contract renewal negotiations with distributors.
� ZEEL expects advertisement revenue growth to be in mid-teens during H2FY2018E, as it expects clients across sectors to spend
more on advertising. Programming hours in its flagship channel, Zee TV, have reached 30 hours with new slot opening on weekends.
� ZEEL will unveil its OTT 2.0 ZEE5 (replace its current advertising video-on-demand (AVOD)-based OZEE and subscription video-
on-demand (SVOD)-based Ditto TV) in the next three months. Management expects margins to remain at around 30%+, even after
increasing programming cost in digital content.
� We continue to remain positive on ZEEL, as it is a structural India consumption theme. Moreover, the company continues to invest
across the media spectrum, including movies, music, events, digital and international markets, to maintain its high-growth trajectory.
We maintain our Buy rating on the stock.
EQUITY FUNDAMENTALSStock Update
16January 2018 Sharekhan ValueGuide
Date Company Report TypeRecommendation
Reco PricePrice Target/ Upside (%)
Latest Chg Latest Chg
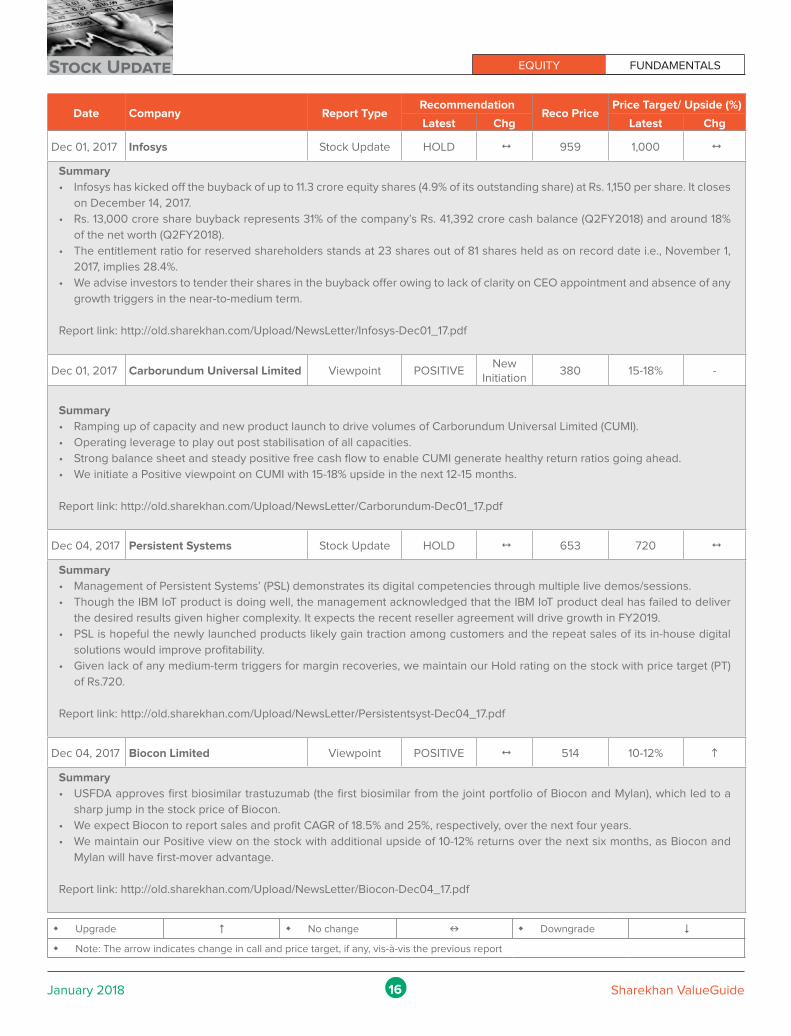
Dec 01, 2017 Infosys Stock Update HOLD 1 959 1,000 1
Summary
• Infosys has kicked off the buyback of up to 11.3 crore equity shares (4.9% of its outstanding share) at Rs. 1,150 per share. It closes
on December 14, 2017.
• Rs. 13,000 crore share buyback represents 31% of the company’s Rs. 41,392 crore cash balance (Q2FY2018) and around 18%
of the net worth (Q2FY2018).
• The entitlement ratio for reserved shareholders stands at 23 shares out of 81 shares held as on record date i.e., November 1,
2017, implies 28.4%.
• We advise investors to tender their shares in the buyback offer owing to lack of clarity on CEO appointment and absence of any
growth triggers in the near-to-medium term.
Report link: http://old.sharekhan.com/Upload/NewsLetter/Infosys-Dec01_17.pdf
Dec 01, 2017 Carborundum Universal Limited Viewpoint POSITIVENew
Initiation380 15-18% -
Summary
• Ramping up of capacity and new product launch to drive volumes of Carborundum Universal Limited (CUMI).
• Operating leverage to play out post stabilisation of all capacities.
• Strong balance sheet and steady positive free cash flow to enable CUMI generate healthy return ratios going ahead.
• We initiate a Positive viewpoint on CUMI with 15-18% upside in the next 12-15 months.
Report link: http://old.sharekhan.com/Upload/NewsLetter/Carborundum-Dec01_17.pdf
Dec 04, 2017 Persistent Systems Stock Update HOLD 1 653 720 1
Summary
• Management of Persistent Systems’ (PSL) demonstrates its digital competencies through multiple live demos/sessions.
• Though the IBM IoT product is doing well, the management acknowledged that the IBM IoT product deal has failed to deliver
the desired results given higher complexity. It expects the recent reseller agreement will drive growth in FY2019.
• PSL is hopeful the newly launched products likely gain traction among customers and the repeat sales of its in-house digital
solutions would improve profitability.
• Given lack of any medium-term triggers for margin recoveries, we maintain our Hold rating on the stock with price target (PT)
of Rs.720.
Report link: http://old.sharekhan.com/Upload/NewsLetter/Persistentsyst-Dec04_17.pdf
Dec 04, 2017 Biocon Limited Viewpoint POSITIVE 1 514 10-12% h
Summary
• USFDA approves first biosimilar trastuzumab (the first biosimilar from the joint portfolio of Biocon and Mylan), which led to a
sharp jump in the stock price of Biocon.
• We expect Biocon to report sales and profit CAGR of 18.5% and 25%, respectively, over the next four years.
• We maintain our Positive view on the stock with additional upside of 10-12% returns over the next six months, as Biocon and
Mylan will have first-mover advantage.
Report link: http://old.sharekhan.com/Upload/NewsLetter/Biocon-Dec04_17.pdf
� Upgrade � No change � Downgrade
� Note: The arrow indicates change in call and price target, if any, vis-à-vis the previous report
EQUITY FUNDAMENTALS Stock Update
17January 2018 Sharekhan ValueGuide
Date Company Report TypeRecommendation
Reco PricePrice Target/ Upside (%)
Latest Chg Latest Chg
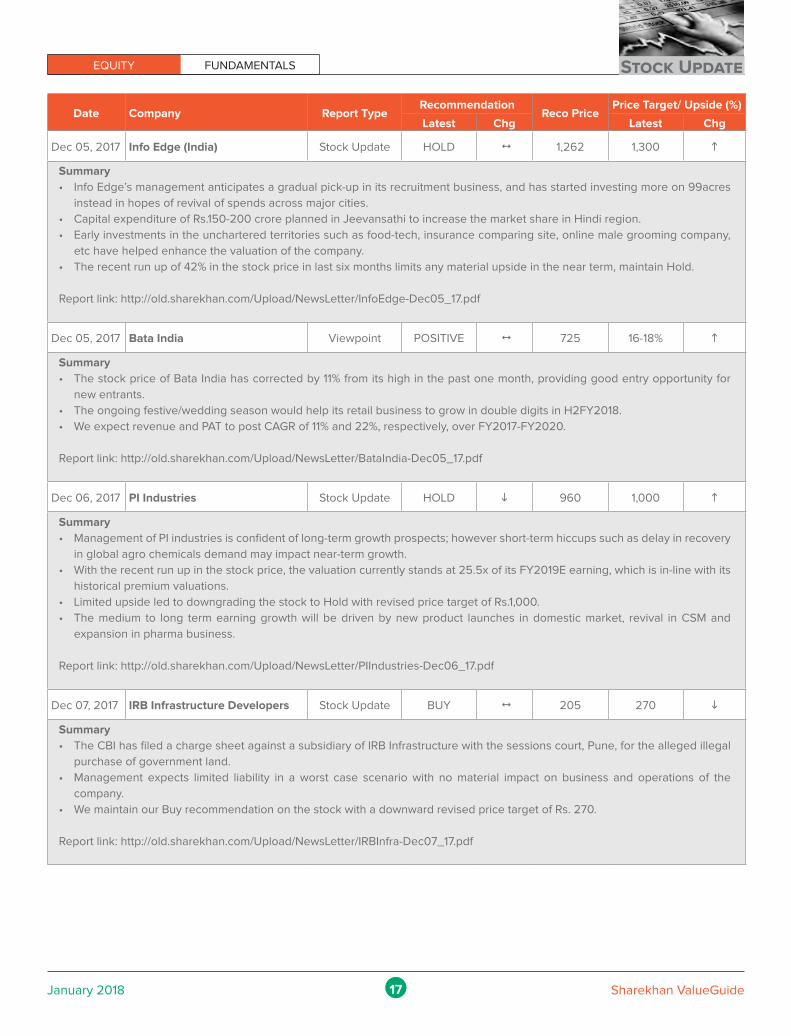
Dec 05, 2017 Info Edge (India) Stock Update HOLD 1 1,262 1,300 h
Summary
• Info Edge’s management anticipates a gradual pick-up in its recruitment business, and has started investing more on 99acres
instead in hopes of revival of spends across major cities.
• Capital expenditure of Rs.150-200 crore planned in Jeevansathi to increase the market share in Hindi region.
• Early investments in the unchartered territories such as food-tech, insurance comparing site, online male grooming company,
etc have helped enhance the valuation of the company.
• The recent run up of 42% in the stock price in last six months limits any material upside in the near term, maintain Hold.
Report link: http://old.sharekhan.com/Upload/NewsLetter/InfoEdge-Dec05_17.pdf
Dec 05, 2017 Bata India Viewpoint POSITIVE 1 725 16-18% h
Summary
• The stock price of Bata India has corrected by 11% from its high in the past one month, providing good entry opportunity for
new entrants.
• The ongoing festive/wedding season would help its retail business to grow in double digits in H2FY2018.
• We expect revenue and PAT to post CAGR of 11% and 22%, respectively, over FY2017-FY2020.
Report link: http://old.sharekhan.com/Upload/NewsLetter/BataIndia-Dec05_17.pdf
Dec 06, 2017 PI Industries Stock Update HOLD i 960 1,000 h
Summary
• Management of PI industries is confident of long-term growth prospects; however short-term hiccups such as delay in recovery
in global agro chemicals demand may impact near-term growth.
• With the recent run up in the stock price, the valuation currently stands at 25.5x of its FY2019E earning, which is in-line with its
historical premium valuations.
• Limited upside led to downgrading the stock to Hold with revised price target of Rs.1,000.
• The medium to long term earning growth will be driven by new product launches in domestic market, revival in CSM and
expansion in pharma business.
Report link: http://old.sharekhan.com/Upload/NewsLetter/PIIndustries-Dec06_17.pdf
Dec 07, 2017 IRB Infrastructure Developers Stock Update BUY 1 205 270 i
Summary
• The CBI has filed a charge sheet against a subsidiary of IRB Infrastructure with the sessions court, Pune, for the alleged illegal
purchase of government land.
• Management expects limited liability in a worst case scenario with no material impact on business and operations of the
company.
• We maintain our Buy recommendation on the stock with a downward revised price target of Rs. 270.
Report link: http://old.sharekhan.com/Upload/NewsLetter/IRBInfra-Dec07_17.pdf

EQUITY FUNDAMENTALSStock Update
18January 2018 Sharekhan ValueGuide
Date Company Report TypeRecommendation
Reco PricePrice Target/ Upside (%)
Latest Chg Latest Chg
Dec 07, 2017 ION Exchange Viewpoint POSITIVENew
Initiation420 15-20% -
Summary
• Execution begins on sizeable water supply project of Rs. 1250 crore by the engineering division of ION Exchange.
• Visible shift from private sector to Municipal projects for providing water management solutions enhances addressable market,
engineering division a clear winner with order book of Rs. 500 crore.
• Earnings expected to compound at 26% over same time-frame. We thus initiate a positive view on the stock and expect a 15-
20% upside over the next 6-8 months.
Report link: http://old.sharekhan.com/Upload/NewsLetter/IONExchange-Dec07_17.pdf
Dec 08, 2017 Federal Bank Stock Update BUY 1 109 145 1
Summary
• A multi-channel business approach to target corporate, SME and retail loans through its existing leads to growth traction in its
loan book . Corporate loan book surges up by 38% yoy.
• The bank plans for a vertical expansion in its operational domain by foraying into the mutual fund and/or microfinance business.
• Federal Bank is also planning to divest 26% stake in its wholly owned subsidiary FedBank Financial Services In an event of
successful divestment, Federal Bank would witness a boost in its capital adequacy, without equity dilution, which will be a
positive.
• Since our last report dated (October 16, 2017) the stock price has corrected by 12.0% which we believe provides a good
opportunity to add for better gains, given the various positives stated above.
Report link: http://old.sharekhan.com/Upload/NewsLetter/FederalBank-Dec08_17.pdf
Dec 11, 2017 Dabur India Viewpoint POSITIVENew
Initiation350 16-18% -
Summary
• Dabur India Ltd (Dabur) is a trusted brand with strong footing in natural healthcare products and presence in low penetrated
categories.
• A pick up in rural demand (contributes ~50% of total revenues) would aid in improving the domestic business volume growth.
• One of the stable balance sheets amongst the peers with healthy dividend payout of ~40%.
• We have positive view on the stock with 16-18% upside from the current levels.
Report link: http://old.sharekhan.com/Upload/NewsLetter/DaburIndia-Dec11_17.pdf
Dec 12, 2017 Sadbhav Engineering Stock Update BUY 1 370 443 h
Summary
• Sadbhav Engineering to benefit as subsidiary Sadbhav Infrastructure Project Ltd (SIPL) has bagged new orders and received
appointed dates to commence construction.
• Company expects order inflow to the tune of Rs. 7,000 crore during FY2018 out of which it has already bagged Rs. 3,500 crore
during H1FY2018.
• The government’s approval for Rs. 7 lakh crore of highway projects is expected to yield significant opportunities for Sadbhav
Engineering.
• We maintain our Buy rating on the stock, with a higher PT of Rs. 443 given the company’s expertise in timely execution, focus
on improving balance sheet and generating higher cash flows.
Report link: http://old.sharekhan.com/Upload/NewsLetter/SadbhavEngg-Dec12_17.pdf
EQUITY FUNDAMENTALS Stock Update
19January 2018 Sharekhan ValueGuide
Date Company Report TypeRecommendation
Reco PricePrice Target/ Upside (%)
Latest Chg Latest Chg
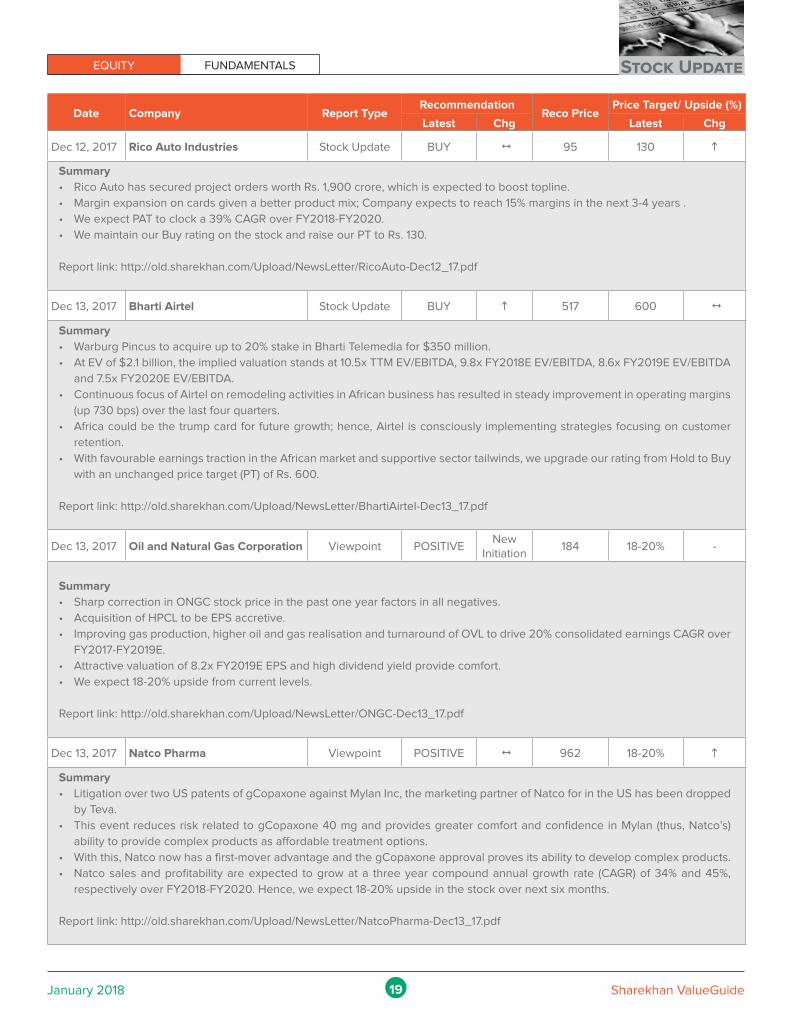
Dec 12, 2017 Rico Auto Industries Stock Update BUY 1 95 130 h
Summary
• Rico Auto has secured project orders worth Rs. 1,900 crore, which is expected to boost topline.
• Margin expansion on cards given a better product mix; Company expects to reach 15% margins in the next 3-4 years .
• We expect PAT to clock a 39% CAGR over FY2018-FY2020.
• We maintain our Buy rating on the stock and raise our PT to Rs. 130.
Report link: http://old.sharekhan.com/Upload/NewsLetter/RicoAuto-Dec12_17.pdf
Dec 13, 2017 Bharti Airtel Stock Update BUY h 517 600 1
Summary
• Warburg Pincus to acquire up to 20% stake in Bharti Telemedia for $350 million.
• At EV of $2.1 billion, the implied valuation stands at 10.5x TTM EV/EBITDA, 9.8x FY2018E EV/EBITDA, 8.6x FY2019E EV/EBITDA
and 7.5x FY2020E EV/EBITDA.
• Continuous focus of Airtel on remodeling activities in African business has resulted in steady improvement in operating margins
(up 730 bps) over the last four quarters.
• Africa could be the trump card for future growth; hence, Airtel is consciously implementing strategies focusing on customer
retention.
• With favourable earnings traction in the African market and supportive sector tailwinds, we upgrade our rating from Hold to Buy
with an unchanged price target (PT) of Rs. 600.
Report link: http://old.sharekhan.com/Upload/NewsLetter/BhartiAirtel-Dec13_17.pdf
Dec 13, 2017 Oil and Natural Gas Corporation Viewpoint POSITIVENew
Initiation184 18-20% -
Summary
• Sharp correction in ONGC stock price in the past one year factors in all negatives.
• Acquisition of HPCL to be EPS accretive.
• Improving gas production, higher oil and gas realisation and turnaround of OVL to drive 20% consolidated earnings CAGR over
FY2017-FY2019E.
• Attractive valuation of 8.2x FY2019E EPS and high dividend yield provide comfort.
• We expect 18-20% upside from current levels.
Report link: http://old.sharekhan.com/Upload/NewsLetter/ONGC-Dec13_17.pdf
Dec 13, 2017 Natco Pharma Viewpoint POSITIVE 1 962 18-20% h
Summary
• Litigation over two US patents of gCopaxone against Mylan Inc, the marketing partner of Natco for in the US has been dropped
by Teva.
• This event reduces risk related to gCopaxone 40 mg and provides greater comfort and confidence in Mylan (thus, Natco’s)
ability to provide complex products as affordable treatment options.
• With this, Natco now has a first-mover advantage and the gCopaxone approval proves its ability to develop complex products.
• Natco sales and profitability are expected to grow at a three year compound annual growth rate (CAGR) of 34% and 45%,
respectively over FY2018-FY2020. Hence, we expect 18-20% upside in the stock over next six months.
Report link: http://old.sharekhan.com/Upload/NewsLetter/NatcoPharma-Dec13_17.pdf
EQUITY FUNDAMENTALSStock Update
20January 2018 Sharekhan ValueGuide
Date Company Report TypeRecommendation
Reco PricePrice Target/ Upside (%)
Latest Chg Latest Chg
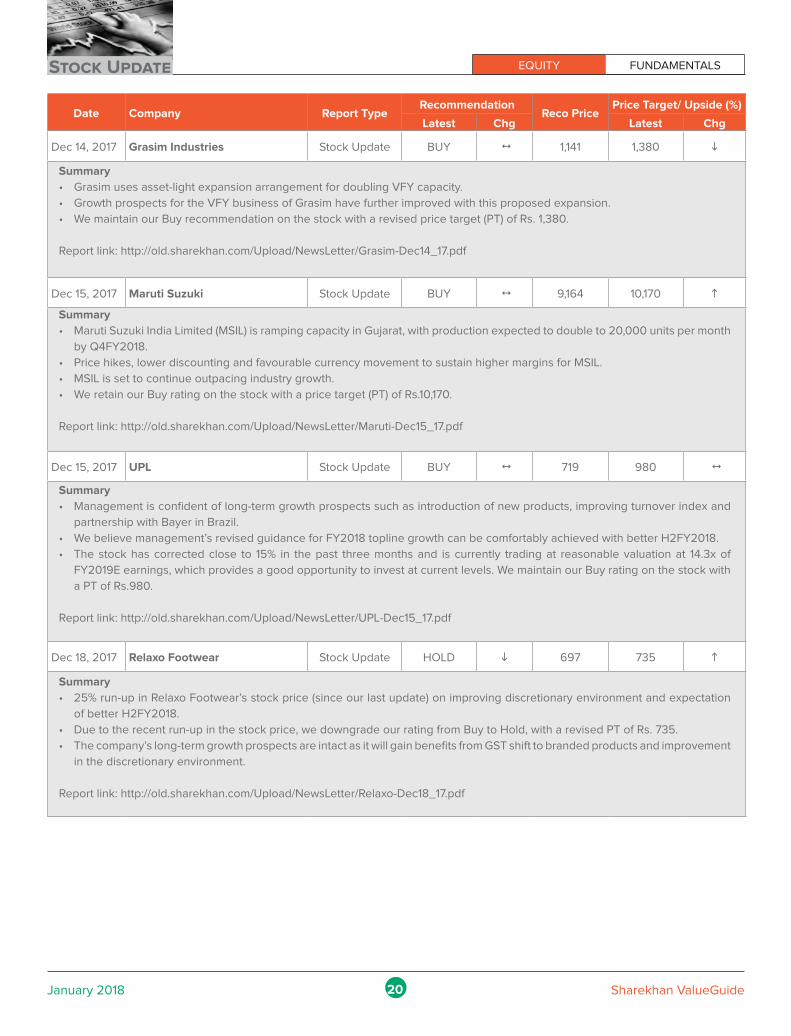
Dec 14, 2017 Grasim Industries Stock Update BUY 1 1,141 1,380 i
Summary
• Grasim uses asset-light expansion arrangement for doubling VFY capacity.
• Growth prospects for the VFY business of Grasim have further improved with this proposed expansion.
• We maintain our Buy recommendation on the stock with a revised price target (PT) of Rs. 1,380.
Report link: http://old.sharekhan.com/Upload/NewsLetter/Grasim-Dec14_17.pdf
Dec 15, 2017 Maruti Suzuki Stock Update BUY 1 9,164 10,170 h
Summary
• Maruti Suzuki India Limited (MSIL) is ramping capacity in Gujarat, with production expected to double to 20,000 units per month
by Q4FY2018.
• Price hikes, lower discounting and favourable currency movement to sustain higher margins for MSIL.
• MSIL is set to continue outpacing industry growth.
• We retain our Buy rating on the stock with a price target (PT) of Rs.10,170.
Report link: http://old.sharekhan.com/Upload/NewsLetter/Maruti-Dec15_17.pdf
Dec 15, 2017 UPL Stock Update BUY 1 719 980 1
Summary
• Management is confident of long-term growth prospects such as introduction of new products, improving turnover index and
partnership with Bayer in Brazil.
• We believe management’s revised guidance for FY2018 topline growth can be comfortably achieved with better H2FY2018.
• The stock has corrected close to 15% in the past three months and is currently trading at reasonable valuation at 14.3x of
FY2019E earnings, which provides a good opportunity to invest at current levels. We maintain our Buy rating on the stock with
a PT of Rs.980.
Report link: http://old.sharekhan.com/Upload/NewsLetter/UPL-Dec15_17.pdf
Dec 18, 2017 Relaxo Footwear Stock Update HOLD i 697 735 h
Summary
• 25% run-up in Relaxo Footwear’s stock price (since our last update) on improving discretionary environment and expectation
of better H2FY2018.
• Due to the recent run-up in the stock price, we downgrade our rating from Buy to Hold, with a revised PT of Rs. 735.
• The company’s long-term growth prospects are intact as it will gain benefits from GST shift to branded products and improvement
in the discretionary environment.
Report link: http://old.sharekhan.com/Upload/NewsLetter/Relaxo-Dec18_17.pdf
EQUITY FUNDAMENTALS Stock Update
21January 2018 Sharekhan ValueGuide
Date Company Report TypeRecommendation
Reco PricePrice Target/ Upside (%)
Latest Chg Latest Chg
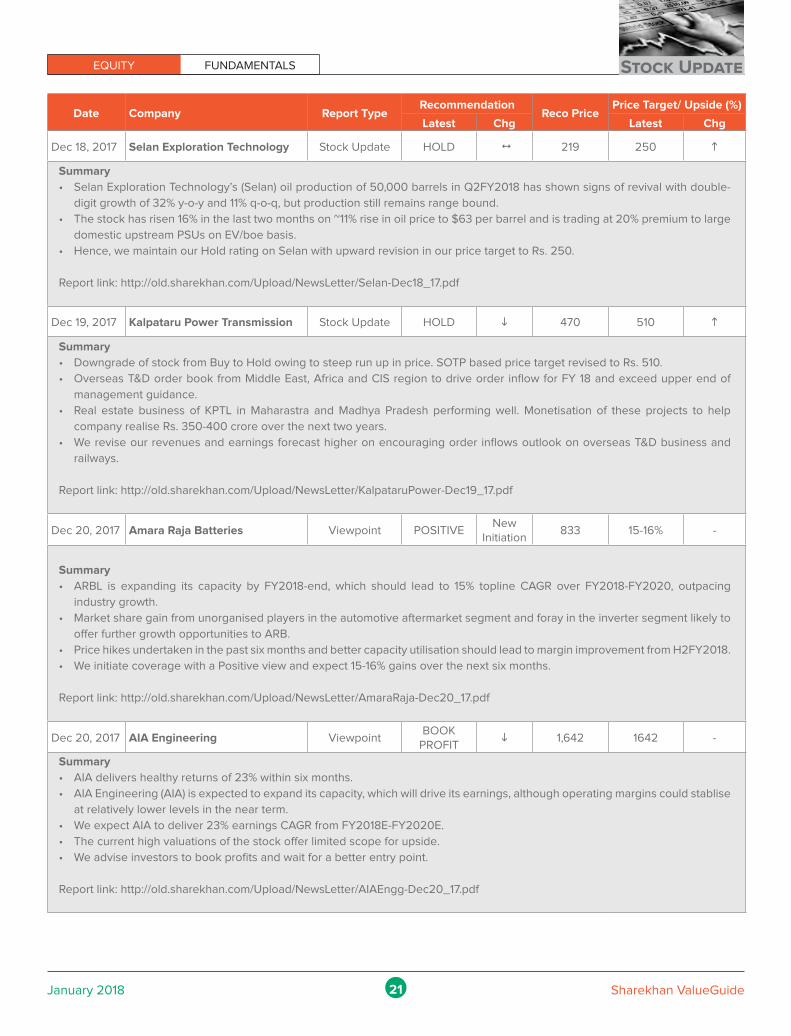
Dec 18, 2017 Selan Exploration Technology Stock Update HOLD 1 219 250 h
Summary
• Selan Exploration Technology’s (Selan) oil production of 50,000 barrels in Q2FY2018 has shown signs of revival with double-
digit growth of 32% y-o-y and 11% q-o-q, but production still remains range bound.
• The stock has risen 16% in the last two months on ~11% rise in oil price to $63 per barrel and is trading at 20% premium to large
domestic upstream PSUs on EV/boe basis.
• Hence, we maintain our Hold rating on Selan with upward revision in our price target to Rs. 250.
Report link: http://old.sharekhan.com/Upload/NewsLetter/Selan-Dec18_17.pdf
Dec 19, 2017 Kalpataru Power Transmission Stock Update HOLD i 470 510 h
Summary
• Downgrade of stock from Buy to Hold owing to steep run up in price. SOTP based price target revised to Rs. 510.
• Overseas T&D order book from Middle East, Africa and CIS region to drive order inflow for FY 18 and exceed upper end of
management guidance.
• Real estate business of KPTL in Maharastra and Madhya Pradesh performing well. Monetisation of these projects to help
company realise Rs. 350-400 crore over the next two years.
• We revise our revenues and earnings forecast higher on encouraging order inflows outlook on overseas T&D business and
railways.
Report link: http://old.sharekhan.com/Upload/NewsLetter/KalpataruPower-Dec19_17.pdf
Dec 20, 2017 Amara Raja Batteries Viewpoint POSITIVENew
Initiation833 15-16% -
Summary
• ARBL is expanding its capacity by FY2018-end, which should lead to 15% topline CAGR over FY2018-FY2020, outpacing
industry growth.
• Market share gain from unorganised players in the automotive aftermarket segment and foray in the inverter segment likely to
offer further growth opportunities to ARB.
• Price hikes undertaken in the past six months and better capacity utilisation should lead to margin improvement from H2FY2018.
• We initiate coverage with a Positive view and expect 15-16% gains over the next six months.
Report link: http://old.sharekhan.com/Upload/NewsLetter/AmaraRaja-Dec20_17.pdf
Dec 20, 2017 AIA Engineering ViewpointBOOK
PROFITi 1,642 1642 -
Summary
• AIA delivers healthy returns of 23% within six months.
• AIA Engineering (AIA) is expected to expand its capacity, which will drive its earnings, although operating margins could stablise
at relatively lower levels in the near term.
• We expect AIA to deliver 23% earnings CAGR from FY2018E-FY2020E.
• The current high valuations of the stock offer limited scope for upside.
• We advise investors to book profits and wait for a better entry point.
Report link: http://old.sharekhan.com/Upload/NewsLetter/AIAEngg-Dec20_17.pdf
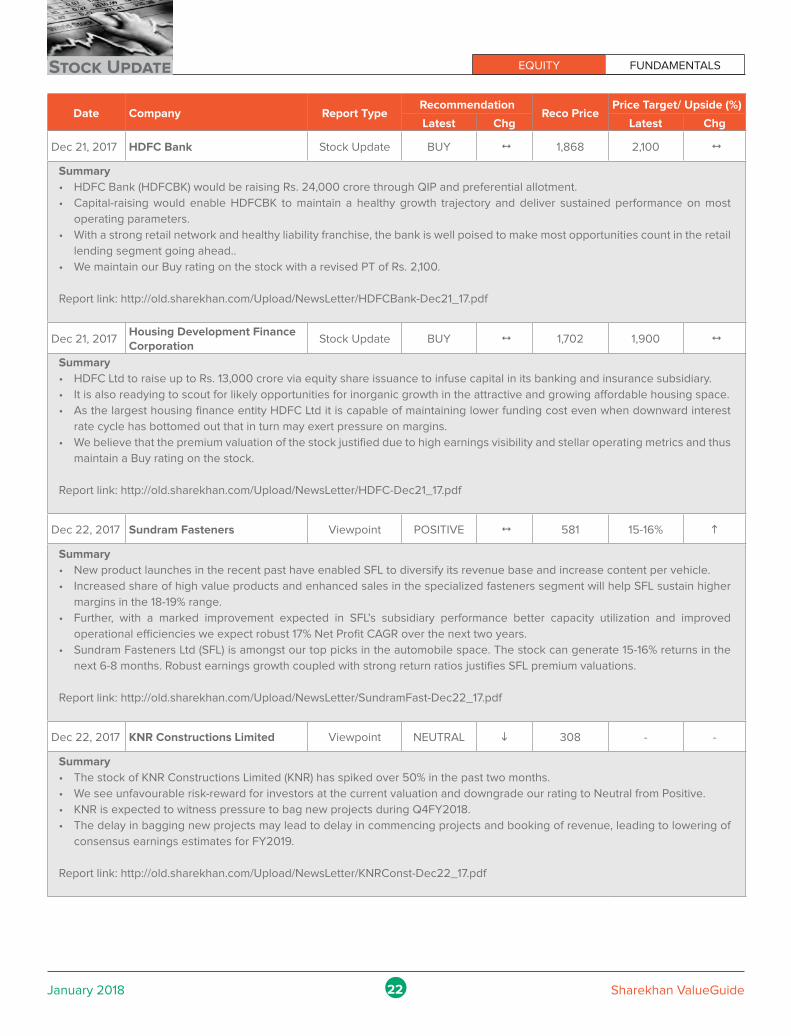
EQUITY FUNDAMENTALSStock Update
22January 2018 Sharekhan ValueGuide
Date Company Report TypeRecommendation
Reco PricePrice Target/ Upside (%)
Latest Chg Latest Chg
Dec 21, 2017 HDFC Bank Stock Update BUY 1 1,868 2,100 1
Summary
• HDFC Bank (HDFCBK) would be raising Rs. 24,000 crore through QIP and preferential allotment.
• Capital-raising would enable HDFCBK to maintain a healthy growth trajectory and deliver sustained performance on most
operating parameters.
• With a strong retail network and healthy liability franchise, the bank is well poised to make most opportunities count in the retail
lending segment going ahead..
• We maintain our Buy rating on the stock with a revised PT of Rs. 2,100.
Report link: http://old.sharekhan.com/Upload/NewsLetter/HDFCBank-Dec21_17.pdf
Dec 21, 2017Housing Development Finance Corporation
Stock Update BUY 1 1,702 1,900 1
Summary
• HDFC Ltd to raise up to Rs. 13,000 crore via equity share issuance to infuse capital in its banking and insurance subsidiary.
• It is also readying to scout for likely opportunities for inorganic growth in the attractive and growing affordable housing space.
• As the largest housing finance entity HDFC Ltd it is capable of maintaining lower funding cost even when downward interest
rate cycle has bottomed out that in turn may exert pressure on margins.
• We believe that the premium valuation of the stock justified due to high earnings visibility and stellar operating metrics and thus
maintain a Buy rating on the stock.
Report link: http://old.sharekhan.com/Upload/NewsLetter/HDFC-Dec21_17.pdf
Dec 22, 2017 Sundram Fasteners Viewpoint POSITIVE 1 581 15-16% h
Summary
• New product launches in the recent past have enabled SFL to diversify its revenue base and increase content per vehicle.
• Increased share of high value products and enhanced sales in the specialized fasteners segment will help SFL sustain higher
margins in the 18-19% range.
• Further, with a marked improvement expected in SFL’s subsidiary performance better capacity utilization and improved
operational efficiencies we expect robust 17% Net Profit CAGR over the next two years.
• Sundram Fasteners Ltd (SFL) is amongst our top picks in the automobile space. The stock can generate 15-16% returns in the
next 6-8 months. Robust earnings growth coupled with strong return ratios justifies SFL premium valuations.
Report link: http://old.sharekhan.com/Upload/NewsLetter/SundramFast-Dec22_17.pdf
Dec 22, 2017 KNR Constructions Limited Viewpoint NEUTRAL i 308 - -
Summary
• The stock of KNR Constructions Limited (KNR) has spiked over 50% in the past two months.
• We see unfavourable risk-reward for investors at the current valuation and downgrade our rating to Neutral from Positive.
• KNR is expected to witness pressure to bag new projects during Q4FY2018.
• The delay in bagging new projects may lead to delay in commencing projects and booking of revenue, leading to lowering of
consensus earnings estimates for FY2019.
Report link: http://old.sharekhan.com/Upload/NewsLetter/KNRConst-Dec22_17.pdf
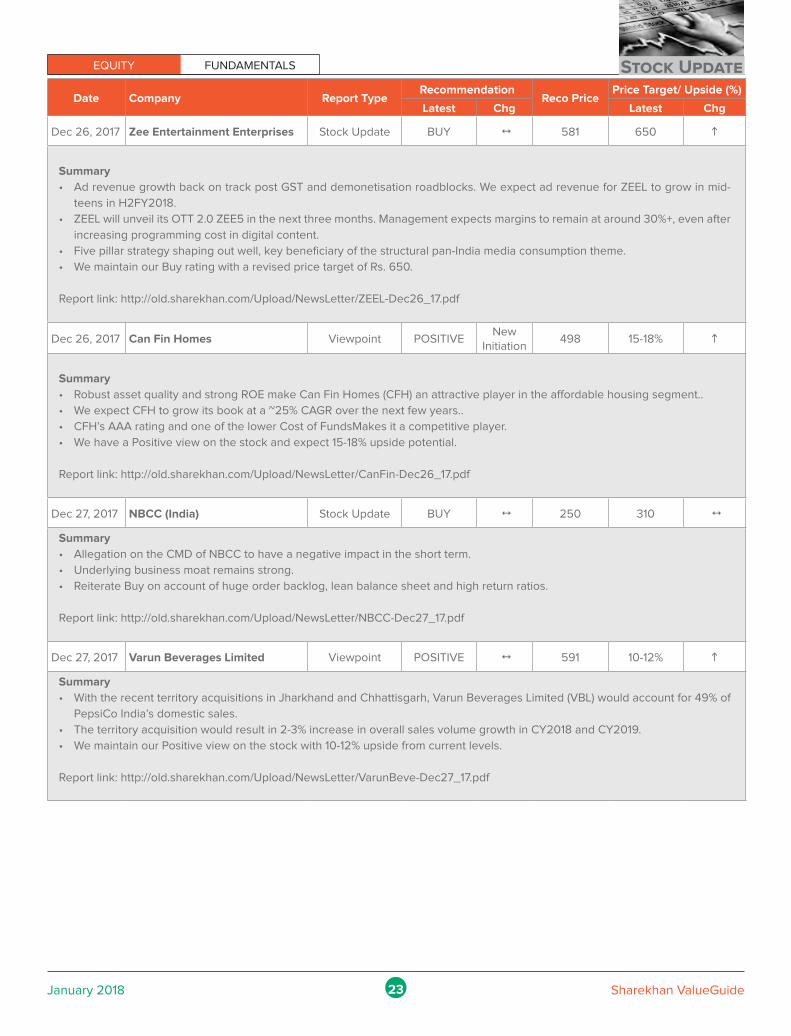
EQUITY FUNDAMENTALS Stock Update
23January 2018 Sharekhan ValueGuide
Date Company Report TypeRecommendation
Reco PricePrice Target/ Upside (%)
Latest Chg Latest Chg
Dec 26, 2017 Zee Entertainment Enterprises Stock Update BUY 1 581 650 h
Summary
• Ad revenue growth back on track post GST and demonetisation roadblocks. We expect ad revenue for ZEEL to grow in mid-
teens in H2FY2018.
• ZEEL will unveil its OTT 2.0 ZEE5 in the next three months. Management expects margins to remain at around 30%+, even after
increasing programming cost in digital content.
• Five pillar strategy shaping out well, key beneficiary of the structural pan-India media consumption theme.
• We maintain our Buy rating with a revised price target of Rs. 650.
Report link: http://old.sharekhan.com/Upload/NewsLetter/ZEEL-Dec26_17.pdf
Dec 26, 2017 Can Fin Homes Viewpoint POSITIVENew
Initiation498 15-18% h
Summary
• Robust asset quality and strong ROE make Can Fin Homes (CFH) an attractive player in the affordable housing segment..
• We expect CFH to grow its book at a ~25% CAGR over the next few years..
• CFH’s AAA rating and one of the lower Cost of FundsMakes it a competitive player.
• We have a Positive view on the stock and expect 15-18% upside potential.
Report link: http://old.sharekhan.com/Upload/NewsLetter/CanFin-Dec26_17.pdf
Dec 27, 2017 NBCC (India) Stock Update BUY 1 250 310 1
Summary
• Allegation on the CMD of NBCC to have a negative impact in the short term.
• Underlying business moat remains strong.
• Reiterate Buy on account of huge order backlog, lean balance sheet and high return ratios.
Report link: http://old.sharekhan.com/Upload/NewsLetter/NBCC-Dec27_17.pdf
Dec 27, 2017 Varun Beverages Limited Viewpoint POSITIVE 1 591 10-12% h
Summary
• With the recent territory acquisitions in Jharkhand and Chhattisgarh, Varun Beverages Limited (VBL) would account for 49% of
PepsiCo India’s domestic sales.
• The territory acquisition would result in 2-3% increase in overall sales volume growth in CY2018 and CY2019.
• We maintain our Positive view on the stock with 10-12% upside from current levels.
Report link: http://old.sharekhan.com/Upload/NewsLetter/VarunBeve-Dec27_17.pdf
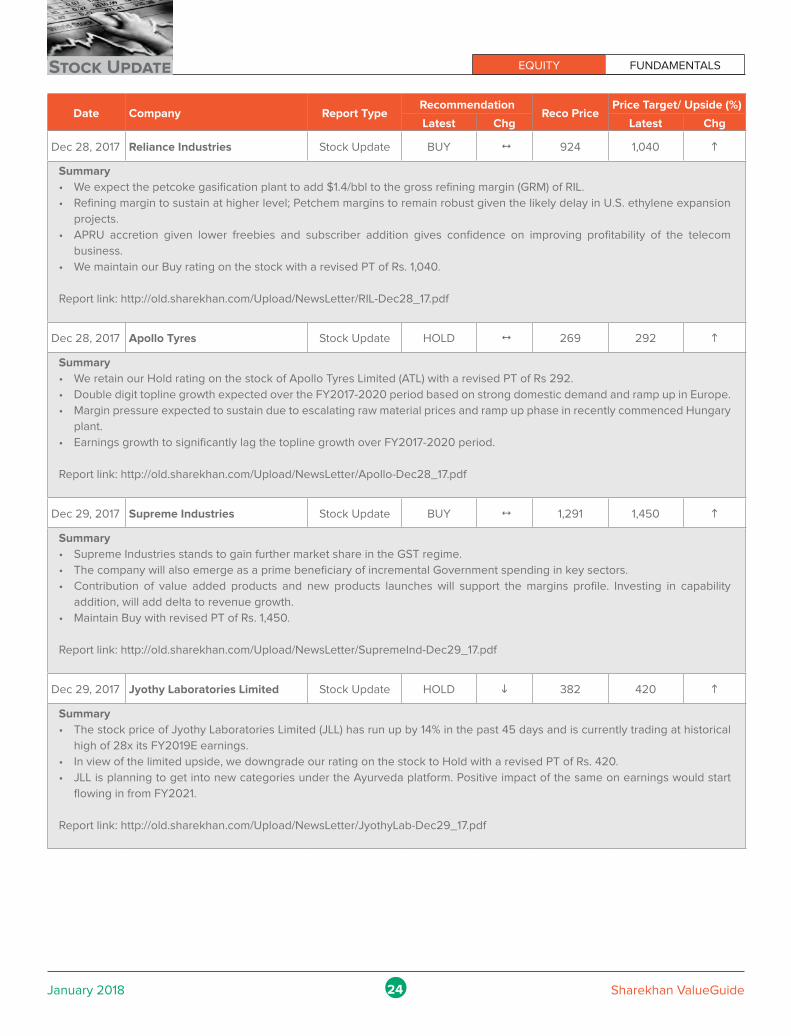
EQUITY FUNDAMENTALSStock Update
24January 2018 Sharekhan ValueGuide
Date Company Report TypeRecommendation
Reco PricePrice Target/ Upside (%)
Latest Chg Latest Chg
Dec 28, 2017 Reliance Industries Stock Update BUY 1 924 1,040 h
Summary
• We expect the petcoke gasification plant to add $1.4/bbl to the gross refining margin (GRM) of RIL.
• Refining margin to sustain at higher level; Petchem margins to remain robust given the likely delay in U.S. ethylene expansion
projects.
• APRU accretion given lower freebies and subscriber addition gives confidence on improving profitability of the telecom
business.
• We maintain our Buy rating on the stock with a revised PT of Rs. 1,040.
Report link: http://old.sharekhan.com/Upload/NewsLetter/RIL-Dec28_17.pdf
Dec 28, 2017 Apollo Tyres Stock Update HOLD 1 269 292 h
Summary
• We retain our Hold rating on the stock of Apollo Tyres Limited (ATL) with a revised PT of Rs 292.
• Double digit topline growth expected over the FY2017-2020 period based on strong domestic demand and ramp up in Europe.
• Margin pressure expected to sustain due to escalating raw material prices and ramp up phase in recently commenced Hungary
plant.
• Earnings growth to significantly lag the topline growth over FY2017-2020 period.
Report link: http://old.sharekhan.com/Upload/NewsLetter/Apollo-Dec28_17.pdf
Dec 29, 2017 Supreme Industries Stock Update BUY 1 1,291 1,450 h
Summary
• Supreme Industries stands to gain further market share in the GST regime.
• The company will also emerge as a prime beneficiary of incremental Government spending in key sectors.
• Contribution of value added products and new products launches will support the margins profile. Investing in capability
addition, will add delta to revenue growth.
• Maintain Buy with revised PT of Rs. 1,450.
Report link: http://old.sharekhan.com/Upload/NewsLetter/SupremeInd-Dec29_17.pdf
Dec 29, 2017 Jyothy Laboratories Limited Stock Update HOLD i 382 420 h
Summary
• The stock price of Jyothy Laboratories Limited (JLL) has run up by 14% in the past 45 days and is currently trading at historical
high of 28x its FY2019E earnings.
• In view of the limited upside, we downgrade our rating on the stock to Hold with a revised PT of Rs. 420.
• JLL is planning to get into new categories under the Ayurveda platform. Positive impact of the same on earnings would start
flowing in from FY2021.
Report link: http://old.sharekhan.com/Upload/NewsLetter/JyothyLab-Dec29_17.pdf
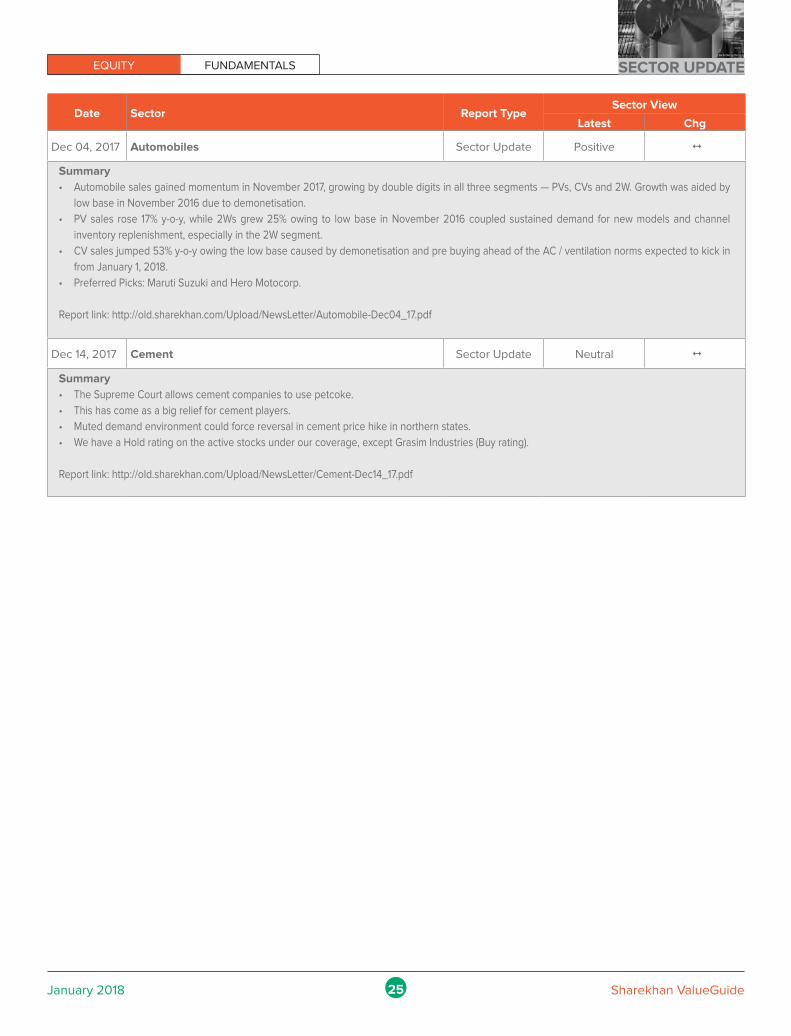
EQUITY FUNDAMENTALS SECTOR UPDATE
25January 2018 Sharekhan ValueGuide
Date Sector Report TypeSector View
Latest Chg
Dec 04, 2017 Automobiles Sector Update Positive 1
Summary
• Automobile sales gained momentum in November 2017, growing by double digits in all three segments — PVs, CVs and 2W. Growth was aided by
low base in November 2016 due to demonetisation.
• PV sales rose 17% y-o-y, while 2Ws grew 25% owing to low base in November 2016 coupled sustained demand for new models and channel
inventory replenishment, especially in the 2W segment.
• CV sales jumped 53% y-o-y owing the low base caused by demonetisation and pre buying ahead of the AC / ventilation norms expected to kick in
from January 1, 2018.
• Preferred Picks: Maruti Suzuki and Hero Motocorp.
Report link: http://old.sharekhan.com/Upload/NewsLetter/Automobile-Dec04_17.pdf
Dec 14, 2017 Cement Sector Update Neutral 1
Summary
• The Supreme Court allows cement companies to use petcoke.
• This has come as a big relief for cement players.
• Muted demand environment could force reversal in cement price hike in northern states.
• We have a Hold rating on the active stocks under our coverage, except Grasim Industries (Buy rating).
Report link: http://old.sharekhan.com/Upload/NewsLetter/Cement-Dec14_17.pdf
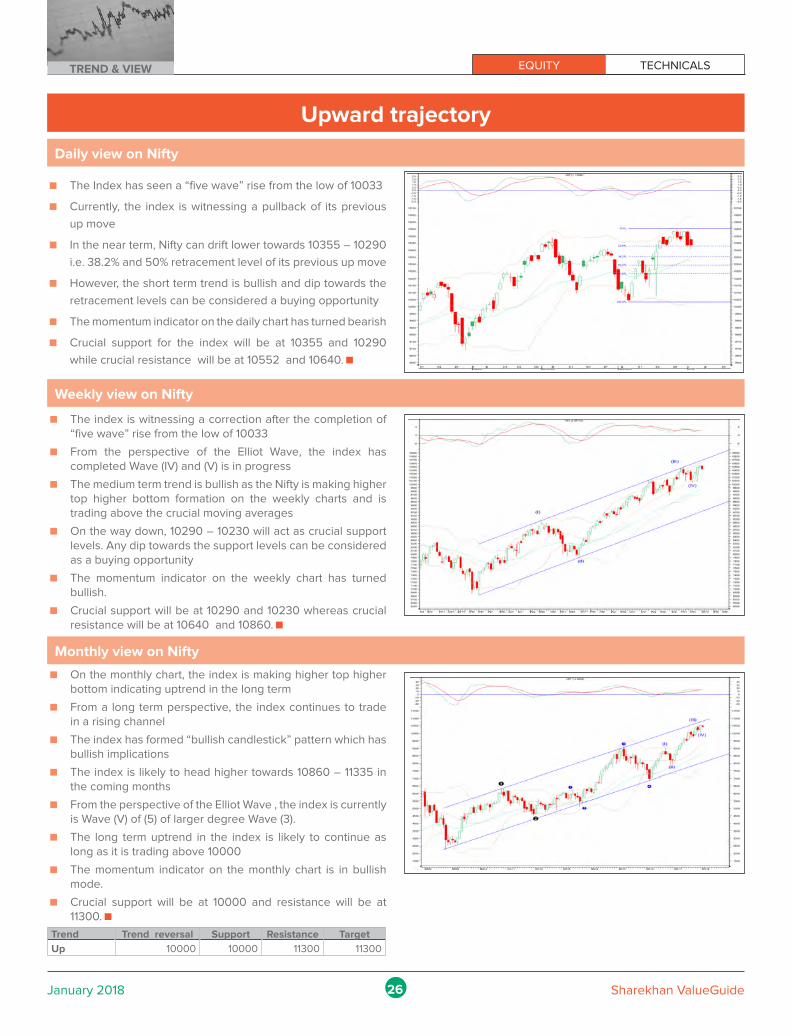
EQUITY TECHNICALSTREND & VIEW
26January 2018 Sharekhan ValueGuide
Upward trajectory
Daily view on Nifty
� The Index has seen a “five wave” rise from the low of 10033
� Currently, the index is witnessing a pullback of its previous
up move
� In the near term, Nifty can drift lower towards 10355 – 10290
i.e. 38.2% and 50% retracement level of its previous up move
� However, the short term trend is bullish and dip towards the
retracement levels can be considered a buying opportunity
� The momentum indicator on the daily chart has turned bearish
� Crucial support for the index will be at 10355 and 10290
while crucial resistance will be at 10552 and 10640.
� The index is witnessing a correction after the completion of “five wave” rise from the low of 10033
� From the perspective of the Elliot Wave, the index has completed Wave (IV) and (V) is in progress
� The medium term trend is bullish as the Nifty is making higher top higher bottom formation on the weekly charts and is trading above the crucial moving averages
� On the way down, 10290 – 10230 will act as crucial support levels. Any dip towards the support levels can be considered as a buying opportunity
� The momentum indicator on the weekly chart has turned bullish.
� Crucial support will be at 10290 and 10230 whereas crucial resistance will be at 10640 and 10860.
� On the monthly chart, the index is making higher top higher bottom indicating uptrend in the long term
� From a long term perspective, the index continues to trade in a rising channel
� The index has formed “bullish candlestick” pattern which has bullish implications
� The index is likely to head higher towards 10860 – 11335 in the coming months
� From the perspective of the Elliot Wave , the index is currently is Wave (V) of (5) of larger degree Wave (3).
� The long term uptrend in the index is likely to continue as long as it is trading above 10000
� The momentum indicator on the monthly chart is in bullish mode.
� Crucial support will be at 10000 and resistance will be at 11300.
Weekly view on Nifty
Monthly view on Nifty
Trend Trend reversal Support Resistance Target
Up 10000 10000 11300 11300
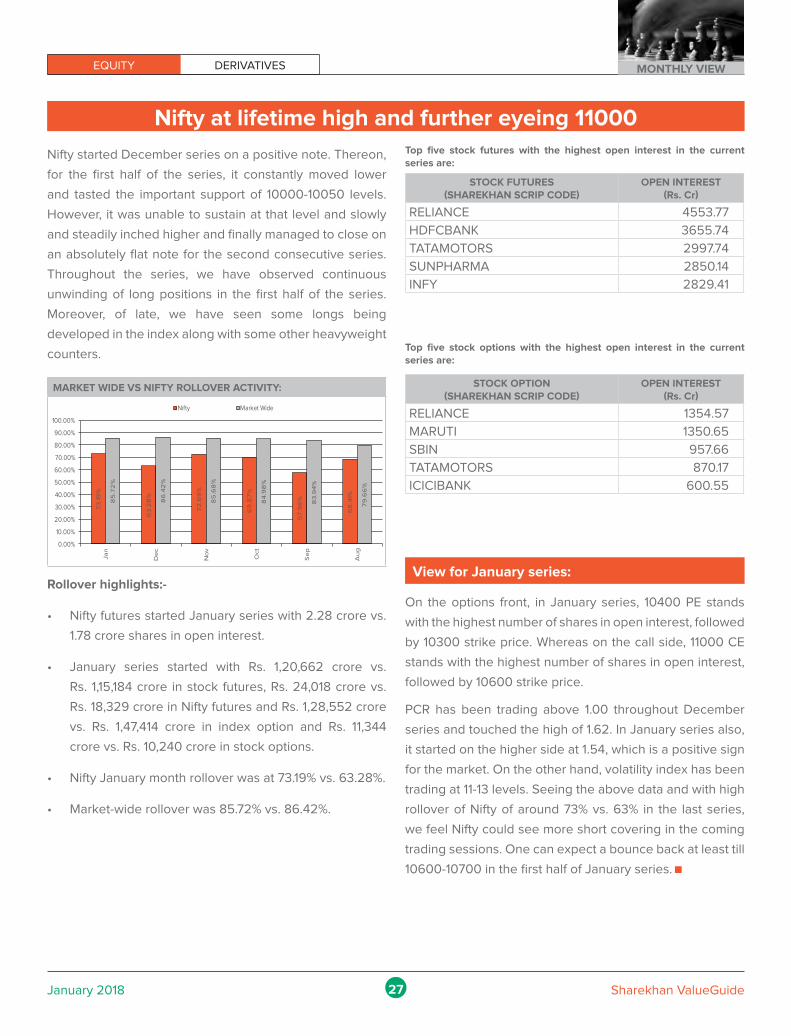
EQUITY DERIVATIVES MONTHLY VIEW
27January 2018 Sharekhan ValueGuide
Nifty at lifetime high and further eyeing 11000
Nifty started December series on a positive note. Thereon,
for the first half of the series, it constantly moved lower
and tasted the important support of 10000-10050 levels.
However, it was unable to sustain at that level and slowly
and steadily inched higher and finally managed to close on
an absolutely flat note for the second consecutive series.
Throughout the series, we have observed continuous
unwinding of long positions in the first half of the series.
Moreover, of late, we have seen some longs being
developed in the index along with some other heavyweight
counters.
STOCK FUTURES (SHAREKHAN SCRIP CODE)
OPEN INTEREST (Rs. Cr)
RELIANCE 4553.77
HDFCBANK 3655.74
TATAMOTORS 2997.74
SUNPHARMA 2850.14
INFY 2829.41
Top five stock futures with the highest open interest in the current series are:
View for January series:
On the options front, in January series, 10400 PE stands
with the highest number of shares in open interest, followed
by 10300 strike price. Whereas on the call side, 11000 CE
stands with the highest number of shares in open interest,
followed by 10600 strike price.
PCR has been trading above 1.00 throughout December
series and touched the high of 1.62. In January series also,
it started on the higher side at 1.54, which is a positive sign
for the market. On the other hand, volatility index has been
trading at 11-13 levels. Seeing the above data and with high
rollover of Nifty of around 73% vs. 63% in the last series,
we feel Nifty could see more short covering in the coming
trading sessions. One can expect a bounce back at least till
10600-10700 in the first half of January series.
Rollover highlights:-
• Nifty futures started January series with 2.28 crore vs.
1.78 crore shares in open interest.
• January series started with Rs. 1,20,662 crore vs.
Rs. 1,15,184 crore in stock futures, Rs. 24,018 crore vs.
Rs. 18,329 crore in Nifty futures and Rs. 1,28,552 crore
vs. Rs. 1,47,414 crore in index option and Rs. 11,344
crore vs. Rs. 10,240 crore in stock options.
• Nifty January month rollover was at 73.19% vs. 63.28%.
• Market-wide rollover was 85.72% vs. 86.42%.
MARKET WIDE VS NIFTY ROLLOVER ACTIVITY: STOCK OPTION (SHAREKHAN SCRIP CODE)
OPEN INTEREST (Rs. Cr)
RELIANCE 1354.57
MARUTI 1350.65
SBIN 957.66
TATAMOTORS 870.17
ICICIBANK 600.55
Top five stock options with the highest open interest in the current series are:
73
.19
%
63
.28
%
72
.69
%
69
.87
%
57
.96
%
68
.41%
85
.72
%
86
.42
%
85
.68
%
84
.98
%
83
.94
%
79
.66
%
0.00%
10.00%
20.00%
30.00%
40.00%
50.00%
60.00%
70.00%
80.00%
90.00%
100.00%
Ja
n
De
c
No
v
Oct
Se
p
Au
g
Nifty Market Wide
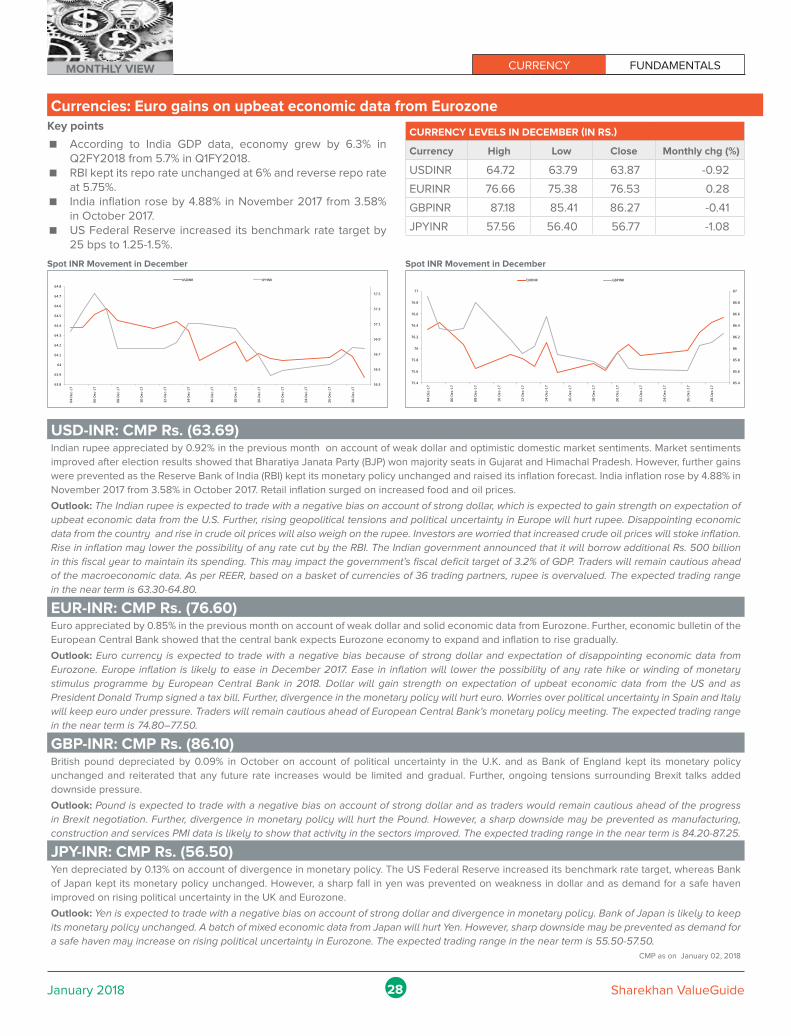
CURRENCY FUNDAMENTALSMONTHLY VIEW
28January 2018 Sharekhan ValueGuide
Currencies: Euro gains on upbeat economic data from EurozoneKey points
According to India GDP data, economy grew by 6.3% in Q2FY2018 from 5.7% in Q1FY2018.
RBI kept its repo rate unchanged at 6% and reverse repo rate at 5.75%.
India inflation rose by 4.88% in November 2017 from 3.58% in October 2017.
US Federal Reserve increased its benchmark rate target by 25 bps to 1.25-1.5%.
CURRENCY LEVELS IN DECEMBER (IN RS.)
Currency High Low Close Monthly chg (%)
USDINR 64.72 63.79 63.87 -0.92
EURINR 76.66 75.38 76.53 0.28
GBPINR 87.18 85.41 86.27 -0.41
JPYINR 57.56 56.40 56.77 -1.08
Spot INR Movement in December Spot INR Movement in December
USD-INR: CMP Rs. (63.69)Indian rupee appreciated by 0.92% in the previous month on account of weak dollar and optimistic domestic market sentiments. Market sentiments
improved after election results showed that Bharatiya Janata Party (BJP) won majority seats in Gujarat and Himachal Pradesh. However, further gains
were prevented as the Reserve Bank of India (RBI) kept its monetary policy unchanged and raised its inflation forecast. India inflation rose by 4.88% in
November 2017 from 3.58% in October 2017. Retail inflation surged on increased food and oil prices.
Outlook: The Indian rupee is expected to trade with a negative bias on account of strong dollar, which is expected to gain strength on expectation of upbeat economic data from the U.S. Further, rising geopolitical tensions and political uncertainty in Europe will hurt rupee. Disappointing economic data from the country and rise in crude oil prices will also weigh on the rupee. Investors are worried that increased crude oil prices will stoke inflation. Rise in inflation may lower the possibility of any rate cut by the RBI. The Indian government announced that it will borrow additional Rs. 500 billion in this fiscal year to maintain its spending. This may impact the government’s fiscal deficit target of 3.2% of GDP. Traders will remain cautious ahead of the macroeconomic data. As per REER, based on a basket of currencies of 36 trading partners, rupee is overvalued. The expected trading range in the near term is 63.30-64.80.
EUR-INR: CMP Rs. (76.60)Euro appreciated by 0.85% in the previous month on account of weak dollar and solid economic data from Eurozone. Further, economic bulletin of the
European Central Bank showed that the central bank expects Eurozone economy to expand and inflation to rise gradually.
Outlook: Euro currency is expected to trade with a negative bias because of strong dollar and expectation of disappointing economic data from Eurozone. Europe inflation is likely to ease in December 2017. Ease in inflation will lower the possibility of any rate hike or winding of monetary stimulus programme by European Central Bank in 2018. Dollar will gain strength on expectation of upbeat economic data from the US and as President Donald Trump signed a tax bill. Further, divergence in the monetary policy will hurt euro. Worries over political uncertainty in Spain and Italy will keep euro under pressure. Traders will remain cautious ahead of European Central Bank’s monetary policy meeting. The expected trading range in the near term is 74.80–77.50.
GBP-INR: CMP Rs. (86.10)British pound depreciated by 0.09% in October on account of political uncertainty in the U.K. and as Bank of England kept its monetary policy
unchanged and reiterated that any future rate increases would be limited and gradual. Further, ongoing tensions surrounding Brexit talks added
downside pressure.
Outlook: Pound is expected to trade with a negative bias on account of strong dollar and as traders would remain cautious ahead of the progress in Brexit negotiation. Further, divergence in monetary policy will hurt the Pound. However, a sharp downside may be prevented as manufacturing, construction and services PMI data is likely to show that activity in the sectors improved. The expected trading range in the near term is 84.20-87.25.
JPY-INR: CMP Rs. (56.50)Yen depreciated by 0.13% on account of divergence in monetary policy. The US Federal Reserve increased its benchmark rate target, whereas Bank
of Japan kept its monetary policy unchanged. However, a sharp fall in yen was prevented on weakness in dollar and as demand for a safe haven
improved on rising political uncertainty in the UK and Eurozone.
Outlook: Yen is expected to trade with a negative bias on account of strong dollar and divergence in monetary policy. Bank of Japan is likely to keep its monetary policy unchanged. A batch of mixed economic data from Japan will hurt Yen. However, sharp downside may be prevented as demand for a safe haven may increase on rising political uncertainty in Eurozone. The expected trading range in the near term is 55.50-57.50.
CMP as on January 02, 2018
56.3
56.5
56.7
56.9
57.1
57.3
57.5
63.8
63.9
64
64.1
64.2
64.3
64.4
64.5
64.6
64.7
64.8
04-D
ec-1
7
06-D
ec-1
7
08-D
ec-1
7
10-D
ec-1
7
12-D
ec-1
7
14-D
ec-1
7
16-D
ec-1
7
18-D
ec-1
7
20-D
ec-1
7
22-D
ec-1
7
24-D
ec-1
7
26-D
ec-1
7
28-D
ec-1
7
USDINR JPYINR
85.4
85.6
85.8
86
86.2
86.4
86.6
86.8
87
75.4
75.6
75.8
76
76.2
76.4
76.6
76.8
77
04-D
ec-1
7
06-D
ec-1
7
08-D
ec-1
7
10-D
ec-1
7
12-D
ec-1
7
14-D
ec-1
7
16-D
ec-1
7
18-D
ec-1
7
20-D
ec-1
7
22-D
ec-1
7
24-D
ec-1
7
26-D
ec-1
7
28-D
ec-1
7
EURINR GBPINR
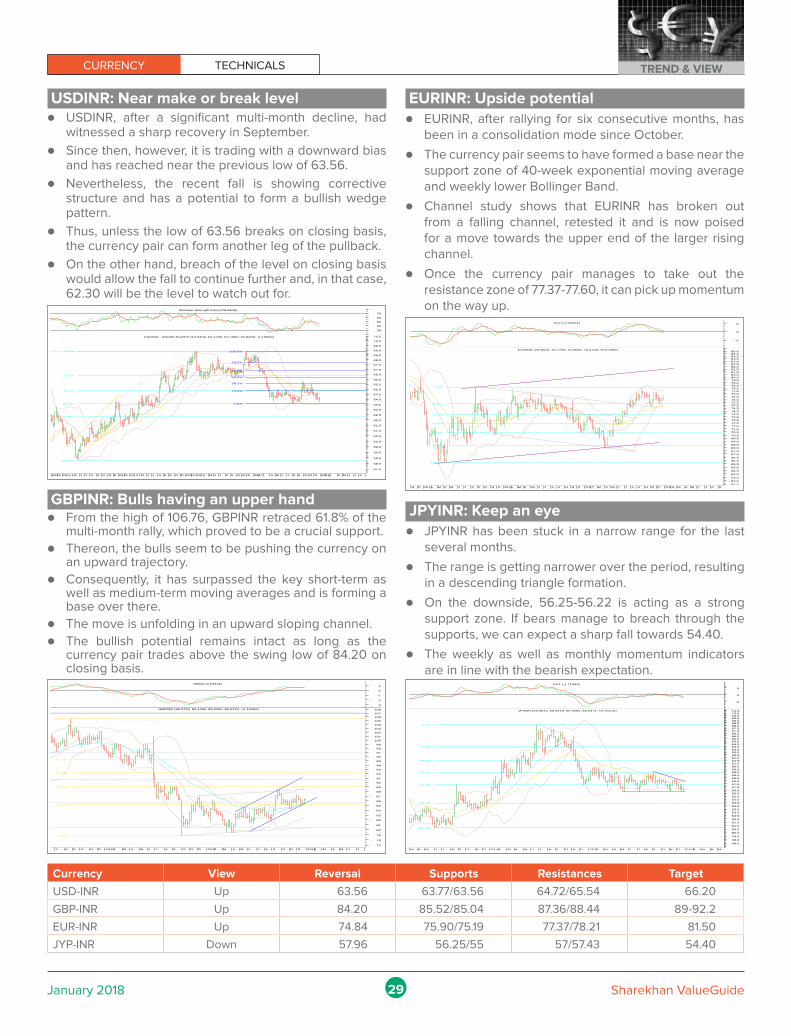
CURRENCY TECHNICALS TREND & VIEW
29January 2018 Sharekhan ValueGuide
USDINR: Near make or break level l USDINR, after a significant multi-month decline, had
witnessed a sharp recovery in September.
l Since then, however, it is trading with a downward bias and has reached near the previous low of 63.56.
l Nevertheless, the recent fall is showing corrective structure and has a potential to form a bullish wedge pattern.
l Thus, unless the low of 63.56 breaks on closing basis, the currency pair can form another leg of the pullback.
l On the other hand, breach of the level on closing basis would allow the fall to continue further and, in that case, 62.30 will be the level to watch out for.
EURINR: Upside potential l EURINR, after rallying for six consecutive months, has
been in a consolidation mode since October.
l The currency pair seems to have formed a base near the support zone of 40-week exponential moving average and weekly lower Bollinger Band.
l Channel study shows that EURINR has broken out from a falling channel, retested it and is now poised for a move towards the upper end of the larger rising channel.
l Once the currency pair manages to take out the resistance zone of 77.37-77.60, it can pick up momentum on the way up.
GBPINR: Bulls having an upper handl From the high of 106.76, GBPINR retraced 61.8% of the
multi-month rally, which proved to be a crucial support.
l Thereon, the bulls seem to be pushing the currency on an upward trajectory.
l Consequently, it has surpassed the key short-term as well as medium-term moving averages and is forming a base over there.
l The move is unfolding in an upward sloping channel.
l The bullish potential remains intact as long as the currency pair trades above the swing low of 84.20 on closing basis.
JPYINR: Keep an eye l JPYINR has been stuck in a narrow range for the last
several months.
l The range is getting narrower over the period, resulting in a descending triangle formation.
l On the downside, 56.25-56.22 is acting as a strong support zone. If bears manage to breach through the supports, we can expect a sharp fall towards 54.40.
l The weekly as well as monthly momentum indicators are in line with the bearish expectation.
Currency View Reversal Supports Resistances Target
USD-INR Up 63.56 63.77/63.56 64.72/65.54 66.20
GBP-INR Up 84.20 85.52/85.04 87.36/88.44 89-92.2
EUR-INR Up 74.84 75.90/75.19 77.37/78.21 81.50
JYP-INR Down 57.96 56.25/55 57/57.43 54.40
2014 M A M J J A S O N D 2015 M A M J J A S O N D 2016 M A M J J A S O N D 2017 A M J J A S O N D 2018 A M J J A S
57.5
58.0
58.5
59.0
59.5
60.0
60.5
61.0
61.5
62.0
62.5
63.0
63.5
64.0
64.5
65.0
65.5
66.0
66.5
67.0
67.5
68.0
68.5
69.0
69.5
70.0
70.5
0.0%
23.6%
38.2%
50.0%
61.8%
100.0%
0.0%
23.6%
38.2%
50.0%
61.8%
78.6%
100.0%
68.80USDINR - INDIAN RUPEE (64.0300, 64.2700, 63.7800, 63.8300, -0.18000)
30
40
50
60
70Relative Strength Index (38.6806)
J J A S O N D 2016 M A M J J A S O N D 2017 M A M J J A S O N D 2018 M A M J J A
77
78
79
80
81
82
83
84
85
86
87
88
89
90
91
92
93
94
95
96
97
98
99
100
101
102
103
104
105
106
107
1080.0%
23.6%
38.2%
50.0%
61.8%
0.0%
23.6%
38.2%
50.0%
61.8%
100.0%
GBPINR (85.5750, 86.4450, 85.5150, 86.2470, +0.73000)
-3
-2
-1
0
1MACD (0.54931)
N D 2015 M A M J J A S O N D 2016 M A M J J A S O N D 2017 M A M J J A S O N D 2018 M A M J J A S62.563.063.564.064.565.065.566.066.567.067.568.068.569.069.570.070.571.071.572.072.573.073.574.074.575.075.576.076.577.077.578.078.579.079.580.080.581.081.582.082.583.083.584.084.585.0
0.0%
23.6%
38.2%
50.0%
61.8%
78.6%
100.0%
EURINR (75.9610, 76.7750, 75.9030, 76.5700, +0.67300)
-5
0
5KST (-0.20461)
M A M J J A S O N D 2016 M A M J J A S O N D 2017 M A M J J A S O N D 2018 M A M
48.549.049.550.050.551.051.552.052.553.053.554.054.555.055.556.056.557.057.558.058.559.059.560.060.561.061.562.062.563.063.564.064.565.065.566.066.567.067.568.068.569.069.570.070.571.0
0.0%
23.6%
38.2%
50.0%
61.8%
78.6%
100.0%
JPYINR (56.5010, 56.9416, 56.4562, 56.6371, +0.13110)
-5
0
5
KST (-1.71363)

PMS DESKWEALTHOPTIMIZER
30January 2018 Sharekhan ValueGuide
Strategy
How the product works
Key product specifications
WEALTHOPTIMIZER PMS
The Indian equity market presents an excellent opportunity for the long-term investors. Sharekhan offers you solutions to meet your financial objectives. WealthOptimizer is a portfolio management product that involves enhancing wealth over the long term. The goal is to not only outperform the market but also generate superior returns.
• To invest in the most undervalued stocks of growing companies on the basis of reported financial performance
• Fundamental analysis is performed on more than 5,000 companies
• Stocks with sound fundamentals are picked, subject to strategy conditions
• Top 10 stocks are selected each day based on the maximum scope to grow
• No particular sector forms more than 20% of the client’s portfolio
• Fundamentals of stocks held are reviewed every quarter based on quarterly results
• Automated decision making system for transparent and disciplined investing
• Minimum investment amount: Rs25 lakh
• Recommended investment duration: Two years or more
Phone: 022-6750 2152 / 2261 / 2363 / 2104 • E-mail: [email protected]
Disclaimer: Product is offered by Sharekhan Ltd (Registered Portfolio Manager with SEBI Regn. Nos. INP000000662 CIN No. U99999MH1995PLC087498) and having registered office at 10th Floor, Beta Building, Lodha iThink Techno Campus, Off. JVLR, Opp. Kanjurmarg Railway Station, Kanjurmarg (East), Mumbai -400042, Maharashtra. Tel: 022-61150000. Email: [email protected], [email protected]. This information does not purport to be an invitation or an offer for services, client is required to take independent advise before opting for any service. Securities investments are subject to market and other risks and client should refer to the risk disclosure document carefully. Past performance is no indication of future results. Future performance may vary. Detailed disclaimers and risk disclosure document is available on our website www.sharekhan.com, please acquaint yourself with these before investing.
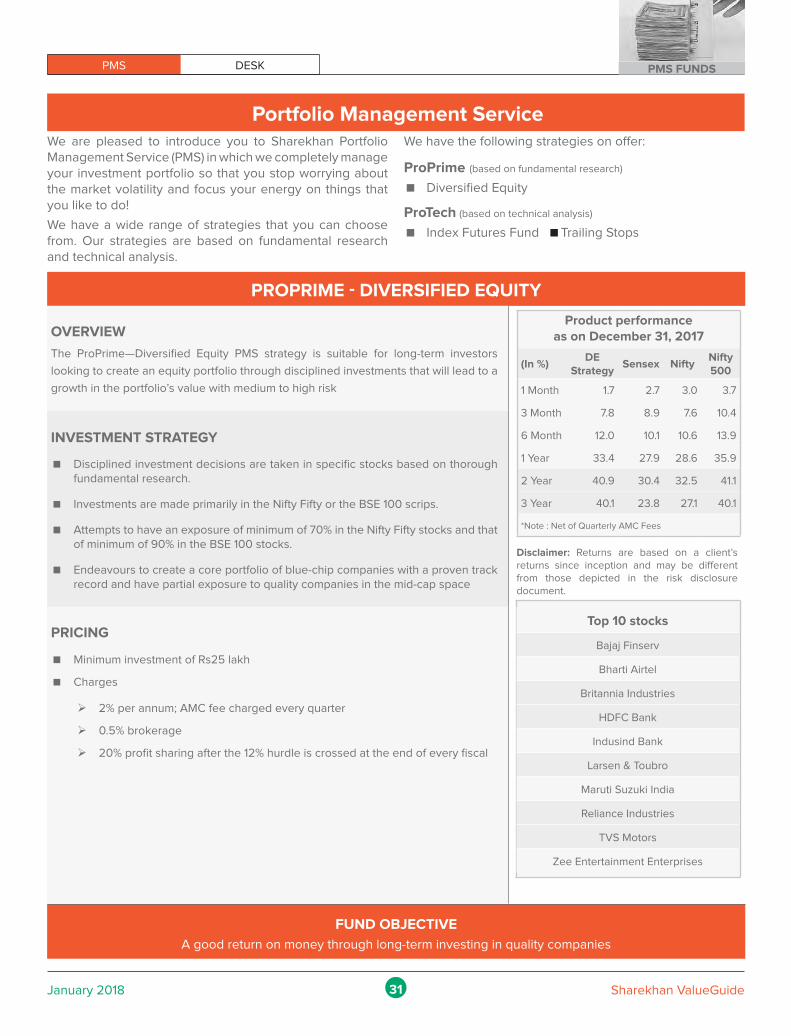
PMS DESK PMS FUNDS
31January 2018 Sharekhan ValueGuide
Portfolio Management ServiceWe are pleased to introduce you to Sharekhan Portfolio Management Service (PMS) in which we completely manage your investment portfolio so that you stop worrying about the market volatility and focus your energy on things that you like to do!
We have a wide range of strategies that you can choose from. Our strategies are based on fundamental research and technical analysis.
We have the following strategies on offer:
ProPrime (based on fundamental research)
Diversified Equity
ProTech (based on technical analysis)
Index Futures Fund Trailing Stops
PROPRIME - DIVERSIFIED EQUITY
OVERVIEW
The ProPrime—Diversified Equity PMS strategy is suitable for long-term investors
looking to create an equity portfolio through disciplined investments that will lead to a
growth in the portfolio’s value with medium to high risk
Product performance as on December 31, 2017
(In %)DE
StrategySensex Nifty
Nifty 500
1 Month 1.7 2.7 3.0 3.7
3 Month 7.8 8.9 7.6 10.4
6 Month 12.0 10.1 10.6 13.9
1 Year 33.4 27.9 28.6 35.9
2 Year 40.9 30.4 32.5 41.1
3 Year 40.1 23.8 27.1 40.1
*Note : Net of Quarterly AMC Fees
Disclaimer: Returns are based on a client’s returns since inception and may be different from those depicted in the risk disclosure document.
Top 10 stocks
Bajaj Finserv
Bharti Airtel
Britannia Industries
HDFC Bank
Indusind Bank
Larsen & Toubro
Maruti Suzuki India
Reliance Industries
TVS Motors
Zee Entertainment Enterprises
INVESTMENT STRATEGY
Disciplined investment decisions are taken in specific stocks based on thorough fundamental research.
Investments are made primarily in the Nifty Fifty or the BSE 100 scrips.
Attempts to have an exposure of minimum of 70% in the Nifty Fifty stocks and that of minimum of 90% in the BSE 100 stocks.
Endeavours to create a core portfolio of blue-chip companies with a proven track record and have partial exposure to quality companies in the mid-cap space
PRICING
Minimum investment of Rs25 lakh
Charges
¾ 2% per annum; AMC fee charged every quarter
¾ 0.5% brokerage
¾ 20% profit sharing after the 12% hurdle is crossed at the end of every fiscal
FUND OBJECTIVE A good return on money through long-term investing in quality companies
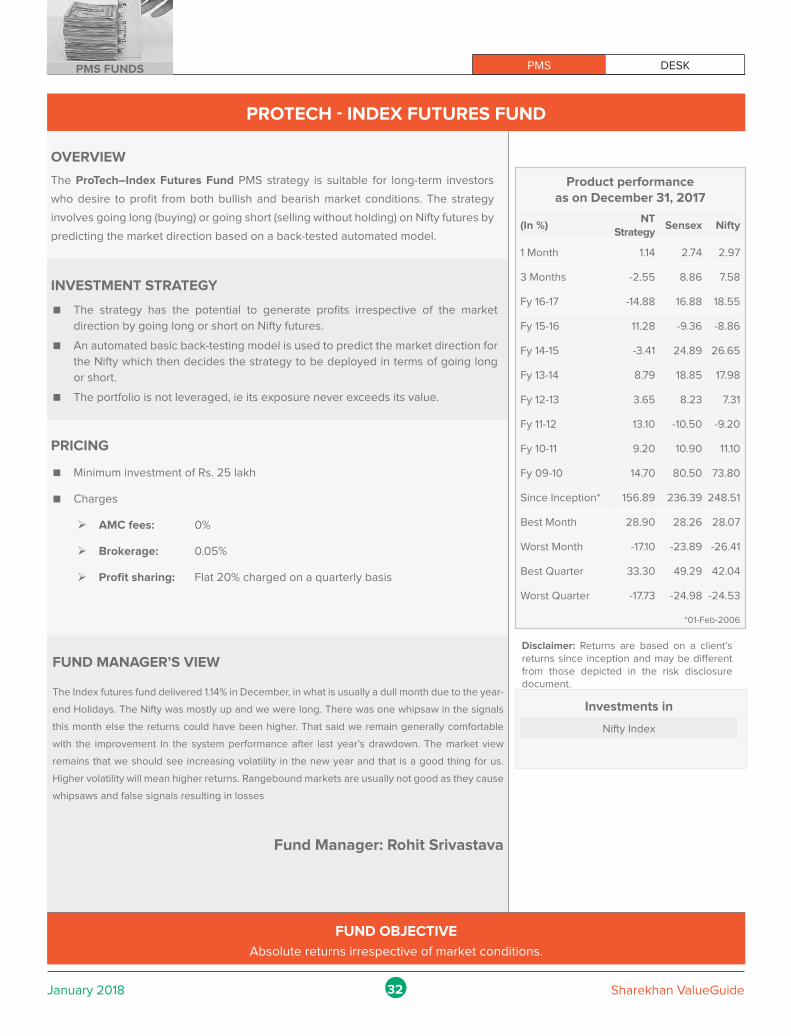
PMS DESKPMS FUNDS
32January 2018 Sharekhan ValueGuide
PROTECH - INDEX FUTURES FUND
OVERVIEW
The ProTech–Index Futures Fund PMS strategy is suitable for long-term investors
who desire to profit from both bullish and bearish market conditions. The strategy
involves going long (buying) or going short (selling without holding) on Nifty futures by
predicting the market direction based on a back-tested automated model.
Product performance as on December 31, 2017
(In %)NT
StrategySensex Nifty
1 Month 1.14 2.74 2.97
3 Months -2.55 8.86 7.58
Fy 16-17 -14.88 16.88 18.55
Fy 15-16 11.28 -9.36 -8.86
Fy 14-15 -3.41 24.89 26.65
Fy 13-14 8.79 18.85 17.98
Fy 12-13 3.65 8.23 7.31
Fy 11-12 13.10 -10.50 -9.20
Fy 10-11 9.20 10.90 11.10
Fy 09-10 14.70 80.50 73.80
Since Inception* 156.89 236.39 248.51
Best Month 28.90 28.26 28.07
Worst Month -17.10 -23.89 -26.41
Best Quarter 33.30 49.29 42.04
Worst Quarter -17.73 -24.98 -24.53
*01-Feb-2006
INVESTMENT STRATEGY
The strategy has the potential to generate profits irrespective of the market
direction by going long or short on Nifty futures.
An automated basic back-testing model is used to predict the market direction for
the Nifty which then decides the strategy to be deployed in terms of going long
or short.
The portfolio is not leveraged, ie its exposure never exceeds its value.
PRICING
Minimum investment of Rs. 25 lakh
Charges
¾ AMC fees: 0%
¾ Brokerage: 0.05%
¾ Profit sharing: Flat 20% charged on a quarterly basis
FUND MANAGER’S VIEW
The Index futures fund delivered 1.14% in December, in what is usually a dull month due to the year-
end Holidays. The Nifty was mostly up and we were long. There was one whipsaw in the signals
this month else the returns could have been higher. That said we remain generally comfortable
with the improvement In the system performance after last year’s drawdown. The market view
remains that we should see increasing volatility in the new year and that is a good thing for us.
Higher volatility will mean higher returns. Rangebound markets are usually not good as they cause
whipsaws and false signals resulting in losses
Fund Manager: Rohit Srivastava
Disclaimer: Returns are based on a client’s returns since inception and may be different from those depicted in the risk disclosure document.
FUND OBJECTIVE
Absolute returns irrespective of market conditions.
Investments in
Nifty Index
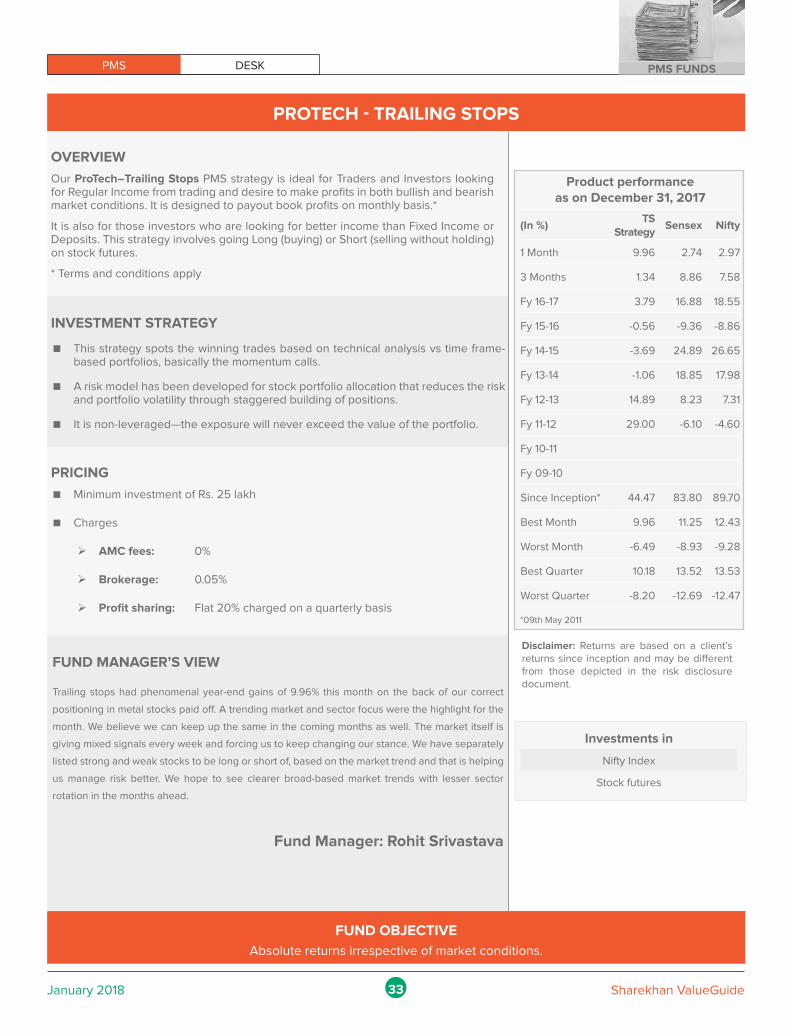
PMS DESK PMS FUNDS
33January 2018 Sharekhan ValueGuide
PROTECH - TRAILING STOPS
OVERVIEW
Our ProTech–Trailing Stops PMS strategy is ideal for Traders and Investors looking for Regular Income from trading and desire to make profits in both bullish and bearish market conditions. It is designed to payout book profits on monthly basis.*
It is also for those investors who are looking for better income than Fixed Income or Deposits. This strategy involves going Long (buying) or Short (selling without holding) on stock futures.
* Terms and conditions apply
Product performance as on December 31, 2017
(In %)TS
StrategySensex Nifty
1 Month 9.96 2.74 2.97
3 Months 1.34 8.86 7.58
Fy 16-17 3.79 16.88 18.55
Fy 15-16 -0.56 -9.36 -8.86
Fy 14-15 -3.69 24.89 26.65
Fy 13-14 -1.06 18.85 17.98
Fy 12-13 14.89 8.23 7.31
Fy 11-12 29.00 -6.10 -4.60
Fy 10-11
Fy 09-10
Since Inception* 44.47 83.80 89.70
Best Month 9.96 11.25 12.43
Worst Month -6.49 -8.93 -9.28
Best Quarter 10.18 13.52 13.53
Worst Quarter -8.20 -12.69 -12.47
*09th May 2011
INVESTMENT STRATEGY
This strategy spots the winning trades based on technical analysis vs time frame-based portfolios, basically the momentum calls.
A risk model has been developed for stock portfolio allocation that reduces the risk and portfolio volatility through staggered building of positions.
It is non-leveraged—the exposure will never exceed the value of the portfolio.
PRICING
Minimum investment of Rs. 25 lakh
Charges
¾ AMC fees: 0%
¾ Brokerage: 0.05%
¾ Profit sharing: Flat 20% charged on a quarterly basis
FUND MANAGER’S VIEW
Trailing stops had phenomenal year-end gains of 9.96% this month on the back of our correct
positioning in metal stocks paid off. A trending market and sector focus were the highlight for the
month. We believe we can keep up the same in the coming months as well. The market itself is
giving mixed signals every week and forcing us to keep changing our stance. We have separately
listed strong and weak stocks to be long or short of, based on the market trend and that is helping
us manage risk better. We hope to see clearer broad-based market trends with lesser sector
rotation in the months ahead.
Fund Manager: Rohit Srivastava
Disclaimer: Returns are based on a client’s returns since inception and may be different from those depicted in the risk disclosure document.
FUND OBJECTIVE
Absolute returns irrespective of market conditions.
Investments in
Nifty Index
Stock futures
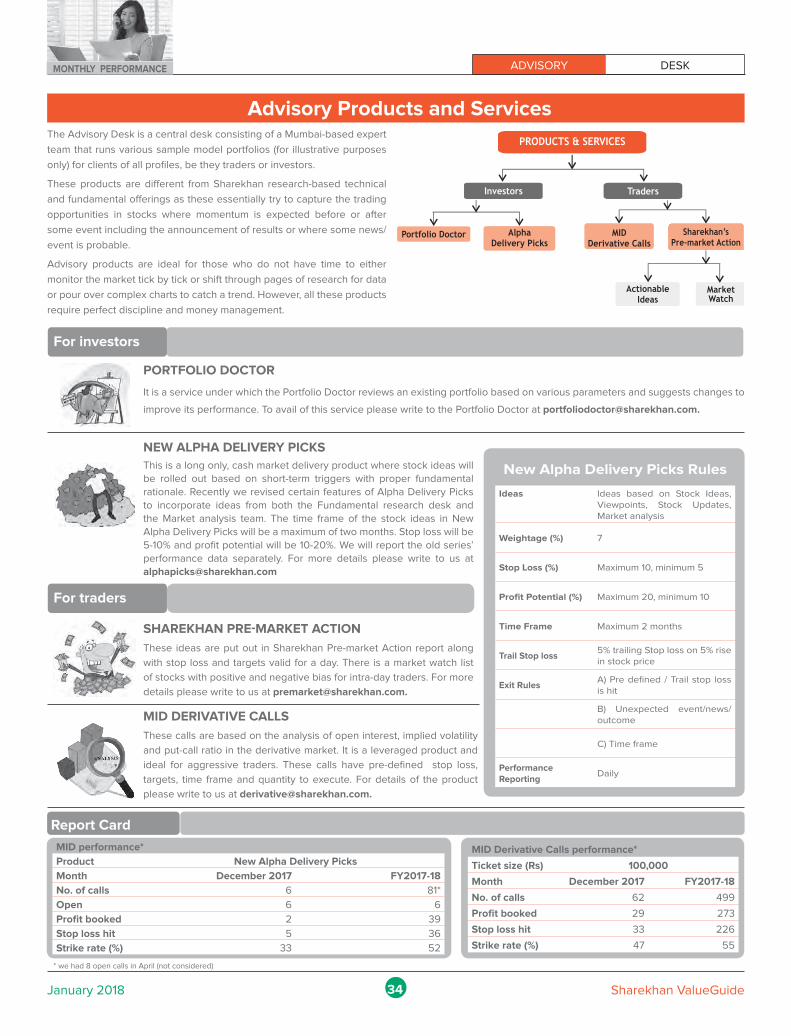
ADVISORY DESKMONTHLY PERFORMANCE
34January 2018 Sharekhan ValueGuide
Advisory Products and ServicesThe Advisory Desk is a central desk consisting of a Mumbai-based expert
team that runs various sample model portfolios (for illustrative purposes
only) for clients of all profiles, be they traders or investors.
These products are different from Sharekhan research-based technical
and fundamental offerings as these essentially try to capture the trading
opportunities in stocks where momentum is expected before or after
some event including the announcement of results or where some news/
event is probable.
Advisory products are ideal for those who do not have time to either
monitor the market tick by tick or shift through pages of research for data
or pour over complex charts to catch a trend. However, all these products
require perfect discipline and money management.
For investors
Report Card
PORTFOLIO DOCTOR
It is a service under which the Portfolio Doctor reviews an existing portfolio based on various parameters and suggests changes to
improve its performance. To avail of this service please write to the Portfolio Doctor at [email protected].
NEW ALPHA DELIVERY PICKS
This is a long only, cash market delivery product where stock ideas will be rolled out based on short-term triggers with proper fundamental rationale. Recently we revised certain features of Alpha Delivery Picks to incorporate ideas from both the Fundamental research desk and the Market analysis team. The time frame of the stock ideas in New Alpha Delivery Picks will be a maximum of two months. Stop loss will be 5-10% and profit potential will be 10-20%. We will report the old series’ performance data separately. For more details please write to us at [email protected]
SHAREKHAN PRE-MARKET ACTION
These ideas are put out in Sharekhan Pre-market Action report along
with stop loss and targets valid for a day. There is a market watch list
of stocks with positive and negative bias for intra-day traders. For more
details please write to us at [email protected].
MID DERIVATIVE CALLS
These calls are based on the analysis of open interest, implied volatility
and put-call ratio in the derivative market. It is a leveraged product and
ideal for aggressive traders. These calls have pre-defined stop loss,
targets, time frame and quantity to execute. For details of the product
please write to us at [email protected].
MID performance*
Product New Alpha Delivery Picks
Month December 2017 FY2017-18
No. of calls 6 81*
Open 6 6
Profit booked 2 39
Stop loss hit 5 36
Strike rate (%) 33 52
New Alpha Delivery Picks Rules
Ideas Ideas based on Stock Ideas, Viewpoints, Stock Updates, Market analysis
Weightage (%) 7
Stop Loss (%) Maximum 10, minimum 5
Profit Potential (%) Maximum 20, minimum 10
Time Frame Maximum 2 months
Trail Stop loss5% trailing Stop loss on 5% rise in stock price
Exit RulesA) Pre defined / Trail stop loss is hit
B) Unexpected event/news/ outcome
C) Time frame
PerformanceReporting
Daily
MID Derivative Calls performance*
Ticket size (Rs) 100,000
Month December 2017 FY2017-18
No. of calls 62 499
Profit booked 29 273
Stop loss hit 33 226
Strike rate (%) 47 55
For traders
* we had 8 open calls in April (not considered)
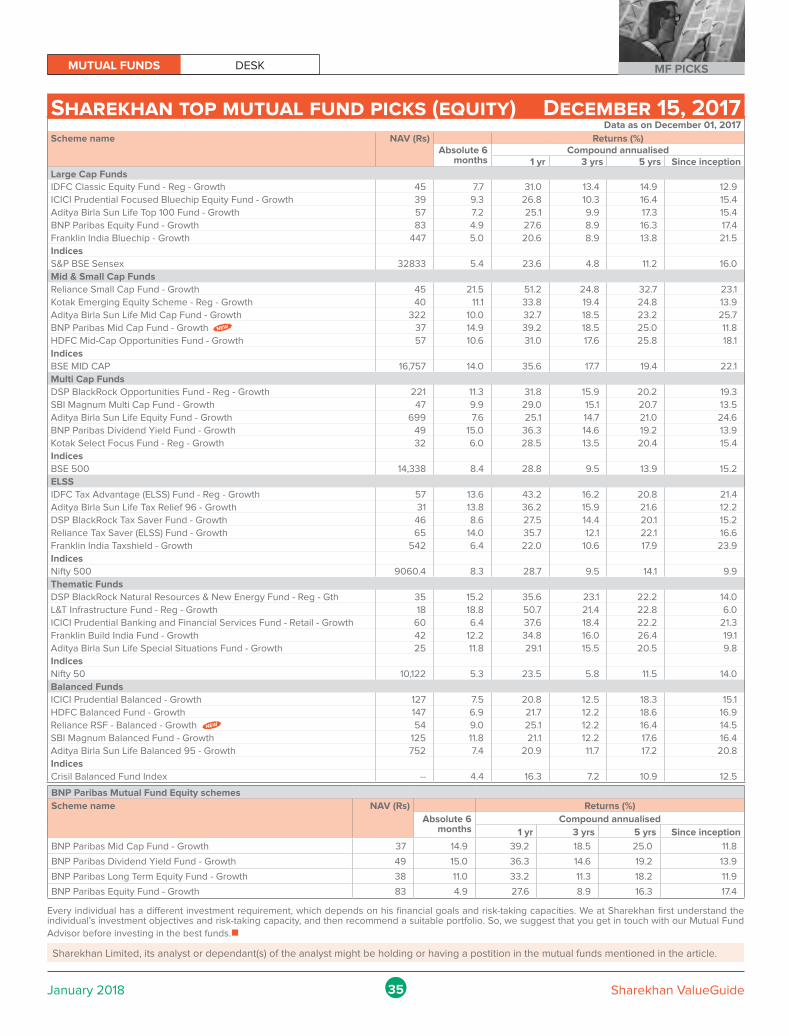
MUTUAL FUNDS DESK MF PICKS
35January 2018 Sharekhan ValueGuide
Data as on December 01, 2017
Scheme name NAV (Rs) Returns (%)Absolute 6
monthsCompound annualised
1 yr 3 yrs 5 yrs Since inceptionLarge Cap Funds
IDFC Classic Equity Fund - Reg - Growth 45 7.7 31.0 13.4 14.9 12.9
ICICI Prudential Focused Bluechip Equity Fund - Growth 39 9.3 26.8 10.3 16.4 15.4
Aditya Birla Sun Life Top 100 Fund - Growth 57 7.2 25.1 9.9 17.3 15.4
BNP Paribas Equity Fund - Growth 83 4.9 27.6 8.9 16.3 17.4
Franklin India Bluechip - Growth 447 5.0 20.6 8.9 13.8 21.5
Indices
S&P BSE Sensex 32833 5.4 23.6 4.8 11.2 16.0
Mid & Small Cap Funds
Reliance Small Cap Fund - Growth 45 21.5 51.2 24.8 32.7 23.1
Kotak Emerging Equity Scheme - Reg - Growth 40 11.1 33.8 19.4 24.8 13.9
Aditya Birla Sun Life Mid Cap Fund - Growth 322 10.0 32.7 18.5 23.2 25.7
BNP Paribas Mid Cap Fund - Growth 37 14.9 39.2 18.5 25.0 11.8
HDFC Mid-Cap Opportunities Fund - Growth 57 10.6 31.0 17.6 25.8 18.1
Indices
BSE MID CAP 16,757 14.0 35.6 17.7 19.4 22.1
Multi Cap Funds
DSP BlackRock Opportunities Fund - Reg - Growth 221 11.3 31.8 15.9 20.2 19.3
SBI Magnum Multi Cap Fund - Growth 47 9.9 29.0 15.1 20.7 13.5
Aditya Birla Sun Life Equity Fund - Growth 699 7.6 25.1 14.7 21.0 24.6
BNP Paribas Dividend Yield Fund - Growth 49 15.0 36.3 14.6 19.2 13.9
Kotak Select Focus Fund - Reg - Growth 32 6.0 28.5 13.5 20.4 15.4
Indices
BSE 500 14,338 8.4 28.8 9.5 13.9 15.2
ELSS
IDFC Tax Advantage (ELSS) Fund - Reg - Growth 57 13.6 43.2 16.2 20.8 21.4
Aditya Birla Sun Life Tax Relief 96 - Growth 31 13.8 36.2 15.9 21.6 12.2
DSP BlackRock Tax Saver Fund - Growth 46 8.6 27.5 14.4 20.1 15.2
Reliance Tax Saver (ELSS) Fund - Growth 65 14.0 35.7 12.1 22.1 16.6
Franklin India Taxshield - Growth 542 6.4 22.0 10.6 17.9 23.9
Indices
Nifty 500 9060.4 8.3 28.7 9.5 14.1 9.9
Thematic Funds
DSP BlackRock Natural Resources & New Energy Fund - Reg - Gth 35 15.2 35.6 23.1 22.2 14.0
L&T Infrastructure Fund - Reg - Growth 18 18.8 50.7 21.4 22.8 6.0
ICICI Prudential Banking and Financial Services Fund - Retail - Growth 60 6.4 37.6 18.4 22.2 21.3
Franklin Build India Fund - Growth 42 12.2 34.8 16.0 26.4 19.1
Aditya Birla Sun Life Special Situations Fund - Growth 25 11.8 29.1 15.5 20.5 9.8
Indices
Nifty 50 10,122 5.3 23.5 5.8 11.5 14.0
Balanced Funds
ICICI Prudential Balanced - Growth 127 7.5 20.8 12.5 18.3 15.1
HDFC Balanced Fund - Growth 147 6.9 21.7 12.2 18.6 16.9
Reliance RSF - Balanced - Growth 54 9.0 25.1 12.2 16.4 14.5
SBI Magnum Balanced Fund - Growth 125 11.8 21.1 12.2 17.6 16.4
Aditya Birla Sun Life Balanced 95 - Growth 752 7.4 20.9 11.7 17.2 20.8
Indices
Crisil Balanced Fund Index -- 4.4 16.3 7.2 10.9 12.5
Sharekhan top mutual fund picks (equity) December 15, 2017
Every individual has a different investment requirement, which depends on his financial goals and risk-taking capacities. We at Sharekhan first understand the individual’s investment objectives and risk-taking capacity, and then recommend a suitable portfolio. So, we suggest that you get in touch with our Mutual Fund
Advisor before investing in the best funds.n
Sharekhan Limited, its analyst or dependant(s) of the analyst might be holding or having a postition in the mutual funds mentioned in the article.
BNP Paribas Mutual Fund Equity schemes
Scheme name NAV (Rs) Returns (%)
Absolute 6 months
Compound annualised
1 yr 3 yrs 5 yrs Since inception
BNP Paribas Mid Cap Fund - Growth 37 14.9 39.2 18.5 25.0 11.8
BNP Paribas Dividend Yield Fund - Growth 49 15.0 36.3 14.6 19.2 13.9
BNP Paribas Long Term Equity Fund - Growth 38 11.0 33.2 11.3 18.2 11.9
BNP Paribas Equity Fund - Growth 83 4.9 27.6 8.9 16.3 17.4
NEW
NEW
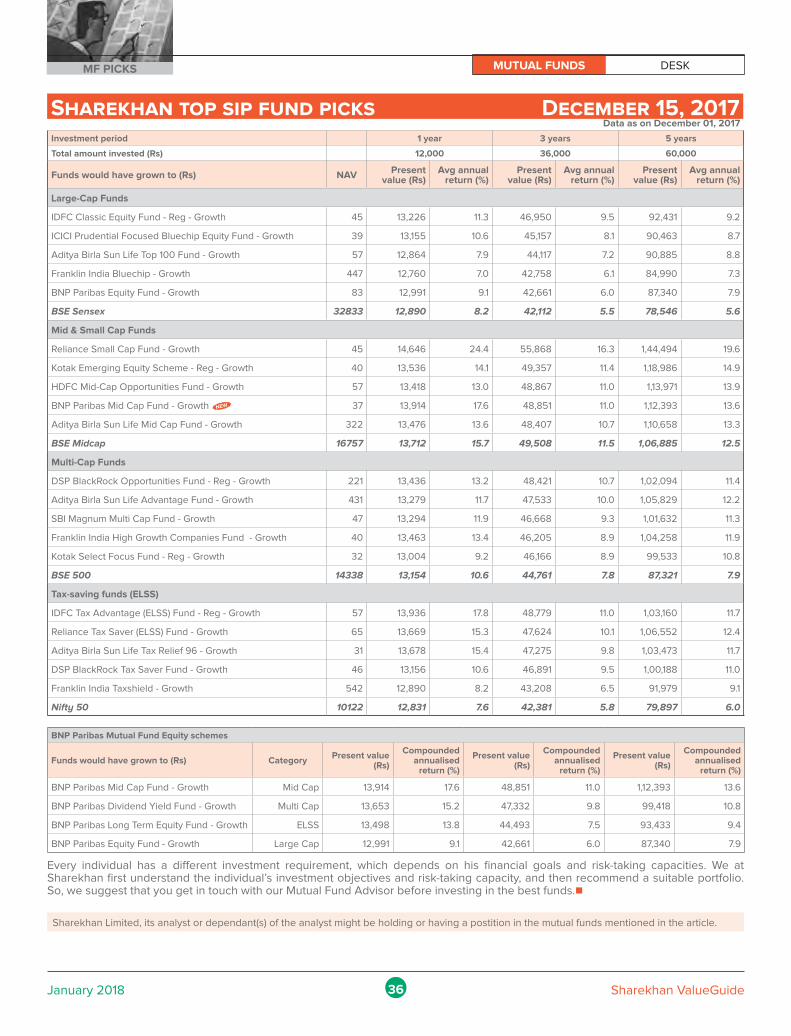
MUTUAL FUNDS DESKMF PICKS
36January 2018 Sharekhan ValueGuide
Sharekhan top sip fund picks December 15, 2017
Every individual has a different investment requirement, which depends on his financial goals and risk-taking capacities. We at Sharekhan first understand the individual’s investment objectives and risk-taking capacity, and then recommend a suitable portfolio. So, we suggest that you get in touch with our Mutual Fund Advisor before investing in the best funds.n
Sharekhan Limited, its analyst or dependant(s) of the analyst might be holding or having a postition in the mutual funds mentioned in the article.
Data as on December 01, 2017
Investment period 1 year 3 years 5 years
Total amount invested (Rs) 12,000 36,000 60,000
Funds would have grown to (Rs) NAV Present value (Rs)
Avg annual return (%)
Present value (Rs)
Avg annual return (%)
Present value (Rs)
Avg annual return (%)
Large-Cap Funds
IDFC Classic Equity Fund - Reg - Growth 45 13,226 11.3 46,950 9.5 92,431 9.2
ICICI Prudential Focused Bluechip Equity Fund - Growth 39 13,155 10.6 45,157 8.1 90,463 8.7
Aditya Birla Sun Life Top 100 Fund - Growth 57 12,864 7.9 44,117 7.2 90,885 8.8
Franklin India Bluechip - Growth 447 12,760 7.0 42,758 6.1 84,990 7.3
BNP Paribas Equity Fund - Growth 83 12,991 9.1 42,661 6.0 87,340 7.9
BSE Sensex 32833 12,890 8.2 42,112 5.5 78,546 5.6
Mid & Small Cap Funds
Reliance Small Cap Fund - Growth 45 14,646 24.4 55,868 16.3 1,44,494 19.6
Kotak Emerging Equity Scheme - Reg - Growth 40 13,536 14.1 49,357 11.4 1,18,986 14.9
HDFC Mid-Cap Opportunities Fund - Growth 57 13,418 13.0 48,867 11.0 1,13,971 13.9
BNP Paribas Mid Cap Fund - Growth 37 13,914 17.6 48,851 11.0 1,12,393 13.6
Aditya Birla Sun Life Mid Cap Fund - Growth 322 13,476 13.6 48,407 10.7 1,10,658 13.3
BSE Midcap 16757 13,712 15.7 49,508 11.5 1,06,885 12.5
Multi-Cap Funds
DSP BlackRock Opportunities Fund - Reg - Growth 221 13,436 13.2 48,421 10.7 1,02,094 11.4
Aditya Birla Sun Life Advantage Fund - Growth 431 13,279 11.7 47,533 10.0 1,05,829 12.2
SBI Magnum Multi Cap Fund - Growth 47 13,294 11.9 46,668 9.3 1,01,632 11.3
Franklin India High Growth Companies Fund - Growth 40 13,463 13.4 46,205 8.9 1,04,258 11.9
Kotak Select Focus Fund - Reg - Growth 32 13,004 9.2 46,166 8.9 99,533 10.8
BSE 500 14338 13,154 10.6 44,761 7.8 87,321 7.9
Tax-saving funds (ELSS)
IDFC Tax Advantage (ELSS) Fund - Reg - Growth 57 13,936 17.8 48,779 11.0 1,03,160 11.7
Reliance Tax Saver (ELSS) Fund - Growth 65 13,669 15.3 47,624 10.1 1,06,552 12.4
Aditya Birla Sun Life Tax Relief 96 - Growth 31 13,678 15.4 47,275 9.8 1,03,473 11.7
DSP BlackRock Tax Saver Fund - Growth 46 13,156 10.6 46,891 9.5 1,00,188 11.0
Franklin India Taxshield - Growth 542 12,890 8.2 43,208 6.5 91,979 9.1
Nifty 50 10122 12,831 7.6 42,381 5.8 79,897 6.0
BNP Paribas Mutual Fund Equity schemes
Funds would have grown to (Rs) CategoryPresent value
(Rs)
Compoundedannualised
return (%)
Present value (Rs)
Compounded annualised
return (%)
Present value (Rs)
Compounded annualised
return (%)
BNP Paribas Mid Cap Fund - Growth Mid Cap 13,914 17.6 48,851 11.0 1,12,393 13.6
BNP Paribas Dividend Yield Fund - Growth Multi Cap 13,653 15.2 47,332 9.8 99,418 10.8
BNP Paribas Long Term Equity Fund - Growth ELSS 13,498 13.8 44,493 7.5 93,433 9.4
BNP Paribas Equity Fund - Growth Large Cap 12,991 9.1 42,661 6.0 87,340 7.9
NEW
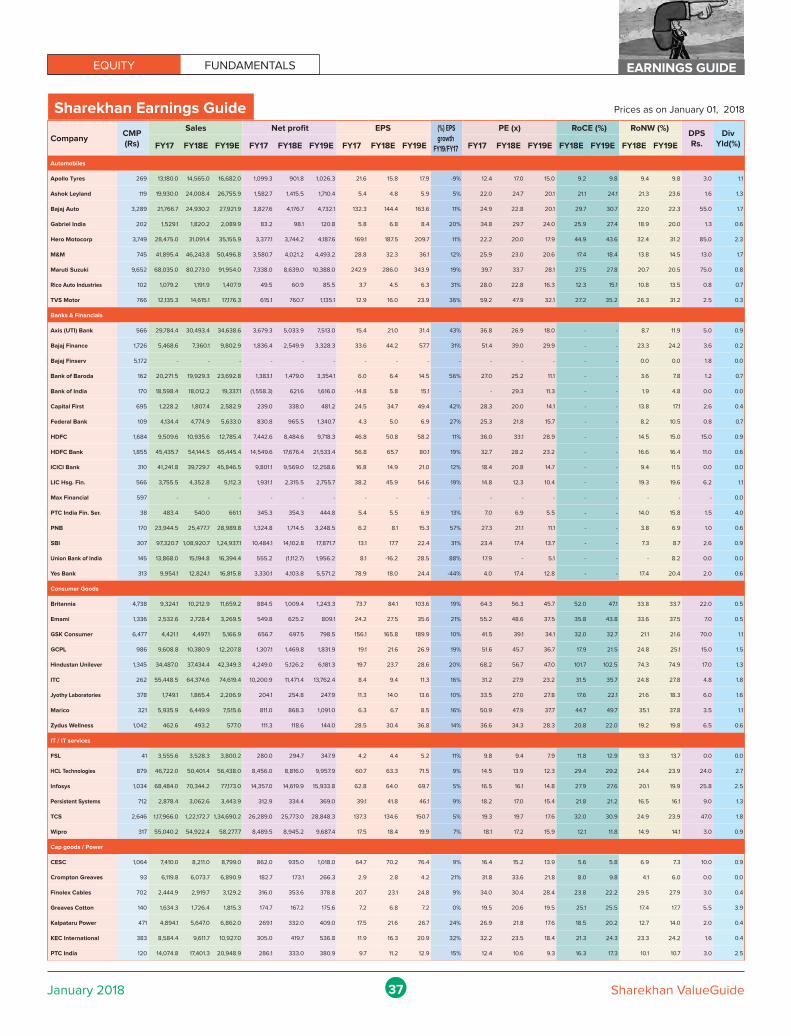
37January 2018 Sharekhan ValueGuide
EQUITY FUNDAMENTALS EARNINGS GUIDE
Sharekhan Earnings Guide Prices as on January 01, 2018
CompanyCMP (Rs)
Sales Net profit EPS (%) EPSgrowth
FY19/FY17
PE (x) RoCE (%) RoNW (%)DPSRs.
DivYld(%) FY17 FY18E FY19E FY17 FY18E FY19E FY17 FY18E FY19E FY17 FY18E FY19E FY18E FY19E FY18E FY19E
Automobiles
Apollo Tyres 269 13,180.0 14,565.0 16,682.0 1,099.3 901.8 1,026.3 21.6 15.8 17.9 -9% 12.4 17.0 15.0 9.2 9.8 9.4 9.8 3.0 1.1
Ashok Leyland 119 19,930.0 24,008.4 26,755.9 1,582.7 1,415.5 1,710.4 5.4 4.8 5.9 5% 22.0 24.7 20.1 21.1 24.1 21.3 23.6 1.6 1.3
Bajaj Auto 3,289 21,766.7 24,930.2 27,921.9 3,827.6 4,176.7 4,732.1 132.3 144.4 163.6 11% 24.9 22.8 20.1 29.7 30.7 22.0 22.3 55.0 1.7
Gabriel India 202 1,529.1 1,820.2 2,089.9 83.2 98.1 120.8 5.8 6.8 8.4 20% 34.8 29.7 24.0 25.9 27.4 18.9 20.0 1.3 0.6
Hero Motocorp 3,749 28,475.0 31,091.4 35,155.9 3,377.1 3,744.2 4,187.6 169.1 187.5 209.7 11% 22.2 20.0 17.9 44.9 43.6 32.4 31.2 85.0 2.3
M&M 745 41,895.4 46,243.8 50,496.8 3,580.7 4,021.2 4,493.2 28.8 32.3 36.1 12% 25.9 23.0 20.6 17.4 18.4 13.8 14.5 13.0 1.7
Maruti Suzuki 9,652 68,035.0 80,273.0 91,954.0 7,338.0 8,639.0 10,388.0 242.9 286.0 343.9 19% 39.7 33.7 28.1 27.5 27.8 20.7 20.5 75.0 0.8
Rico Auto Industries 102 1,079.2 1,191.9 1,407.9 49.5 60.9 85.5 3.7 4.5 6.3 31% 28.0 22.8 16.3 12.3 15.1 10.8 13.5 0.8 0.7
TVS Motor 766 12,135.3 14,615.1 17,176.3 615.1 760.7 1,135.1 12.9 16.0 23.9 36% 59.2 47.9 32.1 27.2 35.2 26.3 31.2 2.5 0.3
Banks & Financials
Axis (UTI) Bank 566 29,784.4 30,493.4 34,638.6 3,679.3 5,033.9 7,513.0 15.4 21.0 31.4 43% 36.8 26.9 18.0 - - 8.7 11.9 5.0 0.9
Bajaj Finance 1,726 5,468.6 7,360.1 9,802.9 1,836.4 2,549.9 3,328.3 33.6 44.2 57.7 31% 51.4 39.0 29.9 - - 23.3 24.2 3.6 0.2
Bajaj Finserv 5,172 - - - - - - - - - - - - - - - 0.0 0.0 1.8 0.0
Bank of Baroda 162 20,271.5 19,929.3 23,692.8 1,383.1 1,479.0 3,354.1 6.0 6.4 14.5 56% 27.0 25.2 11.1 - - 3.6 7.8 1.2 0.7
Bank of India 170 18,598.4 18,012.2 19,337.1 (1,558.3) 621.6 1,616.0 -14.8 5.8 15.1 - - 29.3 11.3 - - 1.9 4.8 0.0 0.0
Capital First 695 1,228.2 1,807.4 2,582.9 239.0 338.0 481.2 24.5 34.7 49.4 42% 28.3 20.0 14.1 - - 13.8 17.1 2.6 0.4
Federal Bank 109 4,134.4 4,774.9 5,633.0 830.8 965.5 1,340.7 4.3 5.0 6.9 27% 25.3 21.8 15.7 - - 8.2 10.5 0.8 0.7
HDFC 1,684 9,509.6 10,935.6 12,785.4 7,442.6 8,484.6 9,718.3 46.8 50.8 58.2 11% 36.0 33.1 28.9 - - 14.5 15.0 15.0 0.9
HDFC Bank 1,855 45,435.7 54,144.5 65,445.4 14,549.6 17,676.4 21,533.4 56.8 65.7 80.1 19% 32.7 28.2 23.2 - - 16.6 16.4 11.0 0.6
ICICI Bank 310 41,241.8 39,729.7 45,846.5 9,801.1 9,569.0 12,258.6 16.8 14.9 21.0 12% 18.4 20.8 14.7 - - 9.4 11.5 0.0 0.0
LIC Hsg. Fin. 566 3,755.5 4,352.8 5,112.3 1,931.1 2,315.5 2,755.7 38.2 45.9 54.6 19% 14.8 12.3 10.4 - - 19.3 19.6 6.2 1.1
Max Financial 597 - - - - - - - - - - - - - - - - - - 0.0
PTC India Fin. Ser. 38 483.4 540.0 661.1 345.3 354.3 444.8 5.4 5.5 6.9 13% 7.0 6.9 5.5 - - 14.0 15.8 1.5 4.0
PNB 170 23,944.5 25,477.7 28,989.8 1,324.8 1,714.5 3,248.5 6.2 8.1 15.3 57% 27.3 21.1 11.1 - - 3.8 6.9 1.0 0.6
SBI 307 97,320.7 1,08,920.7 1,24,937.1 10,484.1 14,102.8 17,871.7 13.1 17.7 22.4 31% 23.4 17.4 13.7 - - 7.3 8.7 2.6 0.9
Union Bank of India 145 13,868.0 15,194.8 16,394.4 555.2 (1,112.7) 1,956.2 8.1 -16.2 28.5 88% 17.9 - 5.1 - - - 8.2 0.0 0.0
Yes Bank 313 9,954.1 12,824.1 16,815.8 3,330.1 4,103.8 5,571.2 78.9 18.0 24.4 -44% 4.0 17.4 12.8 - - 17.4 20.4 2.0 0.6
Consumer Goods
Britannia 4,738 9,324.1 10,212.9 11,659.2 884.5 1,009.4 1,243.3 73.7 84.1 103.6 19% 64.3 56.3 45.7 52.0 47.1 33.8 33.7 22.0 0.5
Emami 1,336 2,532.6 2,728.4 3,269.5 549.8 625.2 809.1 24.2 27.5 35.6 21% 55.2 48.6 37.5 35.8 43.8 33.6 37.5 7.0 0.5
GSK Consumer 6,477 4,421.1 4,497.1 5,166.9 656.7 697.5 798.5 156.1 165.8 189.9 10% 41.5 39.1 34.1 32.0 32.7 21.1 21.6 70.0 1.1
GCPL 986 9,608.8 10,380.9 12,207.8 1,307.1 1,469.8 1,831.9 19.1 21.6 26.9 19% 51.6 45.7 36.7 17.9 21.5 24.8 25.1 15.0 1.5
Hindustan Unilever 1,345 34,487.0 37,434.4 42,349.3 4,249.0 5,126.2 6,181.3 19.7 23.7 28.6 20% 68.2 56.7 47.0 101.7 102.5 74.3 74.9 17.0 1.3
ITC 262 55,448.5 64,374.6 74,619.4 10,200.9 11,471.4 13,762.4 8.4 9.4 11.3 16% 31.2 27.9 23.2 31.5 35.7 24.8 27.8 4.8 1.8
Jyothy Laboratories 378 1,749.1 1,865.4 2,206.9 204.1 254.8 247.9 11.3 14.0 13.6 10% 33.5 27.0 27.8 17.6 22.1 21.6 18.3 6.0 1.6
Marico 321 5,935.9 6,449.9 7,515.6 811.0 868.3 1,091.0 6.3 6.7 8.5 16% 50.9 47.9 37.7 44.7 49.7 35.1 37.8 3.5 1.1
Zydus Wellness 1,042 462.6 493.2 577.0 111.3 118.6 144.0 28.5 30.4 36.8 14% 36.6 34.3 28.3 20.8 22.0 19.2 19.8 6.5 0.6
IT / IT services
FSL 41 3,555.6 3,528.3 3,800.2 280.0 294.7 347.9 4.2 4.4 5.2 11% 9.8 9.4 7.9 11.8 12.9 13.3 13.7 0.0 0.0
HCL Technologies 879 46,722.0 50,401.4 56,438.0 8,456.0 8,816.0 9,957.9 60.7 63.3 71.5 9% 14.5 13.9 12.3 29.4 29.2 24.4 23.9 24.0 2.7
Infosys 1,034 68,484.0 70,344.2 77,173.0 14,357.0 14,619.9 15,933.8 62.8 64.0 69.7 5% 16.5 16.1 14.8 27.9 27.6 20.1 19.9 25.8 2.5
Persistent Systems 712 2,878.4 3,062.6 3,443.9 312.9 334.4 369.0 39.1 41.8 46.1 9% 18.2 17.0 15.4 21.8 21.2 16.5 16.1 9.0 1.3
TCS 2,646 1,17,966.0 1,22,172.7 1,34,690.2 26,289.0 25,773.0 28,848.3 137.3 134.6 150.7 5% 19.3 19.7 17.6 32.0 30.9 24.9 23.9 47.0 1.8
Wipro 317 55,040.2 54,922.4 58,277.7 8,489.5 8,945.2 9,687.4 17.5 18.4 19.9 7% 18.1 17.2 15.9 12.1 11.8 14.9 14.1 3.0 0.9
Cap goods / Power
CESC 1,064 7,410.0 8,211.0 8,799.0 862.0 935.0 1,018.0 64.7 70.2 76.4 9% 16.4 15.2 13.9 5.6 5.8 6.9 7.3 10.0 0.9
Crompton Greaves 93 6,119.8 6,073.7 6,890.9 182.7 173.1 266.3 2.9 2.8 4.2 21% 31.8 33.6 21.8 8.0 9.8 4.1 6.0 0.0 0.0
Finolex Cables 702 2,444.9 2,919.7 3,129.2 316.0 353.6 378.8 20.7 23.1 24.8 9% 34.0 30.4 28.4 23.8 22.2 29.5 27.9 3.0 0.4
Greaves Cotton 140 1,634.3 1,726.4 1,815.3 174.7 167.2 175.6 7.2 6.8 7.2 0% 19.5 20.6 19.5 25.1 25.5 17.4 17.7 5.5 3.9
Kalpataru Power 471 4,894.1 5,647.0 6,862.0 269.1 332.0 409.0 17.5 21.6 26.7 24% 26.9 21.8 17.6 18.5 20.2 12.7 14.0 2.0 0.4
KEC International 383 8,584.4 9,611.7 10,927.0 305.0 419.7 536.8 11.9 16.3 20.9 32% 32.2 23.5 18.4 21.3 24.3 23.3 24.2 1.6 0.4
PTC India 120 14,074.8 17,401.3 20,948.9 286.1 333.0 380.9 9.7 11.2 12.9 15% 12.4 10.6 9.3 16.3 17.3 10.1 10.7 3.0 2.5
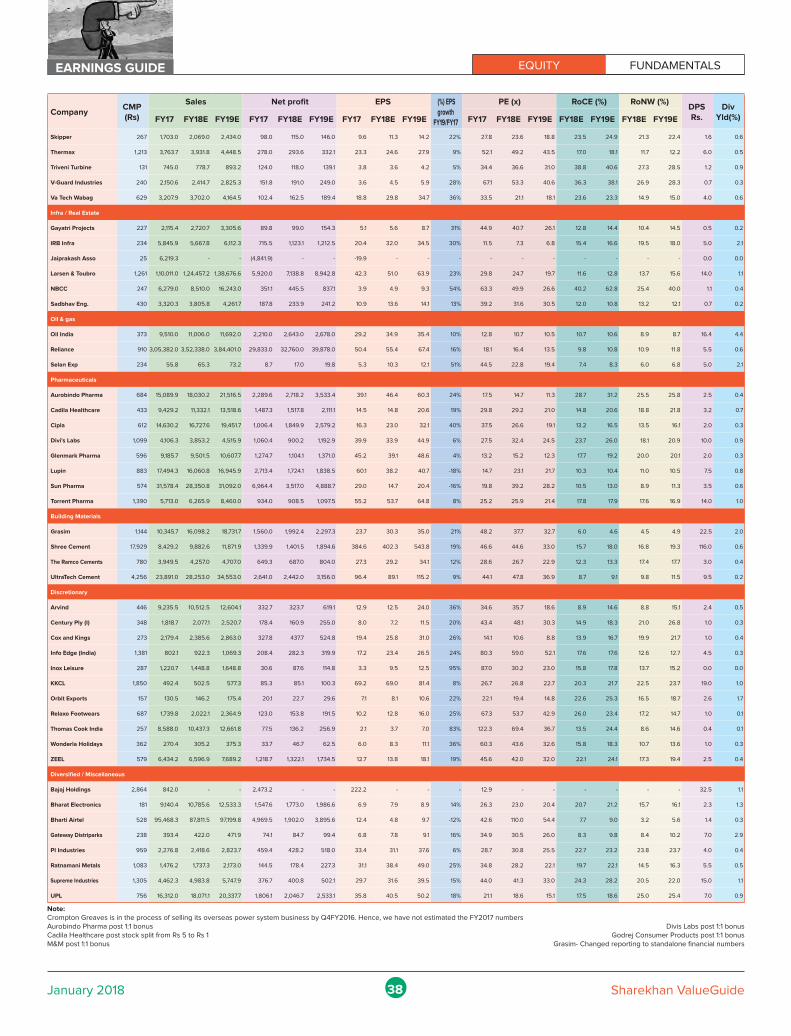
38January 2018 Sharekhan ValueGuide
EQUITY FUNDAMENTALSEARNINGS GUIDE
CompanyCMP (Rs)
Sales Net profit EPS (%) EPSgrowth
FY19/FY17
PE (x) RoCE (%) RoNW (%)DPSRs.
DivYld(%) FY17 FY18E FY19E FY17 FY18E FY19E FY17 FY18E FY19E FY17 FY18E FY19E FY18E FY19E FY18E FY19E
Skipper 267 1,703.0 2,069.0 2,434.0 98.0 115.0 146.0 9.6 11.3 14.2 22% 27.8 23.6 18.8 23.5 24.9 21.3 22.4 1.6 0.6
Thermax 1,213 3,763.7 3,931.8 4,448.5 278.0 293.6 332.1 23.3 24.6 27.9 9% 52.1 49.2 43.5 17.0 18.1 11.7 12.2 6.0 0.5
Triveni Turbine 131 745.0 778.7 893.2 124.0 118.0 139.1 3.8 3.6 4.2 5% 34.4 36.6 31.0 38.8 40.6 27.3 28.5 1.2 0.9
V-Guard Industries 240 2,150.6 2,414.7 2,825.3 151.8 191.0 249.0 3.6 4.5 5.9 28% 67.1 53.3 40.6 36.3 38.1 26.9 28.3 0.7 0.3
Va Tech Wabag 629 3,207.9 3,702.0 4,164.5 102.4 162.5 189.4 18.8 29.8 34.7 36% 33.5 21.1 18.1 23.6 23.3 14.9 15.0 4.0 0.6
Infra / Real Estate
Gayatri Projects 227 2,115.4 2,720.7 3,305.6 89.8 99.0 154.3 5.1 5.6 8.7 31% 44.9 40.7 26.1 12.8 14.4 10.4 14.5 0.5 0.2
IRB Infra 234 5,845.9 5,667.8 6,112.3 715.5 1,123.1 1,212.5 20.4 32.0 34.5 30% 11.5 7.3 6.8 15.4 16.6 19.5 18.0 5.0 2.1
Jaiprakash Asso 25 6,219.3 - - (4,841.9) - - -19.9 - - - - - - - - - - 0.0 0.0
Larsen & Toubro 1,261 1,10,011.0 1,24,457.2 1,38,676.6 5,920.0 7,138.8 8,942.8 42.3 51.0 63.9 23% 29.8 24.7 19.7 11.6 12.8 13.7 15.6 14.0 1.1
NBCC 247 6,279.0 8,510.0 16,243.0 351.1 445.5 837.1 3.9 4.9 9.3 54% 63.3 49.9 26.6 40.2 62.8 25.4 40.0 1.1 0.4
Sadbhav Eng. 430 3,320.3 3,805.8 4,261.7 187.8 233.9 241.2 10.9 13.6 14.1 13% 39.2 31.6 30.5 12.0 10.8 13.2 12.1 0.7 0.2
Oil & gas
Oil India 373 9,510.0 11,006.0 11,692.0 2,210.0 2,643.0 2,678.0 29.2 34.9 35.4 10% 12.8 10.7 10.5 10.7 10.6 8.9 8.7 16.4 4.4
Reliance 910 3,05,382.0 3,52,338.0 3,84,401.0 29,833.0 32,760.0 39,878.0 50.4 55.4 67.4 16% 18.1 16.4 13.5 9.8 10.8 10.9 11.8 5.5 0.6
Selan Exp 234 55.8 65.3 73.2 8.7 17.0 19.8 5.3 10.3 12.1 51% 44.5 22.8 19.4 7.4 8.3 6.0 6.8 5.0 2.1
Pharmaceuticals
Aurobindo Pharma 684 15,089.9 18,030.2 21,516.5 2,289.6 2,718.2 3,533.4 39.1 46.4 60.3 24% 17.5 14.7 11.3 28.7 31.2 25.5 25.8 2.5 0.4
Cadila Healthcare 433 9,429.2 11,332.1 13,518.6 1,487.3 1,517.8 2,111.1 14.5 14.8 20.6 19% 29.8 29.2 21.0 14.8 20.6 18.8 21.8 3.2 0.7
Cipla 612 14,630.2 16,727.6 19,451.7 1,006.4 1,849.9 2,579.2 16.3 23.0 32.1 40% 37.5 26.6 19.1 13.2 16.5 13.5 16.1 2.0 0.3
Divi's Labs 1,099 4,106.3 3,853.2 4,515.9 1,060.4 900.2 1,192.9 39.9 33.9 44.9 6% 27.5 32.4 24.5 23.7 26.0 18.1 20.9 10.0 0.9
Glenmark Pharma 596 9,185.7 9,501.5 10,607.7 1,274.7 1,104.1 1,371.0 45.2 39.1 48.6 4% 13.2 15.2 12.3 17.7 19.2 20.0 20.1 2.0 0.3
Lupin 883 17,494.3 16,060.8 16,945.9 2,713.4 1,724.1 1,838.5 60.1 38.2 40.7 -18% 14.7 23.1 21.7 10.3 10.4 11.0 10.5 7.5 0.8
Sun Pharma 574 31,578.4 28,350.8 31,092.0 6,964.4 3,517.0 4,888.7 29.0 14.7 20.4 -16% 19.8 39.2 28.2 10.5 13.0 8.9 11.3 3.5 0.6
Torrent Pharma 1,390 5,713.0 6,265.9 8,460.0 934.0 908.5 1,097.5 55.2 53.7 64.8 8% 25.2 25.9 21.4 17.8 17.9 17.6 16.9 14.0 1.0
Building Materials
Grasim 1,144 10,345.7 16,098.2 18,731.7 1,560.0 1,992.4 2,297.3 23.7 30.3 35.0 21% 48.2 37.7 32.7 6.0 4.6 4.5 4.9 22.5 2.0
Shree Cement 17,929 8,429.2 9,882.6 11,871.9 1,339.9 1,401.5 1,894.6 384.6 402.3 543.8 19% 46.6 44.6 33.0 15.7 18.0 16.8 19.3 116.0 0.6
The Ramco Cements 780 3,949.5 4,257.0 4,707.0 649.3 687.0 804.0 27.3 29.2 34.1 12% 28.6 26.7 22.9 12.3 13.3 17.4 17.7 3.0 0.4
UltraTech Cement 4,256 23,891.0 28,253.0 34,553.0 2,641.0 2,442.0 3,156.0 96.4 89.1 115.2 9% 44.1 47.8 36.9 8.7 9.1 9.8 11.5 9.5 0.2
Discretionary
Arvind 446 9,235.5 10,512.5 12,604.1 332.7 323.7 619.1 12.9 12.5 24.0 36% 34.6 35.7 18.6 8.9 14.6 8.8 15.1 2.4 0.5
Century Ply (I) 348 1,818.7 2,077.1 2,520.7 178.4 160.9 255.0 8.0 7.2 11.5 20% 43.4 48.1 30.3 14.9 18.3 21.0 26.8 1.0 0.3
Cox and Kings 273 2,179.4 2,385.6 2,863.0 327.8 437.7 524.8 19.4 25.8 31.0 26% 14.1 10.6 8.8 13.9 16.7 19.9 21.7 1.0 0.4
Info Edge (India) 1,381 802.1 922.3 1,069.3 208.4 282.3 319.9 17.2 23.4 26.5 24% 80.3 59.0 52.1 17.6 17.6 12.6 12.7 4.5 0.3
Inox Leisure 287 1,220.7 1,448.8 1,648.8 30.6 87.6 114.8 3.3 9.5 12.5 95% 87.0 30.2 23.0 15.8 17.8 13.7 15.2 0.0 0.0
KKCL 1,850 492.4 502.5 577.3 85.3 85.1 100.3 69.2 69.0 81.4 8% 26.7 26.8 22.7 20.3 21.7 22.5 23.7 19.0 1.0
Orbit Exports 157 130.5 146.2 175.4 20.1 22.7 29.6 7.1 8.1 10.6 22% 22.1 19.4 14.8 22.6 25.3 16.5 18.7 2.6 1.7
Relaxo Footwears 687 1,739.8 2,022.1 2,364.9 123.0 153.8 191.5 10.2 12.8 16.0 25% 67.3 53.7 42.9 26.0 23.4 17.2 14.7 1.0 0.1
Thomas Cook India 257 8,588.0 10,437.3 12,661.8 77.5 136.2 256.9 2.1 3.7 7.0 83% 122.3 69.4 36.7 13.5 24.4 8.6 14.6 0.4 0.1
Wonderla Holidays 362 270.4 305.2 375.3 33.7 46.7 62.5 6.0 8.3 11.1 36% 60.3 43.6 32.6 15.8 18.3 10.7 13.6 1.0 0.3
ZEEL 579 6,434.2 6,596.9 7,689.2 1,218.7 1,322.1 1,734.5 12.7 13.8 18.1 19% 45.6 42.0 32.0 22.1 24.1 17.3 19.4 2.5 0.4
Diversified / Miscellaneous
Bajaj Holdings 2,864 842.0 - - 2,473.2 - - 222.2 - - - 12.9 - - - - - - 32.5 1.1
Bharat Electronics 181 9,140.4 10,785.6 12,533.3 1,547.6 1,773.0 1,986.6 6.9 7.9 8.9 14% 26.3 23.0 20.4 20.7 21.2 15.7 16.1 2.3 1.3
Bharti Airtel 528 95,468.3 87,811.5 97,199.8 4,969.5 1,902.0 3,895.6 12.4 4.8 9.7 -12% 42.6 110.0 54.4 7.7 9.0 3.2 5.6 1.4 0.3
Gateway Distriparks 238 393.4 422.0 471.9 74.1 84.7 99.4 6.8 7.8 9.1 16% 34.9 30.5 26.0 8.3 9.8 8.4 10.2 7.0 2.9
PI Industries 959 2,276.8 2,418.6 2,823.7 459.4 428.2 518.0 33.4 31.1 37.6 6% 28.7 30.8 25.5 22.7 23.2 23.8 23.7 4.0 0.4
Ratnamani Metals 1,083 1,476.2 1,737.3 2,173.0 144.5 178.4 227.3 31.1 38.4 49.0 25% 34.8 28.2 22.1 19.7 22.1 14.5 16.3 5.5 0.5
Supreme Industries 1,305 4,462.3 4,983.8 5,747.9 376.7 400.8 502.1 29.7 31.6 39.5 15% 44.0 41.3 33.0 24.3 28.2 20.5 22.0 15.0 1.1
UPL 756 16,312.0 18,071.1 20,337.7 1,806.1 2,046.7 2,533.1 35.8 40.5 50.2 18% 21.1 18.6 15.1 17.5 18.6 25.0 25.4 7.0 0.9
Note: Crompton Greaves is in the process of selling its overseas power system business by Q4FY2016. Hence, we have not estimated the FY2017 numbers Aurobindo Pharma post 1:1 bonus Divis Labs post 1:1 bonusCadila Healthcare post stock split from Rs 5 to Rs 1 Godrej Consumer Products post 1:1 bonusM&M post 1:1 bonus Grasim- Changed reporting to standalone financial numbers
39January 2018 Sharekhan ValueGuide
EQUITY FUNDAMENTALS EARNINGS GUIDE
Remarks
Automobiles
Apollo Tyres Apollo Tyres Limited (ATL) is the market leader in the truck and bus tyre segments with a 28% market share in India. Domestic operations of the company contribute about 70% to the topline and are poised to grow in double digits, led by strong demand in the commercial vehicle (CV) segment. Further, the imposition of anti-dumping duty on Chinese tyre imports recently will lead to market share gains by domestic tyre companies such as ATL. Moreover, ATL is expanding capacity in Europe and has received approvals from OEMs for the commencement of supplies. We expect topline to report a 13% CAGR over FY2017-FY2020. Raw-material prices, especially crude, have begun to inch up. Crude prices have risen by about 30% in the past four months. Further, rubber prices appear to have bottomed out and are anticipated to move up. We believe the cycle of low raw-material prices for tyre players is over and raw-material basket is on a rise. Hence, we believe margins for tyre players will retract to historical averages of about 11-12%. Further, sub-optimal utilisation in the event of ramp up at Hungary plant is expected to maintain pressure on European operations. Overall, we expect consolidated operating margins of ATL to fall from 14% in FY2017 to 12.4% in FY2020. We retain our Hold rating on the stock with a revised PT of Rs. 292, as we rollover our target multiple on FY2020 earnings.
Ashok Leyland Ashok Leyland Limited (ALL), the second largest CV manufacturer in India, is a pure play on CV. The CV industry is poised for healthy growth in FY2018. Increased freight rates and faster turnaround time for trucks post GST implementation have improved the profitability for fleet operators and would likely drive demand for the MHCV industry. Further, a favourable low base in Q3FY2018 on account of demonetisation will aid growth for the MHCV industry. We expect volumes of ALL to pick up in H2FY2018 and expect 9% volume growth in H2FY2018. Going ahead, margins could expand with improved product mix and a price hike effective from November 2017. Additionally, with the up cycle in the MHCV industry, we expect benefits of operating leverage to kick in, which would aid margin growth ahead. We expect margins to improve from 10.1% in Q2FY2018 to 10.8% in FY2019. We retain our Buy rating on the stock with a revised PT of Rs. 130.
Bajaj Auto Bajaj Auto Limited (BAL) is a leading motorcycle and three-wheeler (3W) manufacturer with a significant presence in export markets. In the domestic market, it is a leader in the premium motorcycle segment. After two consecutive years of volume decline, Bajaj Auto has recently seen recovery in export volumes. With stabilising crude prices, better availability of U.S. dollar and a low base, BAL reported 9% volume growth in exports in H1FY2018 as against an 11% CAGR drop over FY2015-FY2017. In addition, BAL is tapping new geographies for export. With improved volume outlook of existing overseas markets coupled with tapping of new markets, management has raised its export guidance upwards to 1.7 million units for FY2018 as against 1.6 million units guided earlier. Moreover, the outlook for domestic markets is encouraging, given improved industry demand scenario and a favourable base effect for H2FY2018. This, coupled with new launches, will aid volume growth further. We expect domestic volumes to grow 28% y-o-y in H2FY2018. Further, a favourable product mix and price hikes would mitigate the likely increase in cost. We maintain our Buy recommendation on the stock with a revised PT of Rs. 3,625.
Gabriel India Gabriel India Limited (GIL) is one of India’s leading manufacturers of shock absorbers and front forks with a diversified customer base. Overall demand situation for the passenger segment (2W and passenger cars) has improved significantly, as key concerns around GST rollout have been addressed. The transitory impact of new emission norms (for 2W) has also been put behind. OEM is the key segment for GIL, forming about 85% of overall revenue. The company has secured increased share of business with its clients in the 2W OEM segment. Given the strong outlook for automotive OEM production and success of GIL in enhancing share of business with OEM, we expect topline growth to continue with a 17% topline CAGR in the next two years. A robust topline growth of GIL is likely to provide benefits of operating leverage, resulting in margin improvement. Moreover, focus on cost-control initiatives and productivity improvement will further aid margin expansion. We have factored margin expansion of 30 bps and 40 bps, respectively, for FY2018E and FY2019E. We upgrade our recommendation on the stock from Hold to Buy with a PT of Rs. 222.
Hero MotoCorp Hero MotoCorp Limited (HMCL) is the largest 2W manufacturer in the world. The company reported sales of over 6.6 million vehicles in FY2017 and a domestic market share of 39%. Driven by positive rural sentiments on account of the second consecutive year of normal monsoon and higher minimum support price (MSP), outlook for the domestic 2W industry is encouraging. Further, H2FY2018 is likely to witness a favourable base as H2FY2017 was impacted by demonetisation, which significantly dented sales of the company. In addition, HMCL has lined up a slew of new launches in the scooters and premium motorcycle segment in the latter part of FY2018. We have factored a 9% CAGR in domestic volumes for FY2017-FY2019. Given the results, which were in line with our expectations on the operating front, we have broadly retained our earnings estimates for FY2018 and FY2019. We maintain our Buy rating on the stock with a revised PT of Rs. 4,200.
M&M M&M is a leading manufacturer of tractors and utility vehicles (UV) in India. Tractor volumes of the company grew impressively by 23% for FY2017. Farm incomes have also improved, given the second consecutive year of normal rainfall and higher crop MSP. M&M has raised the volume forecast for the tractor industry from 10-12% to 12-14% for FY2018. We expect tractor volume for FY2018 to grow by 15%. In addition, the auto segment’s volumes are expected to grow in double digits over the next two years on account of three new launches. New launches and refreshes will enable the company to regain market share in the UV space. Further, with GST rollout, the hub-and-spoke model will gain traction, leading to strong demand for the LCV segment. We retain our Buy rating on the stock with a revised sum-of-the-parts (SOTP) based PT of Rs. 788.
40January 2018 Sharekhan ValueGuide
EQUITY FUNDAMENTALSEARNINGS GUIDE
Maruti Suzuki Maruti Suzuki India Limited (MSIL) is India’s largest passenger vehicle (PV) manufacturer. The company reported a strong 47% market share as of FY2017. The company has been able to gain market share over the past two years on account of a diverse product portfolio, a large distribution network with increased focus on rural markets and a shift in consumer preference to petrol models from diesel. MSIL is ramping capacity in Gujarat, with production expected to double to 20,000 units per month by Q4FY2018 as against the current rate of 10,000 units per month. With capacity for the first line expected to be reached by the end of FY2018, MSIL has commenced work on operating the second line, which has installed capacity of 2.5 lakh units. With 37% of the portfolio (Brezza, Baleno, Dzire and Ignis) having waiting period of 2-5 months coupled with a strong product pipeline, we expect MSIL to outpace the industry and expect volumes to post a 12% CAGR over FY2018-FY2020 as against industry growth of about 10%. MSIL has recently announced price hikes of up to 2% to tide over input cost increases. The price hike is effective from January 2018 and would be across the model range. Moreover, increased sales of products having robust waiting period coupled with planned launches would result in lower discounting for MSIL, which would augment margins. This coupled with a favourable currency position would aid in margin improvement going ahead and enable MSIL to sustain margin in the range of 15-16%. MSIL continues to remain our top pick in the automotive space. We maintain our Buy recommendation on the stock with a PT of Rs. 10,170.
Rico Auto Rico Auto (Rico) is one of the largest producers of high-pressure non-ferrous die castings for the auto sector. The company has secured project orders worth Rs. 1,900 crore. These orders are executable over a project life of about 5-6 years. The order book implies execution of orders worth Rs. 350 crore on an annual basis, thus strongly improving topline visibility. Further, management is witnessing strong traction in the defence and aftermarket space. Given the robust order book and new growth avenues, management expects topline to report over a 20% CAGR during FY2018-FY2020. Rico would soon be introducing new products, which are part of the recent order wins. As per management, the new products command better margins (in excess of 15%). Further, increased contribution from the high-margin defence and aftermarket segments would aid in margin expansion. Management is aiming at 100-150 bps annual margin expansion and aims to reach 15% margin level in the next 3-4 years as against 10.7% margin in FY2017. Further, given the margin improvement on account of a better product mix, we expect Rico to report robust 39% earnings growth over FY2018-FY2020. We maintain our Buy rating on the stock with a revised PT of Rs. 130.
TVS Motor TVS Motor (TVSM) is the fourth largest 2W manufacturer in the country with a strong presence in the scooter segment. Over the past couple of years, the scooter segment’s growth has surpassed that of the motorcycle segment’s. Currently, it contributes ~30% to the company’s total 2W volumes. Upbeat rural sentiments on account of a normal monsoon for the second consecutive year coupled with a favourable base effect in H2FY2018 (industry volumes had dipped 3% in H2FY2017 on account of demonetisation) are likely to drive volume growth for the 2W industry. TVSM is aiming to outpace the industry’s growth for FY2018 on account of planned new product launches and improved distribution reach. Further, arrangement with a global partner for supply of bikes for its global markets is progressing well and TVS has guided for a run rate of 2,000-2,500 bikes per month. We have factored in a 15% volume CAGR over the next two years as against the expected industry growth of ~10%. TVSM is well poised to outpace industry growth. Moreover, realisation per vehicle would improve as share of the high-value non-moped segment rises. Further, margin of TVSM is likely to reach double-digit mark by FY2019, leading to a strong 36% earnings CAGR over FY2017-FY2019. We retain our Buy rating on the stock and revise our PT to Rs. 825.
Banks & Finance
Axis Bank Axis Bank is the third-largest private sector bank, which continues to grow faster than the industry and has diversified its book in favour of the retail segment (~40% of loans in the retail segment). The bank’s liability profile has improved significantly, which would help sustain margins at healthy levels. We expect earnings growth to remain reasonably strong, driven by healthy operating performance. Though asset quality pressures have emerged as pain points due to exposure in the infrastructure and steel sectors, we expect the stress to persist in the near term.
Bajaj Finance Bajaj Finance, owned by Bajaj Finserv, is a fast-growing, well-diversified leading NBFC in the country. The company has assets spread across products, viz loans for consumer durables, 2Ws and 3Ws, loans to small and medium enterprises (SME), mortgage loans and commercial loans. Apart from its strong loan growth, the asset quality and provisioning for Bajaj Finance remain among the best in the system. Given the strong growth rate, high margins and return ratios, its premium valuations within the NBFC space are justified.
Bajaj Finserv Bajaj Finserv is a financial conglomerate present in the financing business (vehicle finance, consumer finance and distribution) and is among the top players in the life insurance and general insurance segments. Consumer finance (Bajaj Finance) and general insurance businesses of the company continue to report a robust performance, while the life insurance business is showing signs of an uptick, after being affected by a change in regulations.
Bank of Baroda Bank of Baroda is among the top public sector banks (PSBs) having a sizeable overseas presence (over 100 offices in 24 countries) and a strong network of over 5,000 branches across the country. The company has a stronghold in western and eastern India. Performance metrics of the company remain better than that of other PSBs and asset quality has deteriorated in-line with RBI’s directive to clean the balance sheet.
Bank of India Bank of India has a network of over 4,800 branches, spread across the country and abroad, along with a diversified product and services portfolio, and steadily growing assets. Operating performance and earnings have eroded significantly due to margin deterioration and a sharp rise in NPAs. Given the rise in the number of incremental stressed loans and weaker capital position, valuations of the company may remain subdued.
41January 2018 Sharekhan ValueGuide
EQUITY FUNDAMENTALS EARNINGS GUIDE
Capital First Capital First (erstwhile Future Capital Holdings) had been acquired by global private equity firm, Warburg Pincus (with a
36% stake). The present management has taken several initiatives to tap the high-growth retail product segments, such
as gold loans, loan against property and loan against shares. The company has a strong capital adequacy ratio (CAR)
and sound asset quality. Loan book of the company is expected to sustain 25-30% growth over the next three years.
As a result of several initiatives taken in the recent past, the operating leverage will play out and may lead to significant
pick-up in profitability over the medium term.
Federal Bank Federal Bank is among the better-performing old private sector banks in India with a strong presence in south India,
especially Kerala. Under the new management, the bank has taken several initiatives that will improve the quality of its
earnings and asset book. The asset quality has shown stress in the past few quarters. We, however, expect a gradual
improvement in NPAs and operating performance. Valuations seem attractive over the medium to long term.
HDFC HDFC is among the top mortgage lenders in the country providing housing loans to individuals, corporates and
developers. The company has interests in banking, asset management and insurance through its key subsidiaries. As
these subsidiaries are growing faster than HDFC, the value contributed by them would be significantly higher going
forward. Due to a dominant market share and consistent return ratios, the company should continue to command a
premium over other NBFCs. Any unlocking of value from its insurance business will be positive for the stock.
HDFC Bank HDFC Bank is among the top performing banks in the country having deep roots in the retail segments. Despite the
general slowdown in credit growth, the bank continues to report strong growth in advances from retail products.
Relatively high margins (compared with its peers), strong branch network and better asset quality make HDFC Bank a
safe bet with a scope for expansion in its valuations.
ICICI Bank ICICI Bank is India’s largest private sector bank with a network of over 4,850 branches. The bank has made inroads
in to retail loans (~45% of the book) and has significantly improved its liability franchisee. Operating profit improved
significantly, though its exposure to some troubled sectors (such as infrastructure and steel) led to increased pressure
on asset quality. However, healthy growth in operating income and proceeds from monetisation of its stake in various
subsidiaries will help the bank to deal with its NPA challenges.
LIC Housing LIC Housing Finance is one of the largest mortgage financiers in India with a market share of 11% and loan book of
over Rs. 1,00,000 crore. The company is promoted by Life Insurance Corporation of India, which is among the most
trusted brands in the country. With over 200 branches, 1,241 direct sales agents, 6,535 home loan agents and 782
customer relationship associates, the company has one of the strongest distribution structures in India to support
business expansion. Going ahead, a revival in the economy and moderation in borrowing rates could be key triggers for
the stock. Therefore, considering stable RoE of ~20%, sound asset quality and healthy growth outlook, the company’s
fundamentals are strong.
PNB Punjab National Bank (PNB) has strong liability mixes in the banking space, with low-cost deposits constituting over
44% of its total deposits. This helps the bank maintain one of the highest margins among PSBs. However, in view of the
weakness in the economy and higher exposure to troubled sectors, asset quality stress has increased and NPA issues
are likely to persist over the next few quarters.
PFS PTC India Financial Services, owned by PTC India, is focused on providing financial solutions to projects in the energy
value chain. Given the robust lending opportunities in the renewable energy segment and the likely reforms in the
thermal power segment, loan growth is expected to remain strong over the next 2-3 years. The proceeds from exits in
investments would add to profitability. Asset quality, despite some deterioration, is manageable.
SBI State Bank of India (SBI) is the largest bank of India with loan assets worth over Rs. 14 lakh crore. The successful merger
of the associate banks and value unlocking from the insurance business could provide further upside for the bank. While
the bank is favourably placed in terms of liability base and the operating profit is better than peers, asset quality has
emerged as a key pain point, which will affect earnings growth. PSU bank recapitalisation plan by the government could
benefit the bank to make up for capital requirements to promote growth.
Union Bank of India Union Bank of India has a strong branch network and an all-India presence. The bank aspires to become the largest
retail and MSME bank. Hence, it has ramped up its manpower and infrastructure to ramp up retail and SME lending. The
bank’s asset quality challenges have come to the fore (mainly from the corporate portfolio), whereas low tier-1 CAR also
remains an area of concern.
Yes Bank Yes Bank, a new generation private bank, started its operations in November 2004 and has emerged as one of the top
performing banks. The bank follows a unique business model based on knowledge banking, which offers product depth
and a sustainable competitive edge over established banking players. The bank is suitably poised to ride the recovery in
the economy and the retail deposit franchise is showing a sharp improvement, which will support margins in the medium
to long term.

42January 2018 Sharekhan ValueGuide
EQUITY FUNDAMENTALSEARNINGS GUIDE
Consumer goods
Britannia Britannia is the second largest player in the Indian biscuit market with ~30% market share. Under a new leadership,
Britannia has been able to leverage and monetise its strong brand and premium positioning in the biscuits and snacks
segments. The company is well placed to sustain its higher-than-industry growth rate with an improving distribution
reach, deep penetration in rural India, enhanced international business, entry into newer categories and focus on cost
efficiency. Management is confident of regaining double-digit growth at standalone level in the coming quarters.
Emami Emami is one of the largest players in the domestic FMCG market with a strong presence in underpenetrated categories
such as cooling oil, antiseptic cream, balm and men’s fairness cream. The recently acquired Kesh King brand has
improved the product and margin profile of the company. Management expects volume growth to recover to 14-15% in
a short to medium term, as most products are in low-penetrated categories. Management also hopes to enhance its
direct distribution reach to about eight lakh outlets by the end of FY2018. Boroplus cream, Kesh King and Zandu range
of healthcare products will be some of the key volume drivers going ahead. On the international front, MENAP region is
expected to see recovery in revenue performance.
GSK Consumer GSK Consumer Healthcare is a leading player in the malted food drinks (MFD) segment with ~70% share in the domestic
market. GSK Consumer posted decent performance in Q2FY2018 with improved volume growth and margins. We expect
increasing penetration of low-cost packs of Horlicks-based brand in rural markets/small towns; catering to premium and
super premium health food drink (HFD) category through relevant launches and sustained investment behind brands;
and improving penetration in northern and western parts of India to drive long-term growth for the company. We maintain
our Hold recommendation on the stock and will keenly monitor the performance in the coming quarters.
GCPL Godrej Consumer Products Limited (GCPL) is a major player in personal wash, hair colour and household insecticide
market segments in India. The recent acquisitions, i.e. Strength of Nature, Darling Group, Tura, Megasari and Latin
American companies, have helped the company expand its geographic footprint and improve growth prospects. The
strategy of sustained new product additions and enhanced distribution reach in the domestic market bode well for
the company to achieve double-digit revenue growth and stable OPM. Further, the international business is expected
to post better performance, underpinned by the revival in Indonesia and expectations of strong revenue growth and
improvement in profitability in Africa. The recent correction in the stock price provides limited downside risk. Hence, we
recommend a Buy rating on the stock with a PT of Rs. 1,102.
HUL Hindustan Unilever is India’s largest FMCG company. The company saw strong improvement in Q2FY2018 on account
of re-stocking by various trade channels. Moreover, the company’s distributors are explaining small retailers about the
GST impact so that they can get back in trade. This should aid HUL in recovering sales in early H2FY2018. Additionally,
the second consecutive year of better monsoon should drive rural consumption, thus resulting in better revenue growth
in the coming quarter. Further, the company is banking on operating efficiencies through various initiatives and cost-
saving activities at supply- chain/distribution level to see gradual improvement in OPM.
ITC ITC has a strategy of effectively utilising the excess cash generated from its cash cow, the cigarette business, to
strengthen and enhance its other non-cigarette businesses. The recent cess hike on cigarettes will keep cigarette sales
volume under pressure in the near term. The non-cigarette FMCG business would see better growth in the coming
years, with an expected pick-up in rural demand. This, however, will not add substantially to the company’s profitability.
Hence, in view of the near term concerns on the cigarette business, we have a Hold recommendation on the stock.
Jyothy Labs Jyothy Laboratories Limited (JLL) is the market leader in the fabric whitener segment in India. With a pickup in rural
demand and trade channels getting back in trade, management is confident of achieving 14-15% revenue growth in
Q3FY2018. Volume growth is expected to recover to 8-10% in H2FY2018. Henkel’s not exercising option of acquiring
26% stake in the company will not have any impact on the existing licensing agreement between JLL and Henkel for
brands – Pril and Fa. Thus, business fundamentals will remain intact.
Marico Marico is among India’s leading FMCG companies. Core brands, Parachute and Saffola, have a strong footing in the
market. The company follows a three-pronged strategy, which hinges on expansion of its existing brands, launch of
new product categories (especially in the beauty and wellness space) and growth through acquisitions. Marico is one
of the strongest players in the domestic branded hair oil and edible oil markets, with a leadership position in both the
categories. We believe Marico would maintain strong growth momentum post normalisation in the domestic market.
Sustained new product launches and increased distribution reach would improve growth prospects in the long run.
Zydus Wellness Zydus Wellness has a small product portfolio, consisting of just three brands (Nutralite, Sugar Free and Everyuth) that
cater to a niche category. Zydus Wellness has a strong portfolio of leading brands under its portfolio, which are largely
placed in low penetrated categories. Hence, most brands are likely to report double-digit revenue growth in a stable
market environment. The sustenance of double-digit revenue and margin expansion will be key re-rating trigger for the
stock. We will keenly monitor the performance in the coming quarters. We maintain our Hold recommendation on the
stock.
43January 2018 Sharekhan ValueGuide
EQUITY FUNDAMENTALS EARNINGS GUIDE
IT/IT services
Firstsource Firstsource Solutions Limited (FSL) is a specialised BPO service provider. Management remained cautious on the demand trajectory for FY2018 due to a sharp deterioration in its mortgage business and softness in the collection business. Overall, FSL foresees industry-level growth of 6-8% in constant currency (CC) terms in FY2018 and its OPM improving by 50-60 bps on CC basis for FY2018. Health of its balance sheet is improving gradually, as the company is reducing its debt burden consistently through internal accruals. We expect the ongoing macro overhang to restrict the stock’s outperformance in the near to medium term.
HCL Tech HCL Technologies has a leadership position in the engineering and research and development (ERD) and infrastructure management services (IMS) space, which together account for ~58% of the company’s total revenue. Management expects higher acceleration of revenue due to a healthy order book and strong pipeline in the Mode 2 (Digital, Next Gen and Cloud) and Mode 3 services (Product and Platform). However, the company foresees a slowdown in IMS services (38.6% of total revenue) to continue for the near term owing to ongoing delays in the decision-making process for technological spending by clients. The company has not shied away from taking the inorganic route to strengthen its offerings. Additionally, management has made investments in digital technologies (DRYiCE), which will catapult the company to the next level of growth during the ongoing digital transition. However, street is bit concerned on big investments in IBM deal ($780 million) and its successful execution in terms of earnings. We remain positive on the company in view of its large order wins, aggressive bets in ERD space, accelerated pace of investments in the products segment and superior earnings visibility.
Infosys Infosys is India’s premier IT and ITeS company that provides business consulting, technology, engineering and outsourcing services. After the appointment of Mr. Nandan Nilekani as the non-executive chairman of the board, we see some respite in the ongoing tussle between the founder and board. Infosys has anounced the appointment of Salil Parekh as CEO and MD of the company for five years, effective January 2, 2018. He has rich experience in the consulting/IT outsourcing business and has managed similar assignments in the past. This event is positive as it puts an end to uncertainty over leadership. However, we are concerned about steady execution under the new management and the digital transformations strategy. Hence, we await for the commentary on the strategy for Infosys from the new CEO. Thus, we maintain our Hold rating on the stock.
Persistent Persistent Systems has proven expertise, strong presence in newer technologies, strength to improve its IP base and a decent margin profile, all of which sets it apart from other mid-cap IT companies. PSL is focusing on the development of Internet of Things (IoT) products and platforms, as it sees significant traction from industrial machinery, SmartCity, healthcare and smart agriculture verticals. Further, led by the alliance with IBM to build IoT solutions for IBM’s Watson platform and re-sell agreement with IBM, we expect revenue momentum to accelerate in FY2019 and margin improvement in the coming quarters due to the initiatives taken by the company.
TCS Tata Consultancy Services is among the pioneers of the IT services outsourcing business in India and is the largest IT services firm in the country. Digital revenue grew by 29% y-o-y to $3 billion in FY2017. Management expects it to grow much faster in the coming years. Given the macro headwinds, ongoing industry transition and modest earnings growth over FY2017-FY2019E, we do not see enough merits for an upgrade in TCS on a long-term basis.
Wipro Wipro is among the top five IT companies in India. However, in the last few years, it has been lagging industry growth. We believe owing to weakness in verticals such as healthcare and telecom, it is unlikely to show material improvement in FY2018 earnings. Management is hopeful that the company will deliver industry-level revenue growth by Q4FY2018. Further, management has given an ambitious target of $15 billion revenue and 23% margin by 2020. We see new CEO Abid Ali Neemuchwala’s target as an uphill task, looking at the current growth trajectory. We remain skeptical, as anecdotal evidence on Wipro over the past 2-3 years does not inspire confidence.
Capital goods/Power
BHEL Bharat Heavy Electricals Limited (BHEL), India’s biggest power equipment manufacturer, has been the prime beneficiary of the multi-fold increase in the investments made in the domestic power sector over the past few years. However, order inflow has been showing signs of slowing down, which would remain a major concern for the company. Hence, on weak order outlook and slower execution, we close our call and recommend booking out on the stock.
CESC CESC is the power distributor in Kolkata and Howrah (backed by 1,225MW of power generation capacity), which is a strong cash-generating business. Further, 600MW of regulated generation capacity (to serve Kolkata distribution) has come on stream recently in Haldia. Moreover, its 600MW thermal power project at Chandrapur has signed PPA and started operating. Losses in the retail business have been coming down gradually over the past and are expected to breakeven soon. The BPO subsidiary, Firstsource, is performing well, in-line with expectations. However, the recent diversification into unrelated businesses such as IPL franchisee would hurt its valuations. CESC has announced the demerger of its business into four verticals, namely power distribution, power generation, retail and IT outsourcing. The restructuring looks beneficial for minority shareholders optically. However, we await clarity on the financials of the demerged companies.
44January 2018 Sharekhan ValueGuide
EQUITY FUNDAMENTALSEARNINGS GUIDE
Crompton Greaves Key businesses of Crompton Greaves - industrial and power systems - are going through a rough patch and are potential beneficiaries of the upcoming investment cycle revival. Moreover, the company is looking to unlock value by selling its international subsidiaries.
Finolex Cables Finolex Cables, a leading manufacturer of power and communications cables, is set to benefit from an improving demand environment in its core business of cables. The company is leveraging its brand strength to build a high-margin consumer product business. The company has recently launched fans and switch gears. The company is planning to launch water heaters soon. The addition of new products in its product portfolio could prove to be the next growth driver. We anticipate healthy earnings growth, return ratios in high teens and superior cash flows, which bode well for the stock. Therefore, we remain positive on the stock.
Greaves Cotton Greaves Cotton Limited (GCL) is a mid-sized and well-diversified engineering company. Core competencies of the company are in diesel/petrol engines, power gensets, agro engines and pump sets (engine segment). GCL is aiming to strengthen its presence in the aftermarket segment by introducing new products and ramping up its multi-brand aftermarket division. However, the 3W engine business (contributing about 40% to GCL topline) is expected to remain muted in the medium term. Structural shift from the 3W segment in favour of LCV will lead to flat to low single-digit growth for the 3W industry in the medium term. In addition, adoption of electric 3W led by government policy support will also impact GCL prospects as the company has not tied up with any OEM so far and electric vehicles are not its core competence. We expect the 3W business to continue to be a drag and expect a modest 5% overall topline CAGR over the next two years. The 3W business is likely to largely offset growth in the aftermarket and agri segments. We downgrade our recommendation on the stock from Buy to Hold, with a revised PT of Rs. 137.
Kalpataru Kalpataru Power Transmission is a leading EPC player in the power transmission and distribution space in India. Opportunities in this space are likely to grow significantly, thereby providing healthy growth visibility. OPM of the standalone business is likely to remain around 10%, while OPM of JMC Projects (a subsidiary) is showing signs of improvement. We see some value-unlocking potential from the sale of assets or listing of new business in future. We remain positive on the stock.
KEC KEC International is a global power transmission infrastructure EPC major. The company is present in the verticals of power T&D, cables, railways, water, renewable (solar energy) and civil. Globally, the company has powered infrastructure development in more than 61 countries. KEC is a leader in power transmission EPC projects and has more than seven decades of experience. Over the years, the company has grown through the organic as well as inorganic route. We estimate OPM to improve to ~10% and D-E ratio to improve to 0.6:1 by the end of FY2019E. We retain our positive outlook on the stock.
PTC India PTC India is a leading power trading company in India with a market share of 35-40% in the short-term trading market. Over the past few years, the company has made substantial investments in areas such as power generation projects and power project financing, which will start contributing to its earnings. We retain our positive stance on expected healthy volume uptick, with an increasing share of long-term contract business.
Skipper Skipper is uniquely placed to exploit the growing opportunities in two lucrative segments: power (transmission tower manufacturing and EPC projects) and water (PVC pipes). The company had a comfortable order book of Rs. 2,640 crore at the end of Q1FY2018 in the transmission business, which looks promising given the huge investments proposal by the government in the power T&D segment over the next five years. The company has expanded the PVC capacity manifold (4x) and aspires to turn into a national player from a regional player.
Thermax The energy and environment businesses of Thermax are direct beneficiaries of the continuous rise in India Inc’s capex. Thermax Group’s order book stands around its consolidated revenue. However, the company has shown an ability to maintain double-digit margins in a tough macroeconomic environment. We retain our Hold rating on the stock due to its rich valuation.
Triveni Turbines Triveni Turbines Limited (TTL) is a market leader in the 0-30MW steam turbine segment. TTL is at an inflection point with a strong ramp-up in the after-market segment and overseas business, while the domestic market is showing distinct signs of a pick-up. The company has also formed a JV with GE for steam turbines of 30-100MW range, which is likely to grow multi-fold in the next 4-5 years. TTL is virtually a debt-free company with a limited capex requirement and an efficient working capital cycle, reflected in very healthy return ratios. Further, boosted by the expected uptick in the domestic capex cycle, earnings of the company are likely to grow by 15-16% per year over the next two years.
V-Guard V-Guard Industries is an established brand in the electrical and household goods space, particularly in south India. Over the years, it has successfully ramped up its operations and network to become a multi-product company. The company has a strong presence in the southern region. The company is also aggressively expanding in non-south markets and is particularly focusing on tier-II and III cities where there is lot of pent-up demand for its products. We remain positive on the stock.
Va Tech Wabag VA Tech Wabag (VTW) is one of the world’s leading companies in the water treatment field with eight decades of plant-building experience. Given the rising scarcity of fresh water, we expect flow of huge investments in the water segment, both globally and domestically. With rising urbanisation and industrialisation in India, we expect substantial investments in this space. Given the large opportunity ahead and inherent strengths of VTW, such as professional management, niche technical expertise and global presence, we remain positive on the stock.
45January 2018 Sharekhan ValueGuide
EQUITY FUNDAMENTALS EARNINGS GUIDE
Infrastructure/Real estate
Gayatri Proj Gayatri Projects is a Hyderabad-based infrastructure company with a strong presence in irrigation, road and industrial
construction businesses. Order book of the company stands at Rs. 11,933 crore, which is 5.6x its FY2017 revenue.
Further, the company expects to sustain 30%+ topline growth over the next 3-4 years with OPM around 15%. The
company has completed its power and road BOT portfolio and plans to unlock value by offloading stake to private
equity. The company has the potential to transform itself into a bigger entity.
IRB Infra IRB Infrastructure Developers is the largest toll road BOT player in India and the second largest BOT operator in
the country with all its projects being toll based. The company has an integrated business model with an in-house
construction arm, which provides a competitive advantage in bidding for larger projects and captures the entire value
from BOT assets. Further, the company has a profitable portfolio as majority of its operational projects have become
debt-free and are present in high-growth corridors, providing it a healthy cash flow. Thus, the company is well poised
to benefit from the huge opportunity in road development projects on account of its proven execution capabilities and
scale of operations.
Jaiprakash Asso Jaiprakash Associates has been facing earnings pressure across business verticals. The company has just concluded
its cement asset sale worth Rs. 16,000 crore and transferred 1,000 acres worth Rs. 13,000 crore to an SPV, which will
reduce its debt burden. Going ahead, the company will be focusing primarily on EPC business and balance portfolio of
business verticals and aim to reduce its debt further. The current business restructuring has led to a cautious view on
the stock.
L&T Larsen & Toubro (L&T), being the largest engineering and construction company in India, is a direct beneficiary of the
domestic infrastructure capex cycle. The company is expected to perform well, backed by its sound execution track
record and healthy order book. Monetisation of the non-core businesses will continue for some time, leaving scope for
further value unlocking. Measures planned by the company to improve its return ratios augur well. Hence, we remain
positive on the stock.
NBCC NBCC (India), a Navratna public sector enterprise is notified as a Public Works Organisation (PWO), which gives it a
unique eligibility to bag orders on a nominated basis from government departments and PSUs. NBCC has already
amassed a huge order book, which gives it a strong revenue visibility for the next five years. Moreover, future prospects
look much brighter, given the opportunities from multiple areas such as redevelopment of old government colonies in
Delhi, Rajasthan and Odisha, development of government lands, Smart Cities, ‘Housing for All 2022’ and ‘Amrut’. We
remain positive on the stock considering the huge competitive advantage, a unique business model, high return ratios
and healthy cash flows.
Sadbhav Eng SEL is engaged in 1) EPC business for transport, mining and irrigation sectors and 2) development of roads and highways
on BOT basis through SIPL. SEL has a healthy order book of Rs. 7,715 crore (2.8x its FY2017 revenue, with presence in 11
states). The company has robust in-house integrated execution capabilities with qualified human resource and owned
equipment. We expect SEL to benefit from improved order execution, enhanced order inflows (particularly from the
transport segment) and resolution of working capital issues, resulting in a sturdier balance sheet. Further, improving
outlook for the Indian road sector and limited competitive intensity augur well for SEL since it is present in both, asset
creation and EPC verticals.
Oil & Gas
Oil India Oil India has several hydrocarbon discoveries across reserves in Rajasthan and the north-eastern region of India. The
company holds 2P (proved and probable) reserves of 79 mmt for oil and 124 mmtoe for gas. Reserve-replacement ratio
of the company is also healthy. The recent increase in oil price and gradual revival in production has improved the
earnings outlook. Operational performance of the company is healthy and the stock offers high dividend yield.
Reliance Industries Reliance Industries has one of the largest and complex refining businesses in India and enjoys a substantially higher
refining margin over the benchmark GRM. We expect GRM to remain healthy and the petrochem margin to be maintained
in the medium term on an uptick in domestic demand. Capex in the downstream business (incremental capacity in the
petchem business and petcoke gasification in refining) would be the key earnings driver in the coming years. Large
investment in Reliance Jio could add value in the long term.
Selan Exploration Selan Exploration Technology is an oil E&P company with five oil fields in the oil-rich Cambay basin of Gujarat. Initiatives
to monetise oil reserves in its Bakrol and Lohar oil fields will improve production. However, challenges related to
monetisation of its large hydrocarbon reserve base and near-term production ramp-up issues are likely to be an
overhang on the stock in the near to medium term.
46January 2018 Sharekhan ValueGuide
EQUITY FUNDAMENTALSEARNINGS GUIDE
Pharmaceuticals
Aurobindo Pharma Aurobindo Pharma is set to post healthy growth on account of ramp-up in the U.S. and European markets, thanks to a strong product pipeline built over a period and focus on niche segments such as injectibles, hormones, penems and sterile products. The expected increase in the export-led business and a favourable tilt in revenue mix are likely to boost margins, resulting in faster earnings growth as compared to revenue. Pricing pressure, USFDA inspections and an appreciating rupee warrant a caution in the near term. Management has guided for the launch of over 25 products (more approvals of complex products) in the coming years, which will help Aurobindo Pharma to achieve higher growth and mitigate the increasing pricing pressure in the U.S. market.
Cadila The USFDA inspected Cadila Healthcare’s Moraiya facility and gave a clearance without any Form 483 observations. This cleared the big overhang on the growth prospects of its U.S. business (which was affected due to delayed product approvals by the USFDA), as the pace of approval will improve going ahead. We feel several high-value products such as generic Toprol XL, Lialda, transdermal and respiratory products would receive approval in the near to medium term. This would be a key catalyst for growth and margin expansion over FY2018-FY2019. However, an appreciating rupee coupled with double-digit pricing pressure in the U.S. business (10-12% for FY2018 and 8-10% in FY2019) warrant caution for the near term. In addition, increased tax rate guidance from earlier 12-15% to 22-25% for FY2018 and 22% for FY2019-FY2020 is expected to significantly affect profitability.
Cipla Cipla has brought about a paradigm shift in its business strategy. Management sounded confident of ramping up its U.S. and EU businesses with new product launches, and expects benefits from cost-control initiatives to drive earnings from FY2018. Management maintains guidance of double-digit growth in the U.S. and India businesses despite a challenging environment on account of new product launches planned for FY2018 and FY2019 (one niche product every quarter). Cipla has an exhaustive pipeline of inhalers and complex generics, which has a huge market size. These opportunities will escalate revenue growth and will boost the topline in the long run. The company has recently received establishment inspection reports (EIRs) for Indore, Goa and InvaGen plants.
Divis Labs Successful resolution of an import alert and warning letter in a short span is a big positive for Divis. Hence, we expect the business to improve from H2FY2018 and resume normalcy from FY2019 as business from non-exempted products will resume, two blocks at Unit-1 will be commercialised and a new plant at Vizag would to be completed in FY2019. Hence, we have upgraded our recommendation to Buy with a revised PT of Rs. 1,275, as successful resolution of import alert and warning letter in a short span of time restore confidence in the company and its management.
Glenmark Pharma The finished dosage facility of Glenmark Pharmaceuticals Limited (Glenmark) at Baddi underwent USFDA audit from November 6-11, 2017, and received Form 483 with seven observations. Development is sentimentally negative at the moment, as we feel there is no data integrity-related observation or a repeat one. Hence, there are lower chances of escalation of Form 483 to a Warning Letter/Import Alert. The company is in the process of providing a comprehensive response to observations and would be replying to the FDA shortly (outcome of which shall be closely monitored). However, we remain cautioned as pricing pressure in the U.S. base business, limited visibility of margin expansion, increasing capex and R&D cost and lower-than-expected debt reduction remain key overhangs on the stock in the near term. Timely monetisation of key products and a big licensing deal in the R&D business (GBR-830 reported positive data in phase 2a) will be key positive triggers to watch out for.
Lupin The USFDA has issued a combined warning letter (on November 6, 2017) to Lupin’s two formulation manufacturing facilities at Goa and Indore (Pithampur unit -2). The development is a setback to Lupin as its key plants have been issued a warning letter together. While there will not be any disruption of existing product supplies from both locations, there will be a delay in new product approvals from the mentioned sites, which shall significantly pressurise the existing base business in the U.S. (owing to increased completion in existing products and increased pricing pressure due to channel consolidation). Both sites put together would account for over 50% sales from the U.S. We maintain our Hold rating on the stock, yet we advise investors to avoid bottom fishing and await more clarity on the development. We are putting the PT under review till further clarity emerges.
Sun Pharma Sun Pharma recently announced that the USFDA has accepted its New Drug Application (NDA) for OTX-101 (cyclosporine A, Ophthalmic solution), marking an important developmental milestone for its dry eye candidate. The acceptance of NDA is positive from the company’s efforts to build its speciality pipeline in the U.S. Moreover, it follows the company’s decision to withdraw 15 pending ANDAs and 1 NDA in the U.S., which was seen as a precursor to resolution of regulatory issues at Halol. Taking this development into consideration, we also anticipate that the company could be looking at re-inspection at its Halol plant in the near future. Sun Pharma has already completed remediation steps a quarter back. Currently, we have not factored in any upside from the closure of warning letter of Halol in our FY2018 estimates. We maintain our Hold rating with a PT of Rs. 600.
Torrent Pharma Torrent Pharma announced its acquisition of Unichem Laboratories’ domestic branded business (Rs. 841.5 crore sales in FY2017) along with a manufacturing facility in Sikkim and ~3,000 employees for a consideration of Rs. 3,600 crore (4.3x sales). Management expects the deal to be cash accretive for the first year and EPS accretive from the third year of operations, which will depend on the company’s ability to ramp up the acquired business. Hence, we feel that though the deal is a strategic fit, it will weaken core earnings for the short term and result in debt hangover (~75% funding will be via debt i.e. ~Rs. 2,800 crore increase in debt). We have upgraded our rating to Hold, with a revised PT of Rs. 1,480, as we feel the acquisition may prove to be a prudent step as it helps to reduce dependence on the U.S. market.
47January 2018 Sharekhan ValueGuide
EQUITY FUNDAMENTALS EARNINGS GUIDE
Building materials
Grasim Grasim is better placed compared to other large players in the cement space owing to its strong balance sheet,
comfortable debt/equity ratio, attractive valuation and diversified business. The full ramp-up of the Vilayat plant
(increasing capacity to 804,000 tonne) is likely to aid VSF volumes going ahead, though prices may soften in the near
term. Further, the merger of Aditya Birla Chemicals India Ltd. (ABCIL) and expansion in the caustic soda division are likely
to maintain strong performance in the chemical division. On the cement front, the company expects demand to pick up
in the near term, while slow execution of government projects and surplus inventory remain areas of concern.
The Ramco Cements The Ramco Cements, one of the most cost-efficient cement producers in India, will benefit from capacity addition carried
out ahead of its peers in the southern region. The company is mulling over the expansion of its satellite grinding
capacity from 4 mtpa to 7.1 mtpa at a cost of Rs. 1,095 crore. The expansion aims to strengthen reach in Andhra Pradesh,
West Bengal and North Eastern states. The company has reaped the benefits through cost-saving measures, besides
constantly reducing debt, which has led to improved profitability. In a nutshell, better volumes, cost efficiencies and
reducing leverage have yielded benefits.
Shree Cement The expansion plan of Shree Cement to reach 40 mtpa by FY2020 (currently 27.2 mtpa) and increasing geographical
footprint in the eastern and southern regions is likely to aid better volume growth going ahead. Pricing discipline in the
cement business should help improve realisations over FY2018 to FY2020. However, increased cost structure (power
and freight cost) affecting operating margins and higher effective tax rate are likely to limit net earnings growth in the
near term.
UltraTech Cement UltraTech Cement is India’s largest cement company. The capacity is expected to reach 95.4 mtpa by the end of FY2019.
We expect UltraTech to report industry-leading volume growth on account of timely capacity expansion (acquisition of
Jaypee Group’s cement assets) and likely revival in demand (with the start of affordable housing projects and enhanced
spending on infrastructure development). However, rise in the cost of petcoke and diesel along with integration of
Jaypee Group’s cement asset integration pose a near term risk to operating margin.
Discretionary consumption
Arvind Arvind is one of India’s leading vertically integrated textile companies with an experience of more than eight decades in
the industry. The company has switched itself into the branded retail space by enhancing its branded portfolio. Arvind
is a licensee for marketing various marquee global brands in India such as Arrow, US Polo, Tommy Hilfiger, and Calvin
Klein. The company also operates specialty retail stores under licensee brands such as GAP, The Children’s Place,
Aeropostale and Sephora. The company is also present in the retail space through Unlimited and The Arvind stores.
Management proposes to demerge its branded, retail and engineering businesses as both these have matured enough
to enhance their growth prospects in the coming years. Moreover, listing these businesses as separate entities will
help create value for the businesses, as separate leadership and development of best strategies for the business will
enhance focus.
Century Plyboards Century Plyboards is a leading player in the organised plywood industry with a market share of 25%. Strong growth in
the sector, Century’s premium positioning and brand equity strength and the successful rollout of GST would enable it
to report revenue CAGR of 17.7% over FY2017-FY2019E. Earnings are likely to report a 19.6% CAGR over FY2017-2019E
on account of revenue growth and better absorption of fixed costs. We believe structural growth triggers for Century
Plyboards are becoming visible due to: 1) GST implementation (expected to result in a shift of market share to organised
players from unorganised players, as they lose cost advantage); 2) the government’s relentless focus on affordable
housing; and 3) MDF unit getting operational in tandem with GST implementation.
Cox & Kings Cox & Kings is an integrated player in the tourism and travel industry, with a strong presence in the global leisure travel
segment and the education tourism segment in Europe. The company has a 30% market share in the global outbound
tourism market. Domestic leisure travel and Meininger Hotels have maintained strong revenue growth momentum,
while the international leisure travel business is in the recovery mode. Operating performance of the education travel
business is expected to revive in the coming quarters. Reduction in debt continues to reduce stress on the balance
sheet and makes it a better play in the travel and tourism space. Hence, we maintain our Buy recommendation on the
stock with unchanged price target of Rs. 325.
Info Edge (India) Info Edge is India’s premier online classified company in the recruitment, matrimony, real estate, education and related
service sectors. Naukri.com is a quality play and is directly related to GDP growth and internet/mobile penetration.
Management believes the impact of RERA has bottomed-out and the revival can be expected in major cities such as
Mumbai and Pune. Thus, the company has started discussions with potential developers and spending more on marketing
(Q3FY2018 vs. earlier) in anticipation that the registered brokers/developers in major cities will start spending more to
meet the pent-up demand. The ramp-up in promotional expenses will weigh on 99acres’ profitability performance. We
continue to derive comfort on Info Edge’s business strength, with leading market share in key businesses. We expect its
earnings trajectory to catch up, as macro headwinds subside.
48January 2018 Sharekhan ValueGuide
EQUITY FUNDAMENTALSEARNINGS GUIDE
INOX Leisure INOX Leisure Limited (ILL), India’s second largest multiplex operator with 120 properties and 481 screens across 58 cities (accounting for about 20% of the multiplex screens in India), is scripting a blockbustre growth story through a mix of inorganic and organic expansion plans. The ILL mega show is supported by an improving content quality in the Indian mainstream and regional cinema with its movies regularly hitting the Rs. 100 crore or Rs. 200 crore box-office collection mark. FY2017 was a difficult year for Inox and management expects FY2018 to be a better year, underpinned by a strong content pipeline, GST implementation and improvement in other operating metrics. We continue to remain positive on ILL from a long-term perspective, given its pan-India growth plans, healthy balance sheet (lower financial leverage) and potential benefits from GST rollout.
KKCL Kewal Kiran Clothing Limited (KKCL) is a branded apparel play with four brands in its kitty. Killer, its flagship denim brand, has created a niche in the minds of consumers. Q1FY2018 was dull because of inventory destocking by various trade channels. Management is confident of regaining growth in H2FY2018 as consumer demand is expected to improve on account of stable inflation and better macro environment. In view of near-term GST headwinds and slow recovery in discretionary categories, we maintain our Hold recommendation on the stock.
Orbit Exports Orbit Exports (Orbit) is a leading manufacturer and exporter of novelty fabrics, exporting its products to over 32 countries. The company is a recognised star export house and operates in the niche area of high-end fancy fabrics, which are mainly used by designers in women’s fashion apparels. Management indicated that the Latin American business has started recovering and good performance can be expected in the coming quarters. The Middle East business is, however, expected to remain under pressure. The high-margin Ribbons & Made-ups business is expected to grow in strong double digits. Overall, management is confident of growing in mid-to-high teens in the short to medium term. Further, Orbit has one of the better balance sheets in the textiles industry. We expect it to improve further in the coming years. However, in view of near-term concerns in export markets, we maintain our Hold rating on the stock.
Relaxo Footwear Relaxo Footwear is present in the fast-growing footwear category, where it caters to customers with its four top-of-the- mind recall brands, such as Hawaii, Sparx, Flite and Schoolmate. The company has emerged as an attractive investment opportunity owing to its growing scale, strong brand positioning and healthy financial performance. Relaxo has a superior portfolio of footwear brands and its relentless focus on driving sales through the expansion of distribution and improving the brand presence augur well for the company to achieve good growth in the backdrop of better demand environment. Moreover, GST implementation will be a key growth lever for Relaxo, as a large part of the Indian footwear market is unorganised (~60%).
Thomas Cook (I) Thomas Cook India Limited (TCIL), owned by value investor Prem Watsa, is an integrated leisure travel and human service management company in India. FY2017 was a year of integration for the travel and HR businesses of TCIL. With recent acquisitions in the domestic and international markets, the travel and related business and HR business would remain key growth drivers in the near term. The foreign exchange business will continue to complement the travel and travel-related services businesses in the long run. We maintain our Hold recommendation on the stock.
Wonderla Holidays Wonderla Holidays Limited (WHL) is the largest amusement park company in India with over a decade of successful and profitable operations. The company owns and operates two amusement parks under the brand name Wonderla in Kochi and Bengaluru and came up with a third park in Hyderabad in Q1FY2017. The setting up of a new park in Chennai will make WHL one of the strongest players in South India. We expect footfalls at Bangalore and Kochi parks to remain under pressure in the coming quarters, as price hikes will take some time to get absorbed in the market. The increase in tax under GST will put a toll on average ticket revenue and, consequently, overall revenue growth of the company in the near term. Thus, in view of near-term headwinds on footfalls, we have downgraded our rating on the stock to Hold from Buy earlier.
Zee Entertainment Zee Entertainment Enterprises Limited (ZEEL), part of the Essel Group, is one of India’s leading television media and entertainment companies. The company has a bouquet of more than 40 channels across Hindi, regional, sports and lifestyle genres. ZEEL continues to outperform the broadcasting advertising market and expects to continue the momentum with an improvement in macro economy. As demonitisation and GST are behind now, management expects ad revenue growth will remain at around mid-teens during 2HFY2018. Domestic subscription revenue growth is expected to be in a low-teen CAGR for the next 3-4 years. Management is confident to maintain margins at 30%+ level despite investments in digital offerings. Without investments, margins can go to 34%+ level. ZEEL consistently focuses on its five key pillars to drive its growth. We believe successful execution of this strategy will have a material impact on sustainable growth going forward. We continue to see ZEEL as the prime beneficiary of macro revival and digitisation.
Diversified/Miscellaneous
Bajaj Holdings Bajaj Holdings and Investment Limited (BHIL, erstwhile Bajaj Auto) was demerged in December 2007, whereby its manufacturing business was transferred to the new Bajaj Auto Limited (BAL) and its strategic business consisting of the wind farm and financial services businesses was vested with Bajaj FinServ (BFS). All the businesses and properties, assets, investments and liabilities of erstwhile Bajaj Auto, other than the manufacturing and strategic ones, now remain with BHIL. BHIL is a primary investment company focusing on new business opportunities. Given the strategic nature of its investments (namely BAL and BFL), we have given a holding company discount of 50% to its equity investments. Liquid investments and investments in other group companies have been valued at cost. Further, the PT for BFS has been revised upwards to Rs.6,050, while that for BAL has been revised upwards to Rs. 3,625 as the business has exhibited traction and is likely to improve further. Consequently, we have maintained our Buy recommendation on BHIL with a revised PT of Rs. 3,595.
49January 2018 Sharekhan ValueGuide
EQUITY FUNDAMENTALS EARNINGS GUIDE
BEL Bharat Electronics Limited, a PSU manufacturing electronic, communication and defence equipment, stands to benefit
from the enhanced budgetary outlay for strengthening and modernising the country’s security equipment. The ‘Make
in India’ initiative of the government will support earnings growth in the coming years, as it is the only player with
strong research and manufacturing units across the country. The current order book of around Rs. 41,746 crore provides
revenue visibility for the next 3-4 years.
Bharti Airtel Bharti Airtel is the leader in the Indian mobile telephony space. Of late, the telecom sector is witnessing pricing sanity
and diminishing competitive intensity. Further, with media reports suggesting Reliance Jio going public in late 2018 or
early 2019, we expect a favourable competitive environment and lesser predatory pricing action. Industry consolidation
(three-player market, with the exit of smaller players) will help Airtel to maintain its leading position in revenue market
share with improving profitability. Going forward, from a long-term perspective, explosive growth in the data segment,
strong network, acquisitions (Tata Tele and Telenor) and reach will help Bharti emerge stronger. We have a Buy rating on
the stock.
GDL With its dominant presence in the container freight station (CFS), rail freight and cold chain businesses, Gateway
Distriparks has evolved as an integrated logistics player. The CFS business is a cash cow, while its investments in the
rail freight and cold storage businesses have started bearing fruits. The company is one of the largest players in the
CFS business and has evolved as the largest player in the rail freight business as well as the cold storage business. The
proposed capex for all the three segments will strengthen its presence in each of the segments and increase its pan-
India presence going forward.
Max India Max India has demerged into three different entities, of which Max Financial Services will hold Max Life Insurance (new
Max IndiWa will hold Max Healthcare, Max Bupa Health Insurance and Antara businesses). Max Life Insurance (held by
Max Financial Services) is among the leading private sector insurers and has gained critical mass and enjoys the best
operating parameters in the industry. As the insurance sector is showing signs of stabilisation, the company’s favourable
product mix and a strong distribution channel will result in healthy growth in premiums and profits.
PI Industries PI Industries (PI), a leading agro chemical company, has a differentiated business model focusing on the fast-growing
custom synthesis and manufacturing (CSM) business, which contributes 60% to its revenue. PI is gradually ramping
up production at Jambusar facility. The company has introduced three new products (one maize herbicide and two
rice fungicides) during 1HFY2018 and has lined up two new product launches during 2HFY2018. Further, utilisation
of the new plant at Jambusar (phase 3) is likely to ramp up over the next 2-3 quarters. The company is well placed in
the domestic market, led by a robust domestic portfolio with focus on in-licensing and specialty products. The CSM
business was muted in the last two years, led by weakness in the global agrochemical market. The stock price of PI has
appreciated by 16.5% since our Q2FY2018 update on October 30, 2017. With the recent run up in the stock price, the
valuation currently stands at 25.5x its FY2019E earnings, which is in-line with its historical premium valuations. We are
positive on the long-term perspectives of the company such as introduction of new products in the domestic market,
entry into pharma and revival in CSM business. We believe the stock is fairly valued at this price. Therefore, we are
revising our recommendation to Hold with a revised PT of Rs.1,000 (rolling it over to FY2020 earnings).
Ratnamani Metals Ratnamani Metals and Tubes Limited (RMTL) is the largest stainless steel tube and pipe manufacturer in India. Despite
a challenging business environment due to increasing competition, we remain positive on RMTL on account of its
strong balance sheet, ability to generate superior return ratios in the coming years and expansion of Seamless SS tube
capacity in the next few years. Further, management has maintained a strong outlook on the potential opportunities in
the oil and gas sector, city gas distribution projects, cross-country pipelines and inter-linking of rivers across India.
Supreme Industries Supreme Industries is a leading manufacturer of plastic products with a significant presence across the piping,
packaging, industrial and consumer segments. We remain positive on its new launches of value-added products and
capacity expansion plans, which are largely funded by its robust internal accruals. The company enjoys superior return
ratios with low gearing levels. With diversified products, an extensive distribution network, improved capital structure
and government thrust on better infrastructure, Supreme Industries has emerged as one of the best proxy plays on the
increasing use of plastic consumption in India. Hence, we remain positive on the stock.
UPL UPL is a leading global producer of crop protection products, intermediates, specialty chemicals and other industrial
chemicals. The company is present across agricultural inputs segment, ranging from seeds to crop protection products
and post-harvest activities. The company has also started to focus on premium products in agro-chemicals. UPL has
outpaced the global agrochemical industry, growing at ~17% for FY2017 as against a decline of ~2.5% for the industry.
Consequently, the company has gained ~1% market share. Moreover, agro-commodity prices are likely to remain lower
going ahead, which in turn will boost demand for generic products, in which UPL is a major player. A positive outlook for
geographies such as India, Europe and Latin America would also drive revenue growth going ahead. Further, several
patent expiries of significant agrochemicals, the value of which is pegged at ~$4 billion over the next three years, augur
well for UPL to leverage the opportunity. We expect topline to report a 12% CAGR over the next two years. Considering
the benefits of operating leverage and a better product mix, OPM is expected to improve by 100 bps in FY2018. We
retain our Buy recommendation on the stock with a PT of Rs. 980.

To know more, Call or SMS <las><your name><city> on 022-33054800Email: [email protected] on: www.sharekhan.com/sfsl/finance.html
Unlock the power in your Demat Account to avail finance at attractive rates in two easy steps
• Loans are available up to 10 crores, against wide range of SFSL approved collaterals• Easy documentation and speedy processing• Enjoy flexible repayment options without any prepayment charges• Avail of the facility to swap pledged securities
1 Provide us your portfolio details and get an in principle approval in 10 minutes*2 Submit your documents and get the loan disbursement within 24 hours*
We offer Loan Against Shares, Mutual Funds, Bonds and other securities with customized schemes to suit your requirements
Sharekhan Financial Services Pvt. Ltd. is a Non Banking Finance Company (NBFC) registered with the Reserve Bank of India. We provide a wide range of financing options. Regd / Admin Add: - Lodha iThink Techno Campus,10th Floor, Beta Building, Off. JVLR, Opp. Kanjurmarg Station, Kanjurmarg (East), Mumbai - 400 042, Maharashtra *On working days during normal office hours on a portfolio of securities.
Sharekhan Financial Services Pvt. Ltd.Loan Against Securities

Then
Now
Classroom
Sharekhan ATC is now Sharekhan Classroom
We've even got a new email id to go with the change, you can now reach
us at [email protected]
`
Online Demo Investors Traders Beginner Trading
With almost 50,000 students successfully trained since inception, Sharekhan ATC
now enters a new era as Sharekhan Classroom.
In Sharekhan Classroom, we’ve simplified the courses you take. We’ve now got 4
categories with specialized modules to help you learn the basics of capital markets.
Classroom
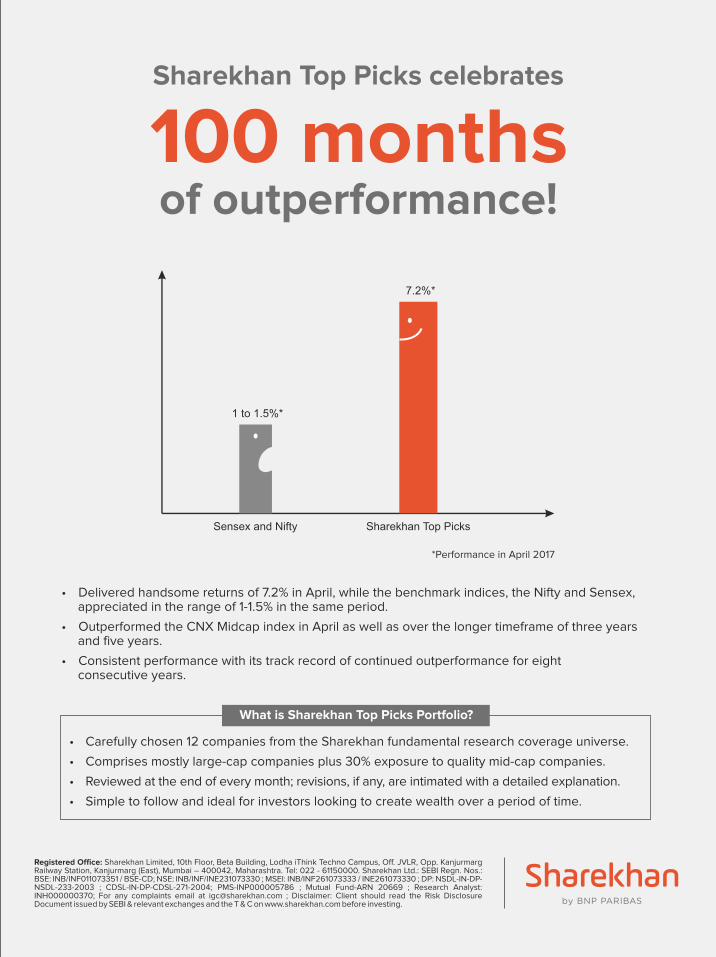
Registered Office: Sharekhan Limited, 10th Floor, Beta Building, Lodha iThink Techno Campus, Off. JVLR, Opp. Kanjurmarg Railway Station, Kanjurmarg (East), Mumbai – 400042, Maharashtra. Tel: 022 - 61150000. Sharekhan Ltd.: SEBI Regn. Nos.: BSE: INB/INF011073351 / BSE-CD; NSE: INB/INF/INE231073330 ; MSEI: INB/INF261073333 / INE261073330 ; DP: NSDL-IN-DP-NSDL-233-2003 ; CDSL-IN-DP-CDSL-271-2004; PMS-INP000005786 ; Mutual Fund-ARN 20669 ; Research Analyst: INH000000370; For any complaints email at [email protected] ; Disclaimer: Client should read the Risk Disclosure Document issued by SEBI & relevant exchanges and the T & C on www.sharekhan.com before investing.
Sharekhan Top Picks celebrates
100 months of outperformance!
1 to 1.5%*
Sensex and Nifty
7.2%*
Sharekhan Top Picks
*Performance in April 2017
• Delivered handsome returns of 7.2% in April, while the benchmark indices, the Nifty and Sensex, appreciated in the range of 1-1.5% in the same period.
• Outperformed the CNX Midcap index in April as well as over the longer timeframe of three years and five years.
• Consistent performance with its track record of continued outperformance for eight consecutive years.
What is Sharekhan Top Picks Portfolio?
• Carefully chosen 12 companies from the Sharekhan fundamental research coverage universe.
• Comprises mostly large-cap companies plus 30% exposure to quality mid-cap companies.
• Reviewed at the end of every month; revisions, if any, are intimated with a detailed explanation.
• Simple to follow and ideal for investors looking to create wealth over a period of time.


EQUITIES | DERIVATIVES | CURRENCY | MUTUAL FUNDS | IPOs | PMS | DEPOSITORY SERVICES
Registered Office: Sharekhan Limited, 10th Floor, Beta Building, Lodha iThink Techno Campus, Off. JVLR, Opp. Kanjurmarg Railway Station, Kanjurmarg (East), Mumbai – 400042, Maharashtra. Tel: 022 - 61150000. Sharekhan Ltd.: SEBI Regn. Nos.: BSE: INB/INF011073351 / BSE-CD; NSE: INB/INF/INE231073330 ; MSEI: INB/INF261073333 / INE261073330 ; DP: NSDL-IN-DP-NSDL-233-2003 ; CDSL-IN-DP-CDSL-271-2004; PMS-INP000005786 ; Mutual Fund-ARN 20669 ; Research Analyst: INH000000370; For any complaints email at [email protected] ; Disclaimer: Client should read the Risk Disclosure Document issued by SEBI & relevant exchanges and the T & C on www.sharekhan.com before investing.

Registered Office: Sharekhan Limited, 10th Floor, Beta Building, Lodha iThink Techno Campus, Off. JVLR, Opp. Kanjurmarg Railway Station, Kanjurmarg (East), Mumbai – 400042, Maharashtra. Tel: 022 - 61150000. Sharekhan Ltd.: SEBI Regn. Nos.: BSE: INB/INF011073351 / BSE-CD; NSE: INB/INF/INE231073330 ; MSEI: INB/INF261073333 / INE261073330 ; DP: NSDL-IN-DP-NSDL-233-2003 ; CDSL-IN-DP-CDSL-271-2004; PMS-INP000005786 ; Mutual Fund-ARN 20669 ; Research Analyst: INH000000370; For any complaints email at [email protected] ; Disclaimer: Client should read the Risk Disclosure Document issued by SEBI & relevant exchanges and the T & C on www.sharekhan.com before investing.
Distributors of IPOs & Mutual Funds Discliamer. This document has been prepared by Sharekhan Ltd. (SHAREKHAN) and is intended for use only by the person or entity to which it is addressed to. This Document may contain confidential and/or privileged material and is not for any type of circulation and any review, retransmission, or any other use is strictly prohibited. This document does not constitute an offer to sell or solicitation for the purchase or sale of any financial instrument or as an official confirmation of any transaction. The information contained herein is obtained from publicly available data or other sources believed to be reliable and SHAREKHAN has not independently verified the accuracy and completeness of the said data and hence it should not be relied upon as such. While we would endeavour to update the information herein on reasonable basis, SHAREKHAN, its subsidiaries and associated companies, their directors and employees (“SHAREKHAN and affiliates”) are under no obligation to update or keep the information current. Also, there may be regulatory, compliance, or other reasons that may prevent SHAREKHAN and affiliates from doing so. This document is prepared for assistance only and is not intended to be and must not alone be taken as the basis for an investment decision. The user assumes the entire risk of any use made of this information and should make such investigations as it deems necessary to arrive at an independent evaluation of an investment in the securities of companies referred to in this document (including the merits and risks involved), and should consult its own advisors to determine the merits and risks of such an investment. Recipient of this report should also be aware that past performance is not necessarily a guide to future performance and value of investments can go down as well. We do not undertake to advise you as to any change of our views. Affiliates of Sharekhan may have issued other reports that are inconsistent with and reach different conclusion from the information presented in this report. Without limiting any of the foregoing, in no event shall SHAREKHAN, any of its affiliates or any third party involved in, or related to, computing or compiling the information have any liability for any damages of any kind. The analyst certifies that all of the views expressed in this document accurately reflect his or her personal views about the subject company or companies and its or their securities and do not necessarily reflect those of SHAREKHAN.
Get your portfolio back in shape with the Portfolio Doctor - a system based advisory service that evaluates your portfolio to enhance its performance. Your returns are optimized by certain stocks that are advised for selling or buying as well as suggesting a balance in your portfolio across sectors. Once the Doctor is in, you’ll find that a dose of robust knowledge can do wonders.
The Portfolio Doctor will only advise. Actual buying / selling of securities, will be at the client’s behest.
For more info call, Shaji Nair- 022-6750 2312Email: [email protected]
Like they say,
Health is wealth.
Disclaimer: This document has been prepared by Sharekhan.com India Pvt. Ltd. and is intended for use only by the person or entity to which it is addressed to. This Document may contain confidential and/or privileged material and is not for any type of circulation and any review, retransmission, or any other use is strictly prohibited. This document does not constitute an offer to sell or solicitation for the purchase or sale of any financial instrument or as an official confirmation of any transaction. Though disseminated to all customers who are due to receive the same, not all customers may receive this report at the same time. Sharekhan.com will not treat recipients as customers by virtue of their receiving this report. This document is prepared for assistance only and is not intended to be and must not alone be taken as the basis for an investment decision. Recipients of this report should also be aware that past performance is not necessarily a guide to future performance and value of investments can go down as well. This Document is subject to changes without prior notice. The user assumes the entire risk of any use made of this information. The investment discussed or views expressed may not be suitable for all investors. Each recipient of this document should make such investigations as it deems necessary to arrive at an independent evaluation (including the merits and risks involved), and should consult its own advisors to determine the merits and risks of such an investment.
Introducing Ignite – a one-year trader mentoring programme from Sharekhan. With Ignite you’ll not only learn to trade but also to trade without the fear of suffering losses. What’s more, you will also get mentoring support for an entire year, plus the confidence of being part of the trader community.
The one-year mentoring programme for your trading success1. One month of trading education by Online Trading Academy, the global leader in trading education2. 40 controlled trades where we absorb losses (if any)*3. Mentoring support for a year4. Access to live online trading room with professional traders5. Ignite TradeTiger: Advanced trading platform
It’s time to face facts: trading can be made simpler.
Attend a FREE workshop on Ignite
to understand how you can graduate
from a novice to a disciplined trader.
For registration:Call: 1800-22-7500
Log on: sharekhan.com/igniteE-mail: [email protected]
Myth: Trading is hard.
If you haven’t got the right mentoring.
Fact: Trading is hard.
Sharekhan.com India Private Limited, C-428, Phoenix House, Phoenix Mills Compound, Senapati Bapat Marg, Lower Parel, Mumbai-400013. Tel: 022-66101266
*Conditions apply. Log on to www.sharekhan.com/IgniteDisclaimer.html
Powered by In partnership with
IGNITETrade Like a Pro