
Tweets on the Road - DIGITAL.CSIC:...
12
Tweets on the Road Maxime Lenormand*, Anto ` nia Tugores, Pere Colet, Jose ´ J. Ramasco Instituto de Fı ´sica Interdisciplinar y Sistemas Complejos IFISC (CSIC-UIB), Palma de Mallorca, Spain Abstract The pervasiveness of mobile devices, which is increasing daily, is generating a vast amount of geo-located data allowing us to gain further insights into human behaviors. In particular, this new technology enables users to communicate through mobile social media applications, such as Twitter, anytime and anywhere. Thus, geo-located tweets offer the possibility to carry out in-depth studies on human mobility. In this paper, we study the use of Twitter in transportation by identifying tweets posted from roads and rails in Europe between September 2012 and November 2013. We compute the percentage of highway and railway segments covered by tweets in 39 countries. The coverages are very different from country to country and their variability can be partially explained by differences in Twitter penetration rates. Still, some of these differences might be related to cultural factors regarding mobility habits and interacting socially online. Analyzing particular road sectors, our results show a positive correlation between the number of tweets on the road and the Average Annual Daily Traffic on highways in France and in the UK. Transport modality can be studied with these data as well, for which we discover very heterogeneous usage patterns across the continent. Citation: Lenormand M, Tugores A, Colet P, Ramasco JJ (2014) Tweets on the Road. PLoS ONE 9(8): e105407. doi:10.1371/journal.pone.0105407 Editor: Matjaz Perc, University of Maribor, Slovenia Received May 21, 2014; Accepted July 19, 2014; Published August 20, 2014 Copyright: ß 2014 Lenormand et al. This is an open-access article distributed under the terms of the Creative Commons Attribution License, which permits unrestricted use, distribution, and reproduction in any medium, provided the original author and source are credited. Data Availability: The authors confirm that all data underlying the findings are fully available without restriction. The data analyzed are publicly available as they come from public online sites (Twitter https://dev.twitter.com and OpenStreetMap http://www.openstreetmap.org). Funding: Partial financial support has been received from the Spanish Ministry of Economy (MINECO) and FEDER (EU) under projects MODASS (FIS2011-24785) and INTENSE@COSYP (FIS2012-30634), and from the EU Commission through projects EUNOIA, LASAGNE and INSIGHT. ML acknowledges funding from the Conselleria d’Educacio, Cultura i Universitats of the Government of the Balearic Islands and JJR from the Ramon y Cajal program of MINECO. The funders had no role in study design, data collection and analysis, decision to publish, or preparation of the manuscript. Competing Interests: The authors confirm that Jose ´ Javier Ramasco is a PLOS ONE Editorial Board member and this does not alter the authors’ adherence to PLOS ONE Editorial policies and criteria. * Email: [email protected] Introduction An increasing number of geo-located data are generated everyday through mobile devices. This information allows for a better characterization of social interactions and human mobility patterns [1,2]. Indeed, several data sets coming from different sources have been analyzed during the last few years. Some examples include cell phone records [3–16], credit card use information [17], GPS data from devices installed in cars [18,19], geolocated tweets [20–25] or Foursquare data [26]. This information led to notable insights in human mobility at individual level [5,24], but it makes also possible to introduce new methods to extract origin-destination tables at a more aggregated scale [7,13,25], to study the structure of cities [16] and even to determine land use patterns [11,12,15,25]. In this work, we analyze a Twitter database containing over 5 million geo-located tweets from 39 European countries with the aim of exploring the use of Twitter in transport networks. Two types of transportation systems are considered across the continent: highways and trains. Tweets on the road and on the rail between September 2012 and November 2013 have been identified and the coverage of the total transportation system is analyzed country by country. Differences between countries rise due to the different adoption or penetration rates of geo-located Twitter technology. However, our results show that the penetra- tion rate is not able to explain the full picture regarding differences across counties that may be related to the cultural diversity at play. The paper is structured as follows. In the first section, the datasets are described and the method used to identify tweets on highways and railways is outlined. In the second section, we present the results starting by general features about the Twitter database and then comparing different European countries by their percentage of highway and railway covered by the tweets. Finally, the number of tweets on the road is compared with the Average Annual Daily Traffic (AADT) in France and in the United Kingdom to assess its capacity as a proxy to measure traffic loads. Materials and Methods 1.1 Datasets The dataset comprehends 5,219,539 geo-located tweets across Europe emitted by 1,477,263 Twitter users in the period going from September 2012 to November 2013. The data was gathered through the general data streaming with the Twitter API [27]. It is worth noting that the tweets are not uniformly distributed, see Figure 1a. Countries of western Europe seem to be well represented, whereas countries of Eastern Europe are clearly under-represented (except for Turkey and Russia). The highway (both directions) and the railway European networks were extracted from OpenStreetMap [28] (Further details about the OpenStreetMap dataset are given in the Section OpenStreetMap dataset and Figure S1 in File S1). Figure 1a, Figure 1b and 1c display maps of geo-located tweets, roads and railways, respectively. A close look at the three maps reveals that while tweets concentrate in cities, there is a number of tweets following the main roads and train lines. In this sense, even roads PLOS ONE | www.plosone.org 1 August 2014 | Volume 9 | Issue 8 | e105407
-
Upload
nguyenhuong -
Category
Documents
-
view
228 -
download
0
Transcript of Tweets on the Road - DIGITAL.CSIC:...
Tweets on the RoadMaxime Lenormand*, Antonia Tugores, Pere Colet, Jose J. Ramasco
Instituto de Fısica Interdisciplinar y Sistemas Complejos IFISC (CSIC-UIB), Palma de Mallorca, Spain
Abstract
The pervasiveness of mobile devices, which is increasing daily, is generating a vast amount of geo-located data allowing usto gain further insights into human behaviors. In particular, this new technology enables users to communicate throughmobile social media applications, such as Twitter, anytime and anywhere. Thus, geo-located tweets offer the possibility tocarry out in-depth studies on human mobility. In this paper, we study the use of Twitter in transportation by identifyingtweets posted from roads and rails in Europe between September 2012 and November 2013. We compute the percentageof highway and railway segments covered by tweets in 39 countries. The coverages are very different from country tocountry and their variability can be partially explained by differences in Twitter penetration rates. Still, some of thesedifferences might be related to cultural factors regarding mobility habits and interacting socially online. Analyzing particularroad sectors, our results show a positive correlation between the number of tweets on the road and the Average AnnualDaily Traffic on highways in France and in the UK. Transport modality can be studied with these data as well, for which wediscover very heterogeneous usage patterns across the continent.
Citation: Lenormand M, Tugores A, Colet P, Ramasco JJ (2014) Tweets on the Road. PLoS ONE 9(8): e105407. doi:10.1371/journal.pone.0105407
Editor: Matjaz Perc, University of Maribor, Slovenia
Received May 21, 2014; Accepted July 19, 2014; Published August 20, 2014
Copyright: � 2014 Lenormand et al. This is an open-access article distributed under the terms of the Creative Commons Attribution License, which permitsunrestricted use, distribution, and reproduction in any medium, provided the original author and source are credited.
Data Availability: The authors confirm that all data underlying the findings are fully available without restriction. The data analyzed are publicly available asthey come from public online sites (Twitter https://dev.twitter.com and OpenStreetMap http://www.openstreetmap.org).
Funding: Partial financial support has been received from the Spanish Ministry of Economy (MINECO) and FEDER (EU) under projects MODASS (FIS2011-24785)and INTENSE@COSYP (FIS2012-30634), and from the EU Commission through projects EUNOIA, LASAGNE and INSIGHT. ML acknowledges funding from theConselleria d’Educacio, Cultura i Universitats of the Government of the Balearic Islands and JJR from the Ramon y Cajal program of MINECO. The funders had norole in study design, data collection and analysis, decision to publish, or preparation of the manuscript.
Competing Interests: The authors confirm that Jose Javier Ramasco is a PLOS ONE Editorial Board member and this does not alter the authors’ adherence toPLOS ONE Editorial policies and criteria.
* Email: [email protected]
Introduction
An increasing number of geo-located data are generated
everyday through mobile devices. This information allows for a
better characterization of social interactions and human mobility
patterns [1,2]. Indeed, several data sets coming from different
sources have been analyzed during the last few years. Some
examples include cell phone records [3–16], credit card use
information [17], GPS data from devices installed in cars [18,19],
geolocated tweets [20–25] or Foursquare data [26]. This
information led to notable insights in human mobility at individual
level [5,24], but it makes also possible to introduce new methods to
extract origin-destination tables at a more aggregated scale
[7,13,25], to study the structure of cities [16] and even to
determine land use patterns [11,12,15,25].
In this work, we analyze a Twitter database containing over 5
million geo-located tweets from 39 European countries with the
aim of exploring the use of Twitter in transport networks. Two
types of transportation systems are considered across the
continent: highways and trains. Tweets on the road and on the
rail between September 2012 and November 2013 have been
identified and the coverage of the total transportation system is
analyzed country by country. Differences between countries rise
due to the different adoption or penetration rates of geo-located
Twitter technology. However, our results show that the penetra-
tion rate is not able to explain the full picture regarding differences
across counties that may be related to the cultural diversity at play.
The paper is structured as follows. In the first section, the datasets
are described and the method used to identify tweets on highways
and railways is outlined. In the second section, we present the
results starting by general features about the Twitter database and
then comparing different European countries by their percentage
of highway and railway covered by the tweets. Finally, the number
of tweets on the road is compared with the Average Annual Daily
Traffic (AADT) in France and in the United Kingdom to assess its
capacity as a proxy to measure traffic loads.
Materials and Methods
1.1 DatasetsThe dataset comprehends 5,219,539 geo-located tweets across
Europe emitted by 1,477,263 Twitter users in the period going
from September 2012 to November 2013. The data was gathered
through the general data streaming with the Twitter API [27]. It is
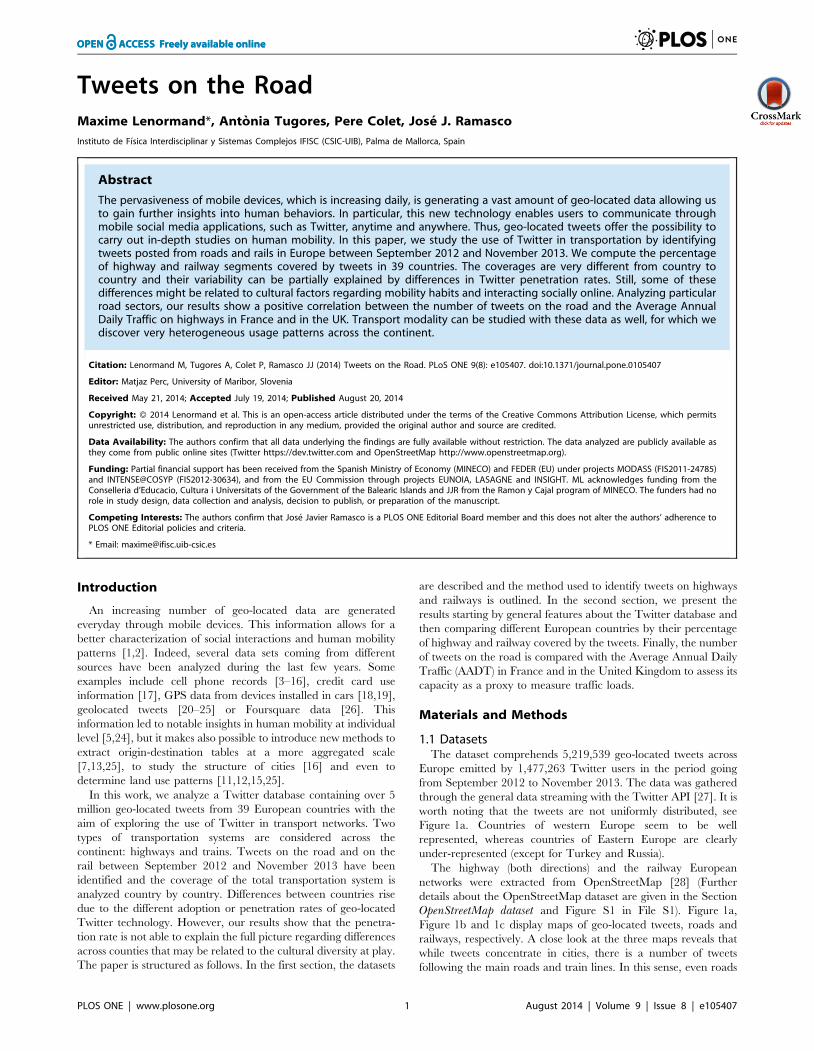
worth noting that the tweets are not uniformly distributed, see
Figure 1a. Countries of western Europe seem to be well
represented, whereas countries of Eastern Europe are clearly
under-represented (except for Turkey and Russia).
The highway (both directions) and the railway European
networks were extracted from OpenStreetMap [28] (Further
details about the OpenStreetMap dataset are given in the Section
OpenStreetMap dataset and Figure S1 in File S1). Figure 1a,
Figure 1b and 1c display maps of geo-located tweets, roads and
railways, respectively. A close look at the three maps reveals that
while tweets concentrate in cities, there is a number of tweets
following the main roads and train lines. In this sense, even roads
PLOS ONE | www.plosone.org 1 August 2014 | Volume 9 | Issue 8 | e105407
that go through relatively low population areas can be clearly
discerned such as those on Russia connecting the main cities, the
area of Monegros in Spain, North of Zaragoza or the main roads
in the center of France (see the maps country by country in File S1,
Figure S3–S9). Here we analyze in detail the statistics of the tweets
posted on the roads and railways and discuss the possibility that
they are a proxy for traffic and cultural differences. It is important
to stress that we considered only the main highways (motorways
and international primary roads), not rural roads, while for
railways we considered all the main lines (standard gauge of the
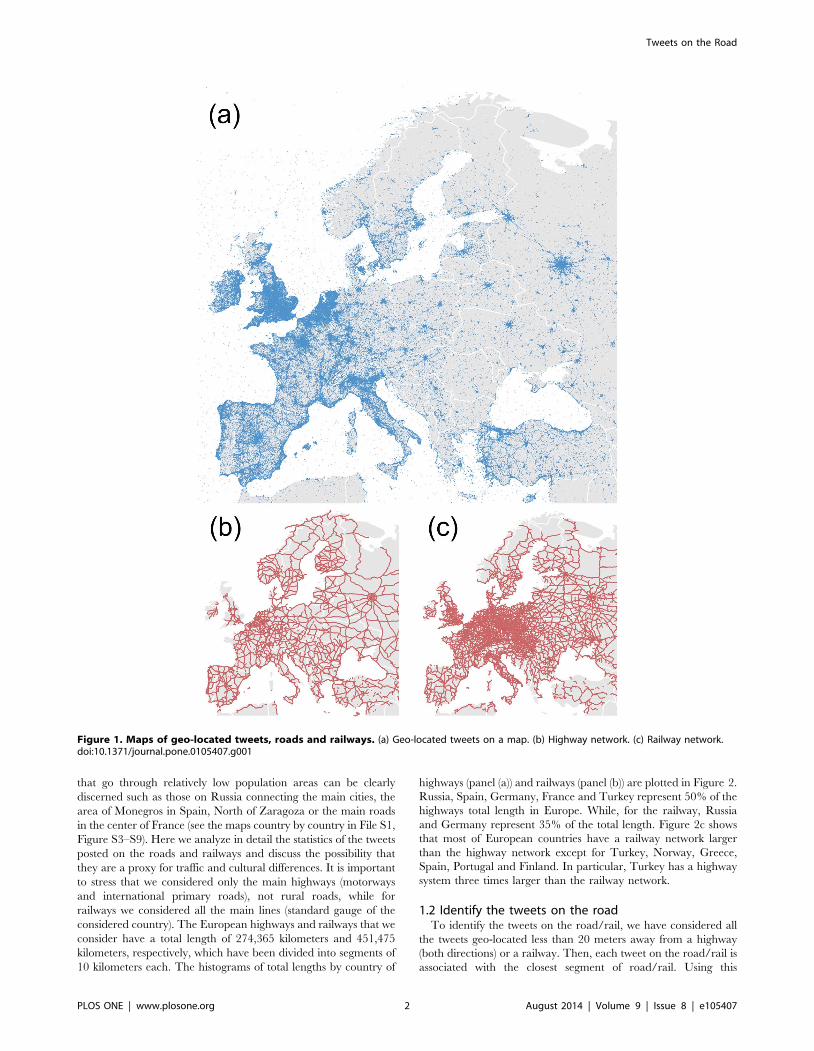
considered country). The European highways and railways that we
consider have a total length of 274,365 kilometers and 451,475
kilometers, respectively, which have been divided into segments of
10 kilometers each. The histograms of total lengths by country of
highways (panel (a)) and railways (panel (b)) are plotted in Figure 2.
Russia, Spain, Germany, France and Turkey represent 50% of the
highways total length in Europe. While, for the railway, Russia
and Germany represent 35% of the total length. Figure 2c shows
that most of European countries have a railway network larger
than the highway network except for Turkey, Norway, Greece,
Spain, Portugal and Finland. In particular, Turkey has a highway
system three times larger than the railway network.
1.2 Identify the tweets on the roadTo identify the tweets on the road/rail, we have considered all
the tweets geo-located less than 20 meters away from a highway
(both directions) or a railway. Then, each tweet on the road/rail is
associated with the closest segment of road/rail. Using this
Figure 1. Maps of geo-located tweets, roads and railways. (a) Geo-located tweets on a map. (b) Highway network. (c) Railway network.doi:10.1371/journal.pone.0105407.g001
Tweets on the Road
PLOS ONE | www.plosone.org 2 August 2014 | Volume 9 | Issue 8 | e105407
information, we can compute the percentage of road and rail
segments covered by the tweets (hereafter called highway coverage
and railway coverage). A segment of road or rail is covered by
tweets if there is at least one tweet associated with this segment.
1.3 Ethics statementThe data analyzed are publicly available as they come from
public online sites (Twitter [27] and OpenStreetMap [28]).
Furthermore, the Twitter data have been anonymized and
Figure 2. Histograms of total lengths by country of highways and railways. (a) Highways total length by European countries. (b) Railwaystotal length by European countries. (c) Ratio between the total length of highways and that of railways by several European countries. The red linemarks the unit ratio.doi:10.1371/journal.pone.0105407.g002
Tweets on the Road
PLOS ONE | www.plosone.org 3 August 2014 | Volume 9 | Issue 8 | e105407
aggregated before the analysis that has been performed in
accordance with all local data protection laws.
Results
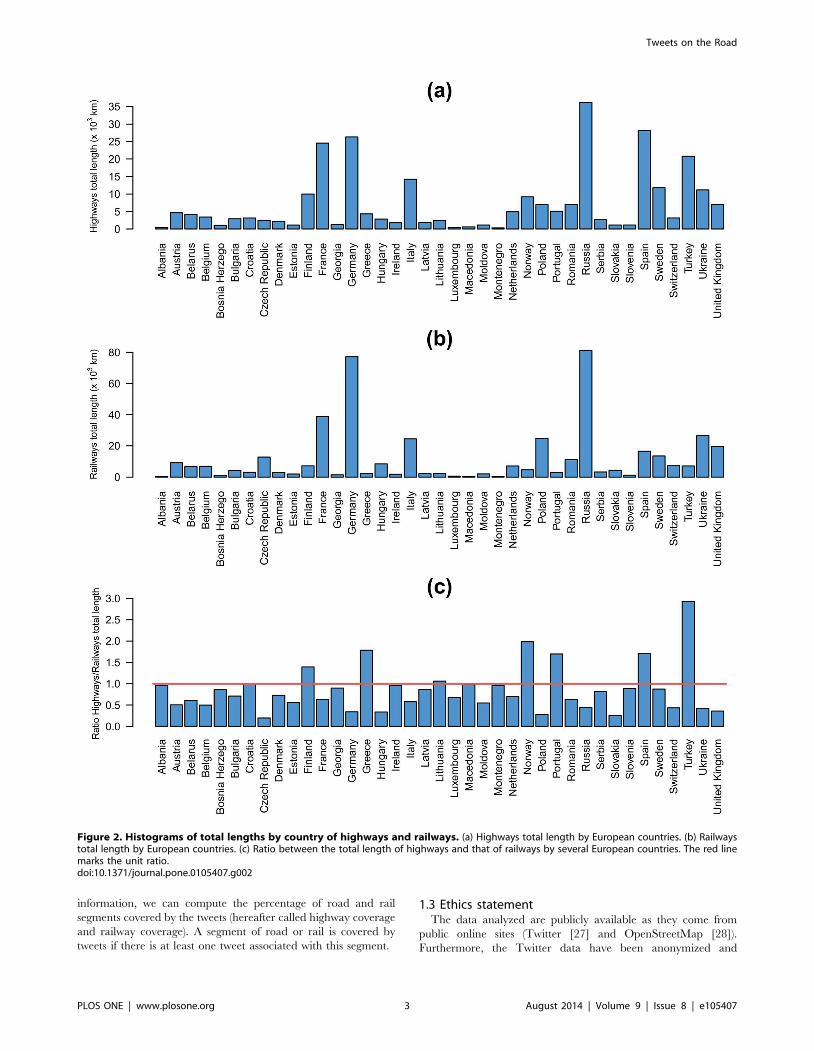
2.4 General features2.4.1 Penetration rate. To evaluate the representativeness
of the sample across European countries, the Twitter penetration
rate, defined as the ratio between the number of Twitter users and
the number of inhabitants of each country, is plotted in Figure 3a.
This ratio is not distributed uniformly across European countries.
The penetration rate is lower in countries of central Europe. It has
been shown in previous studies [20,24] that the Gross Domestic
Product (GDP) per capita (an indicator of the economic
performance of a country) is positively correlated with the
penetration rate at a world-wide scale. Figure 3b shows the
penetration rate as a function of the GDP per capita in European
countries. No clear correlation is observed in this case. This fact
Figure 3. Twitter penetration rate across Europe. (a) and (c) Geolocated Twitter penetration rate across Europe at country level (a) and NUTS 2level (c). Twitter penetration rate is defined as the ratio between the number of users emitting geo-located tweets in our database and thepopulation in 2012. (b) and (d) Penetration rate as a function of the Gross Domestic Product (GDP) per capita at country level (b) and NUTS 2 level (d).At country level, the figures for the GDP were obtained from the web of the International Monetary Fund [30], correspond to the year 2012 and areexpressed in US dollars. At NUTS 2 level, the figures for the GDP were obtained from the web of Eurostat [32], the figures for GDP correspond to theyear 2011 and are expressed in euros. Each point represents a country or a NUTS, the red points in (d) represent the NUTS 2 of Turkey.doi:10.1371/journal.pone.0105407.g003
Tweets on the Road
PLOS ONE | www.plosone.org 4 August 2014 | Volume 9 | Issue 8 | e105407
does not conflict with the previous results since our analysis is
restricted to Europe and as shown in [20], in this relationship,
countries from different continents cluster together. This means
that a global positive correlation appears if countries from all
continents are considered but it is not necessarily significant when
the focus is set instead on a particular area of the world. To
evaluate the robustness of this result we have plotted the
penetration rate as a function of the GDP per capita at NUTS
2 level (Figure 3d) and NUTS 3 level (Figure S2 in File S1). The
NUTS classification (Nomenclature of territorial units for statistics)
is a hierarchical system for dividing up the economic territory of
the European Union [29]. It is interesting to note that the
correlation between the penetration rate and the GDP per capita
remains very low even if we increase the resolution. Actually,
geolocated-Twitter penetration rate is evenly distributed internally
across most European countries (Figure 3d). One exception is, for
instance, Turkey (red dots in Figure 3d), where an important
gradient in penetration rate can be observed from Istanbul to the
South East. A similar gradient exists for the GDP per capita, and
in practice both variables are correlated as also occurs at a world-
wide scale (see red points in Figure 3d).
2.4.2 Social network. The penetration rate of geo-located
tweets is different across European countries and does not show a
clear relation to the GDP per capita of each country. There are
several factors that can contribute to this diversity such as the
facility of access or prices of the mobile data providers. In addition,
generic cultural differences when facing a delicate issue from the
privacy perspective such as declaring the precise location in posted
messages can be also present. One can then naturally wonder
whether these differences extend to other aspects of the use of
Twitter or are constraint to geographical issues. One obvious
question to explore is the structure of the social network formed by
the interactions between users. We extract interaction networks by
establishing the users as nodes and connecting a pair of them when
they have interchanged a reply. Replies are specific messages in
Twitter designed to answer the tweets of a particular user. It can
be seen as a direct conversation between two users and as shown in
[31] (and references therein) can be related to more intense social
relations. A network per country was obtained by assigning to each
user the country from which most of his or her geo-located tweets
are posted.
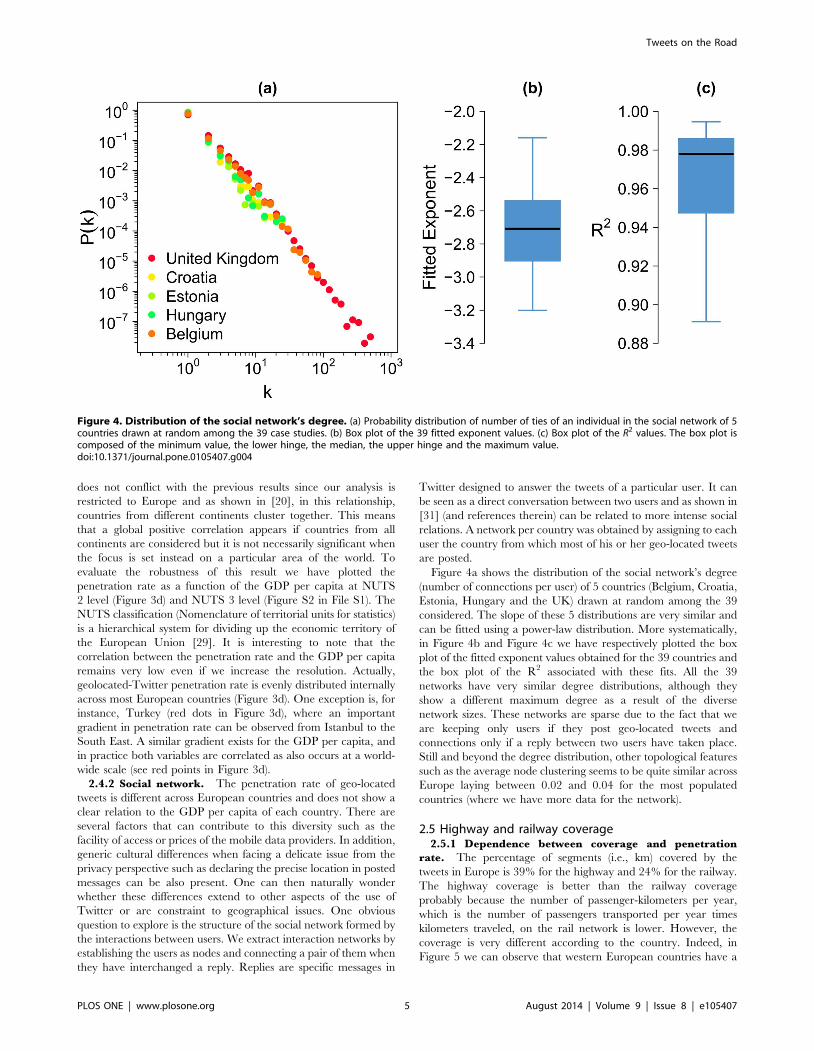
Figure 4a shows the distribution of the social network’s degree
(number of connections per user) of 5 countries (Belgium, Croatia,
Estonia, Hungary and the UK) drawn at random among the 39
considered. The slope of these 5 distributions are very similar and
can be fitted using a power-law distribution. More systematically,
in Figure 4b and Figure 4c we have respectively plotted the box
plot of the fitted exponent values obtained for the 39 countries and
the box plot of the R2 associated with these fits. All the 39
networks have very similar degree distributions, although they
show a different maximum degree as a result of the diverse
network sizes. These networks are sparse due to the fact that we
are keeping only users if they post geo-located tweets and
connections only if a reply between two users have taken place.
Still and beyond the degree distribution, other topological features
such as the average node clustering seems to be quite similar across
Europe laying between 0.02 and 0.04 for the most populated
countries (where we have more data for the network).
2.5 Highway and railway coverage2.5.1 Dependence between coverage and penetration
rate. The percentage of segments (i.e., km) covered by the
tweets in Europe is 39% for the highway and 24% for the railway.
The highway coverage is better than the railway coverage
probably because the number of passenger-kilometers per year,
which is the number of passengers transported per year times
kilometers traveled, on the rail network is lower. However, the
coverage is very different according to the country. Indeed, in
Figure 5 we can observe that western European countries have a
Figure 4. Distribution of the social network’s degree. (a) Probability distribution of number of ties of an individual in the social network of 5countries drawn at random among the 39 case studies. (b) Box plot of the 39 fitted exponent values. (c) Box plot of the R2 values. The box plot iscomposed of the minimum value, the lower hinge, the median, the upper hinge and the maximum value.doi:10.1371/journal.pone.0105407.g004
Tweets on the Road
PLOS ONE | www.plosone.org 5 August 2014 | Volume 9 | Issue 8 | e105407
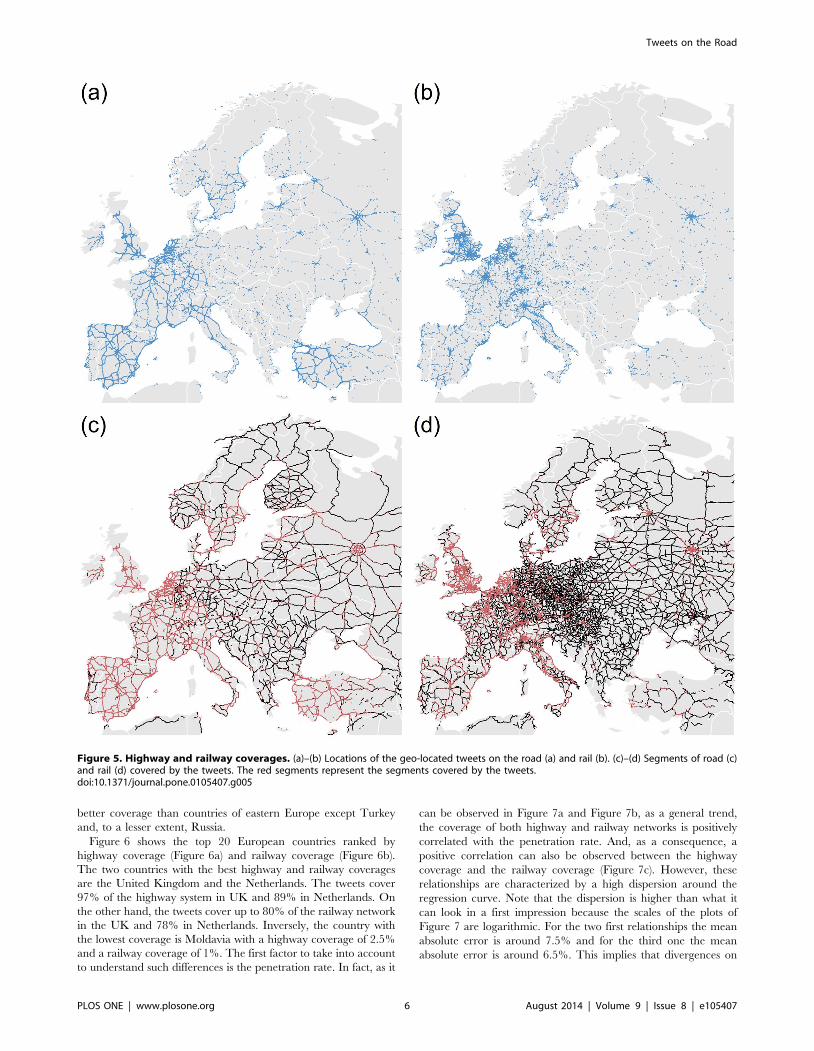
better coverage than countries of eastern Europe except Turkey
and, to a lesser extent, Russia.
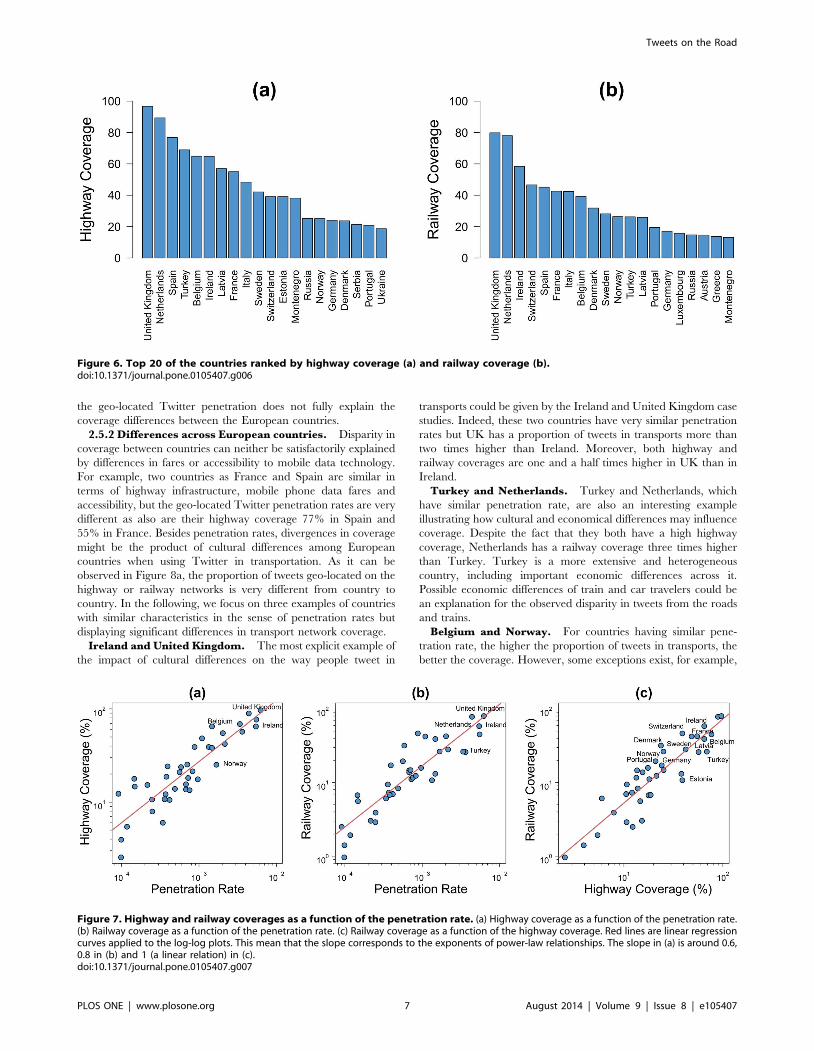
Figure 6 shows the top 20 European countries ranked by
highway coverage (Figure 6a) and railway coverage (Figure 6b).
The two countries with the best highway and railway coverages
are the United Kingdom and the Netherlands. The tweets cover
97% of the highway system in UK and 89% in Netherlands. On
the other hand, the tweets cover up to 80% of the railway network
in the UK and 78% in Netherlands. Inversely, the country with
the lowest coverage is Moldavia with a highway coverage of 2.5%
and a railway coverage of 1%. The first factor to take into account
to understand such differences is the penetration rate. In fact, as it
can be observed in Figure 7a and Figure 7b, as a general trend,
the coverage of both highway and railway networks is positively
correlated with the penetration rate. And, as a consequence, a
positive correlation can also be observed between the highway
coverage and the railway coverage (Figure 7c). However, these
relationships are characterized by a high dispersion around the
regression curve. Note that the dispersion is higher than what it
can look in a first impression because the scales of the plots of
Figure 7 are logarithmic. For the two first relationships the mean
absolute error is around 7.5% and for the third one the mean
absolute error is around 6.5%. This implies that divergences on
Figure 5. Highway and railway coverages. (a)–(b) Locations of the geo-located tweets on the road (a) and rail (b). (c)–(d) Segments of road (c)and rail (d) covered by the tweets. The red segments represent the segments covered by the tweets.doi:10.1371/journal.pone.0105407.g005
Tweets on the Road
PLOS ONE | www.plosone.org 6 August 2014 | Volume 9 | Issue 8 | e105407
the geo-located Twitter penetration does not fully explain the
coverage differences between the European countries.
2.5.2 Differences across European countries. Disparity in
coverage between countries can neither be satisfactorily explained
by differences in fares or accessibility to mobile data technology.
For example, two countries as France and Spain are similar in
terms of highway infrastructure, mobile phone data fares and
accessibility, but the geo-located Twitter penetration rates are very
different as also are their highway coverage 77% in Spain and
55% in France. Besides penetration rates, divergences in coverage
might be the product of cultural differences among European
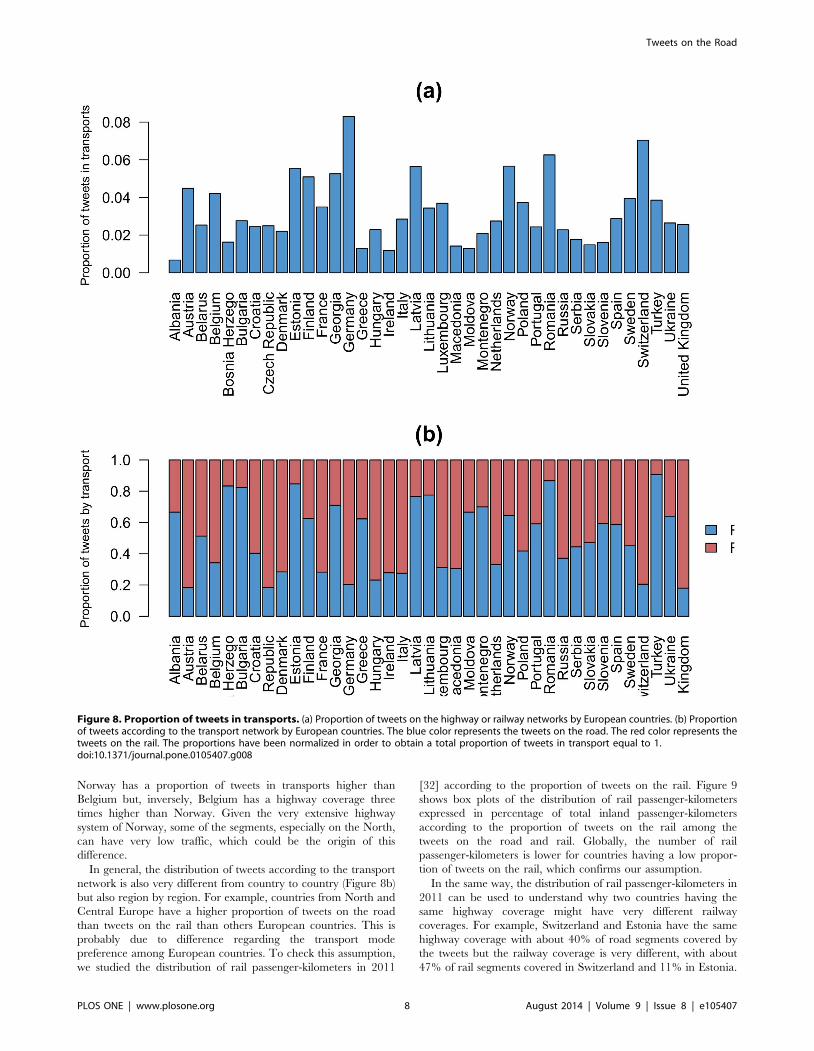
countries when using Twitter in transportation. As it can be
observed in Figure 8a, the proportion of tweets geo-located on the
highway or railway networks is very different from country to
country. In the following, we focus on three examples of countries
with similar characteristics in the sense of penetration rates but
displaying significant differences in transport network coverage.
Ireland and United Kingdom. The most explicit example of
the impact of cultural differences on the way people tweet in
transports could be given by the Ireland and United Kingdom case
studies. Indeed, these two countries have very similar penetration
rates but UK has a proportion of tweets in transports more than
two times higher than Ireland. Moreover, both highway and
railway coverages are one and a half times higher in UK than in
Ireland.
Turkey and Netherlands. Turkey and Netherlands, which
have similar penetration rate, are also an interesting example
illustrating how cultural and economical differences may influence
coverage. Despite the fact that they both have a high highway
coverage, Netherlands has a railway coverage three times higher
than Turkey. Turkey is a more extensive and heterogeneous
country, including important economic differences across it.
Possible economic differences of train and car travelers could be
an explanation for the observed disparity in tweets from the roads
and trains.
Belgium and Norway. For countries having similar pene-
tration rate, the higher the proportion of tweets in transports, the
better the coverage. However, some exceptions exist, for example,
Figure 6. Top 20 of the countries ranked by highway coverage (a) and railway coverage (b).doi:10.1371/journal.pone.0105407.g006
Figure 7. Highway and railway coverages as a function of the penetration rate. (a) Highway coverage as a function of the penetration rate.(b) Railway coverage as a function of the penetration rate. (c) Railway coverage as a function of the highway coverage. Red lines are linear regressioncurves applied to the log-log plots. This mean that the slope corresponds to the exponents of power-law relationships. The slope in (a) is around 0.6,0.8 in (b) and 1 (a linear relation) in (c).doi:10.1371/journal.pone.0105407.g007
Tweets on the Road
PLOS ONE | www.plosone.org 7 August 2014 | Volume 9 | Issue 8 | e105407
Norway has a proportion of tweets in transports higher than
Belgium but, inversely, Belgium has a highway coverage three
times higher than Norway. Given the very extensive highway
system of Norway, some of the segments, especially on the North,
can have very low traffic, which could be the origin of this
difference.
In general, the distribution of tweets according to the transport
network is also very different from country to country (Figure 8b)
but also region by region. For example, countries from North and
Central Europe have a higher proportion of tweets on the road
than tweets on the rail than others European countries. This is
probably due to difference regarding the transport mode
preference among European countries. To check this assumption,
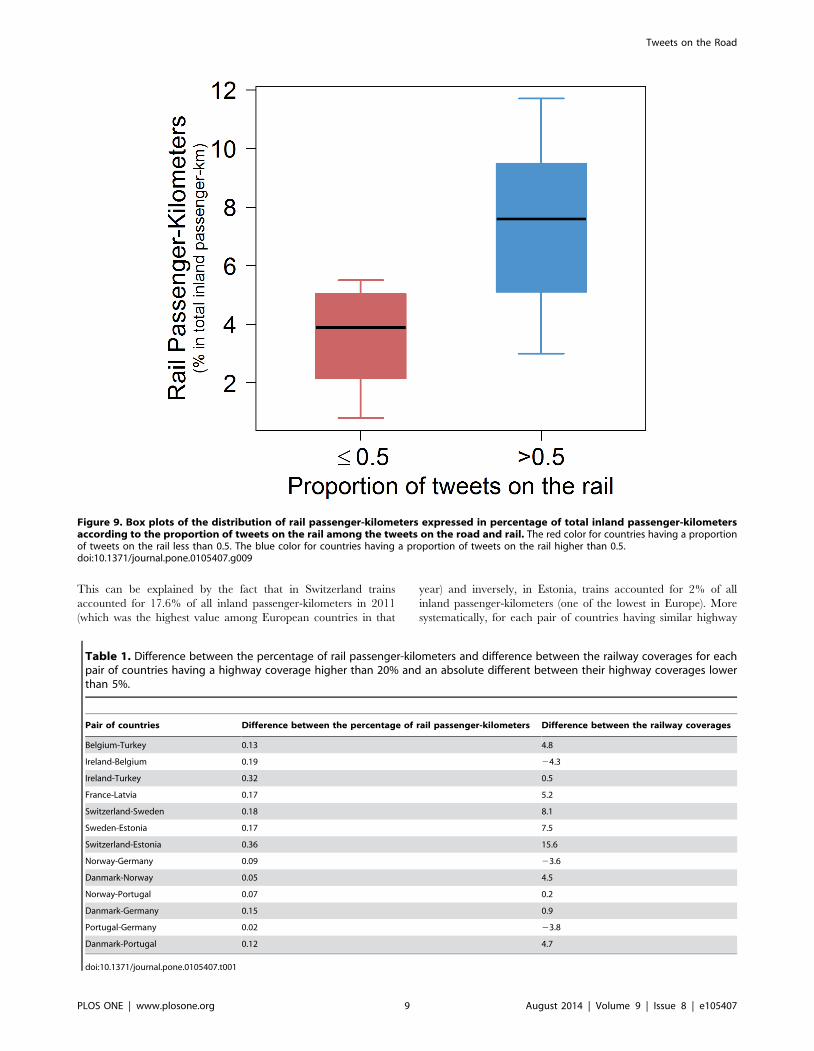
we studied the distribution of rail passenger-kilometers in 2011
[32] according to the proportion of tweets on the rail. Figure 9
shows box plots of the distribution of rail passenger-kilometers
expressed in percentage of total inland passenger-kilometers
according to the proportion of tweets on the rail among the
tweets on the road and rail. Globally, the number of rail
passenger-kilometers is lower for countries having a low propor-
tion of tweets on the rail, which confirms our assumption.
In the same way, the distribution of rail passenger-kilometers in
2011 can be used to understand why two countries having the
same highway coverage might have very different railway
coverages. For example, Switzerland and Estonia have the same
highway coverage with about 40% of road segments covered by
the tweets but the railway coverage is very different, with about
47% of rail segments covered in Switzerland and 11% in Estonia.
Figure 8. Proportion of tweets in transports. (a) Proportion of tweets on the highway or railway networks by European countries. (b) Proportionof tweets according to the transport network by European countries. The blue color represents the tweets on the road. The red color represents thetweets on the rail. The proportions have been normalized in order to obtain a total proportion of tweets in transport equal to 1.doi:10.1371/journal.pone.0105407.g008
Tweets on the Road
PLOS ONE | www.plosone.org 8 August 2014 | Volume 9 | Issue 8 | e105407
This can be explained by the fact that in Switzerland trains
accounted for 17.6% of all inland passenger-kilometers in 2011
(which was the highest value among European countries in that
year) and inversely, in Estonia, trains accounted for 2% of all
inland passenger-kilometers (one of the lowest in Europe). More
systematically, for each pair of countries having similar highway
Figure 9. Box plots of the distribution of rail passenger-kilometers expressed in percentage of total inland passenger-kilometersaccording to the proportion of tweets on the rail among the tweets on the road and rail. The red color for countries having a proportionof tweets on the rail less than 0.5. The blue color for countries having a proportion of tweets on the rail higher than 0.5.doi:10.1371/journal.pone.0105407.g009
Table 1. Difference between the percentage of rail passenger-kilometers and difference between the railway coverages for eachpair of countries having a highway coverage higher than 20% and an absolute different between their highway coverages lowerthan 5%.
Pair of countries Difference between the percentage of rail passenger-kilometers Difference between the railway coverages
Belgium-Turkey 0.13 4.8
Ireland-Belgium 0.19 24.3
Ireland-Turkey 0.32 0.5
France-Latvia 0.17 5.2
Switzerland-Sweden 0.18 8.1
Sweden-Estonia 0.17 7.5
Switzerland-Estonia 0.36 15.6
Norway-Germany 0.09 23.6
Danmark-Norway 0.05 4.5
Norway-Portugal 0.07 0.2
Danmark-Germany 0.15 0.9
Portugal-Germany 0.02 23.8
Danmark-Portugal 0.12 4.7
doi:10.1371/journal.pone.0105407.t001
Tweets on the Road
PLOS ONE | www.plosone.org 9 August 2014 | Volume 9 | Issue 8 | e105407
coverages, we compared the difference between railway coverages
and the difference between the percentage of rail passenger-
kilometers. First, pair of countries having a highway coverage
higher than 20% and an absolute different between their highway
coverages lower than 5% are selected. Thus, we have selected 13
pairs of countries with a similar highway coverage. Table 1
displays the difference between the percentage of rail passenger-
kilometers and the difference between the railway coverages for
these 13 pairs of countries. In 10 out of 13 cases, the differences
have the same sign. This fact points towards a possible correlation
between traffic levels and tweet coverage.
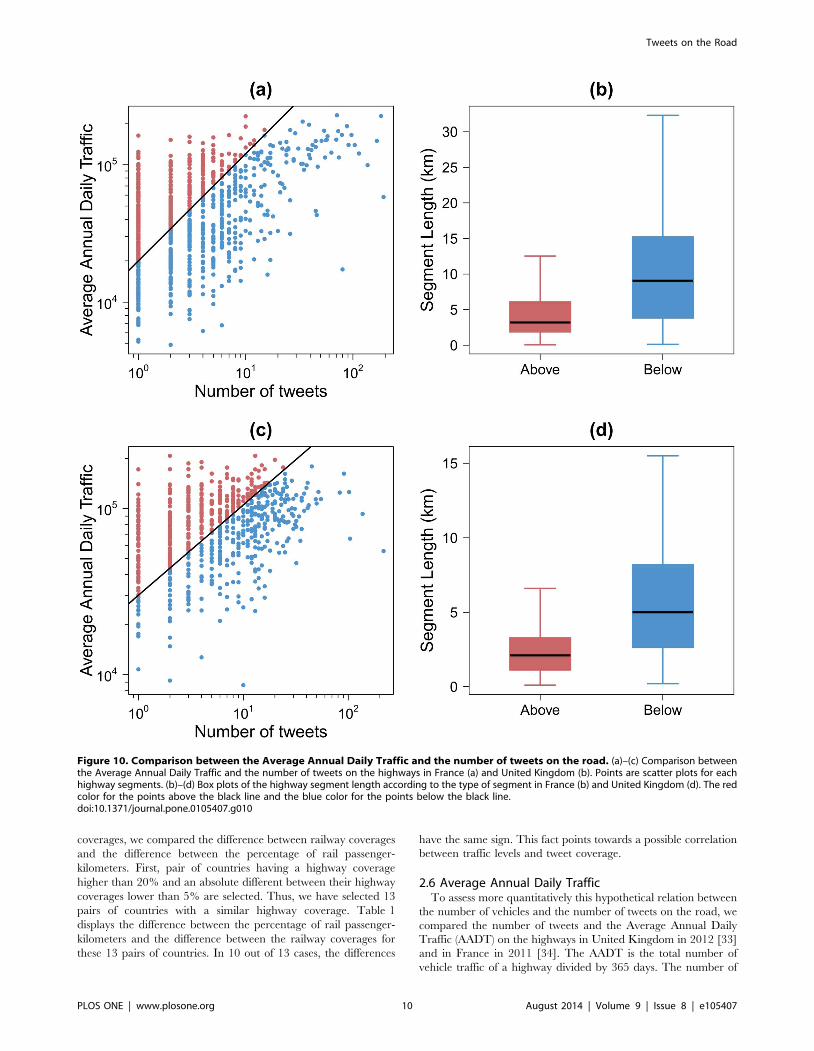
2.6 Average Annual Daily TrafficTo assess more quantitatively this hypothetical relation between
the number of vehicles and the number of tweets on the road, we
compared the number of tweets and the Average Annual Daily
Traffic (AADT) on the highways in United Kingdom in 2012 [33]
and in France in 2011 [34]. The AADT is the total number of
vehicle traffic of a highway divided by 365 days. The number of
Figure 10. Comparison between the Average Annual Daily Traffic and the number of tweets on the road. (a)–(c) Comparison betweenthe Average Annual Daily Traffic and the number of tweets on the highways in France (a) and United Kingdom (b). Points are scatter plots for eachhighway segments. (b)–(d) Box plots of the highway segment length according to the type of segment in France (b) and United Kingdom (d). The redcolor for the points above the black line and the blue color for the points below the black line.doi:10.1371/journal.pone.0105407.g010
Tweets on the Road
PLOS ONE | www.plosone.org 10 August 2014 | Volume 9 | Issue 8 | e105407
highway segments for which the AADT was gathered is 877 in UK
and 1974 in France. The average length of these segments is 3.6
kilometers in UK and 5.8 in France. As in the previous analysis,
the number of tweets associated with a segment was computed by
identifying all the tweets geo-located at less than 20 meters away
from the segment.
Figure 10a and 10c shows a comparison between the AADT
and the number of tweets on the road for both case studies. There
is a positive correlation between the AADT and the number of
tweets on the road but the Pearson correlation coefficient values
are low, around 0.5 for the France case study and around 0.3 for
the UK case study. This can be explained by the large number of
highway segments having a high AADT but a very low number of
tweets. To understand the origin of such disagreement between
tweets and traffic, we have divided the segments into two groups:
those having a high AADT and a very low number of tweets (red
points) and the rest (blue points). These two types of segments have
been separated using the black lines in Figure 10a and 10c.
Figure 10b and 10d show the box plots of the highway segment
length in kilometer according to the segment type for both case
studies. It is interesting to note that the segments having a high
AADT and a low number of tweets are globally shorter than the
ones of the other group. Indeed, according to the Welch two
sample t-test [35] the average segment length of the first group
(5.2 km in France and 2.5 in UK) is significantly lower than the
one of the second group (11.3 km in France and 5.9 in UK). In
both cases the p-value is less than 1025. Given a similar speed one
can assume that the shorter the road segment is, the lower time
people have to post a tweet. Other factors that may influence this
result is the nature of the segments, rural vs urban, and the
congestion levels that can significantly alter the time spent by
travelers in the different segments.
Discussion
In this work, we have investigated the use of Twitter in transport
networks in Europe. To do so, we have extracted from a Twitter
database containing more than 5 million geo-located tweets posted
from the highway and the railway networks of 39 European
countries. First, we show that the countries have different
penetration rates for geo-located tweets with no clear dependence
on the economic performance of the country. Our results show, as
well, no clear difference between countries in terms of the
topological features of the Twitter social network. Dividing the
highway and railway systems in segments, we have also studied the
coverage of the territory with geo-located tweets. European
countries can be ranked according to the highway and railway
coverage. The coverages are very different from country to
country. Although some of this disparity can be explained by
differences in penetration rate or by the use of different transport
modalities, a large dispersion in the data still persist. Part of it
could be due to cultural differences among European countries
regarding the use of geo-located tools. Finally, we explore whether
Twitter can be used as a proxy to measure of traffic on highways
by comparing the number of tweets and the Average Annual Daily
Traffic (AADT) on the highways in United Kingdom and France.
We observe a positive correlation between the number of tweets
and the AADT. However, the quality of this relationship is
reduced due to the short character of some AADT highway
segments. We conclude that the number of tweets on the road
(train) can be used as a valuable proxy to analyze the preferred
transport modality as well as to study traffic congestion provided
that the segment length is enough to obtain significant statistics.
Supporting Information
File S1 Contains Figures S1–S9.
(PDF)
Author Contributions
Conceived and designed the experiments: ML AT PC JJR. Performed the
experiments: ML AT PC JJR. Analyzed the data: ML AT PC JJR.
Contributed reagents/materials/analysis tools: ML AT PC JJR. Contrib-
uted to the writing of the manuscript: ML AT PC JJR.
References
1. Watts DJ (2007) A twenty-first century science. Nature 445: 489.
2. Vespignani A (2009) Predicting the Behavior of Techno-Social Systems. Science
325: 425–428.
3. Onnela J, Saramaki J, Hyvonen J, Szabo G, Lazer D, et al. (2007) Structure and
tie strengths in mobile communication networks. Proc Natl Acad Sci USA 104:
7332–7336.
4. Eagle N, Pentland AS, Lazer D (2009) From the Cover: Inferring friendship
network structure by using mobile phone data. Proceedings of the National
Academy of Sciences 106: 15274–15278.
5. Gonzalez MC, Hidalgo CA, Barabasi AL (2008) Understanding individual
human mobility patterns. Nature 453: 779–782.
6. Song C, Qu Z, Blumm N, Barabasi AL (2010) Limits of Predictability in Human
Mobility. Science 327: 1018–1021.
7. Phithakkitnukoon S, Smoreda Z, Olivier P (2012) Socio-geography of human
mobility: A study using longitudinal mobile phone data. PLoS ONE 7: e39253.
8. Wang P, Gonzalez M, Hidalgo C, Barabasi AL (2009) Understanding the
spreading patterns of mobile phone viruses. Science 324: 1071–1076.
9. Ratti C, Pulselli RM, Williams S, Frenchman D (2006) Mobile landscapes: using
location data from cell phones for urban analysis. Environment and Planning B:
Planning and Design 33: 727–748.
10. Reades J, Calabrese F, Sevtsuk A, Ratti C (2007) Cellular census: Explorations in
urban data collection. Pervasive Computing, IEEE 6: 30–38.
11. Soto V, Frıas-Martınez E (2011) Automated land use identification using cell-
phone records. In: Proceedings of the 3rd ACM international workshop on
MobiArch. New York, NY, USA: ACM, HotPlanet ’11, pp. 17–22.
12. Frıas-Martınez V, Soto V, Hohwald H, Frıas-Martınez E (2012) Characterizing
urban landscapes using geolocated tweets. In: SocialCom/PASSAT. IEEE, pp.
239–248.
13. Isaacman S, Becker R, Caceres R, Martonosi M, Rowland J, et al. (2012)
Human mobility modeling at metropolitan scales. In: Proceedings of the
International Conference on Mobile Systems, Applications, and Services
(MobiSys). ACM, pp. 239–252.
14. Toole J, Ulm M, Gonzalez M, Bauer D (2014) Inferring land use from mobile
phone activity. Proceedings of the ACM SIGKDD International Workshop on
Urban Computing pp 1–8.
15. Pei T, Sobolevsky S, Ratti C, Shaw SL, Zhou C (2013) A new insight into land
use classification based on aggregated mobile phone data. ArXiv e-print
arxiv:1310.6129.
16. Louail T, Lenormand M, Garcia Cantu O, Picornell M, Herranz R, et al. (2014)From mobile phone data to the spatial structure of cities. ArXiv e-print
arxiv:140: 4540.
17. Hasan S, Schneider CM, Ukkusuri SV, Gonzalez MC (2012) Spatiotemporal
patterns of urban human mobility. Journal of Statistical Physics 151: 1–15.
18. Gallotti R, Bazzani A, Rambaldi S (2012) Towards a statistical physics of human
mobility. International Journal of Modern Physics 23: 1250061.
19. Furletti B, Cintia P, Renso C, Spinsanti L (2013) Inferring human activities from
gps tracks. In: Proceedings of the 2Nd ACM SIGKDD International Workshopon Urban Computing. New York, NY, USA: ACM, UrbComp ’13, pp. 5: 1–5:8.
20. Mocanu D, Baronchelli A, Perra N, Gonalves B, Zhang Q, et al. (2013) The
Twitter of Babel: Mapping World Languages through Microblogging Platforms.
PLoS ONE 8: e61981.
21. Varol O, Ferrara E, Ogan CL, Menczer F, Flammini A (2014) Evolution of
Online User Behavior During a Social Upheaval In: Proceedings of the 2014
ACM Conference on Web Science (WebSci ’14). ACM, New York, NY, USA,
81–90.
22. Ferrara E, Varol O, Menczer F, Flammini A (2013) Traveling Trends: SocialButterflies or Frequent Fliers? In: Proc. 1st ACM Conf. on Online Social
Networks COSN, 213–222.
23. Gonzalez-Bailon S, Borge-Holthoefer J, Rivero A, Moreno Y (2011) The
dynamics of protest recruitment through an online network. Scientific Reports 1:197.
Tweets on the Road
PLOS ONE | www.plosone.org 11 August 2014 | Volume 9 | Issue 8 | e105407

24. Hawelka B, Sitko I, Beinat E, Sobolevsky S, Kazakopoulos P, et al. (2013) Geo-
located twitter as a proxy for global mobility patterns. ArXiv e-printarXiv:1311.0680.
25. Lenormand M, Picornell M, Garcia Cantu O, Tugores A, Louail T, et al. (2014)
Cross-checking different source of mobility information. ArXiv e-printarXiv:1404.0333.
26. Noulas A, Scellato S, Lambiotte R, Pontil M, Mascolo C (2012) A tale of manycities: Universal patterns in human urban mobility. PloS one 7: e37027.
27. Twitter API, section for developers of Twitter Web page, https://dev.twitter.
com. Accessed 2014 July 23.28. Open Street Map (http://www.openstreetmap.org). Accessed 2014 July 23.
29. NUTS classification (http://epp.eurostat.ec.europa.eu/portal/page/portal/nuts_nomenclature/introduction). Accessed 2014 July 23.
30. GDP per capita in 2012 by the International Monetary Fund (http://www.imf.
org/external/pubs/ft/weo/2012/01/weodata/weoselgr.aspx). Accessed 2014July 23.
31. Grabowicz PA, Ramasco JJ, Moro E, Pujol JM, Eguiluz VM (2012) Social
Features of Online Networks: The Strength of Intermediary Ties in OnlineSocial Media. PLoS ONE 7: e29358.
32. Eurostat (http://epp.eurostat.ec.europa.eu/).Accessed 2014 July 23.33. Data available online at http://www.dft.gov.uk/traffic-counts/. Accessed 2014
July 23.
34. These data are available upon request at Service studies on transport, roads andfacilities (setra) (http://dtrf.setra.fr/). Accessed 2014 July 23.
35. Welch BL (1951) On the comparison of several mean values: An alternativeapproach. Biometrika 38: pp. 330–336.
Tweets on the Road
PLOS ONE | www.plosone.org 12 August 2014 | Volume 9 | Issue 8 | e105407