TV Everywhere€¦ · TV EVERYWHERE. H1, 2019 172,947,517 236,181,424 78,436,864 103,577,307...
16
TV Everywhere H1, 2019
Transcript of TV Everywhere€¦ · TV EVERYWHERE. H1, 2019 172,947,517 236,181,424 78,436,864 103,577,307...

TV EverywhereH1, 2019

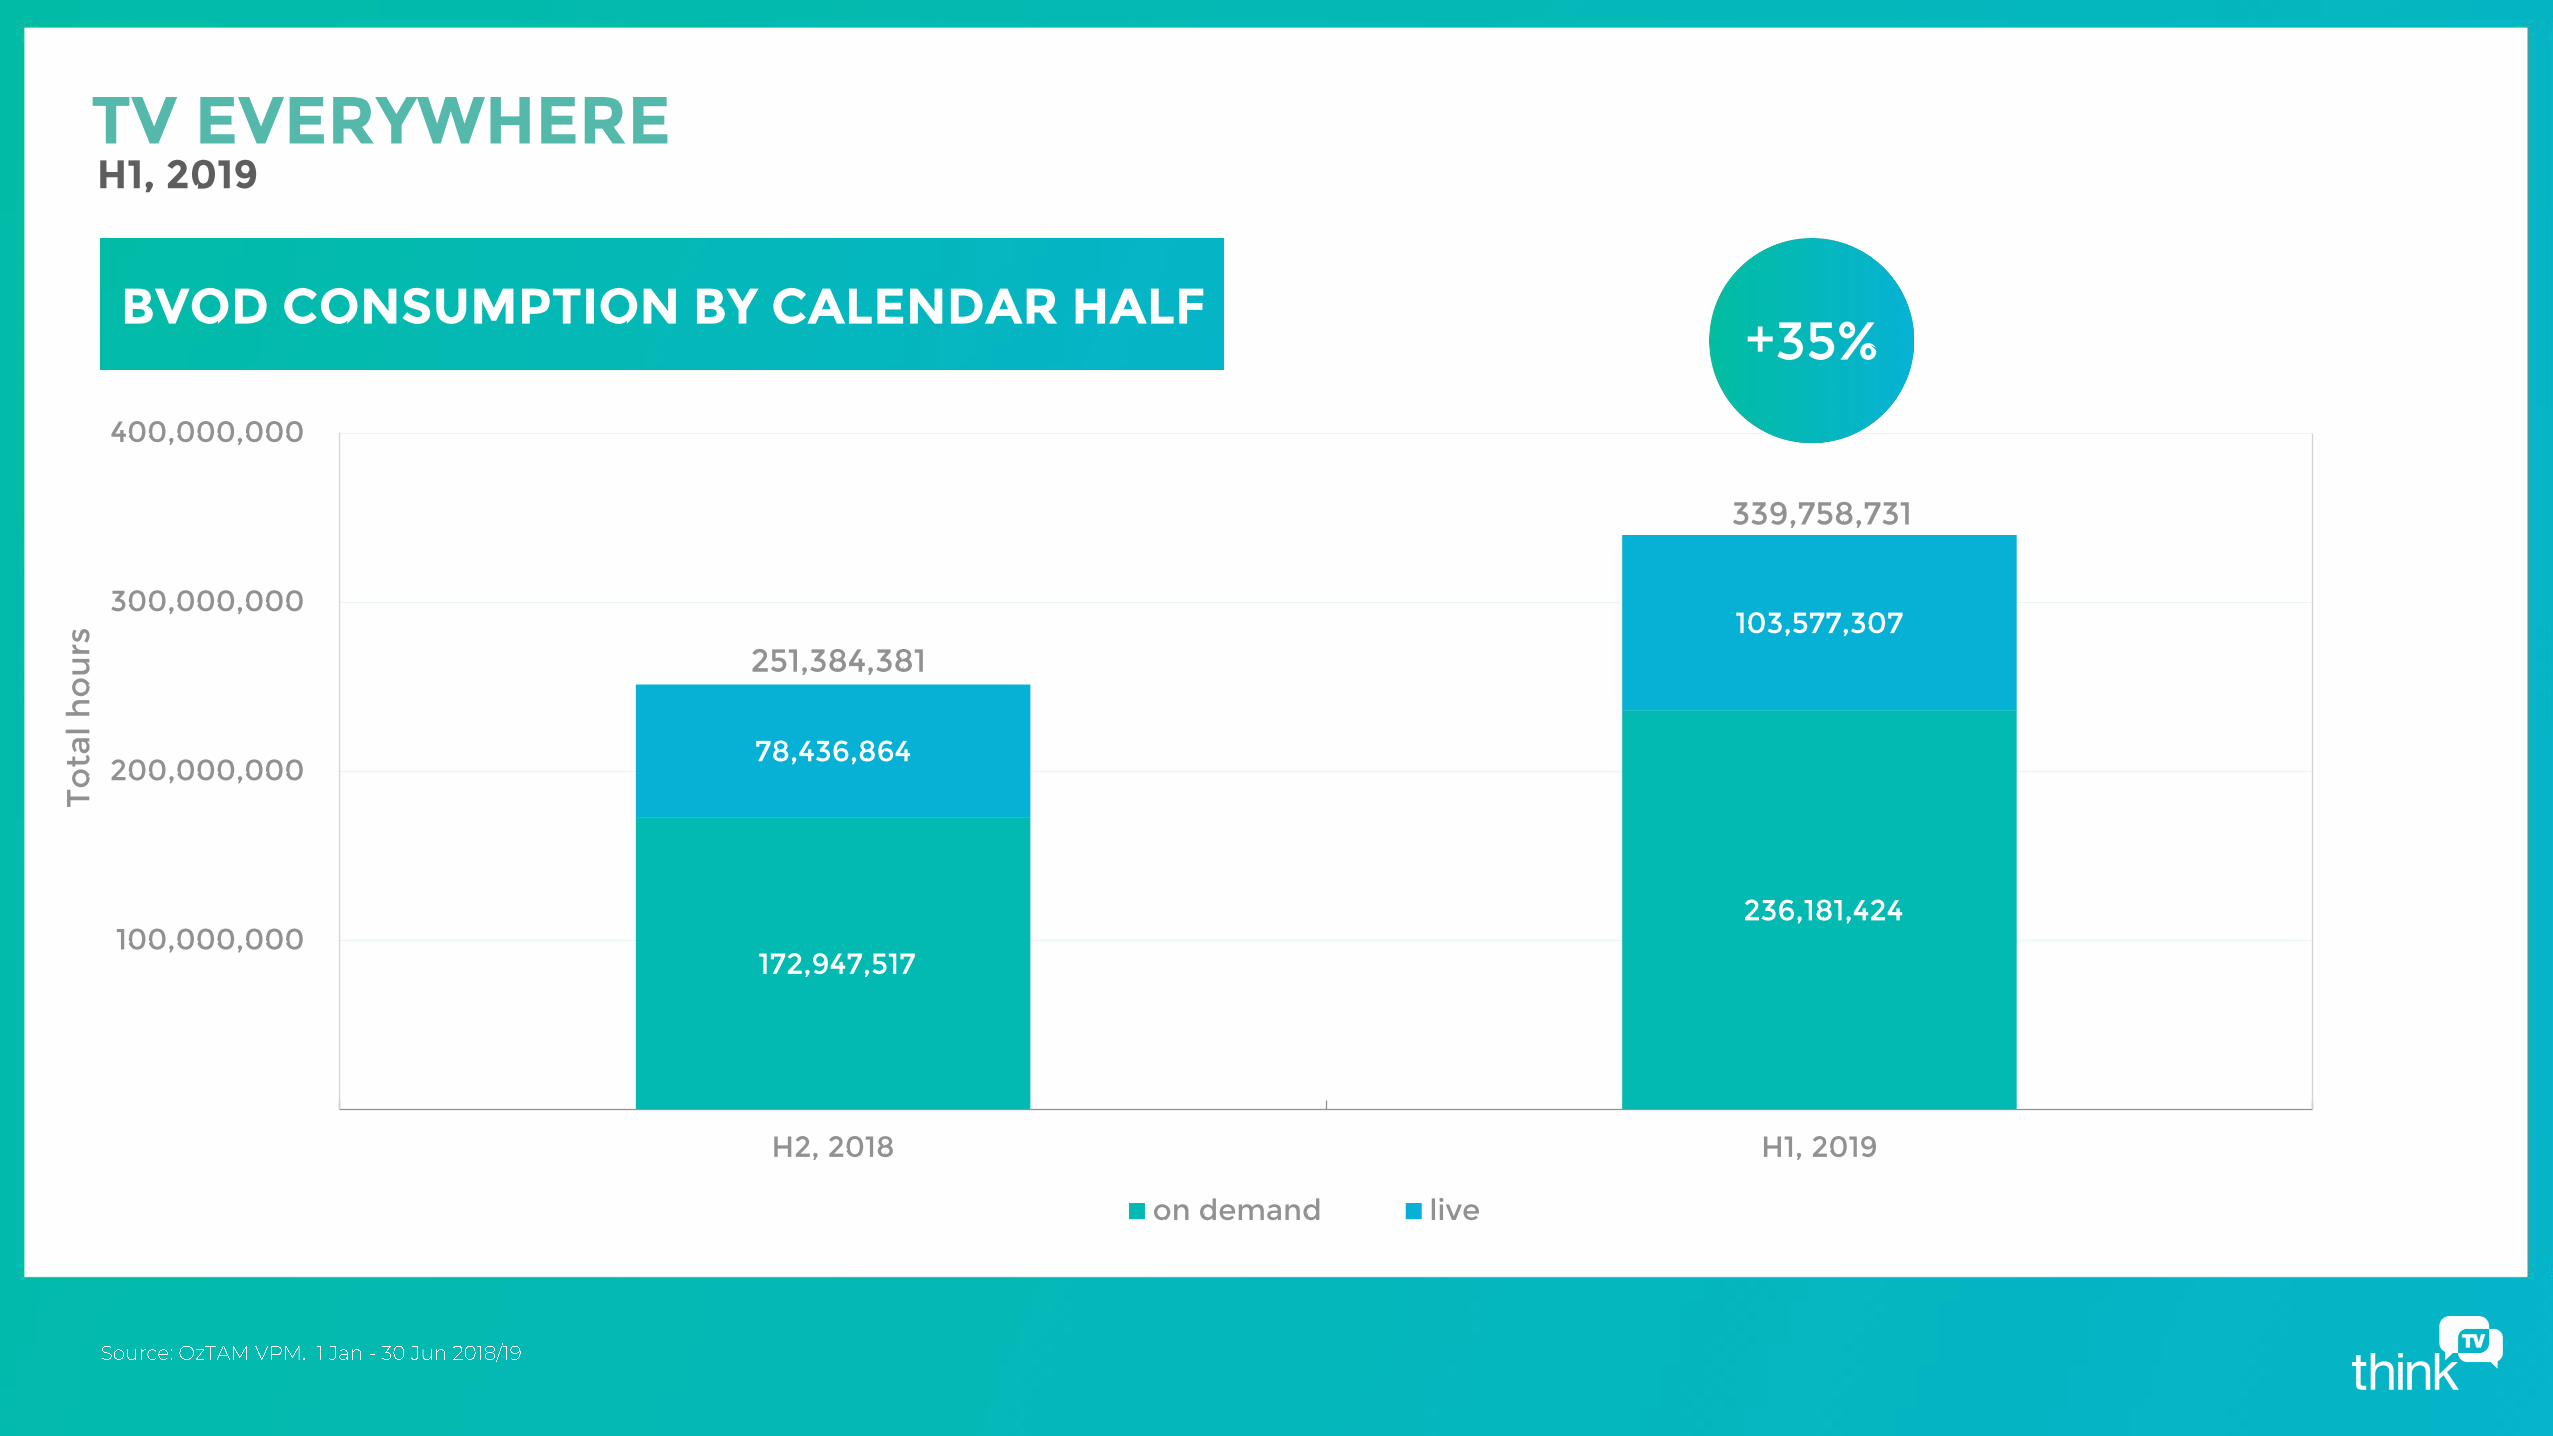
Broadcaster VOD up 35%

TV AND ITS BABIESLINEAR TV
TV received via aerial,
satellite or cable is Linear
TV, i.e. any TV that is not
viewed over the internet.
Also known as Broadcast
TV, it can be watched as
Live TV or Playback TV.
PLAYBACK TVLinear TV recorded and watched after the live
broadcast is Playback TV. May be recorded on
a Personal Video Recorder (PVR), VCR or
other form of time-shifting technology.
LIVE STREAMINGBVOD watched live over the
internet as it is broadcast.
BROADCASTER VOD (BVOD)TV watched online is BVOD. It can be watched either live (via live streaming) or on-demand and is available on a computer, mobile device or Connected TV. BVOD
content is professionally produced, broadcast-quality and includes TV shows and movies, archived shows and BVOD exclusives and
originals.
TV is a video experience that allows consumers to watch professionally produced video content at the time and on the screen of their choosing. Below are the different ways people access that experience.
ON DEMAND
BVOD watched over the
internet at any time other
than live as it goes to air.
LIVE TVLinear TV watched
live as it is broadcast.
BROADCASTER VOD
TV watched online is BVOD. It
can be watched either live (via
live streaming) or on-demand
and is available on a computer,
mobile device or Connected TV.
BVOD content is professionally
produced, broadcast-quality
and includes TV shows and
movies, archived shows and
BVOD exclusives and originals.
TV EVERYWHEREH1, 2019
THEBVOD-O-SPHERE
H1, 2019
'-
4,000,000
8,000,000
12,000,000
16,000,000
20,000,000
1 2 3 4 5 6 7 8 9 10 11 12 13 14 15 16 17 18 19 20 21 22 23 24 25 26
Tota
l ho
urs
vie
we
d p
er
we
ek
Week no.
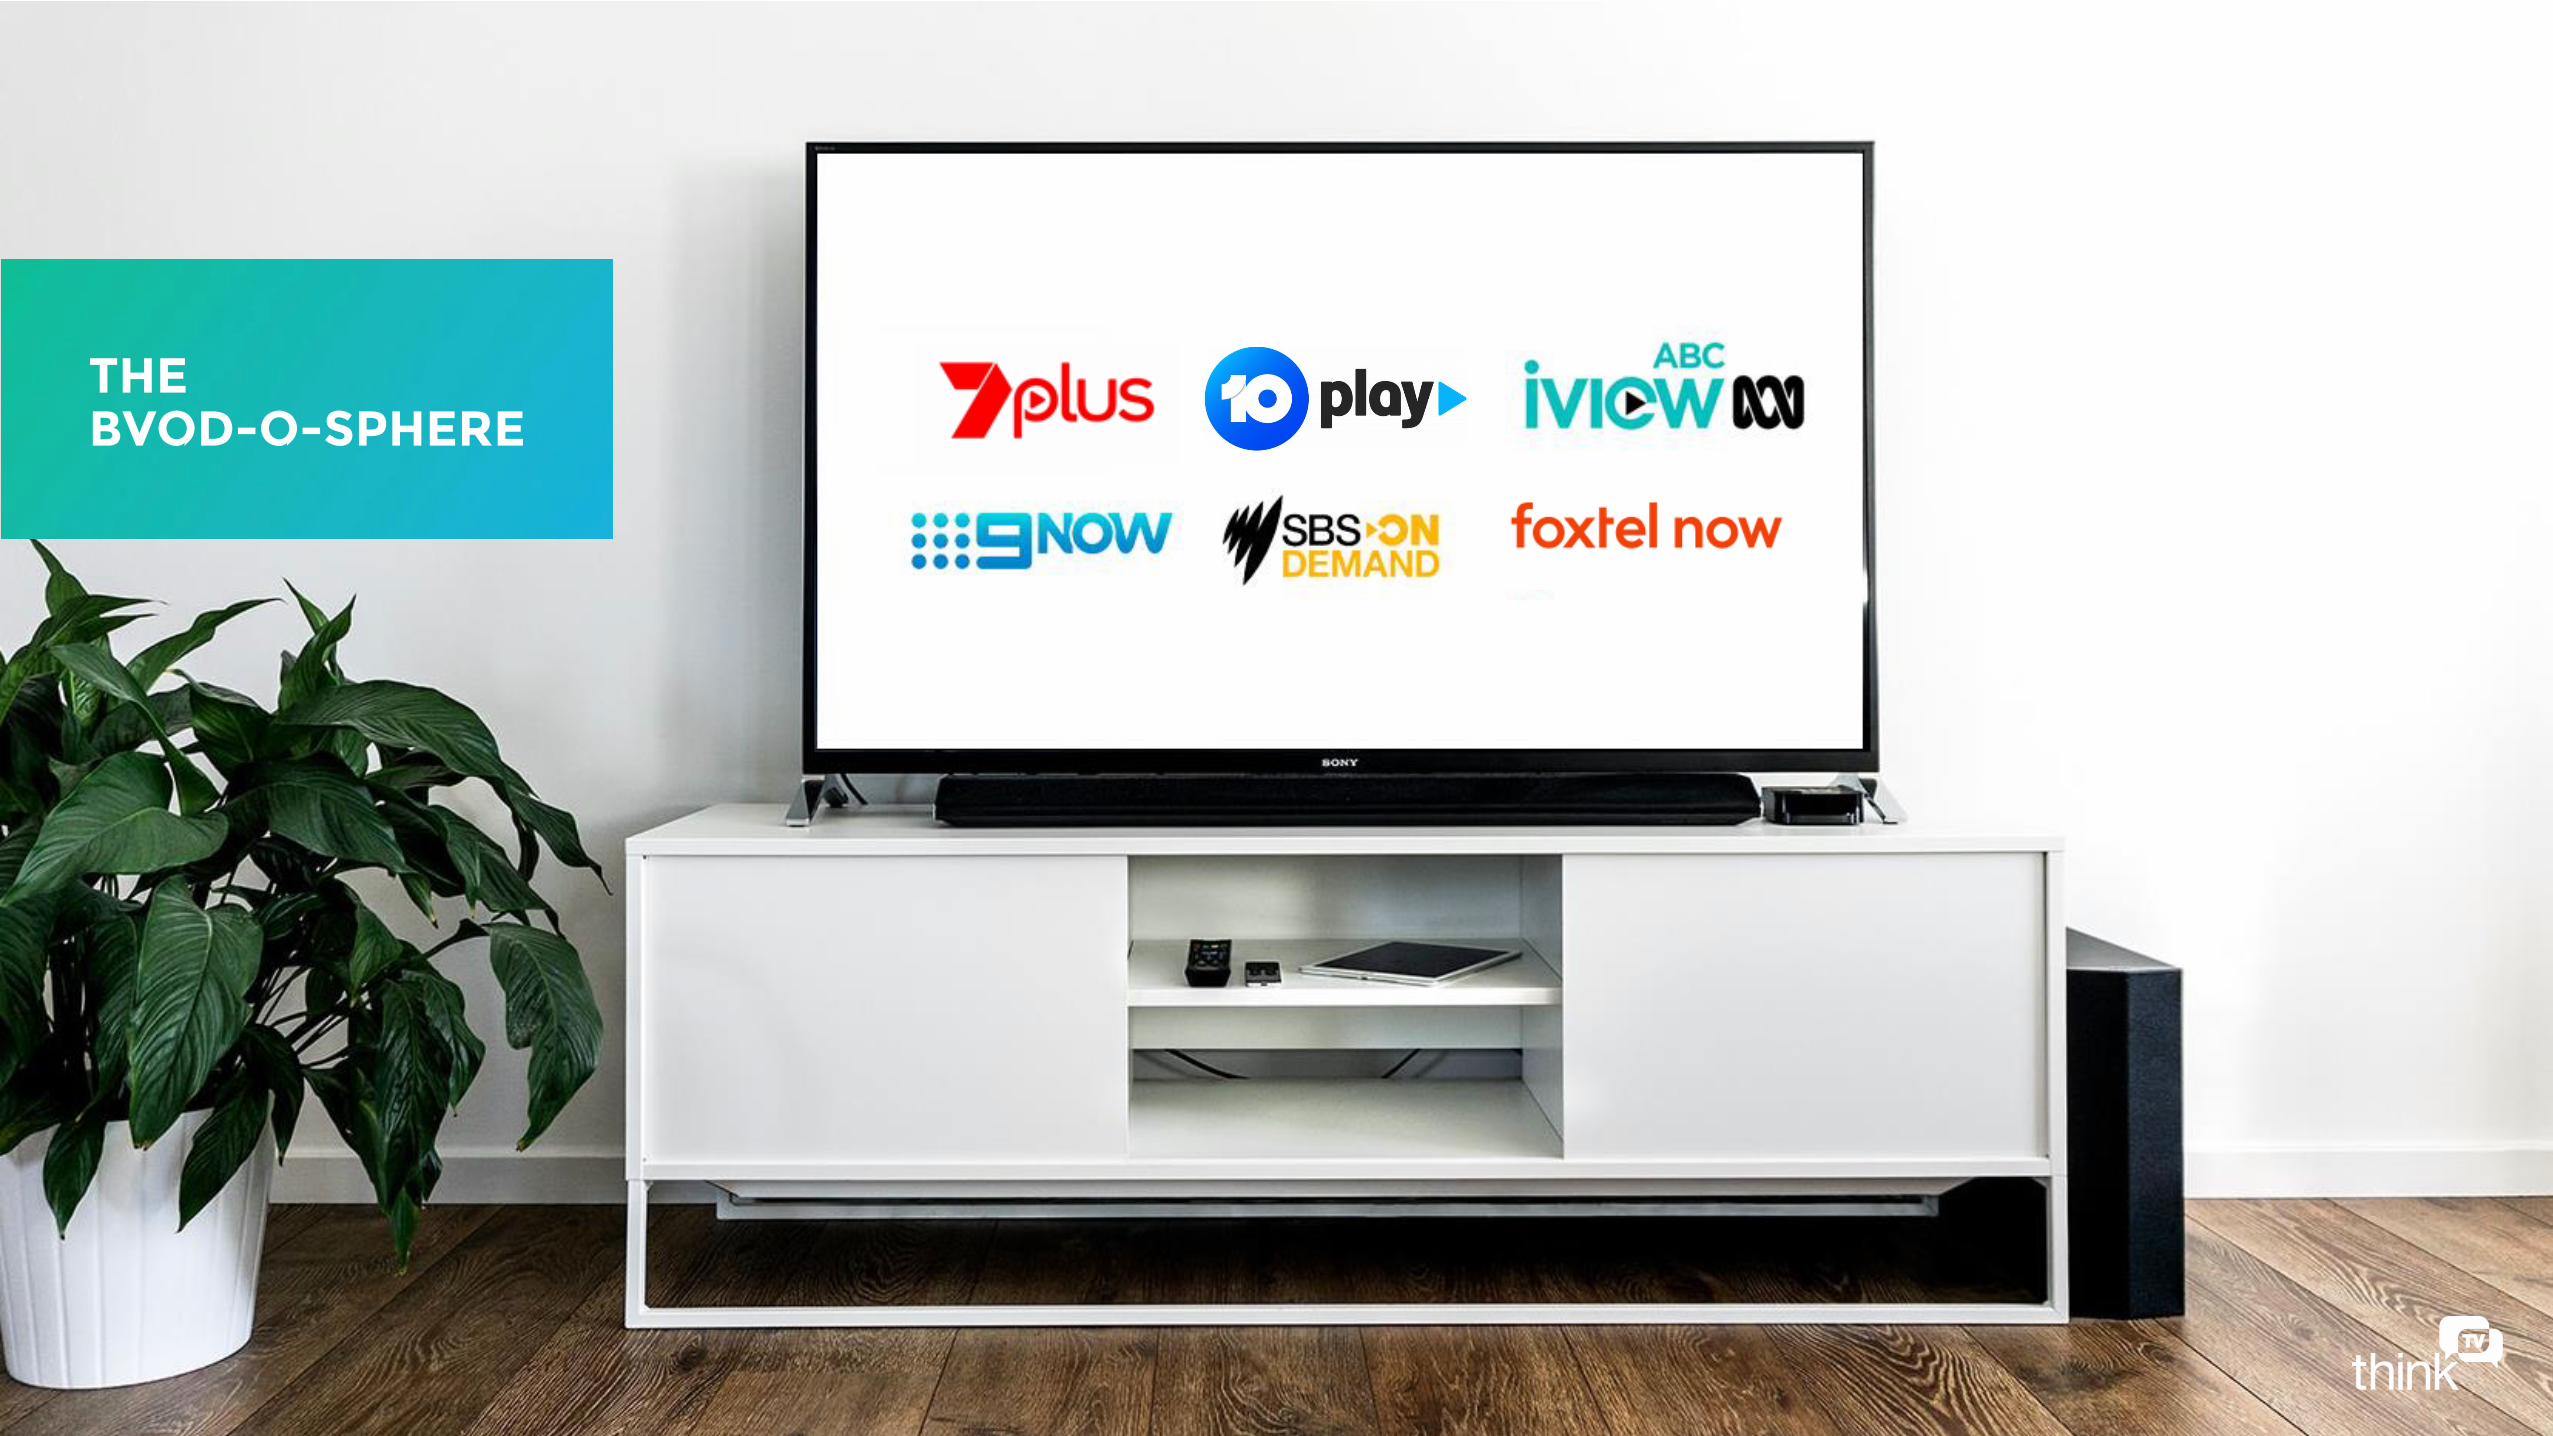
BVOD Total hours viewed per weekH1, 2019
Wk 1 2 3 4 5 6 7 8 9 10 11 12 13 14 15 16 17 18 19 20 21 22 23 24 25 26
Hours pw (millions) 8.0 9.1 10.0 9.5 11.1 11.9 11.8 11.8 12.3 12.3 13.2 12.4 12.5 12.5 13.5 13.7 15.2 14.9 13.8 14.2 14.4 13.9 14.7 15.5 14.8 14.9
BVOD CONSUMPTION TREND
TV EVERYWHERE
H1, 2019
'-
3,000,000
6,000,000
9,000,000
12,000,000
1 2 3 4 5 6 7 8 9 10 11 12 13 14 15 16 17 18 19 20 21 22 23 24 25 26
Tota
l ho
urs
vie
we
d p
er
we
ek
Week no.
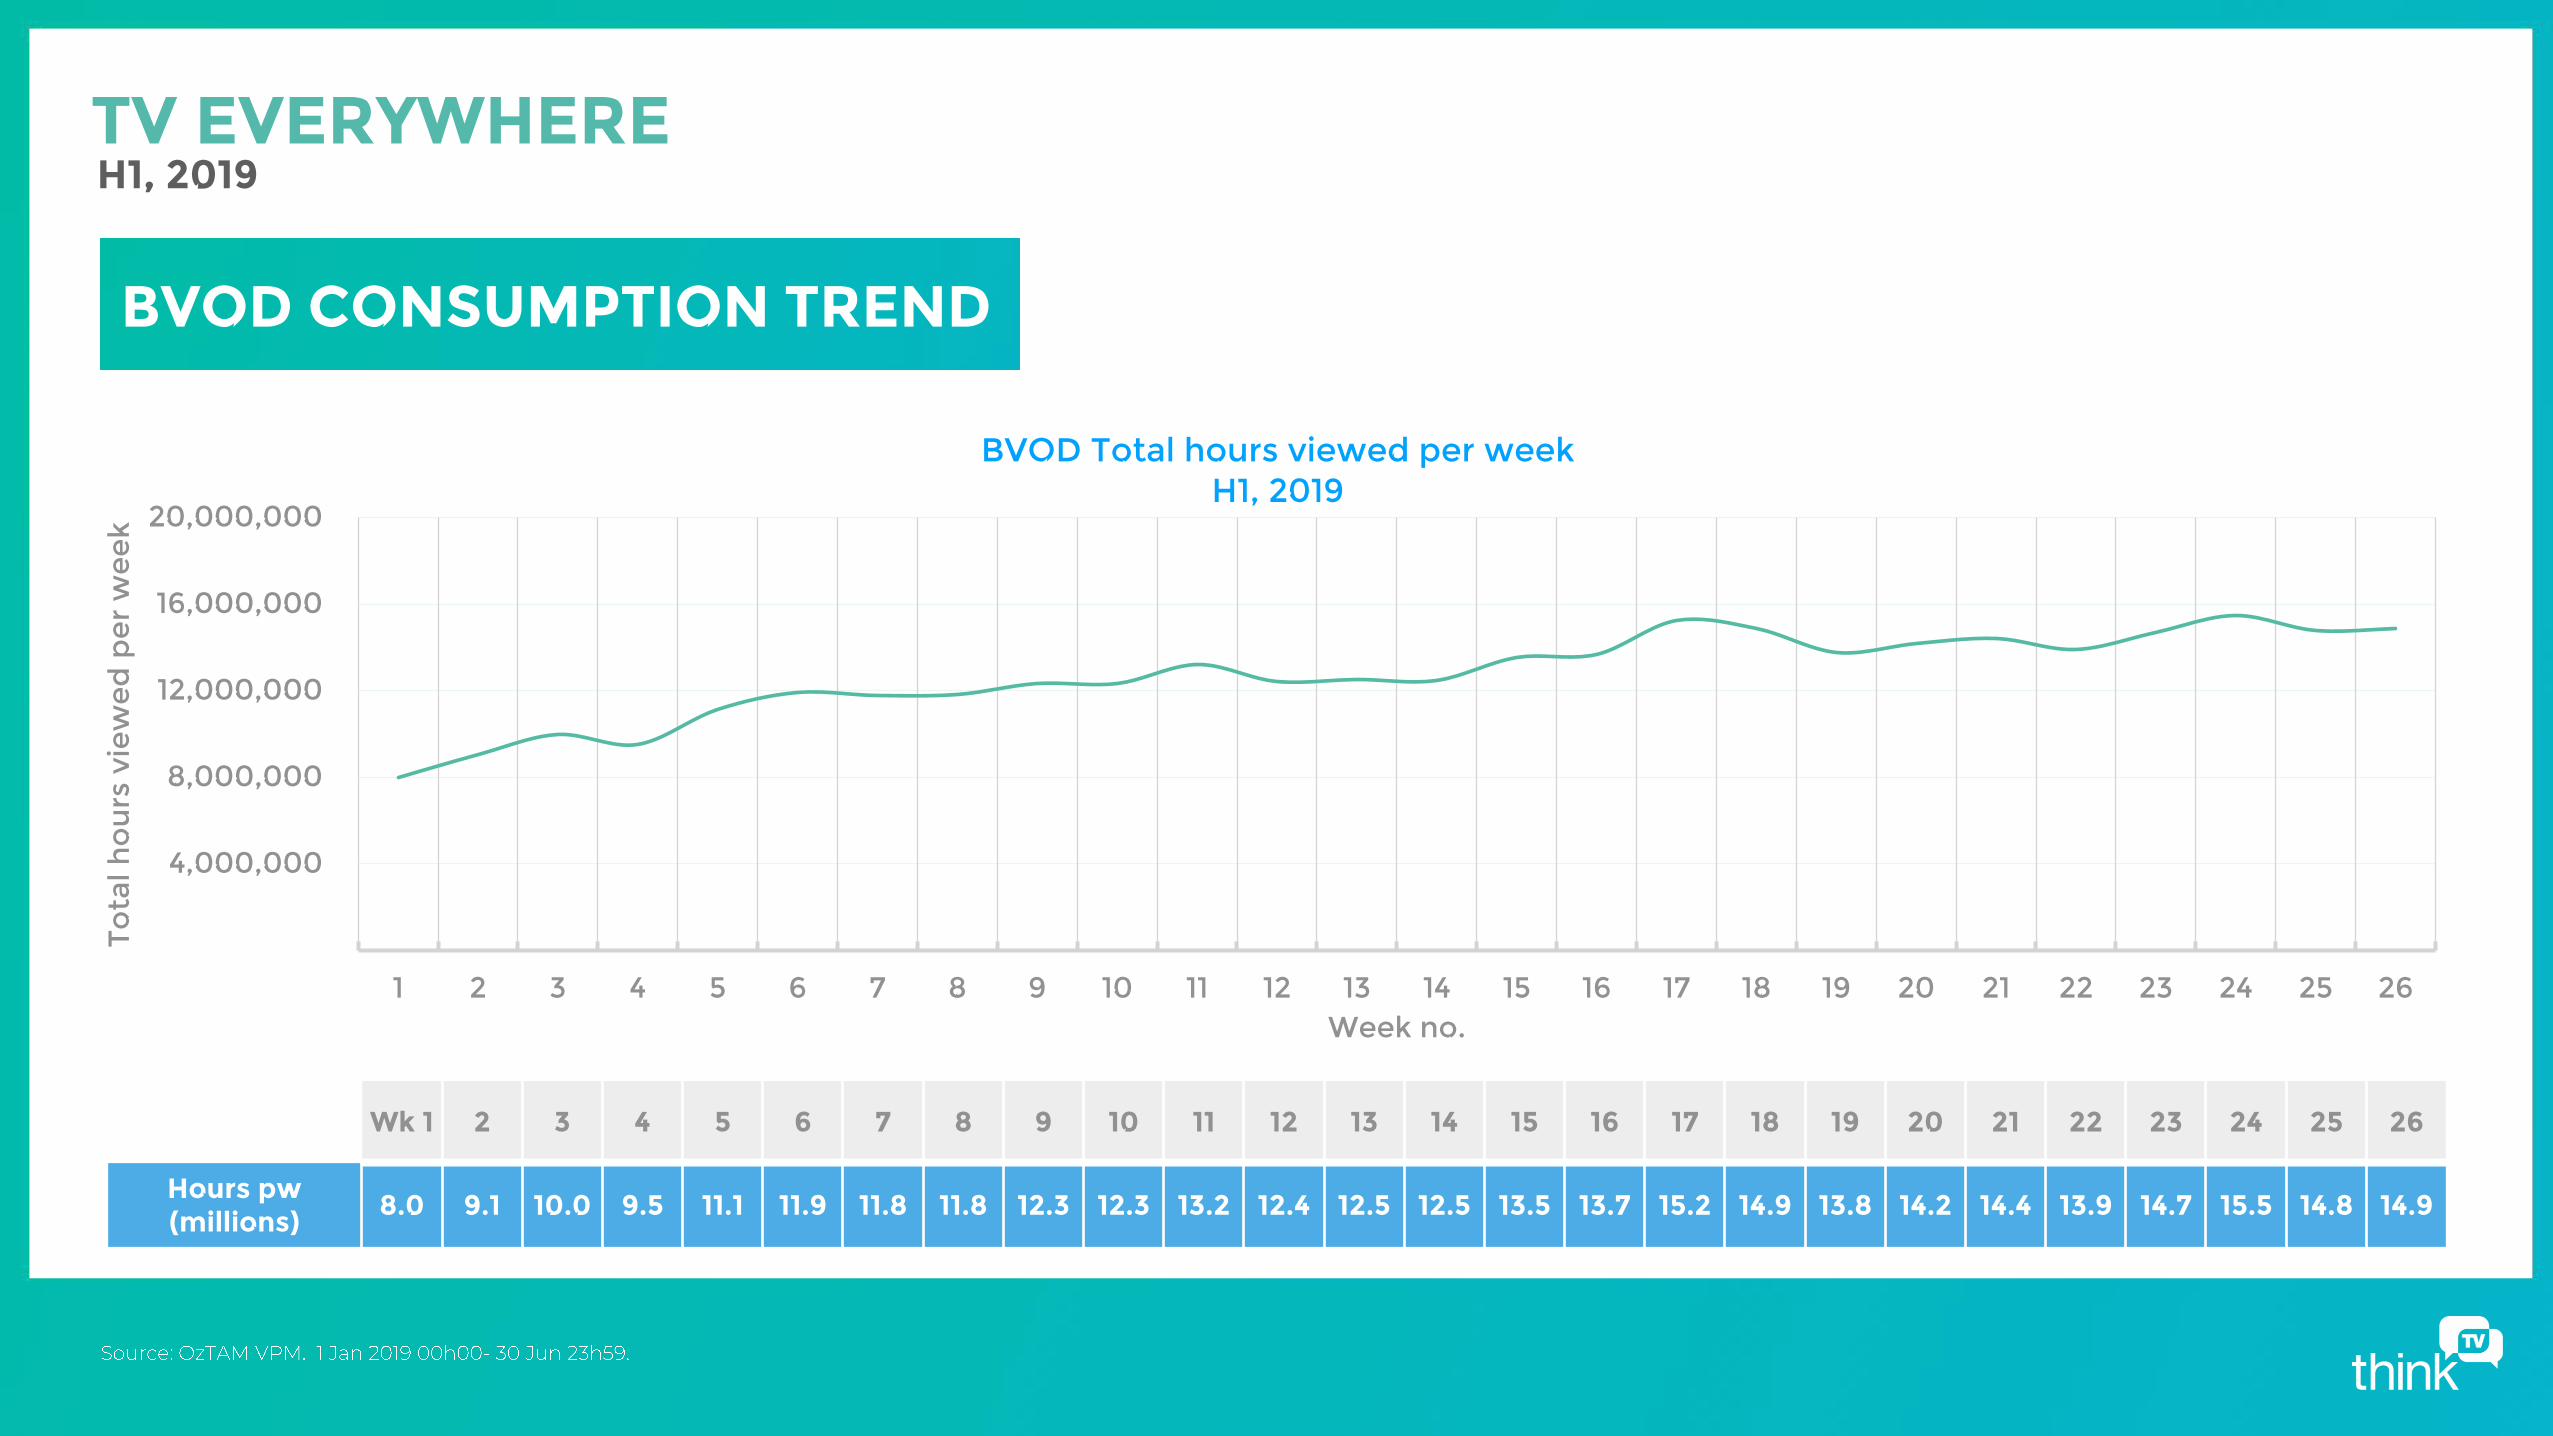
BVOD Total hours viewed per weekH1, 2019
live on demand
BVOD CONSUMPTION TREND BY VIEW TYPE
TV EVERYWHERE
H1, 2019
172,947,517
236,181,424
78,436,864
103,577,307
'-
100,000,000
200,000,000
300,000,000
400,000,000
H2, 2018 H1, 2019
on demand live
+35%BVOD CONSUMPTION BY CALENDAR HALF
Tota
l ho
urs 251,384,381
339,758,731
TV EVERYWHERE
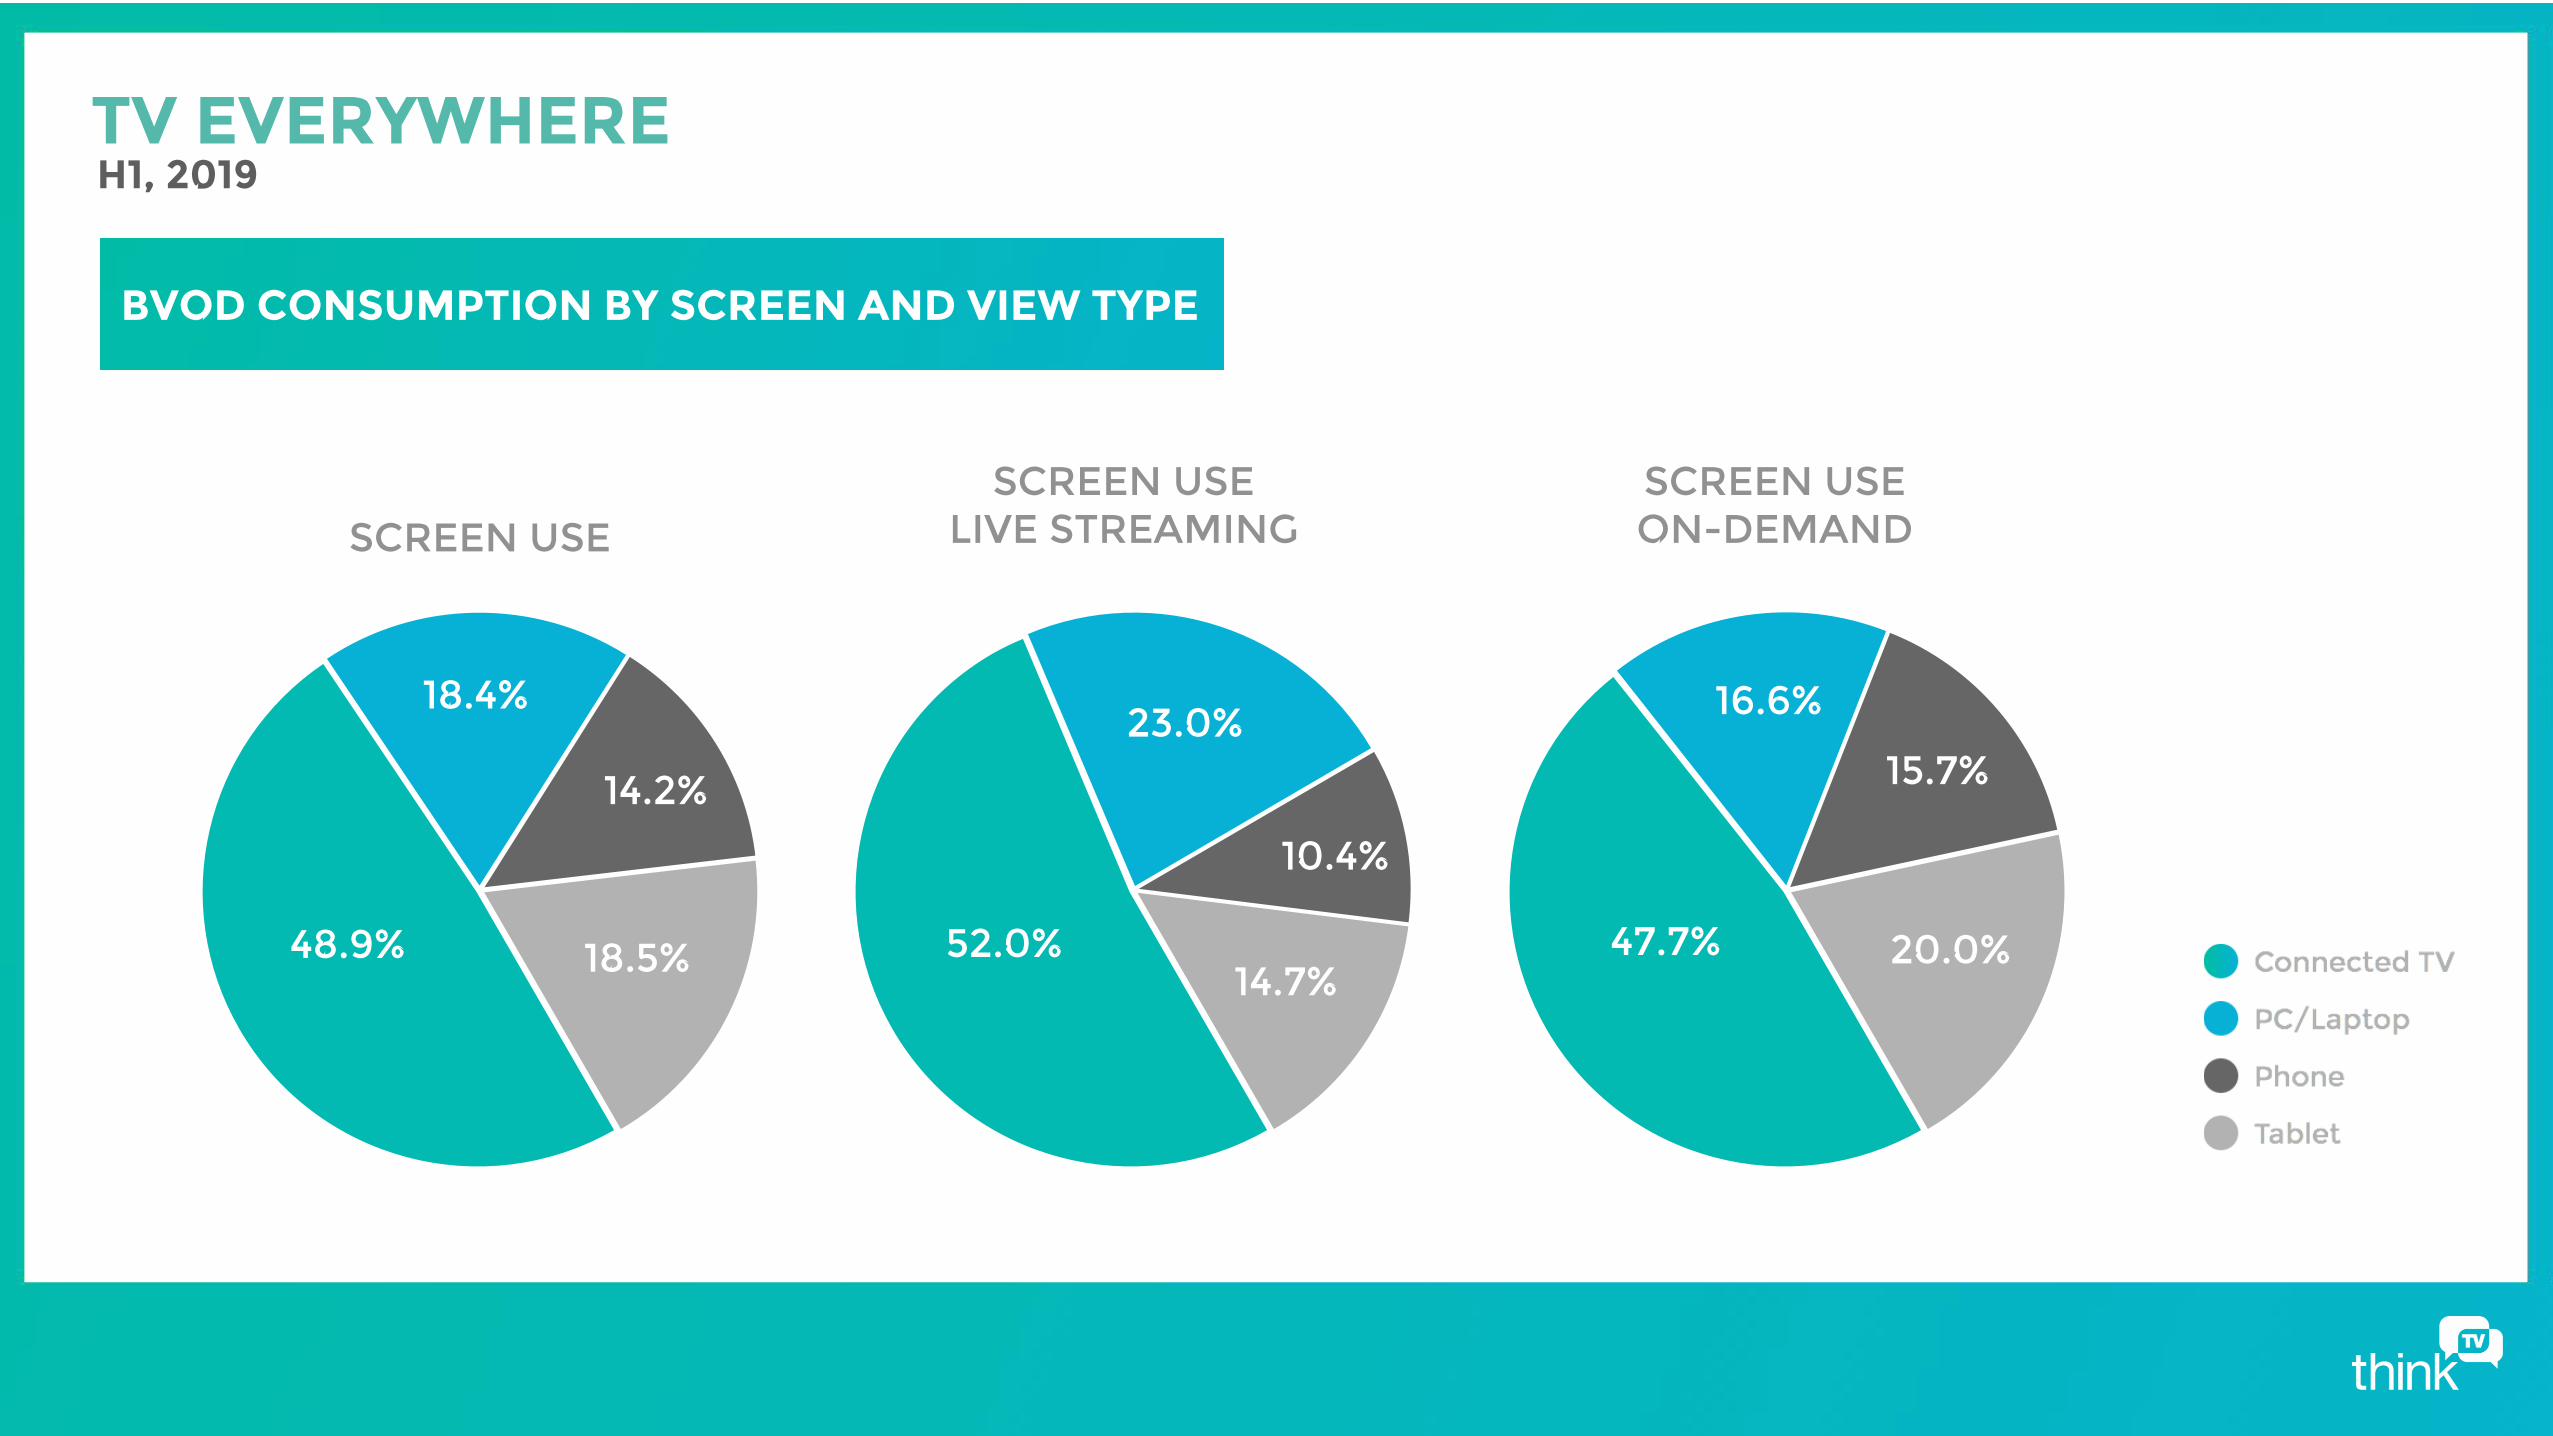
48.9%
18.4%
14.2%
18.5% 47.7%
16.6%
15.7%
20.0%
H1, 2019
BVOD CONSUMPTION BY SCREEN AND VIEW TYPE
SCREEN USESCREEN USE
LIVE STREAMINGSCREEN USEON-DEMAND
52.0%
23.0%
10.4%
14.7%
TV EVERYWHERE
H1, 2019
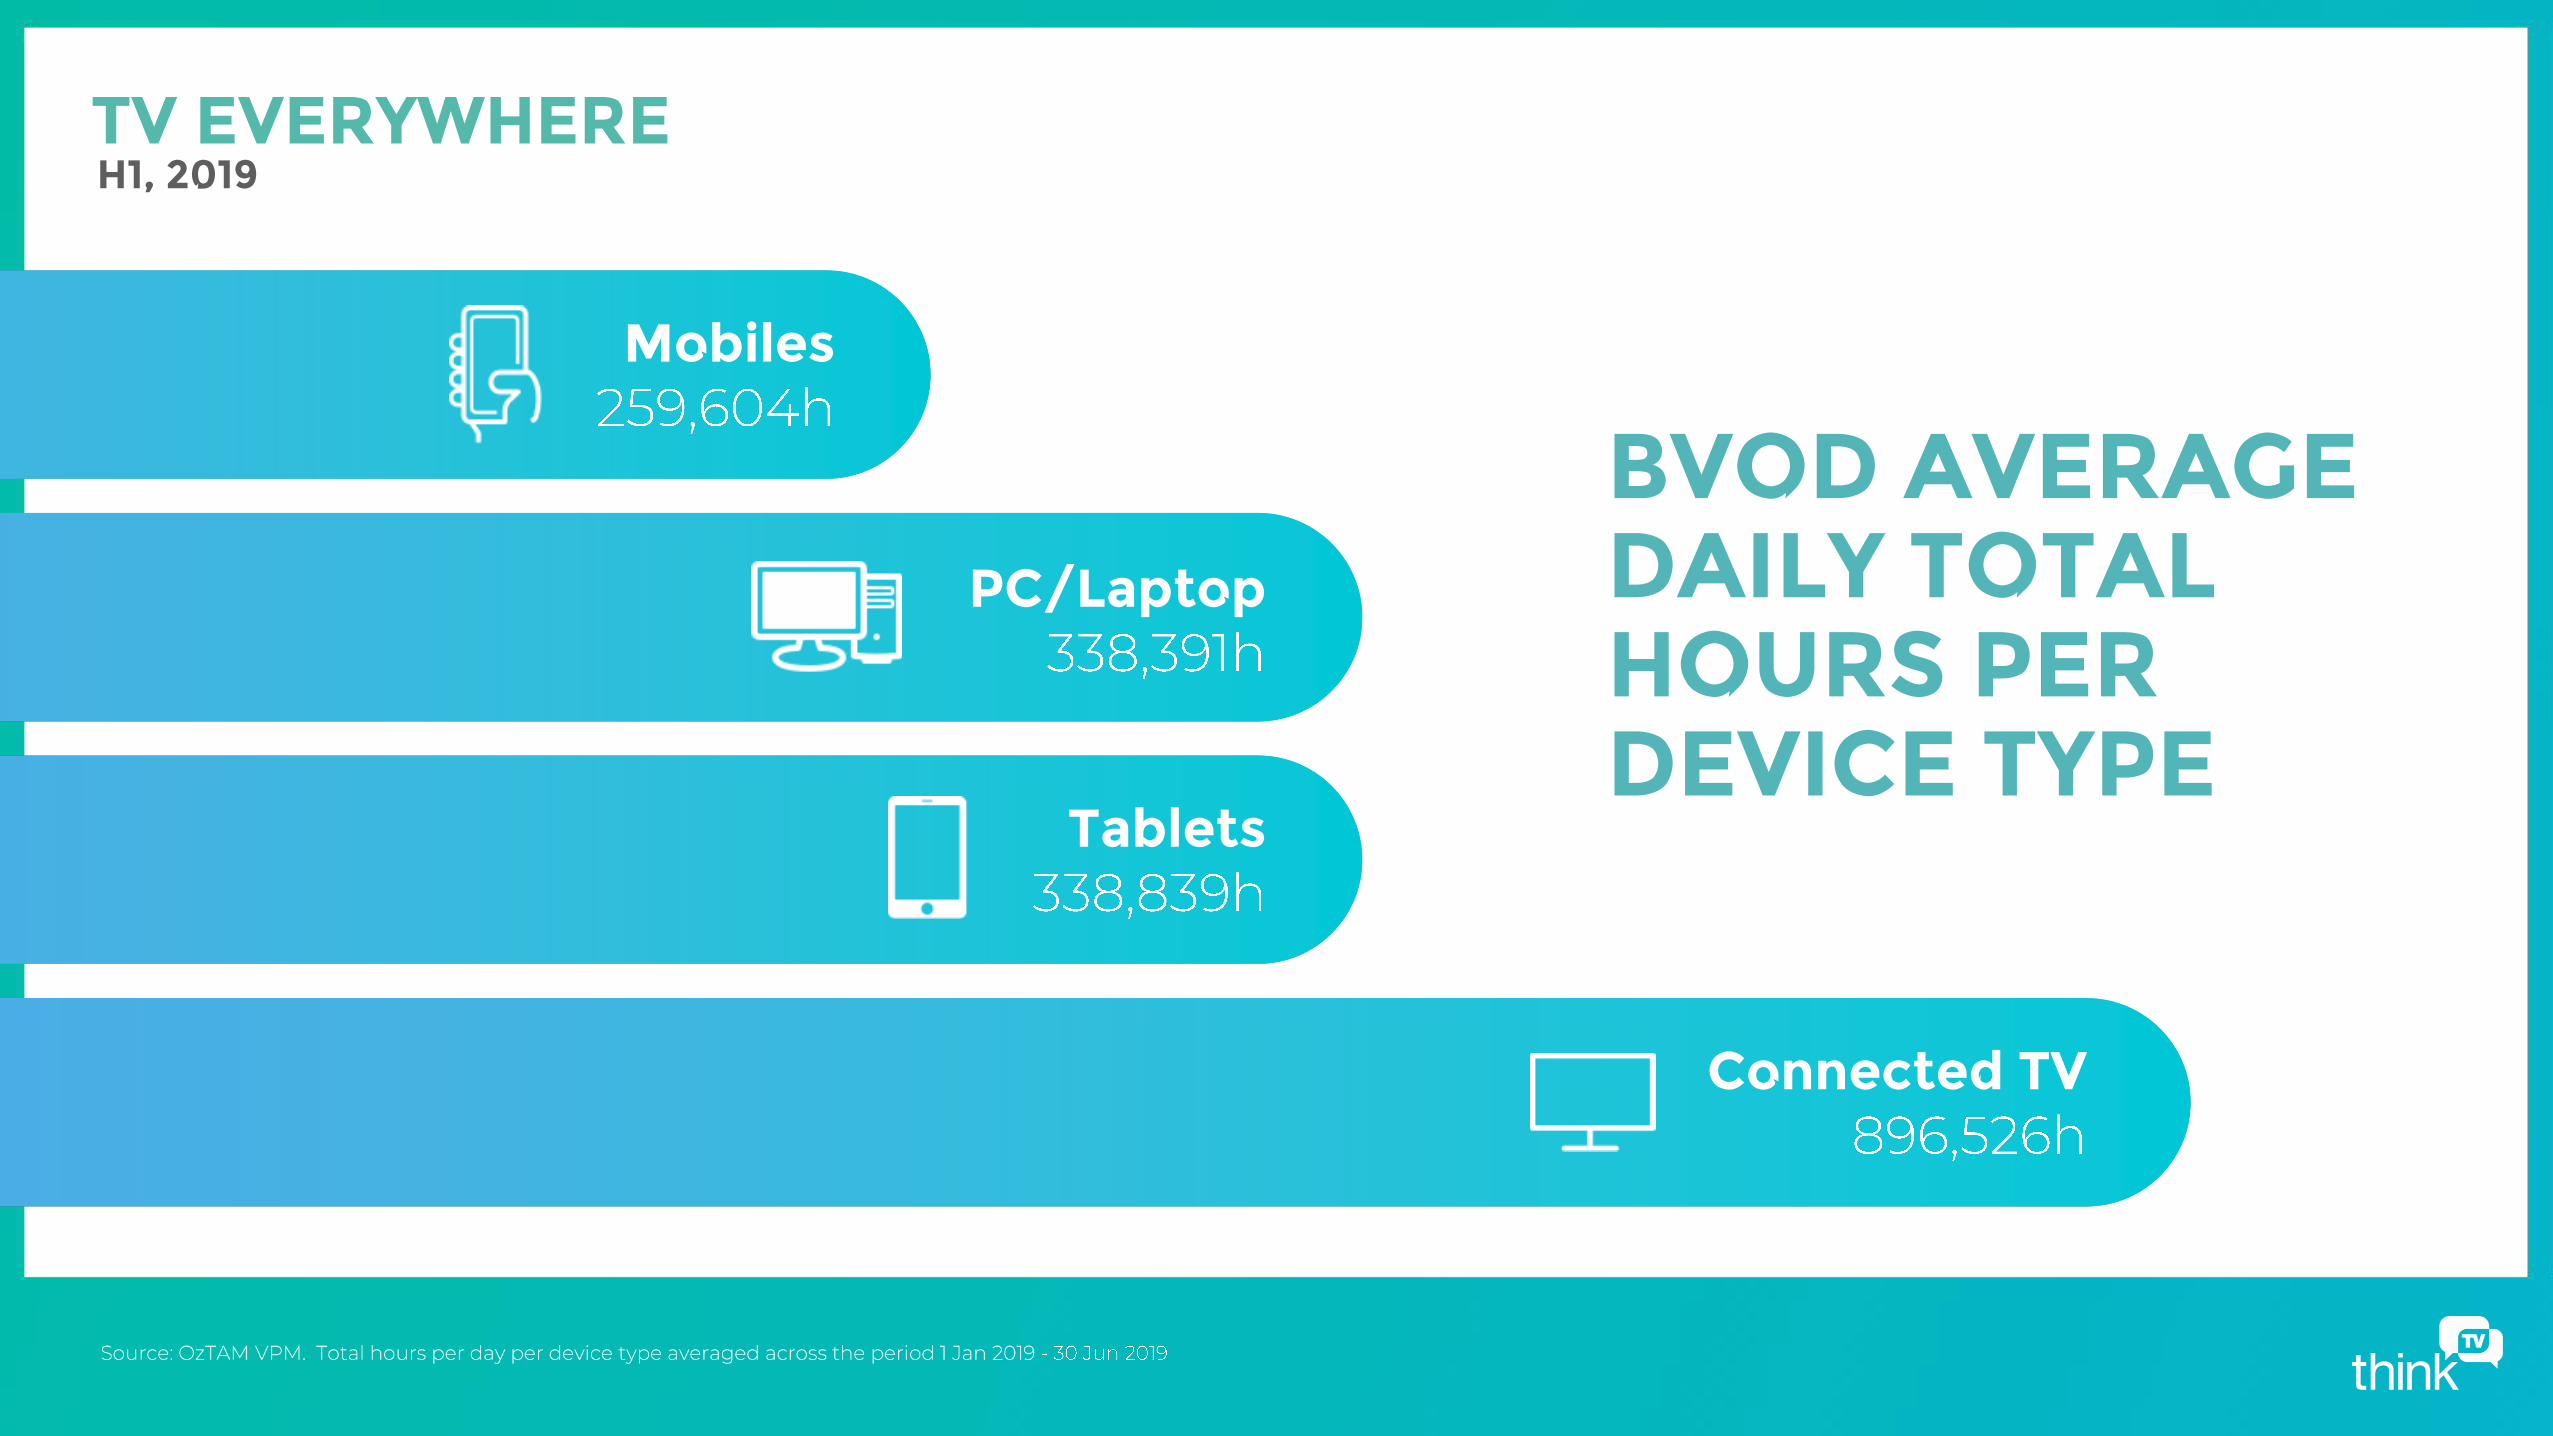
Mobiles
Connected TV
PC/Laptop
Tablets
BVOD AVERAGE DAILY TOTAL HOURS PER DEVICE TYPE
TV EVERYWHERE
H1, 2019
'-
2,000,000
4,000,000
6,000,000
8,000,000
1 2 3 4 5 6 7 8 9 10 11 12 13 14 15 16 17 18 19 20 21 22 23 24 25 26
Tota
l ho
urs
vie
we
d p
er
we
ek
Week number
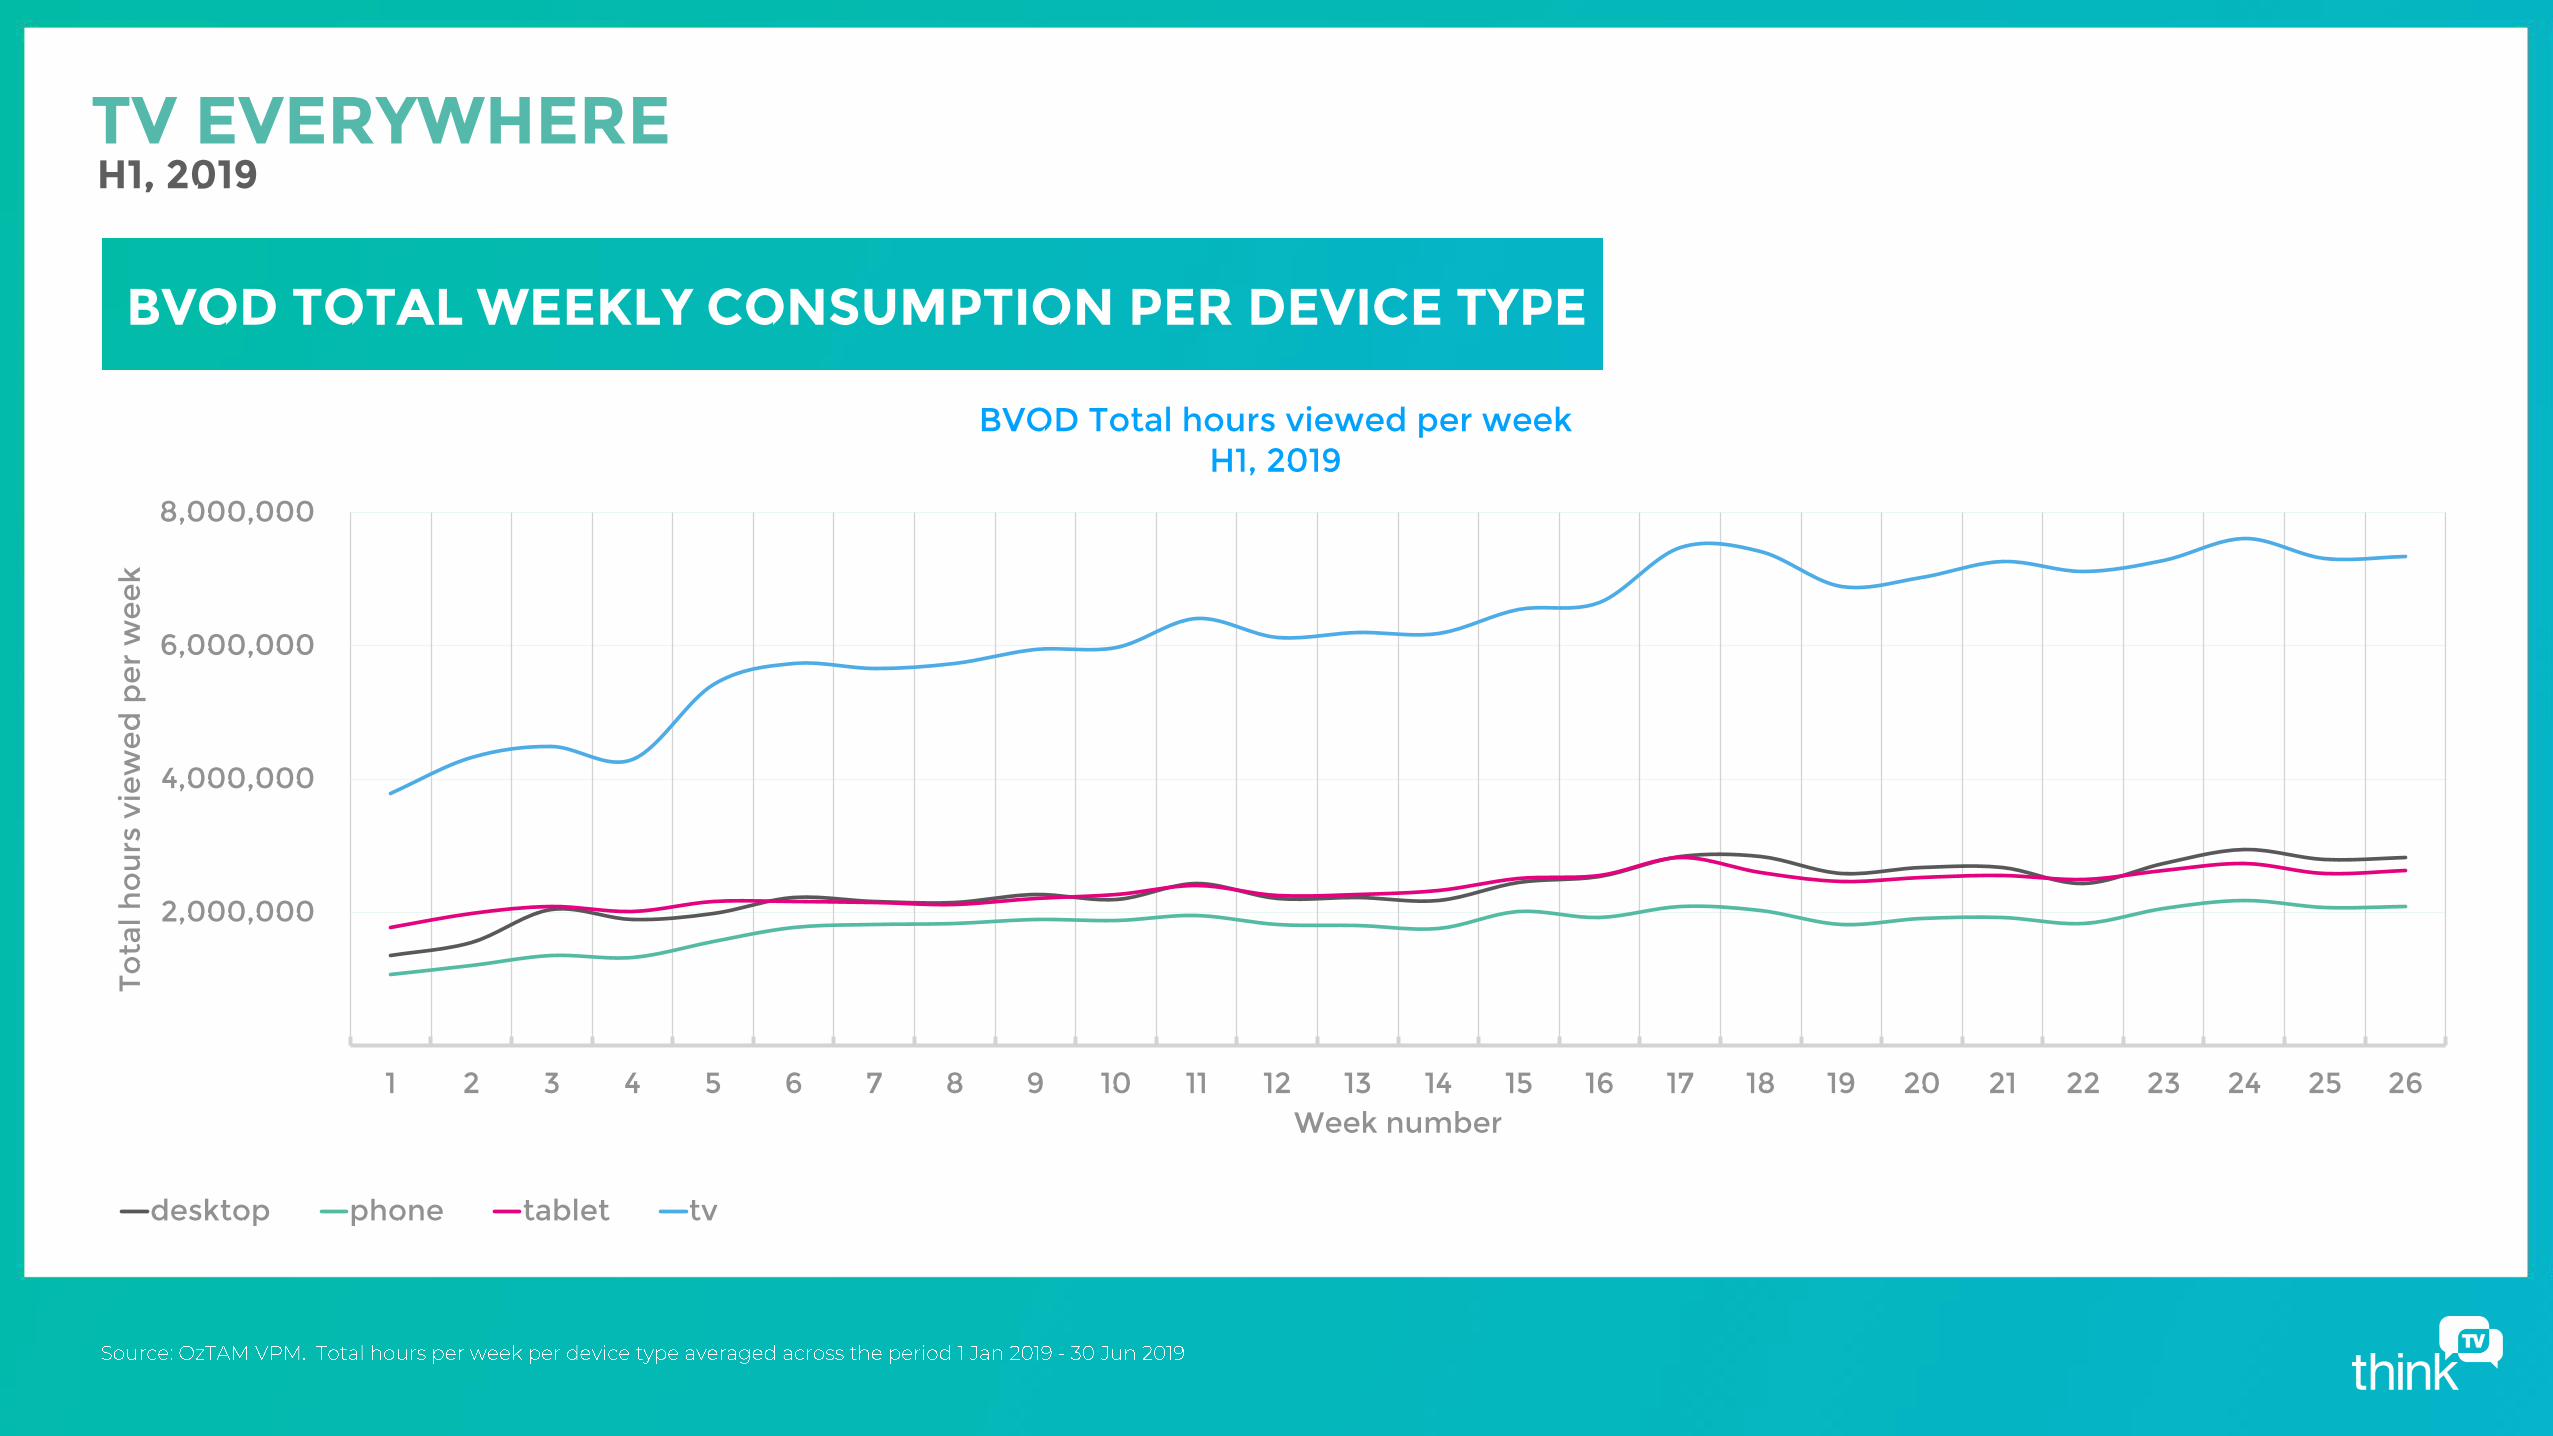
BVOD Total hours viewed per weekH1, 2019
desktop phone tablet tv
BVOD TOTAL WEEKLY CONSUMPTION PER DEVICE TYPE
TV EVERYWHERE
H1, 2019
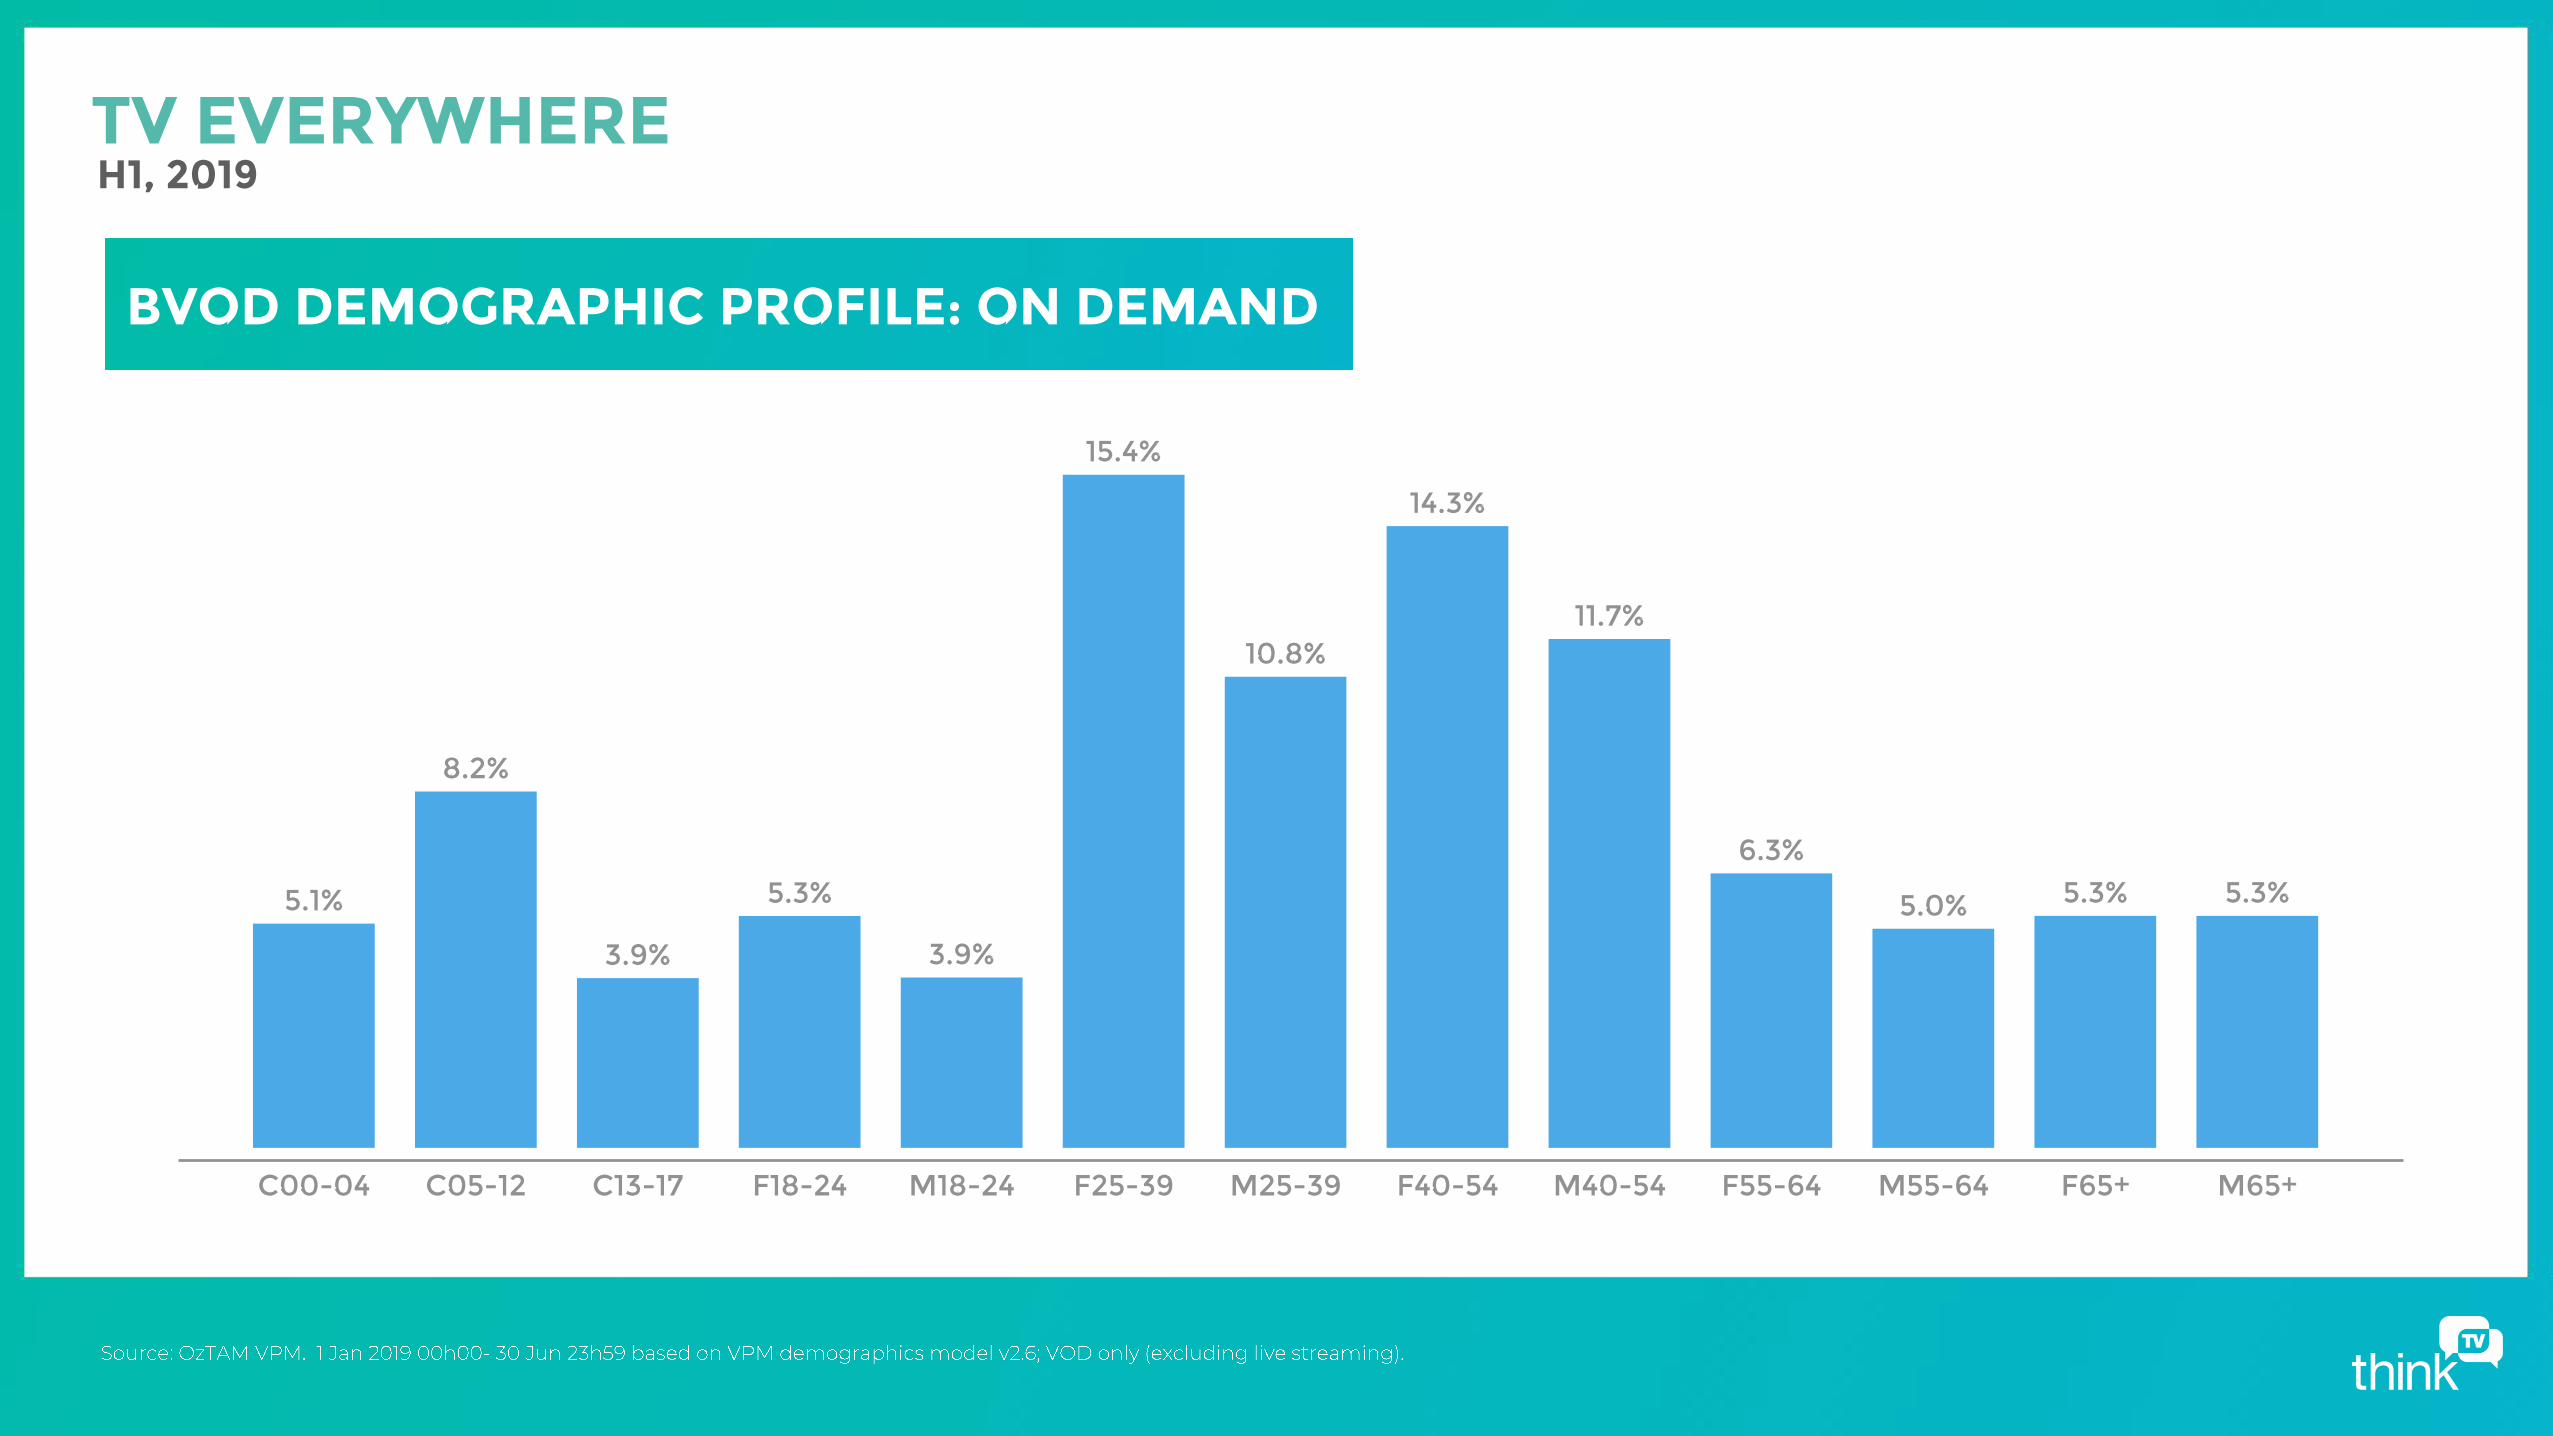
5.1%
8.2%
3.9%
5.3%
3.9%
15.4%
10.8%
14.3%
11.7%
6.3%
5.0% 5.3% 5.3%
C00-04 C05-12 C13-17 F18-24 M18-24 F25-39 M25-39 F40-54 M40-54 F55-64 M55-64 F65+ M65+
BVOD DEMOGRAPHIC PROFILE: ON DEMAND
TV EVERYWHERE
H1, 2019
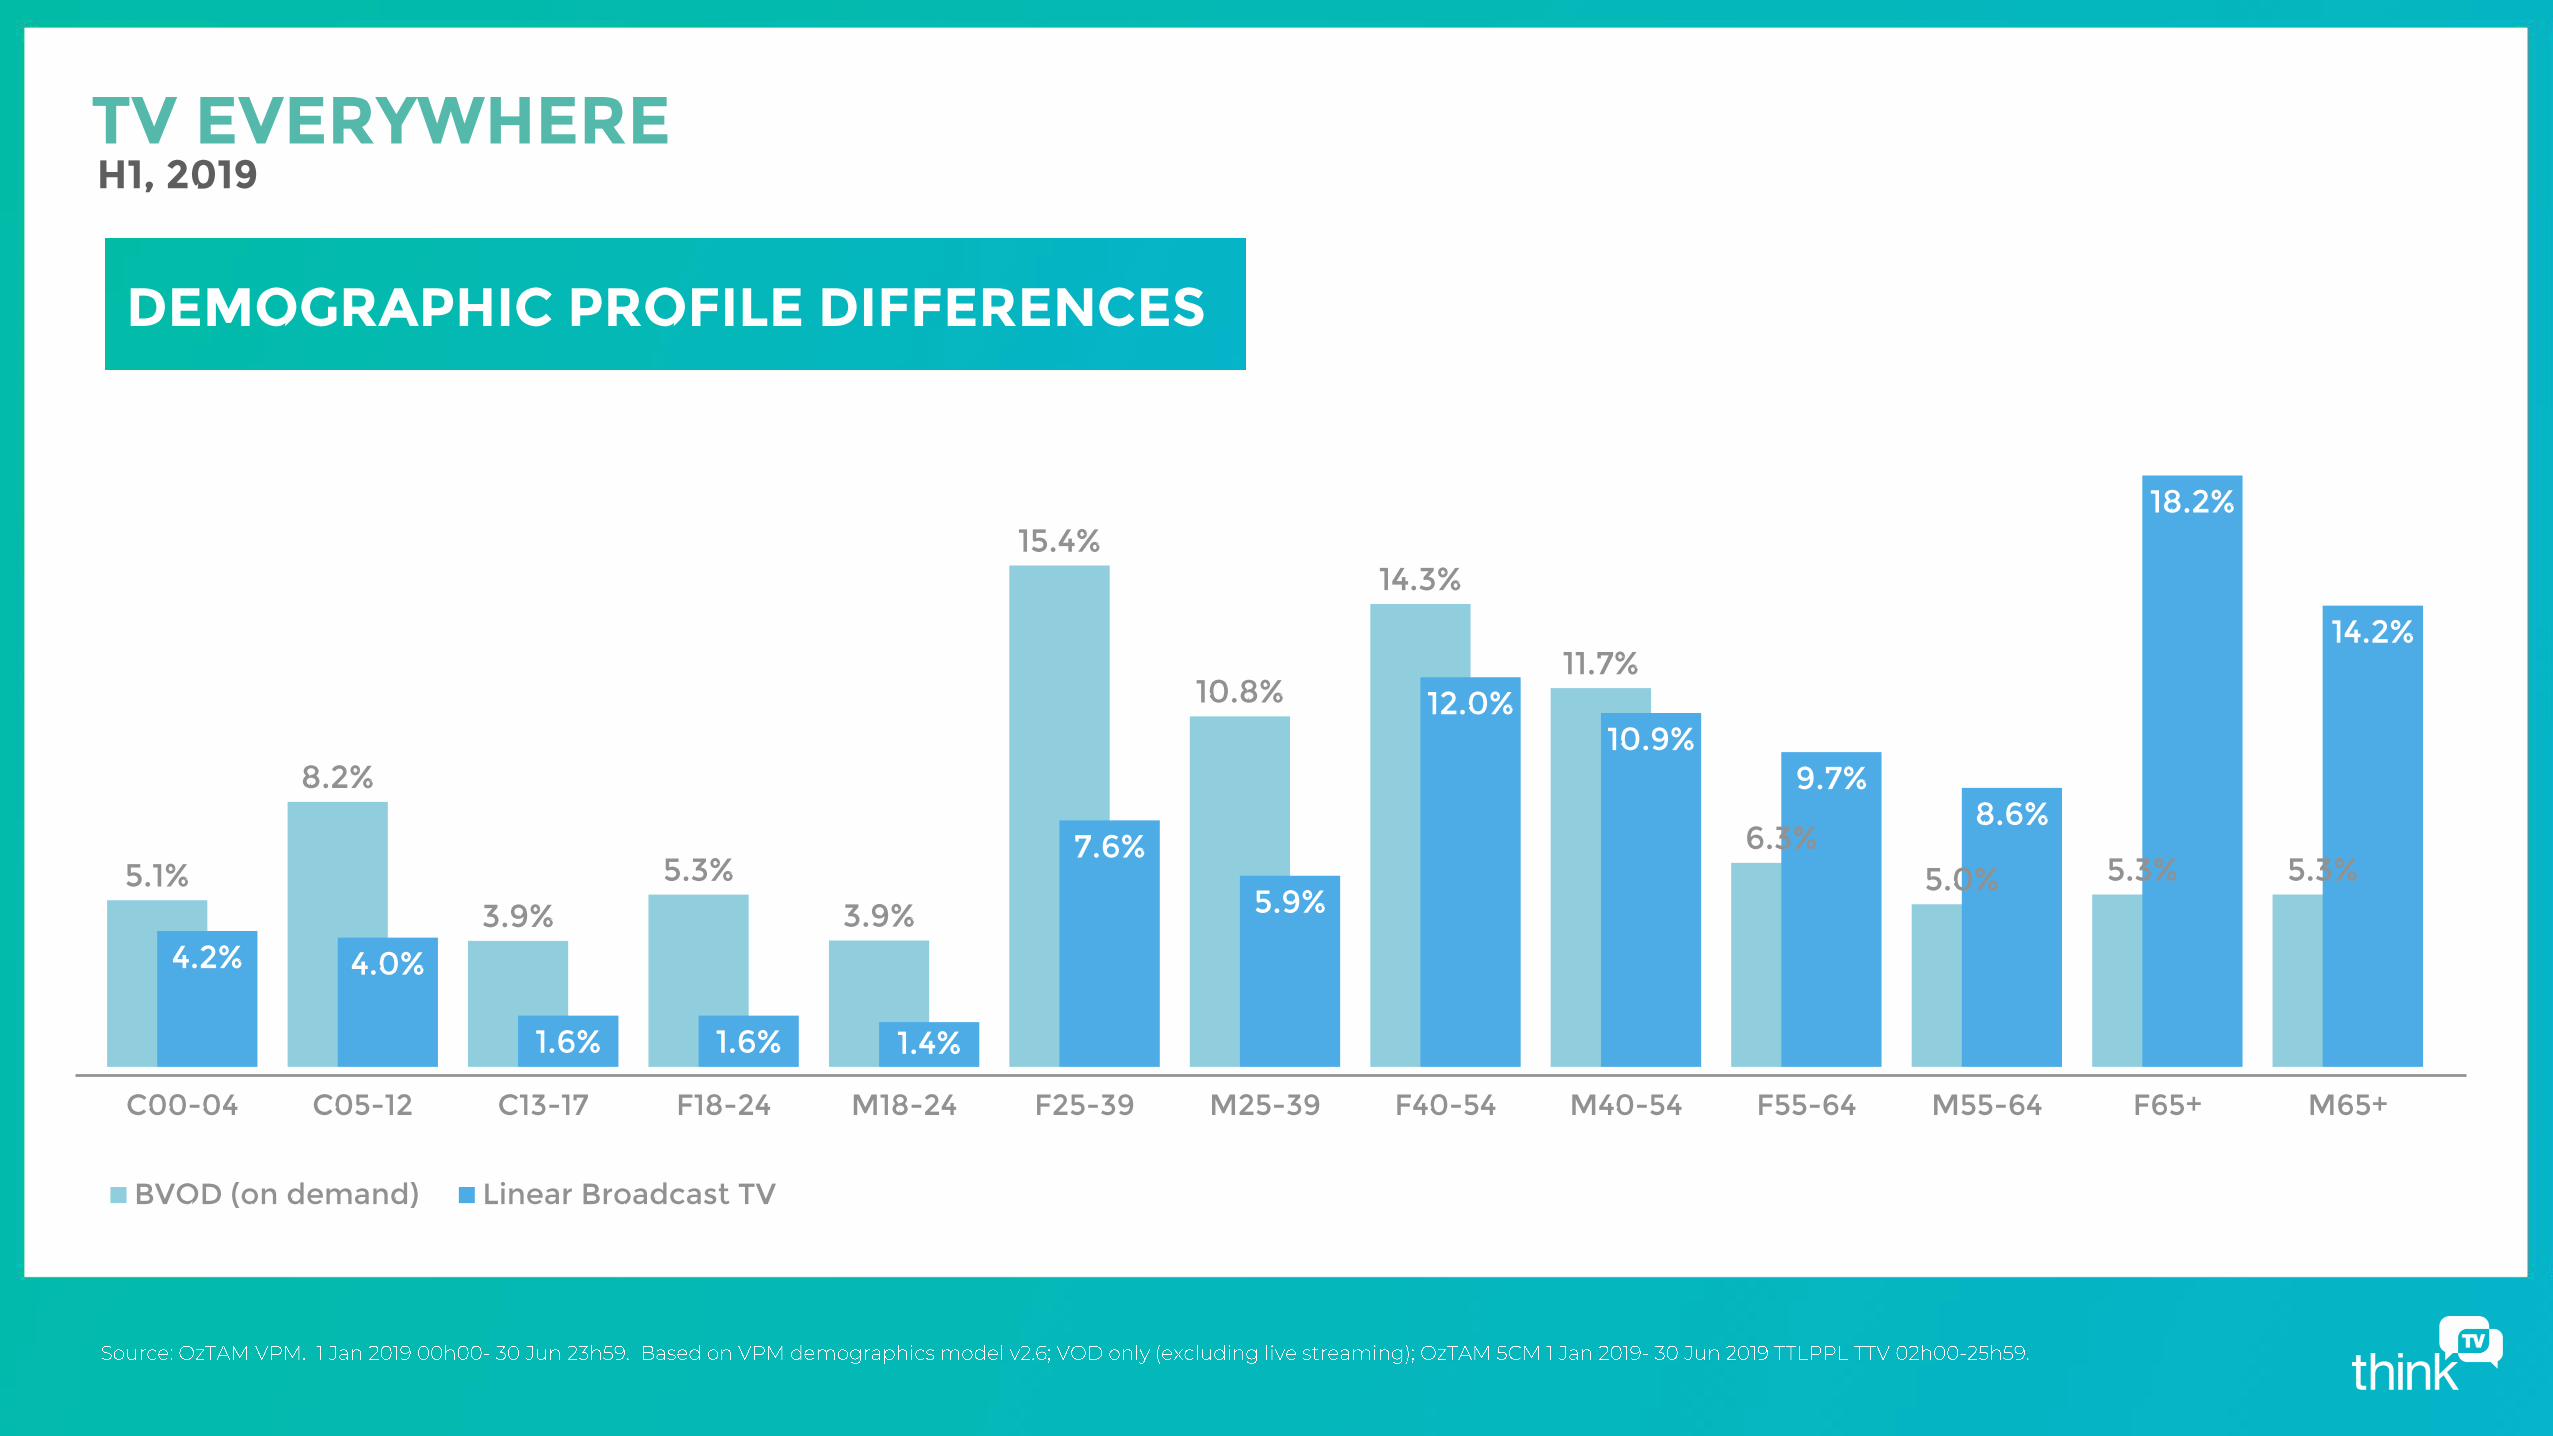
5.1%
8.2%
3.9%5.3%
3.9%
15.4%
10.8%
14.3%
11.7%
6.3%5.0% 5.3% 5.3%
4.2% 4.0%
1.6% 1.6% 1.4%
7.6%
5.9%
12.0%10.9%
9.7%8.6%
18.2%
14.2%
C00-04 C05-12 C13-17 F18-24 M18-24 F25-39 M25-39 F40-54 M40-54 F55-64 M55-64 F65+ M65+
BVOD (on demand) Linear Broadcast TV
DEMOGRAPHIC PROFILE DIFFERENCES
TV EVERYWHERE
H1, 2019\
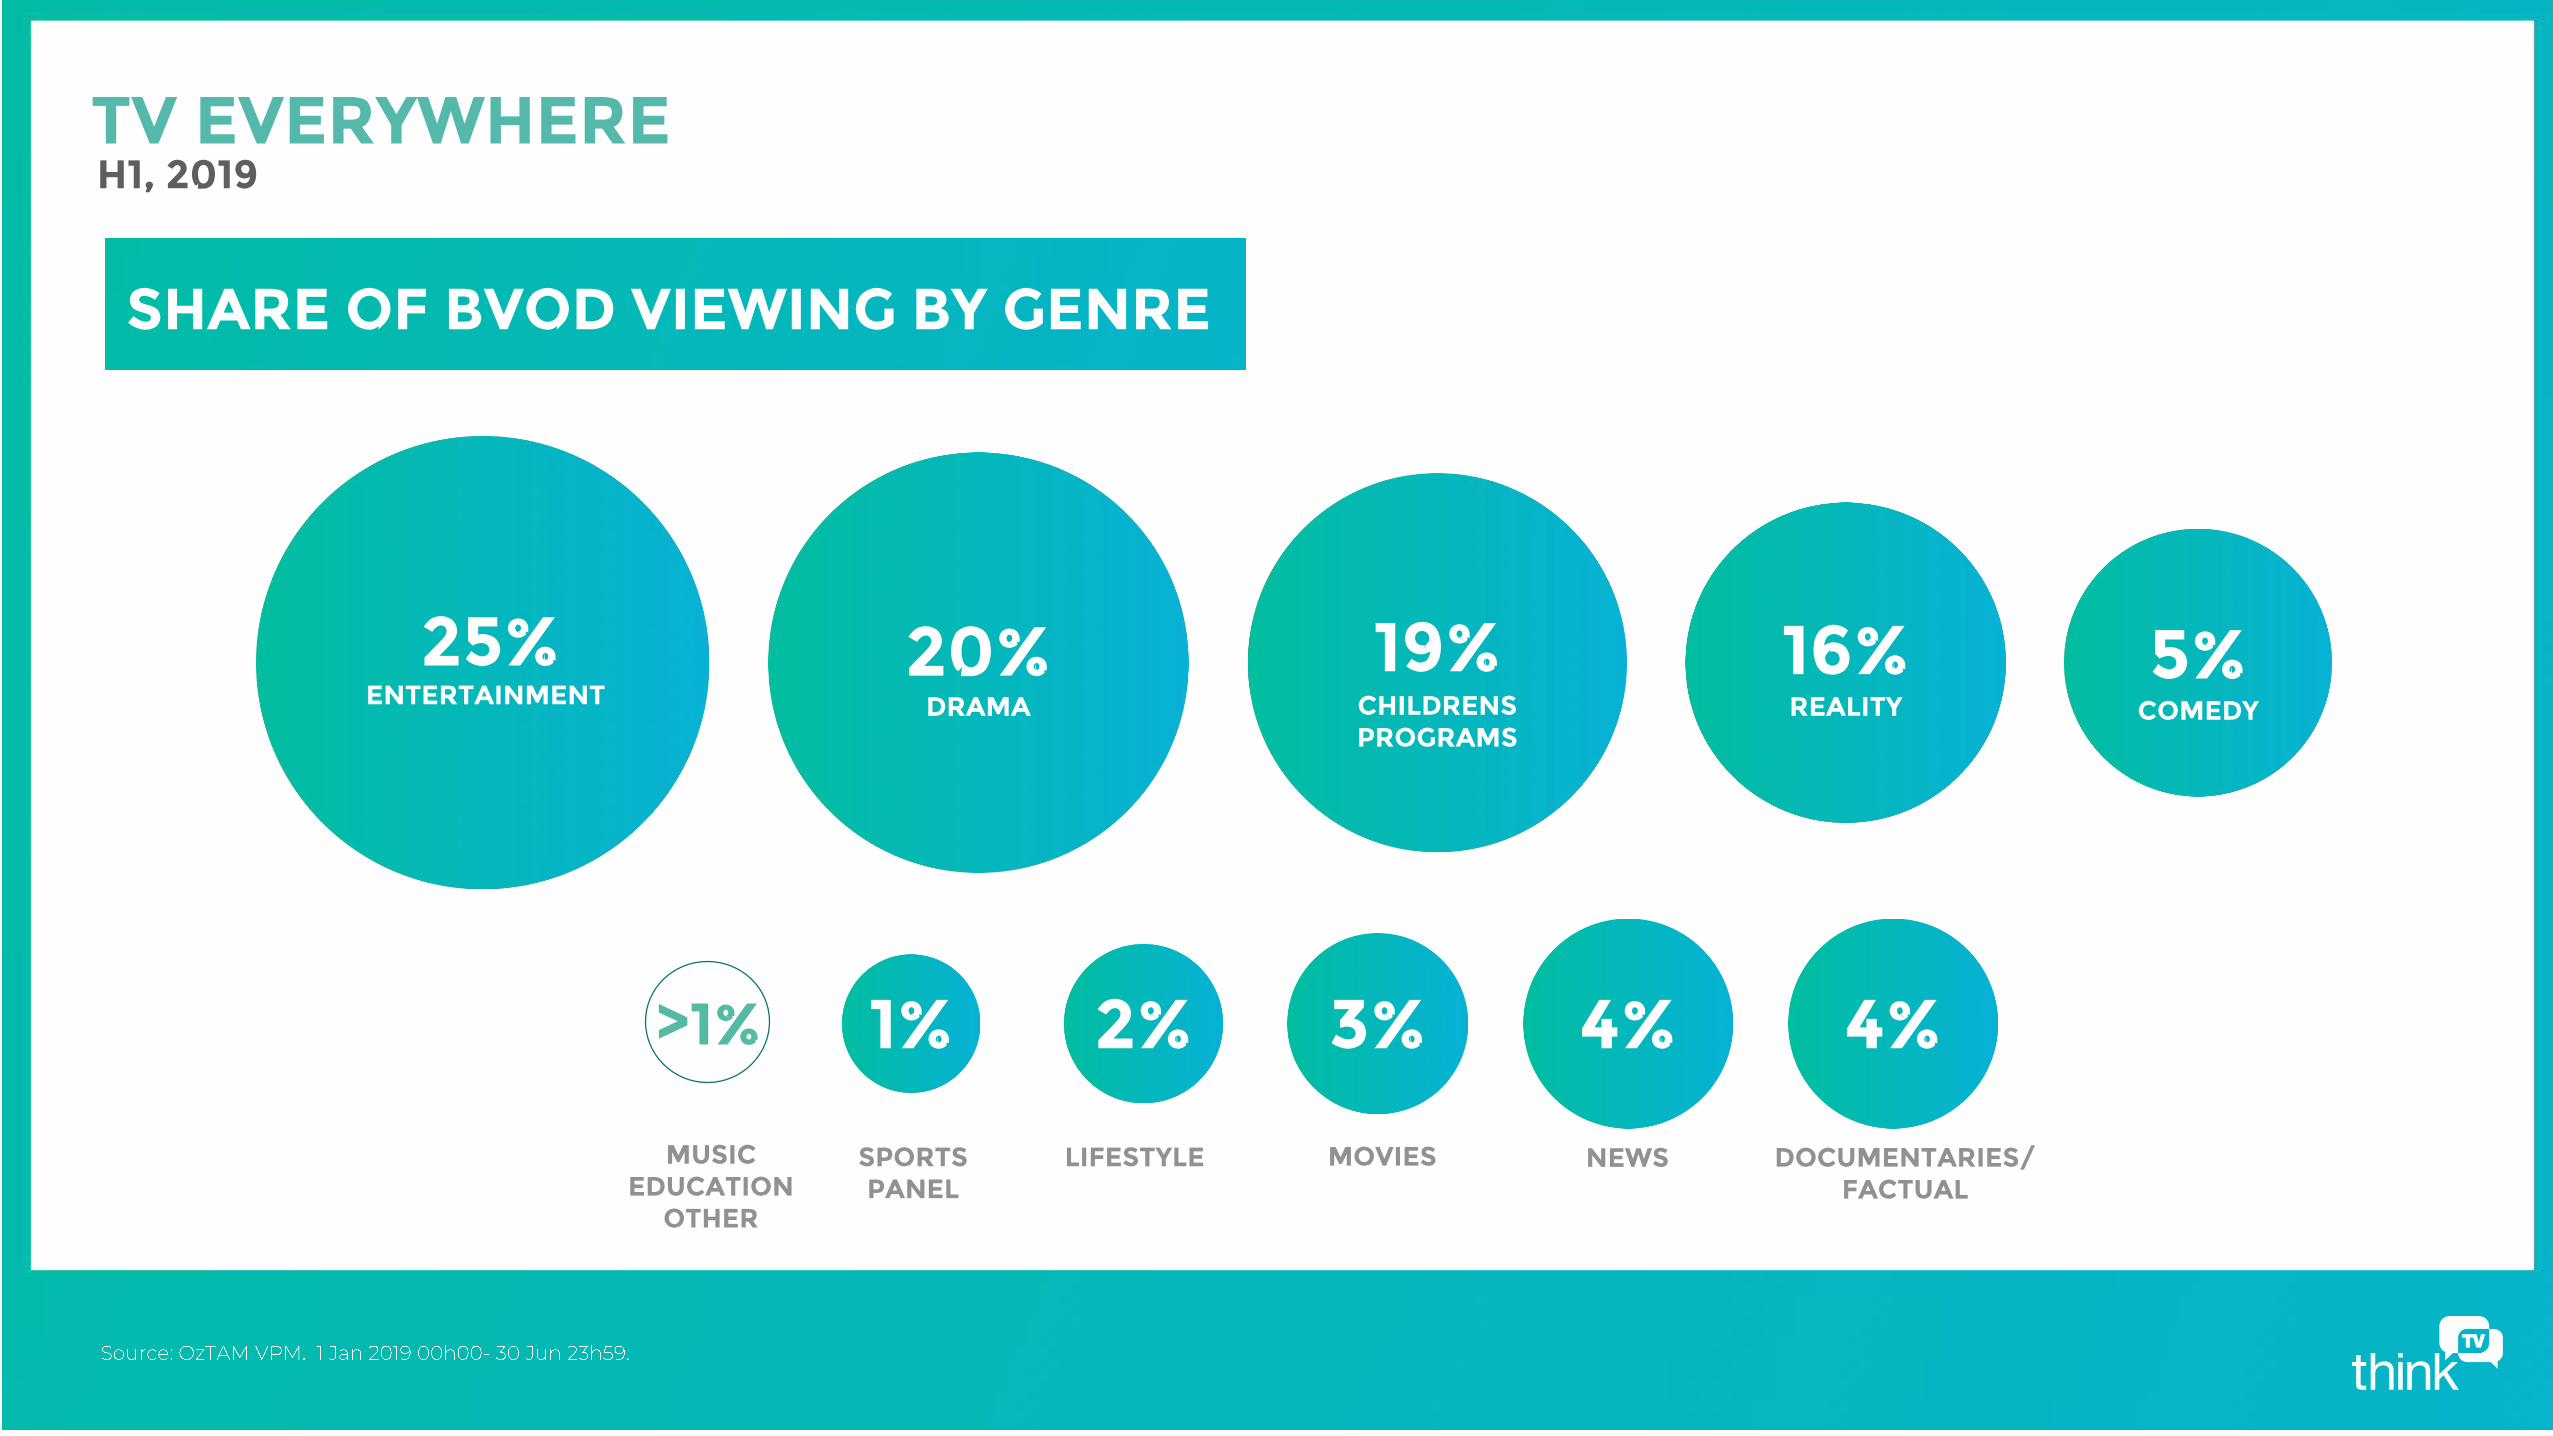
25%ENTERTAINMENT
20%DRAMA
19%CHILDRENSPROGRAMS
16%REALITY
5%COMEDY
4%3%2%1%>1%
SHARE OF BVOD VIEWING BY GENRE
4%
SPORTSPANEL
LIFESTYLE MOVIES NEWS DOCUMENTARIES/FACTUAL
MUSICEDUCATION
OTHER
TV EVERYWHERE
H1, 2019
'-
350,000
700,000
1,050,000
1,400,000
1.0
0
2.0
0
3.0
0
4.0
0
5.0
0
6.0
0
7.0
0
8.0
0
9.0
0
10
.00
11.
00
12.
00
13.
00
14.
00
15.
00
16
.00
17.
00
18
.00
19
.00
20
.00
21.
00
22.
00
23.
00
24.
00
Tota
l ho
urs
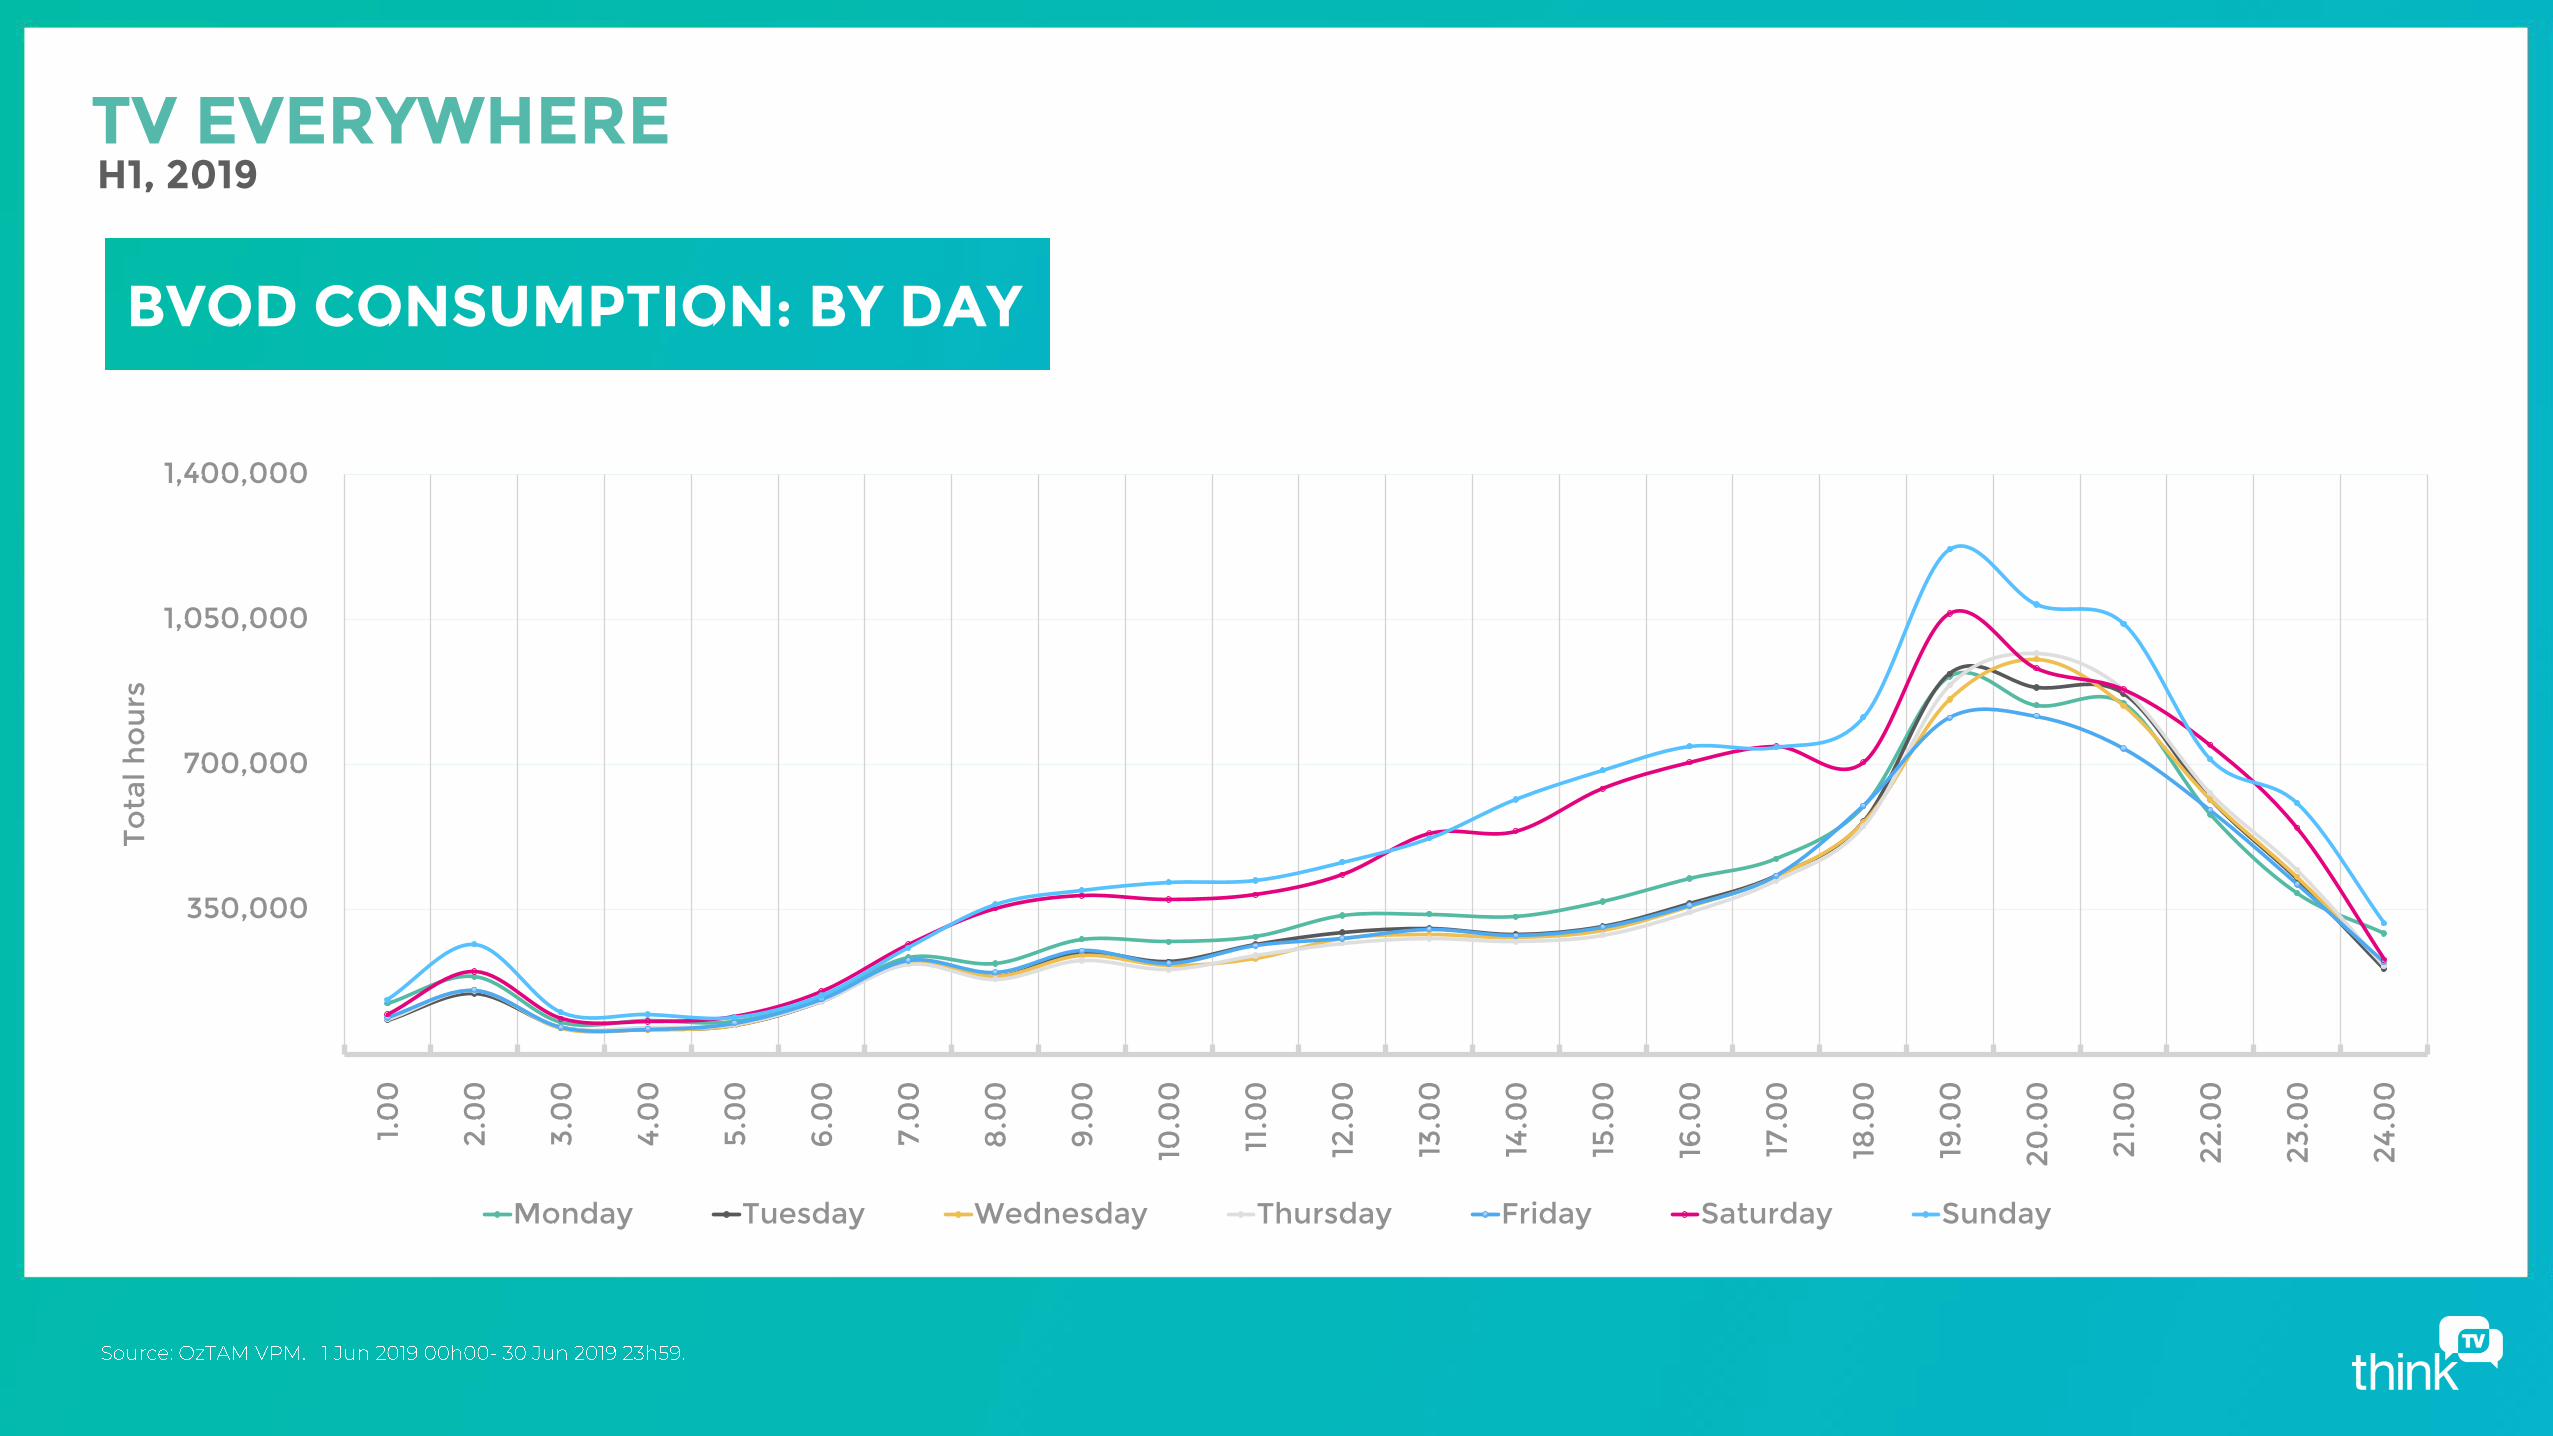
Monday Tuesday Wednesday Thursday Friday Saturday Sunday
BVOD CONSUMPTION: BY DAY
TV EVERYWHERE
H1, 2019
'-
1,000,000
2,000,000
3,000,000
4,000,000
1.0
0
2.0
0
3.0
0
4.0
0
5.0
0
6.0
0
7.0
0
8.0
0
9.0
0
10
.00
11.
00
12.
00
13.
00
14.
00
15.
00
16
.00
17.
00
18
.00
19
.00
20
.00
21.
00
22.
00
23.
00
24.
00
Tota
l ho
urs
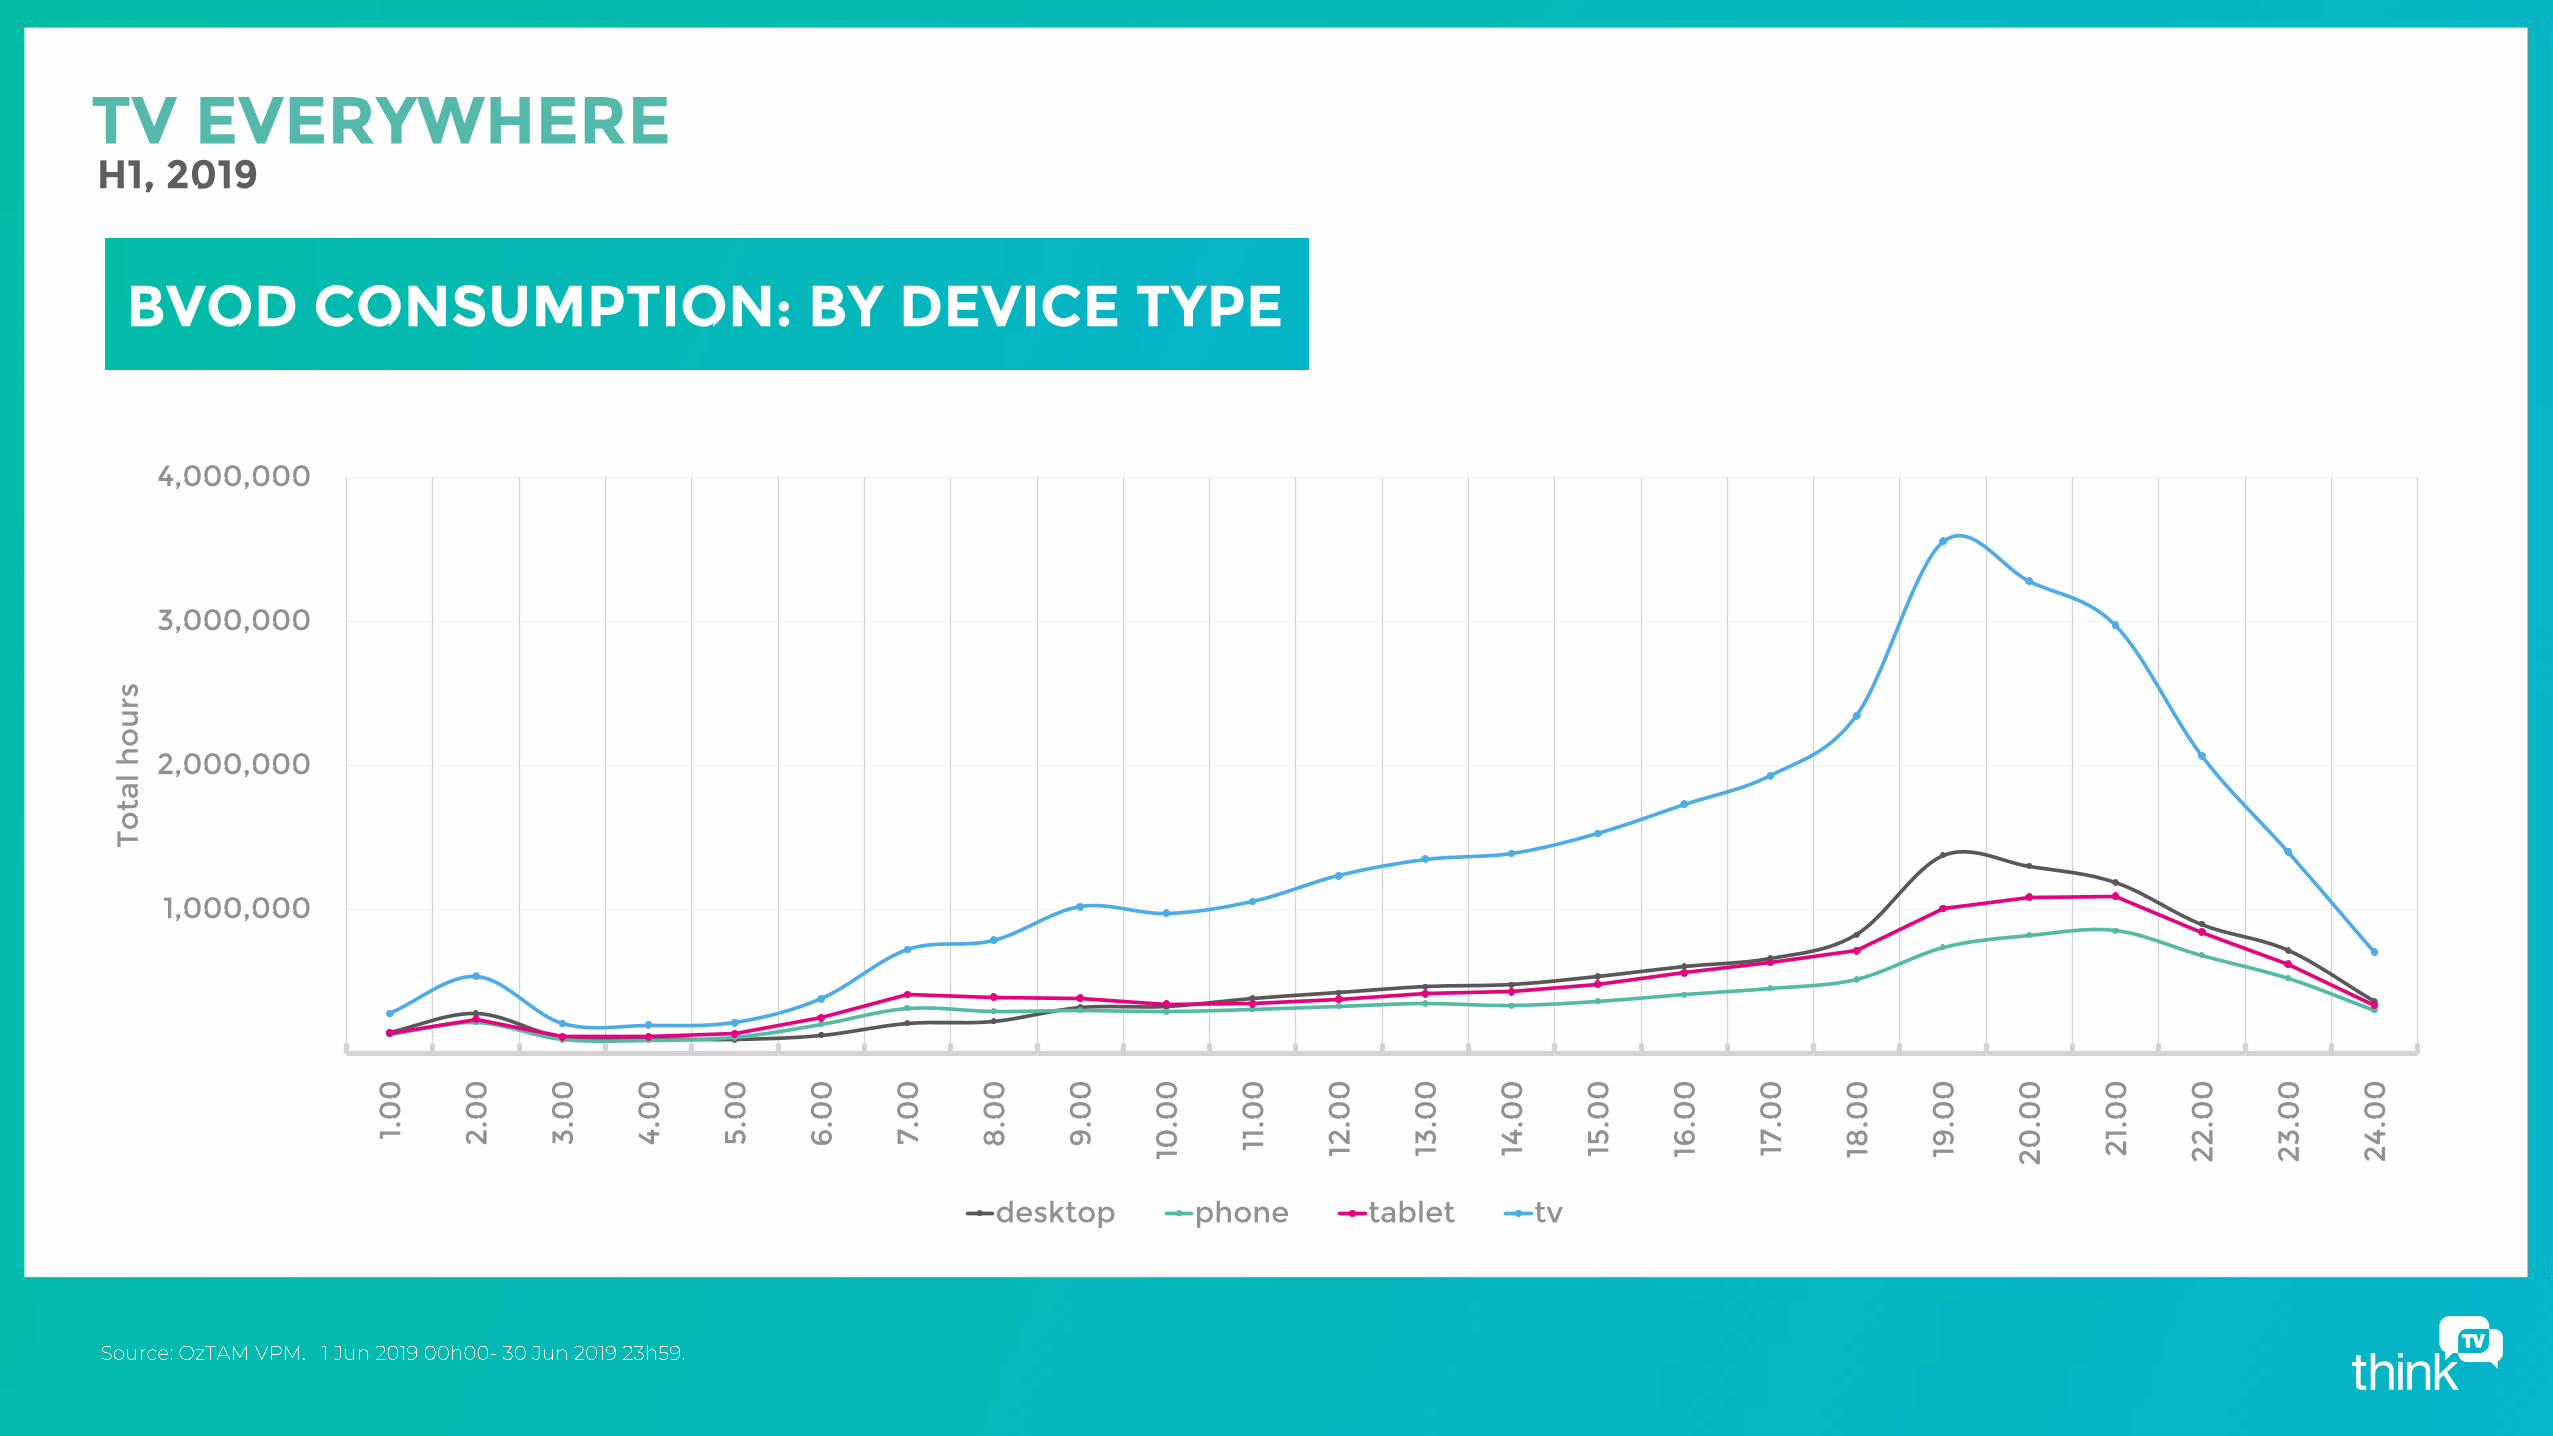
desktop phone tablet tv
BVOD CONSUMPTION: BY DEVICE TYPE
TV EVERYWHERE

For more information contact us [email protected]