TUV SUD South Asia Pvt. Ltd. - main.trai.gov.in · + Postpaid) Subscribers / BTS Idea GSM 1800 3485...
43
TUV SUD South Asia Pvt. Ltd. Mumbai City Independent Drive Test Report
Transcript of TUV SUD South Asia Pvt. Ltd. - main.trai.gov.in · + Postpaid) Subscribers / BTS Idea GSM 1800 3485...
TUV SUD South Asia Pvt. Ltd. Mumbai City Independent Drive Test Report

TUV SUD South Asia Pvt. Ltd.
Page 2 of 43
Table of Contents 1 Executive Summary .................................................................................................................................... 4
2 Benchmarking Test Overview .................................................................................................................... 5
2.1 Benchmarking Operators .................................................................................................................... 5
2.2 Drive Test Route .................................................................................................................................. 6
2.3 Benchmarking KPI Details ................................................................................................................... 7
2.4 Key Observation ................................................................................................................................ 10
3 Detail Result ............................................................................................................................................. 11
3.1 Voice Benchmarking ......................................................................................................................... 11
3.1.1 Coverage Rate ................................................................................................................................ 11
Coverage Plot .............................................................................................................................................. 13
Airtel Rx Level Plot .................................................................................................................................. 13
Idea Rx Level Plot .................................................................................................................................... 14
Vodafone Rx Level Plot ........................................................................................................................... 15
Reliance Rx Level Plot ............................................................................................................................. 16
Tata (GSM) Rx Level Plot ......................................................................................................................... 17
Aircel Rx Level Plot .................................................................................................................................. 18
3.1.2 Accessibility .................................................................................................................................... 19
3.1.3 Retainability ................................................................................................................................... 22
3.1.4 Mobility .......................................................................................................................................... 25
3.1.5 Rx Quality ....................................................................................................................................... 27
QUALITY PLOT ......................................................................................................................................... 28
Airtel Rx Quality Plot ............................................................................................................................... 28
Idea Rx Quality Plot ................................................................................................................................. 29
Vodafone Rx Quality Plot ........................................................................................................................ 30
Reliance Rx Quality Plot .......................................................................................................................... 31
Tata (GSM) Rx Quality Plot ...................................................................................................................... 32
Aircel Rx Quality Plot ............................................................................................................................... 33
3.1.6 Carrier over Interference (C/I) ....................................................................................................... 34
C/I PLOT ................................................................................................................................................... 35
Airtel C/I Plot ........................................................................................................................................... 35
Idea C/I Plot ............................................................................................................................................. 36

TUV SUD South Asia Pvt. Ltd.
Page 3 of 43
Vodafone C/I Plot .................................................................................................................................... 37
Reliance C/I Plot ...................................................................................................................................... 38
Tata (GSM) C/I Plot ................................................................................................................................. 39
Aircel C/I Plot .......................................................................................................................................... 40
4 Troublesome / Problematic Areas: .......................................................................................................... 41
5 Overall Operator Analysis ........................................................................................................................ 43

TUV SUD South Asia Pvt. Ltd.
1 Executive Summary
Target Network: Idea,Airtel,Vodafone
Table 1.1 CITY DEMOGRAPHICS
Mumbai Circle
Population
Area
Population Density
Mumbai City Map is shown as below
Table 1.2 Mumbai City Map1
1http://maps.google.co.in
Vodafone,Reliance (GSM),Aircel,Tata(GSM)
Details
14,350,000
603 Square Km
29,650 People per Square Km
as below
Page 4 of 43

TUV SUD South Asia Pvt. Ltd.
Page 5 of 43
2 Benchmarking Test Overview
2.1 Benchmarking Operators
The objective was to develop a holistic view of any competitive advantage or disadvantage of competing
wireless operators in the area. For purpose of these tests, only 2G BTS were covered.
Total six Operators were benchmarked which is shown as below:
BENCHMARKING OPERATOR TABLE
Operator Technology Band (MHz) BTS Count Subscribers* (Prepaid
+ Postpaid)
Subscribers / BTS
Idea GSM 1800 3485 4771764
1369
Airtel GSM 900 & 1800 4034 4014057
995
Vodafone GSM 900 & 1800 4512 8620251
1911
Reliance (GSM) GSM 1800 2178 2814521
1292
Aircel GSM 1800 1829 2830137
1547
Tata(GSM) GSM 1800 2886 2428169
841
*Subscribers data of Mumbai circle in 31 March 2015 taken from CSD audit.

TUV SUD South Asia Pvt. Ltd.
2.2 Drive Test Route
In the following figure, the green route
is approximately 300 km over a period of 2
out from 09.00 hrs to 1930 hrs on 23
operators.
Drive Test Route
Area Covered
• Navy Nagar Colaba • Malad E
• Nariman Point • Malad
• Peddar Road • Charkop
• Peragon center • Mira
• Malabar Hill • AG
• TJ Eastern Highway • Dahisar
• ChurchgateArea • Malvani
• Dadar MarineLine Road • Chinchpoli
Malabar Hill
Peddar Road
Navy Nagar
route depicts the associated drive route. The total drive ro
km over a period of 2 days per operator using a vehicle. The drive test was carried
23th
to 24 June 2015. In all about 3305 calls were made for all 6
Malad East • Andheri
Malad West • BPCL Colony
Charkop • Mahul
Mira-Bhayandra Road • Ghatkopar
AG Nagar • Matunga
Dahisar • Sion
Malvani • Juhu
Chinchpoli • W E Highway
• Khar
Drive test route of Mumbai
Ghatkopar
Govandi Station Rd
Page 6 of 43
depicts the associated drive route. The total drive route covered
using a vehicle. The drive test was carried
were made for all 6
• Lokhandwala
• Matunga BKC
• Shivaji Nagar
• Sakinaka
• Mankhurd
• Govandi Station
• Punam Nagar
• JVLR Road
• Neelam Nagar
Drive test route of Mumbai
Govandi Station Rd

TUV SUD South Asia Pvt. Ltd.
Page 7 of 43
2.3 Benchmarking KPI Details
Benchmarking KPI details table
KPI Idea Airtel Vodafone RelianceCommunication
(GSM) Aircel
Tata
(GSM)
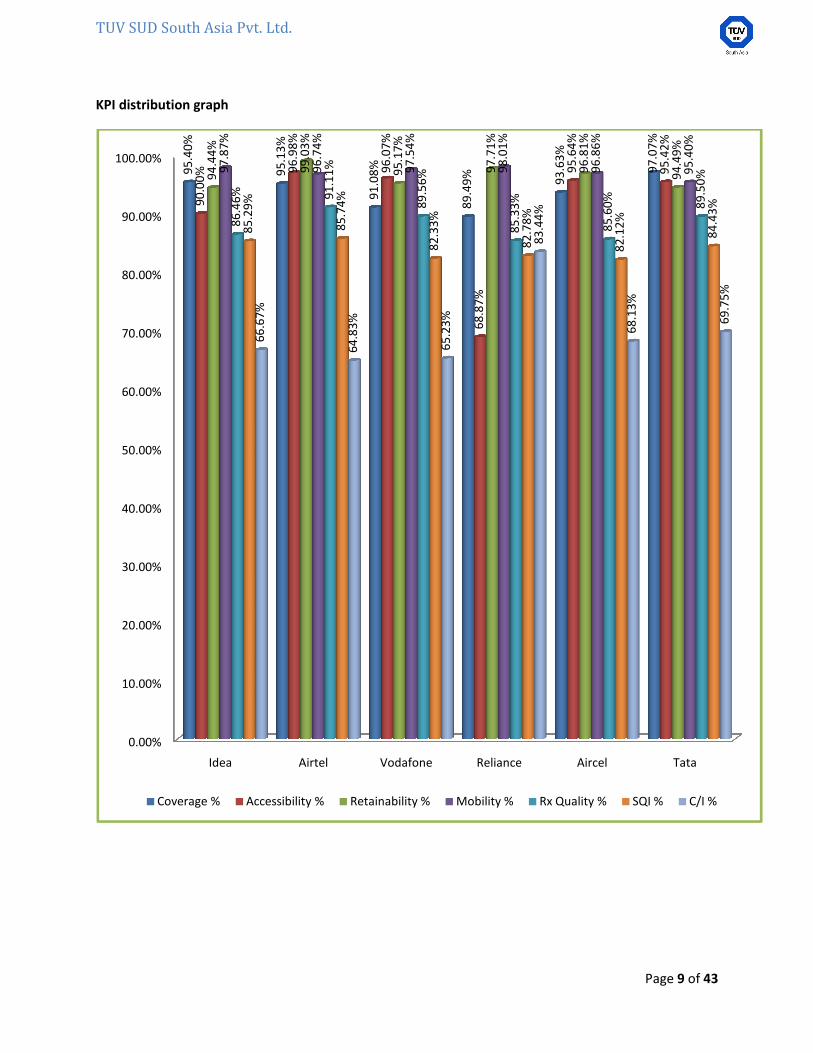
Coverage % 95.40% 95.13% 91.08% 89.49% 93.63% 97.07%
Accessibility % 90.00% 96.98% 96.07% 68.87% 95.64% 95.42%
Retainability % 94.44% 99.03% 95.17% 97.71% 96.81% 94.49%
Mobility % 97.87% 96.74% 97.54% 98.01% 96.86% 95.40%
Rx Quality % 86.46% 91.11% 89.56% 85.33% 85.60% 89.50%
C/I % 66.67% 64.83% 65.23% 83.44% 68.13% 69.75%
RF Coverage
RF Coverage relates to the geographical footprint within the system that has sufficient RF signal
strength to provide for a call/data session. The Coverage rate of an operator is calculated basis of % of
samples in which the Rx level is better than -85 dbm.
Accessibility
Accessibility is the ability of a service to be obtained within specific tolerances and other given
conditions, whenrequested by the user. In other words, the ability of a user to obtain the requested
service from the system.Accessibility is monitored by measuring Call Setup Success Rate (CSSR)
which is defined as the ratio of Established Calls to Call Attempts.
Retainability
Retainability is “The ability of a service, once obtained, to continue to be provided under given
conditions for a requested duration.” For determining the Retainabiltythe regulation prescribes three
important parameters namely Call drop rate (CDR), Worst affected Cells having more than 3% TCH drop
and Connection with good voice quality. The call drop and Connection with good voice quality were
monitored by the drive test.

TUV SUD South Asia Pvt. Ltd.
Page 8 of 43
Mobility
In a cellular system a base station has only a limited coverage area. Hence it is possible for a moving
subscriber to be out of range of a base station while making a call. The process by which a mobile
telephone call is transferred from one base station to another as the subscriber passes the boundary of
a cell is called a handover. The Handover success rate (HOSR) more than 95% is considered to be good.
Rx Quality
For measuring voice quality, Rx Qual samples on a scale from 0 to 7 for GSM operators and Frame Error
Rate (FERs) for CDMA service providers are measured. As per the QoS norms, Rx Qual between 0- 5 for
GSM operators and between 0-4% FER value for CDMA operators FERs is considered to be good, where
as Rx Qual beyond this benchmark is considered to be bad.
Carrier over Interference (C/I)
The carrier-over-interference ratio is the ratio between the levels of the signal strength of the current
serving cell to that of the signal strength of undesired (interfering) signal components. The C/I should be
more than 9 dbi.ebetween samples 15 to 30 are considered good.
TUV SUD South Asia Pvt. Ltd.
KPI distribution graph
0.00%
10.00%
20.00%
30.00%
40.00%
50.00%
60.00%
70.00%
80.00%
90.00%
100.00%
Idea Airtel
95
.40
%
95
.13
%
90
.00
% 96
.98
%
94
.44
%
99
.03
%
97
.87
%8
6.4
6%
85
.29
%6
6.6
7%
Coverage % Accessibility %
Airtel Vodafone Reliance Aircel
91
.08
%
89
.49
%
93
.63
%
96
.07
%
68
.87
%
95
.64
%
99
.03
%
95
.17
%
97
.71
%
96
.81
%
96
.74
%
97
.54
%
98
.01
%
96
.86
%
91
.11
%
89
.56
%
85
.33
%
85
.60
%
85
.74
%
82
.33
%
82
.78
%
64
.83
%
65
.23
%
83
.44
%
Accessibility % Retainability % Mobility % Rx Quality %
Page 9 of 43
Tata
97
.07
%9
5.4
2%
94
.49
%9
5.4
0%
85
.60
%
89
.50
%
82
.12
%
84
.43
%
68
.13
%
69
.75
%
SQI % C/I %

TUV SUD South Asia Pvt. Ltd.
Page 10 of 43
2.4 Key Observation
The overall performance of all operators is mentioned in the table. Over 500+ calls were made per
operator during the data collection period with more than 300 Km drive test covered.
We can explain the network condition in terms of coverage, quality, accessibility, retainability, speech
quality Index and Carrier over Interference ratioof the various service providers on the basis of the
values obtained. The TSPs are also relatively ranked accordingly and tabulated below:
Key observation table (RELATIVE RANKING)
OPERATOR Coverage Rate CSSR2 CCSR Rx Quality C/I
Idea 2 6 5 4 4
Airtel 3 1 1 1 6
Vodafone 4 4 2 2 5
Reliance (GSM) 6 2 6 6 1
Aircel 5 3 3 5 3
Tata (GSM) 1 5 4 3 2
2 CSSR-Call setup Success Rate, CCSR-Call Completion Success Rate, SQI-Speech Quality Index & C/I – Carrier over
Interference

TUV SUD South Asia Pvt. Ltd.
3 Detail Result
3.1 Voice Benchmarking
3.1.1 Coverage Rate
Coverage Rate Summary
RF Coverage relates to the geographical footprint within the system that has sufficient RF signal strength
to provide for a call/data session. The Coverage rate of an operator is calculated basis of % of sampl
which the Rx level is better than -85 dbm
% for Reliance GSM. The details are as follows
Table 3.1 Coverage Summary and Ranking
Operator
Idea
Airtel
Vodafone
Reliance (GSM)
Aircel
Tata(GSM)
Coverage Rate Details Graph
0.00%
10.00%
20.00%
30.00%
40.00%
50.00%
60.00%
70.00%
80.00%
90.00%
100.00%
Idea Airtel
76
.69
%
72
.45
%
95
.40
%
95
.13
%
99
.98
%
10
0.0
0%
0 to -75dBm
the geographical footprint within the system that has sufficient RF signal strength
The Coverage rate of an operator is calculated basis of % of sampl
85 dbm. The coverage rate varies from 97.07% for Tata GSM to 89.49
% for Reliance GSM. The details are as follows
.1 Coverage Summary and Ranking
Coverage Rate Ranking
95.40%
95.13%
91.08%
89.49%
93.63%
97.07%
Airtel Vodafone Reliance Aircel
70
.73
%
63
.86
%
66
.22
%
81
.05
%95
.13
%
91
.08
%
89
.49
%
93
.63
%
99
.29
%
98
.90
%
98
.54
%
99
.60
%
10
0.0
0%
10
0.0
0%
10
0.0
0%
10
0.0
0%
0 to -85dBm 0 to -95dBm 0 to -110dBm
Page 11 of 43
the geographical footprint within the system that has sufficient RF signal strength
The Coverage rate of an operator is calculated basis of % of samples in
ries from 97.07% for Tata GSM to 89.49
Ranking
2
3
5
6
4
1
Tata
81
.05
% 97
.07
%
99
.76
%
10
0.0
0%

TUV SUD South Asia Pvt. Ltd.
Page 12 of 43
Table 3.2 Rx Level for operators
Operator Rx Level 0 to -
75dBm
Rx Level 0 to -
85dBm
Rx Level 0 to -
95dBm
Rx Level 0 to -
110dBm
Idea 76.69% 95.40% 99.98% 100.00%
Airtel 72.45% 95.13% 99.29% 100.00%
Vodafone 70.73% 91.08% 98.90% 100.00%
Reliance (GSM) 63.86% 89.49% 98.54% 100.00%
Aircel 66.22% 93.63% 99.60% 100.00%
Tata(GSM) 81.05% 97.07% 99.76% 100.00%

TUV SUD South Asia Pvt. Ltd.
Page 13 of 43
Coverage Plot
Airtel Rx Level Plot

TUV SUD South Asia Pvt. Ltd.
Page 14 of 43
IdeaRx Level Plot

TUV SUD South Asia Pvt. Ltd.
Page 15 of 43
Vodafone Rx Level Plot

TUV SUD South Asia Pvt. Ltd.
Page 16 of 43
Reliance Rx Level Plot

TUV SUD South Asia Pvt. Ltd.
Page 17 of 43
Tata(GSM) Rx Level Plot

TUV SUD South Asia Pvt. Ltd.
Page 18 of 43
Aircel Rx Level Plot

TUV SUD South Asia Pvt. Ltd.
Page 19 of 43
3.1.2 Accessibility
For determining the accessibility there are three important parameters to be monitored, namely
Call Setup Success Rate (CSSR), Standalone Dedicated Control Channel (SDCCH)/ Paging Channel and
Traffic Channel (TCH).
Call Set-up Success Rate (CSSR):
Call Setup Success Rate is defined as the ratio of Established Calls to Call Attempts. Established Calls
means the following events have happened in call setup:
i) Attempt is made
ii) The TCH is allocated and
iii) The call is routed to the outwards path of the concerned MSC.
Accessibility Summary
Accessibility is the ability of a service to be obtained within specific tolerances and other given
conditions, whenrequested by the user. In other words, the ability of a user to obtain the requested
service from the system.Accessibility is monitored by measuring Call Setup Success Rate (CSSR)
which is defined as the ratio of Established Calls to Call Attempts. The benchmark is 95%. The
performance of the operators varies from 96.98% (for airtel) to 68.87% (for Reliance). The details
are as follows:
Table 3.3 Accessibility Summary and Ranking
Operator Name Total Call
Attempt Call Block CSSR Ranking
Idea 570 57 90.00% 5
Airtel 529 16 96.98% 1
Vodafone 535 21 96.07% 2
Reliance (GSM) 575 179 68.87% 6
Aircel 550 24 95.64% 3
Tata (GSM) 546 25 95.42% 4

TUV SUD South Asia Pvt. Ltd.
CSSR & Block Call Rate Details Graph
Accessibility Details Graph
Operator Total Call
Attempt
Idea 570
Airtel 529
Vodafone 535
Reliance (GSM) 575
Aircel 550
Tata(GSM) 546
CSSR & Block Call Rate Statistics
0.00%
20.00%
40.00%
60.00%
80.00%
100.00%
Idea Airtel
90.00%96.98%
10.00%
CSSR & Block Call Rate Details Graph
Total Call
Success
Total Call
Block CSSR% Block Rate%
513 57 90.00% 10.00%
513 16 96.98% 3.02%
514 21 96.07% 3.93%
396 179 68.87% 31.13%
526 24 95.64% 4.36%
521 25 95.42% 4.58%
Airtel Vodafone Reliance Aircel Tata
96.98% 96.07%
68.87%
95.64% 95.42%
3.02% 3.93%
31.13%
4.36% 4.58%
CSSR BCR
Page 20 of 43
Block Rate%
10.00%
3.02%
3.93%
31.13%
4.36%
4.58%
Tata
95.42%
4.58%

TUV SUD South Asia Pvt. Ltd.
0
100
200
300
400
500
600
Idea Airtel
570
529513 513
57
16
Total Call Attempt
Vodafone Reliance Aircel
535
575550 546
514
396
526
16 21
179
24
Total Call Attempt Call Success Call Block
Page 21 of 43
Tata
546521
25

TUV SUD South Asia Pvt. Ltd.
Page 22 of 43
3.1.3 Retainability
Retainability is “The ability of a service, once obtained, to continue to be provided under given
conditions for a requested duration.” For determining the Retainabiltythe regulation prescribes three
important parameters namely Call drop rate (CDR), Worst affected Cells having more than 3% TCH drop
and Connection with good voice quality. The call drop and Connection with good voice quality were
monitored by the drive test.
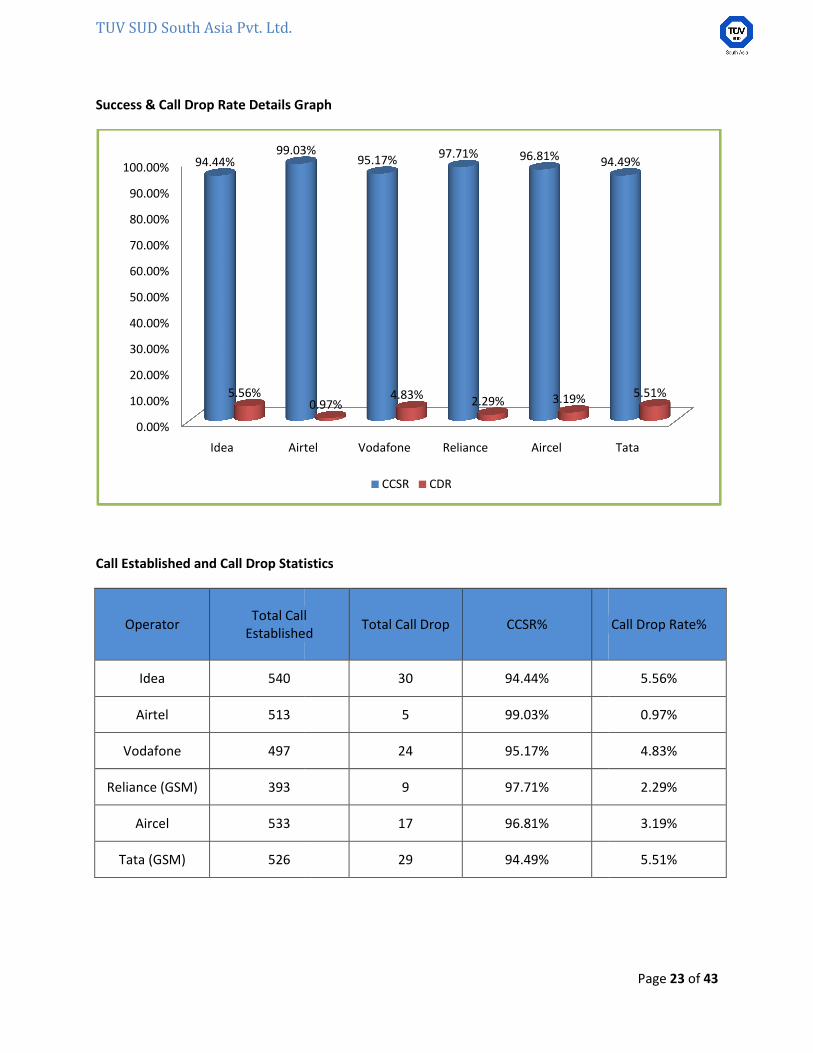
Call Drop Rate (CDR): The parameter gives a reliable measurement of the mobile network used by the
service provider for maintaining a call once it has been correctly established. The Call drop rate of TSPs
varies from 0.97% (Airtel) to 5.56%(Idea) as shown below:
Table 3.4Retainability Summary and Ranking
Operator Total Call
Established Total Call Drop
Retainability Ranking
CDR %
Idea 540 30 94.44% 6
Airtel 513 5 99.03% 1
Vodafone 497 24 95.17% 4
Reliance (GSM) 393 9 97.71% 2
Aircel 533 17 96.81% 3
Tata (GSM) 526 29 94.49% 5
TUV SUD South Asia Pvt. Ltd.
Success & Call Drop Rate Details Graph
Call Established and Call Drop Statistics
Operator Total Call
Established
Idea 540
Airtel 513
Vodafone 497
Reliance (GSM) 393
Aircel 533
Tata (GSM) 526
0.00%
10.00%
20.00%
30.00%
40.00%
50.00%
60.00%
70.00%
80.00%
90.00%
100.00%
Idea Airtel
94.44%99.03%
5.56%
Success & Call Drop Rate Details Graph
Call Established and Call Drop Statistics
Total Call
Established Total Call Drop CCSR%
30 94.44%
5 99.03%
24 95.17%
9 97.71%
17 96.81%
29 94.49%
Airtel Vodafone Reliance Aircel
99.03%95.17%
97.71% 96.81% 94.49%
0.97%4.83%
2.29% 3.19%
CCSR CDR
Page 23 of 43
Call Drop Rate%
5.56%
0.97%
4.83%
2.29%
3.19%
5.51%
Tata
94.49%
5.51%

TUV SUD South Asia Pvt. Ltd.
Success & Call Drop Rate Statistics
0
100
200
300
400
500
600
Idea Airtel
570
529540
513
30
Total Call Attempt
Vodafone Reliance Aircel
535
575
550
497
393
533
524
9 17
Total Call Attempt Call Established Call Drop
Page 24 of 43
Tata
546526
29

TUV SUD South Asia Pvt. Ltd.
3.1.4 Mobility
In a cellular system a base station
subscriber to get out of reach of a base station while making a call. The process by which a mobile
telephone call is transferred from one base station to another as the subscriber passes the boundary of
a cell is called a handover.
The Handover success rate (HOSR) more than 95% is considered to be good.
Mobility Summary
For detail KPI definition, please refer to table
Table 3.5 Mobility Summary and Ranking
Operator Total HO Attempt
Idea 984
Airtel 1258
Vodafone 1750
Reliance (GSM) 1004
Aircel 795
Tata(GSM) 1435
Success & Fail Handover Rate Details Graph
0.00%
10.00%
20.00%
30.00%
40.00%
50.00%
60.00%
70.00%
80.00%
90.00%
100.00%
Idea Airtel
97.87% 96.74%
2.13%
base station has only a limited coverage area. Hence it is possible for a moving
subscriber to get out of reach of a base station while making a call. The process by which a mobile
one call is transferred from one base station to another as the subscriber passes the boundary of
The Handover success rate (HOSR) more than 95% is considered to be good.
For detail KPI definition, please refer to table 3.5 Mobility.
Mobility Summary and Ranking
HO Attempt Total HO Success HO Success Rate
984 963 97.87%
1258 1217 96.74%
1750 1707 97.54%
1004 984 98.01%
795 770 96.86%
1435 1369 95.40%
Success & Fail Handover Rate Details Graph
Airtel Vodafone Reliance Aircel
96.74% 97.54% 98.01% 96.86% 95.40%
3.26% 2.46% 1.99% 3.14%
HO Success Rate HO Failure Rate
Page 25 of 43
has only a limited coverage area. Hence it is possible for a moving
subscriber to get out of reach of a base station while making a call. The process by which a mobile
one call is transferred from one base station to another as the subscriber passes the boundary of
HO Success Rate% Ranking
2
5
3
1
4
6
Tata
95.40%
4.60%

TUV SUD South Asia Pvt. Ltd.
Success & Fail Handover Rate Statistics
0
200
400
600
800
1000
1200
1400
1600
1800
Idea Airtel
98
4
12
58
96
3
12
17
97
.87
%
HO Attempt
Success & Fail Handover Rate Statistics
Vodafone Reliance Aircel
17
50
10
04
79
5
17
07
98
4
77
0
96
.74
%
97
.54
%
98
.01
%
96
.86
%
HO Attempt HO Success HO Success Rate
Page 26 of 43
Tata
14
35
13
69
95
.40
%

TUV SUD South Asia Pvt. Ltd.
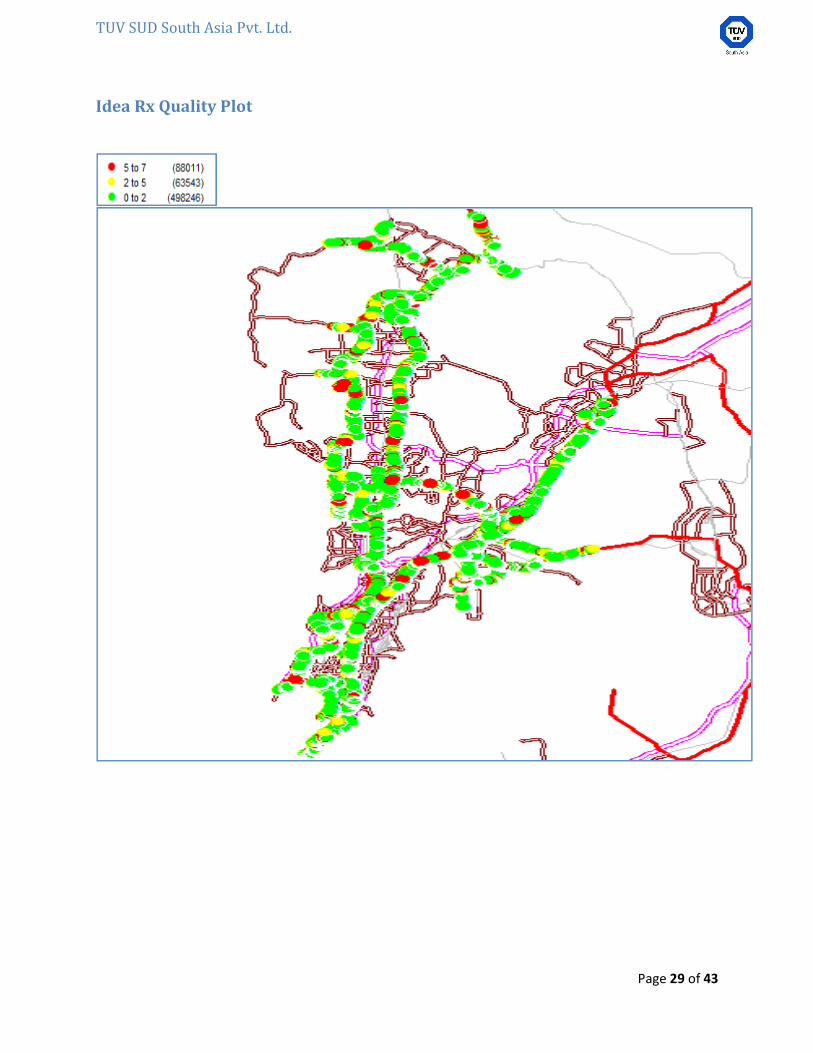
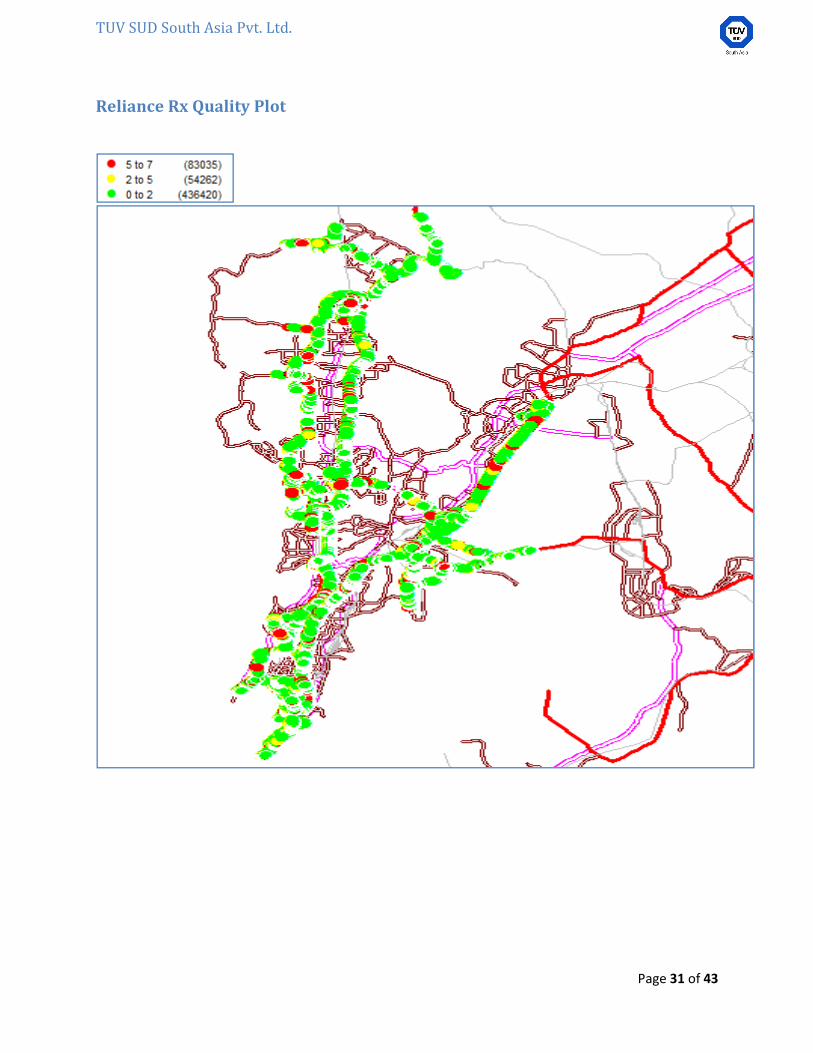
3.1.5 Rx Quality
For measuring voice quality, Rx Qual
Rate (FERs) for CDMA service providers are
GSM operators and between 0-4% FER value for CDMA operators FERs is considered to be g
as Rx Qual beyond this benchmark is considered to be bad
Rx Quality Summary
Please refer to table 3.6 Rx Quality.
Table 3.6 Rx Quality Summary and Ranking
Operator Rx Quality Samples
(0-
Idea 649800
Airtel 675609
Vodafone 600552
Reliance (GSM) 573717
Aircel 676587
Tata(GSM) 711097
Rx Quality Details Graph
0.00%
10.00%
20.00%
30.00%
40.00%
50.00%
60.00%
70.00%
80.00%
90.00%
100.00%
Idea Airtel
86
.46
%
91
.11
%
13
.54
%
Rx Quality Samples (0
For measuring voice quality, Rx Qual samples on a scale from 0 to 7 for GSM operators and Frame Error
for CDMA service providers are measured. As per the QoS norms, Rx Qual between 0
4% FER value for CDMA operators FERs is considered to be g
as Rx Qual beyond this benchmark is considered to be bad. The benchmark should usually be > 9
Rx Quality.
Rx Quality Summary and Ranking
Rx Quality Samples
-7)
Rx Quality
Samples (0-5)
Rx Quality
Samples (0-5)%
649800 561789 86.46%
675609 615556 91.11%
600552 537860 89.56%
573717 490682 85.53%
676587 579177 85.60%
711097 636451 89.50%
Airtel Vodafone Reliance Aircel Tata
89
.56
%
85
.53
%
85
.60
%
89
.50
%
8.8
9%
10
.44
%
14
.47
%
14
.40
%
Rx Quality Samples (0-5)% Rx Quality Samples (6-7)%
Page 27 of 43
samples on a scale from 0 to 7 for GSM operators and Frame Error
measured. As per the QoS norms, Rx Qual between 0- 5 for
4% FER value for CDMA operators FERs is considered to be good, where
The benchmark should usually be > 95%.
Ranking
4
1
2
6
5
3
Tata
89
.50
%
10
.50
%

TUV SUD South Asia Pvt. Ltd.
Page 28 of 43
QUALITY PLOT
Airtel Rx Quality Plot
TUV SUD South Asia Pvt. Ltd.
Page 29 of 43
Idea Rx Quality Plot

TUV SUD South Asia Pvt. Ltd.
Page 30 of 43
Vodafone Rx Quality Plot
TUV SUD South Asia Pvt. Ltd.
Page 31 of 43
Reliance Rx Quality Plot

TUV SUD South Asia Pvt. Ltd.
Page 32 of 43
Tata(GSM) Rx Quality Plot

TUV SUD South Asia Pvt. Ltd.
Page 33 of 43
Aircel Rx Quality Plot

TUV SUD South Asia Pvt. Ltd.
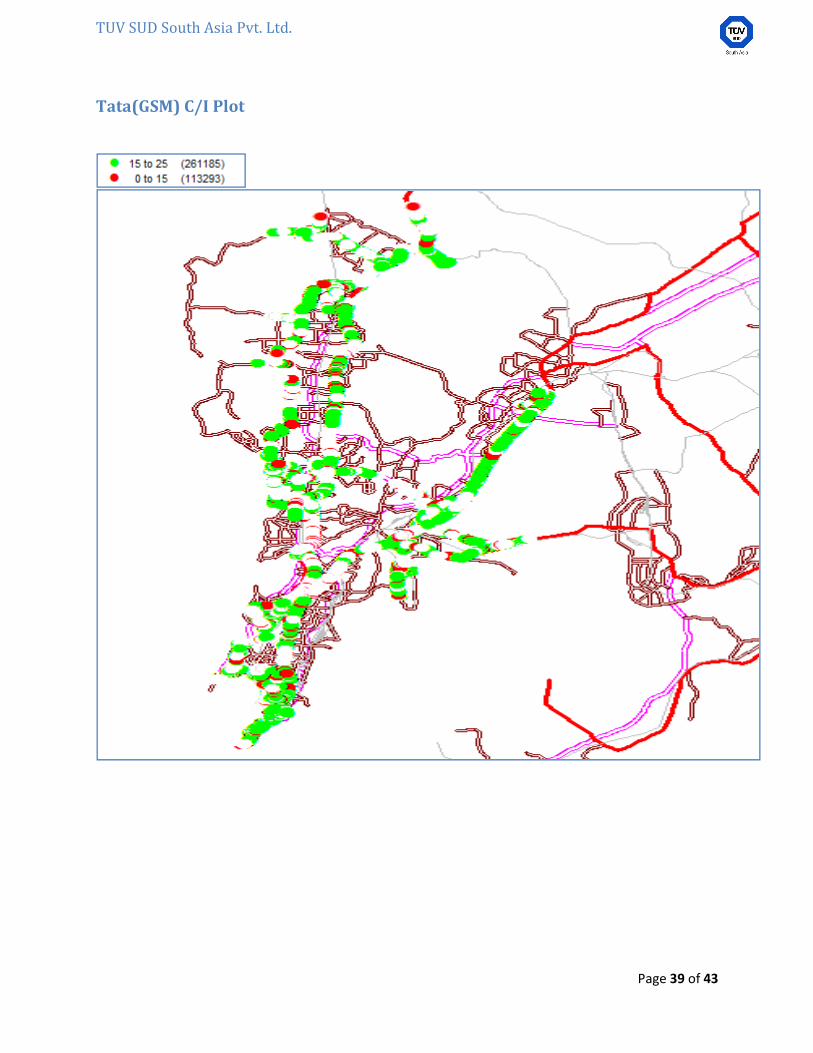
3.1.6 Carrier over Interference (C/I)
The carrier-over-interference ratio is the ratio between the levels of the signal strength of thecurrent
serving cell to that of the signal strength of undesired (interfering) signal components. The C/I should be more than 9 dbi.esampl
C/I Summary
Please refer to table 3.8for C/I Index.
Table 3.8 C/I and Ranking
Operator C/I Samples (15
30)
Idea 169890
Airtel 90960
Vodafone 105460
Reliance 410907
Aircel 244760
Tata 261185
C/I Index Details Graph
0.00%
10.00%
20.00%
30.00%
40.00%
50.00%
60.00%
70.00%
80.00%
90.00%
Idea Airtel
66
.67
%
64
.83
%
33
.33
%
C/I Samples (15
Interference (C/I)
interference ratio is the ratio between the levels of the signal strength of thecurrent
serving cell to that of the signal strength of undesired (interfering) signal components.
i.esamplesbetween 15 to 30 are considered good..
C/I Index.
C/I Samples (15-
C/I Total Samples C/I Samples %
169890 254836 66.67%
90960 140311 64.83%
105460 161680 65.23%
410907 492445 83.44%
244760 359261 68.13%
261185 374478 69.75%
Airtel Vodafone Reliance Aircel Tata
65
.23
%
83
.44
%
68
.13
%
69
.75
%
35
.17
%
34
.77
%
16
.56
%
31
.87
%
C/I Samples (15-30) C/I Samples (0-15)
Page 34 of 43
interference ratio is the ratio between the levels of the signal strength of thecurrent
serving cell to that of the signal strength of undesired (interfering) signal components.
Ranking
4
6
5
1
3
2
Tata
69
.75
%
30
.25
%

TUV SUD South Asia Pvt. Ltd.
Page 35 of 43
C/I PLOT
Airtel C/I Plot

TUV SUD South Asia Pvt. Ltd.
Page 36 of 43
Idea C/I Plot

TUV SUD South Asia Pvt. Ltd.
Page 37 of 43
Vodafone C/I Plot

TUV SUD South Asia Pvt. Ltd.
Page 38 of 43
Reliance C/I Plot
TUV SUD South Asia Pvt. Ltd.
Page 39 of 43
Tata(GSM) C/I Plot

TUV SUD South Asia Pvt. Ltd.
Page 40 of 43
Aircel C/I Plot

TUV SUD South Asia Pvt. Ltd.
Page 41 of 43
4 Troublesome / Problematic Areas:
Operator Area Name Observation
Airtel
Nariman Point Poor Rx Quality Observed at Nariman Point.
MalbarHil
Poor Rx Coverage and Rx Quality Observed at
MalibarHil Area. At Some Points in MalibarHil No
Network also found.
Matunga Poor Rx Quality Observed at Matunga.
ONGC Area Poor Rx Level Observed in ONGC Area.
Andheri Kurla Road Poor Rx Quality Observed at Andheri Kurla Road Due
to Interference.
Paragon Centre Poor Rx Quality Observed at Paragon Centre Due to
Interfrence.
Idea
Navy Nagar Poor Rx Quality Observed Near Navy Nagar.
Nariman Point Poor Rx Level and Rx Quality Observed at Nariman
Point.
MalbarHil Poor Rx Level Observed Near MalibarHil.
Church Gate Area Poor Rx Quality Observed Near Church Gate Area.
Lokhandwala Area Poor Rx Quality Observed Near Lokhandwala Area.
Juhu Poor Rx Quality Observed Near Juhu.
Malvani Poor Rx Quality Observed Near Malvani.
Mankhurd Link Road Poor Rx Quality Observed at Mankhurd Link Road.
Sion Poor Rx Quality Observed at Sion Due to Interference.
ONGC Area Poor Rx Level Observed in ONGC Area.
Vodafone
Ghatkoper Poor Rx Quality Observed at Ghatkoper Due to
Interference.
Paragon Centre Poor Rx Quality Observed at Paragon Center Due to
Interference.
MalbarHil Poor Rx Level Observed Near MalibarHil.
Nariman Point Poor Rx Quality Observed at Nariman Point.
Jung Marg Poor Rx Quality Observed at Jung Marg.
Khar Area Poor Rx Quality Observed Near Khar Area.
Juhu Poor Rx Quality Observed at Juhu.
Azad Nagar Juhu Poor Rx Quality Observed Near Azad Nagar Juhu.
Dahisar Poor Rx Quality Observed at Dahisar.
C Link Road Dahisar west Poor Rx Quality Observed at C Link Road Dahisar west.
Uttan Road Poor Rx Level Observed Near Uttan Road.
Mankhurd Link Road Poor Rx Quality Observed at Mankhurd Link Road .
ONGC Area Poor Rx Level Observed in ONGC Area.
Aircel
MalbarHil
Poor Rx Coverage and Rx Quality Observed at
MalibarHil Area. At Some Points In MalibarHil No
Network also found.
Paragon Centre Poor Rx Quality Observed at Paragon Centre Due to
Interference.
Nariman Point Poor Rx Quality Observed at Nariamn Point.
Jung Marg Poor Rx Quality Observed at Jung Marg.
TUV SUD South Asia Pvt. Ltd.
Page 42 of 43
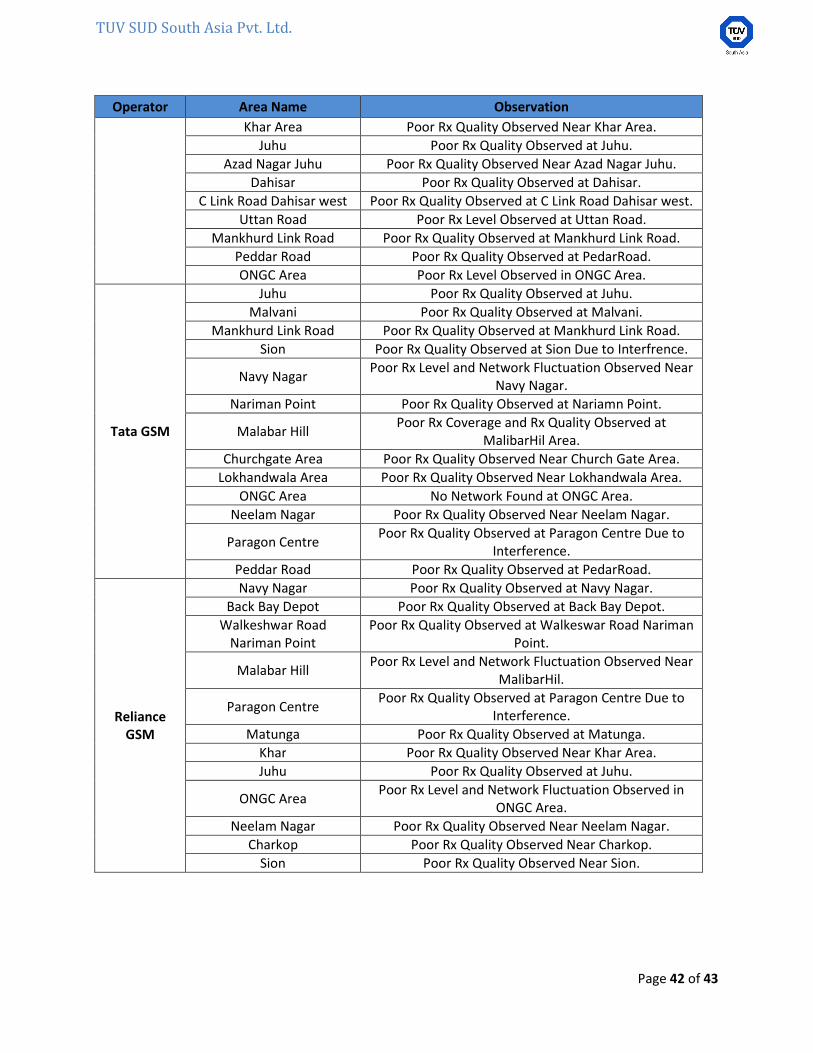
Operator Area Name Observation
Khar Area Poor Rx Quality Observed Near Khar Area.
Juhu Poor Rx Quality Observed at Juhu.
Azad Nagar Juhu Poor Rx Quality Observed Near Azad Nagar Juhu.
Dahisar Poor Rx Quality Observed at Dahisar.
C Link Road Dahisar west Poor Rx Quality Observed at C Link Road Dahisar west.
Uttan Road Poor Rx Level Observed at Uttan Road.
Mankhurd Link Road Poor Rx Quality Observed at Mankhurd Link Road.
Peddar Road Poor Rx Quality Observed at PedarRoad.
ONGC Area Poor Rx Level Observed in ONGC Area.
Tata GSM
Juhu Poor Rx Quality Observed at Juhu.
Malvani Poor Rx Quality Observed at Malvani.
Mankhurd Link Road Poor Rx Quality Observed at Mankhurd Link Road.
Sion Poor Rx Quality Observed at Sion Due to Interfrence.
Navy Nagar Poor Rx Level and Network Fluctuation Observed Near
Navy Nagar.
Nariman Point Poor Rx Quality Observed at Nariamn Point.
Malabar Hill Poor Rx Coverage and Rx Quality Observed at
MalibarHil Area.
Churchgate Area Poor Rx Quality Observed Near Church Gate Area.
Lokhandwala Area Poor Rx Quality Observed Near Lokhandwala Area.
ONGC Area No Network Found at ONGC Area.
Neelam Nagar Poor Rx Quality Observed Near Neelam Nagar.
Paragon Centre Poor Rx Quality Observed at Paragon Centre Due to
Interference.
Peddar Road Poor Rx Quality Observed at PedarRoad.
Reliance
GSM
Navy Nagar Poor Rx Quality Observed at Navy Nagar.
Back Bay Depot Poor Rx Quality Observed at Back Bay Depot.
Walkeshwar Road
Nariman Point
Poor Rx Quality Observed at Walkeswar Road Nariman
Point.
Malabar Hill Poor Rx Level and Network Fluctuation Observed Near
MalibarHil.
Paragon Centre Poor Rx Quality Observed at Paragon Centre Due to
Interference.
Matunga Poor Rx Quality Observed at Matunga.
Khar Poor Rx Quality Observed Near Khar Area.
Juhu Poor Rx Quality Observed at Juhu.
ONGC Area Poor Rx Level and Network Fluctuation Observed in
ONGC Area.
Neelam Nagar Poor Rx Quality Observed Near Neelam Nagar.
Charkop Poor Rx Quality Observed Near Charkop.
Sion Poor Rx Quality Observed Near Sion.

TUV SUD South Asia Pvt. Ltd.
Page 43 of 43
5Overall Operator Analysis
KPI Idea Airtel Vodafone Reliance
(GSM) Aircel
Tata
(GSM)
Call Attempt 570 529 535 575 550 546
Blocked Call Rate 10.00% 3.02% 3.93% 31.13% 4.36% 4.58%
Call Setup Success Rate
(>=95%) 90.00% 96.98% 96.07% 68.88% 95.64% 95.425
Dropped Call Rate
(<=2%) 5.56% 0.97% 4.83% 2.29% 3.19% 5.51%
Rx Quality (0-5) (>=95%) 86.46% 91.11% 89.56% 85.53% 85.60% 89.50%
Handover Success Rate
(>=95%) 97.87% 96.74% 97.54% 98.01% 96.86% 95.40%
Analysis: Independent Drive Test was conducted by TUV SUD on behave of TRAI for Idea, Airtel,Vodafone,
Reliance (GSM),Aircel&Tata(GSM) in North Mumbai,South Mumbai, and Central Mumbai covering
locations suggested by TRAI.
The Drive Test results revealed that the most of the operators were failed to meet benchmarks of
network related parameters. They failed to achieve benchmark due to High Block Call Rate, High Drop
Call Rate, Low Call Setup Success Rate & Rx Quality Samples. However, the Voice Quality observed was
not satisfactory in some Part of North, South and Central Mumbai as shown in respective plots.