Tutorial Review Electrochemical analysis of clinical blood ...
30
Tutorial Review Electrochemical analysis of clinical blood-gases, gases and vapours C. E. W. Hahn Nuffield Department of Anaesthetics, University of Oxford, Radcliffe Infirmary, Woodstock Road, Oxford, UK OX2 6HE This tutorial review charts the development of electrochemical sensors for the analysis of blood-gases, gases and vapours in clinical medicine over the past four decades. The development of each sensor is set in its historical and clinical context, and the first part of the review concentrates on aqueous electrolyte electrochemistry and on those sensors which have made a major impact on the clinical measurement of the partial pressures of oxygen and carbon dioxide in the blood. The electrochemical interference effects of anaesthetic agents on these measurements are also described. Those electrochemical sensors which have failed, in the past, to make a clear impact in this area are not considered, but the few attempts to devise aqueous electrolyte electrochemical sensors for anaesthetic agent measurement are reviewed. The second part of the review describes the chequered history of the development of non-aqueous solvent electrochemical sensors to measure the partial pressures of oxygen and carbon dioxide, in both the presence and absence of each other, in the gas phase. The last part of the review examines various attempts, using non-aqueous solvent electrochemistry, to measure the concentration of inhalational anaesthetic vapours in the gas phase. These sensors have yet to make an impact on clinical practice. Throughout this tutorial review, theoretical models of membrane-covered electrochemical sensors are described where appropriate. This review represents a personal view of the development of electrochemical sensors for clinical measurement, and it is therefore necessarily selective in its approach and emphasis. Keywords: Review; clinical medicine; blood-gases; gases; vapours; electrochemical sensors Clive Hahn is Professor of Anaesthetic Science in the Nuffield Department of Anaesthetics at the University of Oxford, and is a Consultant in Clinical Measurement in the Oxford Radcliffe Hospital NHS Trust. He trained in Manchester, Sheffield and Oxford. He originally took up NHS posts in the Oxford United Hospitals, before becoming a University Lecturer in Anaesthetics and then gaining his pre- sent appointments. His major research interest, over many years, has been in the field of cardiopulmonary gas exchange in the sick and healthy lung. In common with others in the Biological and Medical Sciences, his interest in molecular sensors grew out of the frustration of not being able to measure gases of clinical interest with any degree of certainty or precision, especially when anaesthetic gases and vapours were present. He is the author of numerous articles on cardio-respiratory gas exchange, clinical measurement and blood-gas analysis. He is also the British Medical Journal Books Series Editor for their ‘Principles and Practice’ series of books on Clinical Measurement. Introduction The massive contribution made by chemists to the development and understanding of blood-gas and acid-base balance over the past centuries is chronicalled in the book The History of Blood- Gases, Acids and Bases by Poul Astrup and John Severinghaus 1 and in their historical essays on blood-gas analysis. 2–6 The list is long and very distinguished but, right up to the 1950s, much of this basic research and development work remained confined to chemistry, biochemistry and physiology laboratories. Fur- thermore, despite the fact that dissolved gases had been extracted from blood by vacuum techniques for more than 300 years, with their identity known for 200 years and their contents having been measured for more than 150 years, these blood-gas content measurements had contributed relatively little to patient care over this period of time. 5 However, a succession of external ‘forcing’ factors have contributed, over the past 60 years, to the increasing utilisation of blood-gas measurements in the treatment and care of patients and to the concomitant development of modern blood-gas electrochemical analysis techniques. First, physiological re- search into high altitude acclimatisation, deep sea diving and aviation medicine began to burgeon during World War II, and the limitations of the classical volumetric analysis of gases dissolved in blood (i.e., the blood-gases) became so apparent that respiratory physiologists and clinicians began to seek other ways of making these measurements. (The chemical analyses of anaesthetic gases and vapours were to follow some decades later.) Following this initial war interest, two unconnected events, both in the 1950s, led to the rapid development of modern electrochemical sensors for measuring blood-gases and, amazingly, these early electrochemical devices were so good that they have remained relatively unchanged over the succeed- ing four decades. The first event, the massive poliomyelitis (polio) epidemic that struck both Copenhagen and the USA in 1952, focused the minds of chemists, physiologists and clinicians very sharply. Polio was a very important disease which consumed the resources of many hospital departments, and this disease led directly to the development of intensive care units, modern Analyst, June 1998, Vol. 123 (57R–86R) 57R
Transcript of Tutorial Review Electrochemical analysis of clinical blood ...

Tutorial Review
Electrochemical analysis of clinicalblood-gases, gases and vapours
C. E. W. HahnNuffield Department of Anaesthetics, University of Oxford, Radcliffe Infirmary, Woodstock Road,Oxford, UK OX2 6HE
This tutorial review charts the development ofelectrochemical sensors for the analysis of blood-gases,gases and vapours in clinical medicine over the past fourdecades. The development of each sensor is set in itshistorical and clinical context, and the first part of thereview concentrates on aqueous electrolyteelectrochemistry and on those sensors which have made amajor impact on the clinical measurement of the partialpressures of oxygen and carbon dioxide in the blood. Theelectrochemical interference effects of anaesthetic agentson these measurements are also described. Thoseelectrochemical sensors which have failed, in the past, tomake a clear impact in this area are not considered, butthe few attempts to devise aqueous electrolyteelectrochemical sensors for anaesthetic agent measurementare reviewed. The second part of the review describes thechequered history of the development of non-aqueoussolvent electrochemical sensors to measure the partialpressures of oxygen and carbon dioxide, in both thepresence and absence of each other, in the gas phase. Thelast part of the review examines various attempts, usingnon-aqueous solvent electrochemistry, to measure theconcentration of inhalational anaesthetic vapours in thegas phase. These sensors have yet to make an impact onclinical practice. Throughout this tutorial review,theoretical models of membrane-covered electrochemicalsensors are described where appropriate. This reviewrepresents a personal view of the development ofelectrochemical sensors for clinical measurement, and it istherefore necessarily selective in its approach andemphasis.
Keywords: Review; clinical medicine; blood-gases; gases;vapours; electrochemical sensors
Clive Hahn is Professorof Anaesthetic Science inthe Nuffield Departmentof Anaesthetics at theUniversity of Oxford,and is a Consultant inClinical Measurement inthe Oxford RadcliffeHospital NHS Trust. Hetrained in Manchester,Sheffield and Oxford. Heoriginally took up NHSposts in the OxfordUnited Hospitals, beforebecoming a UniversityLecturer in Anaestheticsand then gaining his pre-sent appointments. His
major research interest, over many years, has been in the field ofcardiopulmonary gas exchange in the sick and healthy lung. Incommon with others in the Biological and Medical Sciences, hisinterest in molecular sensors grew out of the frustration of notbeing able to measure gases of clinical interest with any degreeof certainty or precision, especially when anaesthetic gases andvapours were present. He is the author of numerous articles oncardio-respiratory gas exchange, clinical measurement andblood-gas analysis. He is also the British Medical Journal BooksSeries Editor for their ‘Principles and Practice’ series of bookson Clinical Measurement.
Introduction
The massive contribution made by chemists to the developmentand understanding of blood-gas and acid-base balance over thepast centuries is chronicalled in the book The History of Blood-Gases, Acids and Bases by Poul Astrup and John Severinghaus1
and in their historical essays on blood-gas analysis.2–6 The listis long and very distinguished but, right up to the 1950s, muchof this basic research and development work remained confinedto chemistry, biochemistry and physiology laboratories. Fur-thermore, despite the fact that dissolved gases had beenextracted from blood by vacuum techniques for more than 300years, with their identity known for 200 years and their contentshaving been measured for more than 150 years, these blood-gascontent measurements had contributed relatively little to patientcare over this period of time.5
However, a succession of external ‘forcing’ factors havecontributed, over the past 60 years, to the increasing utilisationof blood-gas measurements in the treatment and care of patientsand to the concomitant development of modern blood-gaselectrochemical analysis techniques. First, physiological re-search into high altitude acclimatisation, deep sea diving andaviation medicine began to burgeon during World War II, andthe limitations of the classical volumetric analysis of gasesdissolved in blood (i.e., the blood-gases) became so apparentthat respiratory physiologists and clinicians began to seek otherways of making these measurements. (The chemical analyses ofanaesthetic gases and vapours were to follow some decadeslater.) Following this initial war interest, two unconnectedevents, both in the 1950s, led to the rapid development ofmodern electrochemical sensors for measuring blood-gases and,amazingly, these early electrochemical devices were so goodthat they have remained relatively unchanged over the succeed-ing four decades.
The first event, the massive poliomyelitis (polio) epidemicthat struck both Copenhagen and the USA in 1952, focused theminds of chemists, physiologists and clinicians very sharply.Polio was a very important disease which consumed theresources of many hospital departments, and this disease leddirectly to the development of intensive care units, modern
Analyst, June 1998, Vol. 123 (57R–86R) 57R
artificial ventilation and the potentiometric electrochemicalanalysis of the partial pressure of carbon dioxide (PCO2
)dissolved in blood. The inventor of this electrochemicaltechnique, Richard Stow, was a scientist working in thePhysical Medicine Department at Ohio State University, wherethere were desperate attempts to measure the blood-gases ofpolio patients who were receiving artificial ventilation. Hispioneering work was developed further by John Severinghaus,an anaesthetist in San Francisco, who successfully developedthe first practical electrochemical PCO2
sensor (or ‘electrode’)for clinical use.4
The second event was the development, in the 1950s, ofblood bubble oxygenators for human use. It was quicklyrealised, at that time, that there was a concurrent necessity tomeasure the partial pressure of oxygen (PO2
) dissolved in blood,in order to check that the oxygenators themselves were workingefficiently and properly.5 A biochemist and physiologist,Leland Clark, not only developed some of the first of these newoxygenators, but also invented the first practical electro-chemical sensor for measuring the PO2
of whole blood.5,6
So, the first two practical electrochemical medical deviceswere developed out of acute clinical necessity by clinicalscientists and clinicians working in hospital laboratories, butthese workers had built upon an experimental framework whichhad already been firmly established by the electrochemist in thechemistry laboratory.1
From this point on, major contributions to the development ofpractical electrochemical blood-gas, gas and anaesthetic vapoursensors were made by chemists, physiologists, bioengineers andclinicians alike. Unfortunately, it is, and has been, generally truethat clinicians and electrochemists rarely seem to read eachother’s research papers, or appreciate the real value of eachother’s contribution to the field, and so there is still today a greatcommunication gap between the clinician and the chemist. Theauthor of this tutorial review hopes to bridge this gap somewhatand (i) to introduce the chemist to some of the very realproblems facing the use and development of blood-gas sensorsin clinical practice and (ii) to correct some misconceptionsconcerning the measurement of gas and vapour concentrationsin the blood.
Physiological background
Before considering the electrochemical techniques themselves,the whole subject matter needs to be placed within its relevantphysiological and clinical context, since this is the raison d’etrefor the development of the electrochemical gas and blood-gasmeasurement techniques themselves.
Cardiopulmonary homeostasis
The primary respiratory functions of blood are to transportoxygen from the lungs to body tissues, carbon dioxide from thetissues to the lungs and hydrogen ions from the tissues to thekidneys. The function of the lung is to facilitate the exchange ofthese gases between the blood and the outside atmosphere. Thedetermination of blood acid–base status (i.e., clinical chemistry)is extremely important in the critically ill patient, but thatsubject, including the measurement of hydrogen ion concentra-tion, is outside the brief of this tutorial review. This review isconcerned solely with the determination of the blood-gases andthe inspired or expired gases and vapours. Here, the blood-gasesreferred to are the partial pressures of oxygen or carbon dioxidein blood (PO2
and PCO2respectively) and this tutorial review will
exclude the measurement of the partial pressures of anaestheticgases dissolved in blood (for reasons given below). Therespiratory blood gases themselves reflect cardiopulmonaryhomeostasis. This is the ability of the cardiopulmonary systemto maintain a constant relationship between respiration in the
cells of the body, the supply of oxygen from the lungs to theblood and the elimination of carbon dioxide by the lungs.During inspiration, fresh gas in drawn into the lungs and gasexchange takes place between the gas in the lung and the bloodflow entering and leaving the lung. The blood which leaves thelung is freshly oxygenated and is pumped, by the left side of theheart, through a system of arteries to the main body organs andthe body tissues. In these body tissues, internal respiration takesplace and gas exchange also occurs. The respiratory product ofthis internal respiratory system, carbon dioxide, is transportedback to the right side of the heart, and is pumped back throughthe lungs (as mixed-venous blood) by the right ventricle. Whenthis venous blood enters the lung, carbon dioxide is offloadedand is expelled in expired air. For a normal human being, about350 l of carbon dioxide are expired every day!
Thus, the body constantly consumes oxygen and producescarbon dioxide, and there is a ‘normal’ balance between theabsolute contents and the partial pressures of these two gases inthe blood. Cardiopulmonary function acts as a complexfeedback system to keep the blood-gas partial pressures of O2and CO2 at their ‘normal’ physiological values. This balancecan be upset by many physiological or clinical factors orproblems, but cardiopulmonary function has a remarkableability to adapt to compensate for these changes, especially tokeep the blood-gases at their ‘normal’ values.
Carbon dioxide homeostasis
Broadly, the PCO2of arterial blood (i.e., oxygenated blood
which is leaving the lung) reflects the adequacy of theventilation of gas within the lung. Arterial blood normally has aPCO2
of 5.3 kPa and mixed-venous blood has a PCO2of 6.1 kPa
for a man breathing room air. These PCO2values are kept
constant by the lung ventilation rate, which is about 7dm3 min21. Carbon dioxide homeostasis is concerned withbalancing the metabolic rate of production of CO2 in the bodyagainst the effectiveness of lung ventilation. If metabolic CO2production increases, lung ventilation must be increased toexcrete the CO2 produced by the body, and so keep arterial PCO2
constant. There is an inverse law relationship between lungventilation rate and arterial PCO2
, at a constant metabolic CO2production rate. In fact, very little CO2 is carried in blood as adissolved gas, since by far the majority is carried as hydro-gencarbonate or by combination with haemoglobin in the redblood cells. This chemically stored CO2 is released in the lung,in gaseous form, through the action of carbonic anhydrase, andthis CO2 is expelled in expired air. The actual total CO2 content(i.e., chemically bound and dissolved) in blood is related to thePCO2
through well defined but complex biochemical relation-ships, and this is a key part of blood acid-base chemistry. Asstated previously, this is outside the remit of this teachingreview. It is sufficient to note here that the magnitude of thearterial blood PCO2
is the key clinical measure of theeffectiveness of the lungs to expel CO2.
Oxygen homeostasis
As with CO2, there is also a very well defined physiologicalrelationship between PO2
and oxygen content in the blood. Thiswell known relationship is illustrated in the shape of theoxyhaemoglobin dissociation curve (the blood oxygen content–PO2
relationship) shown in Fig. 1 for both foetal and adulthaemoglobin. The sigmoid shape is due to the way in whichoxygen combines reversibly with haemoglobin in the red bloodcells, and the chemistry of this relationship has exercised theminds of chemists and physiologists for decades.1 The ways inwhich this oxygen content–PO2
relationship can be compro-mised are legion, and the interested reader can be referred to areadable applied respiratory physiology textbook for this
58R Analyst, June 1998, Vol. 123

purpose.7 For the purpose of this review, it is sufficient to statethat the measure of the PO2
in arterial blood is one importantindication of how efficient the lungs are in oxygenating theblood, but the measurement of arterial blood PO2
is not, in itself,an indication of adequate tissue oxygenation. The compositionof the inspired gases, the affinity of haemoglobin for oxygen,the amount of haemoglobin present in the blood and the heartcardiac output all play major roles in the adequate oxygenationof the body tissues.1,7
Respiratory support
Respiratory support, or artificial ventilation, is applied topatients when their lungs begin to fail, because of clinicalreasons such as neuromuscular weakness, a decrease in therespiratory drive signals emanating from the brain, an increasein the impedance to respiration or acute lung disease in theseverely sick.7,8 All these conditions lead to a failure of the lungto clear the body's CO2 production, together with a decrease inthe arterial blood PO2
when the patient is breathing air. Amechanical device, commonly called a ventilator, is thereforeconnected to the patient’s airway to inflate the lungs and toexpel the CO2. Supplementary oxygen is added to the input ofthe ventilator, so that the patient is oxygenated to the desiredlevel. The efficiency of this artificial ventilation respiratorysupport is ascertained by obtaining arterial O2 and CO2 blood-gas samples, measuring their partial pressures and thencomparing these with the values expected for efficient gasexchange in the lung.
As stated previously, the polio epidemic in the 1950s leddirectly to the development of mechanical ventilators andmodern intensive care units. There is now a galaxy ofmechanical and electromechanical high-technology ventilatorsin current use, and the principles and practice of these deviceshave been very well described by Sir Keith Sykes in his bookPrinciples and Practice of Respiratory Support.8 Intensive careunits for sick babies, especially prematurely born infants, have
also developed rapidly over the past three decades. These units,too, have placed growing demands on the technologist (includ-ing the chemist) to make urgent blood-gas and acid–baseanalyses with minute blood samples, typically less than 50 ml.The frightening speed at which respiratory disease in both adultand neonatal patients can degenerate has also led to a perceivedneed to measure arterial PO2
and PCO2in vivo with intravascular
electrochemical transducers, because it is felt that the patientmight deteriorate within the analysis time taken by serialdiscrete blood samples. Whether this need is true or not is amatter of clinical judgement,9,10 but this need has placed aneven greater burden on the technologist because it is no easymatter to make on-line electrochemical measurements in such ahostile environment as flowing blood in a very sick patient.
Hence the demand for blood-gas analysis, whether usingdiscrete samples or on-line, is of paramount importance for bothadult and the neonatal intensive care, and the needs of these twodifferent clinical units can tax the ingenuity of even thecleverest developer of blood-gas sensors. Some perceivedclinical demands may just be wishful thinking, as alluded toabove, and may be totally impossible to meet with currentelectrochemical techniques. Before embarking upon a fruitlessdevelopment exercise, the chemist needs to think long and hardbefore he or she sets off on a journey to devise the perfectsensor–because it may not, in reality, be needed and might alsonever be used in clinical practice9,10 (i.e., outside the experi-mental laboratory).
Inhalational anaesthesia
Patients undergoing major surgery are still mostly anaesthetisedby inhalational anaesthetic agents, delivered by an anaestheticmachine. Inhalational anaesthesia has had a long history, lastingover 150 years now, and the ideal modern anaesthetic agentshould induce anaesthesia rapidly, maintain it with the mini-mum of unwanted side effects for the duration of the operationand should present both the patient and the anaesthetist with theminimum of complications at the end of the operation. It is, ofcourse, impossible to achieve all these ideals since the agent isa drug and, of necessity, this means that it has the potential toharm the patient if administered in too high a concentration orif the equipment delivering the drug to the patient fails to workproperly. Because there are so many interconnections betweenan anaesthetic machine, the ventilator and the patient, andbecause the agent is delivered by a vaporiser which containsmechanical and/or electronic components, the possibility ofmishap is always present. The fact that anaesthesia is a very safeprocess is a testimony to the reliability of modern instrumenta-tion and to the skill of the clinical anaesthetist, but anaestheticagent measurement devices are needed to monitor not just thepatient, but also the anaesthetic machine itself, if the risk ofmishap is to be minimised.
It is important, at this point, to correct a misconception whichhas grown concerning a perceived necessity to measure thepartial pressure of inhalational anaesthetic agents in the blood.11
Although the direct molecular mechanism whereby the anaes-thetic agent induces a deep state of hypnosis is still not yet fullyunderstood, it has been clear for decades now that it is the partialpressure of a given anaesthetic agent which determines thedepth of hypnosis in a given patient. This anaesthetic partialpressure in the blood determines the quantity of anaestheticwhich passes across the blood–brain barrier, and the clinicaleffect of the anaesthetic is titrated against this partial pressureby the anaesthetist using clinical judgement. The importantpoint to grasp here is that, because the agent is breathed in andout of the lungs by spontaneous or artificial respiration, thepartial pressure of an inhalational agent in the blood cannotexceed that of the inspired partial pressure (i.e., that partialpressure delivered by the anaesthetic machine). The patient
Fig. 1 Oxyhaemoglobin dissociation curves for normal adult haemoglobincompared with foetal haemoglobin. After birth, foetal haemoglobin isprogressively replaced with adult haemoglobin and the foetal blooddissociation curve gradually moves across to the right to form the adultcurve. Point A represents serious hypoxia which requires urgent treatmentin an adult patient with a normal haemoglobin concentration and normalcirculation. Point B shows the arterial PO2
which corresponds to thethreshold of loss of consciousness from hypoxia. (Taken from ref. 7.)
Analyst, June 1998, Vol. 123 59R

therefore eventually comes into partial pressure equilibrationwith the setting delivered by the anaesthetic machine via anexponential time process, and neither the patient's expiredanaesthetic gas nor the anaesthetic blood partial pressures canrise above the partial pressure set by the anaesthetic machine,because of the law of mass balance. The actual concentration ofthe agent in the patient's lungs and body organs is governed, ofcourse, by the tissue–gas partition coefficient of that particularagent in the body tissue—and either much, or little, of theanaesthetic agent is stored in the body tissues, according to theindividual solubility of the anaesthetic agent in the body tissues.An agent with a low tissue–gas solubility coefficient provides afast induction for, and recovery from, an inhalational anaes-thetic, and this is another ideal aim for the chemist andpharmacologist designing new anaesthetic drugs.
The point at issue here is that, unlike oxygen and carbondioxide (which are chemically bound to haemoglobin andwhose partial pressures in expired gas, and in arterial andvenous blood, are governed by complex physiological relation-ships), the inhalational agent will (theoretically) eventuallycome into partial pressure equilibrium throughout the wholebody (i.e., in both inspired and expired gas, and in arterial andvenous blood). This does not mean that the uptake and excretionof inhalational agents are not governed by complex physio-logical/pharmacological relationships, but it is assumed forpharmacokinetic modelling purposes that they are ‘inert’.Therefore, measurement of the partial pressure of the agent ininspired and expired gas will provide the anaesthetist with theinformation which is required concerning patient safety. Sincethese measurements confirm the vaporiser setting, it is un-necessary to measure the blood-gas partial pressure of aninhalational anaesthetic. Such measurements are only requiredfor research purposes, in order to develop new, or confirm old,models of anaesthetic uptake and elimination by human beingsand animals.
Even in the case of low-flow, or semi-closed, anaesthesia,where it is possible to accumulate an anaesthetic agent throughthe inappropriate use of certain vaporisers, the present dayrecommended practice is to measure the inspired and expiredagent gas concentrations at the patient's mouth to ensure that adangerous (or too low, in some circumstances) level ofanaesthetic is not delivered. Although it might be argued bysome practitioners that monitoring the partial pressure of thevolatile agent in the patient's blood on a frequent basis might aidthe anaesthetist, the clinical demand is simply not there at themoment.
The above arguments do not apply when a non-inhalationalanaesthetic drug is delivered intravenously, since a drugdelivered in this fashion can build up inexorably within thebody, if the body metabolism does not break the drug down intosafe by-products in sufficient time, i.e., the patient can be‘overdosed’. Great care must therefore be taken concerning theinfusion of anaesthetic agents—but the topic of total intra-venous anaesthesia is outside the brief of this tutorial review.
Measurement summary
In summary, therefore, it is clinically important to measure theinspired and expired partial pressures of oxygen and carbondioxide in the critically ill adult and infant patient. It is equallyimportant to measure the PO2
and PCO2of arterial blood, but here
a choice has to be made whether blood samples are taken andanalysed by a static laboratory bench analyser, or whether it ispossible (or economically viable) to make these measurementsin vivo. Sometimes, it will be necessary to measure the PO2
andPCO2
of mixed-venous blood (that is, the blood which isreturning directly to the lungs). Sometimes it may be possible todeduce the blood partial pressures by making in situ measure-
ments on the skin of a patient (so-called transcutaneousmeasurements, described in a later section). Lastly, it will beimportant to measure the inspired and expired concentrations ofoxygen, carbon dioxide and any present inhalational anaestheticagent when an anaesthetic machine and/or a ventilator isconnected to the patient and is thus taking on a life supportfunction.
It is important to note that some of these measurements can bemade relatively slowly, e.g., the inspired oxygen and inhala-tional anaesthetic agent concentrations delivered by a machine,and static blood-gas analysis in a bench analyser. In otherinstances, very rapid response times of the order of 100 ms arerequired, such as for breath-by-breath inspired and expired gasanalysis. Similarly, in vivo blood-gas sensors should respondreasonably rapidly, preferably with a response time of the orderof seconds, if the measurements are to have any significantphysiological meaning.
Before turning to the electrochemical analysis of therespiratory and anaesthetic gases, it must be pointed out thatelectrochemical techniques have serious rivals in the particularcase of respiratory gas-phase measurements. Breath-by-breathO2 gas analysis is now routinely performed by fast para-magnetic and magnetoacoustic O2 analysers, and these ana-lysers also incorporate infrared and photoacoustic gas analysisfor CO2 and the inhalational anaesthetic agents.12 As mattersnow stand, these analysers will not be superseded by present-day electrochemical techniques. On the other hand, ‘static’ orslow response O2, CO2 and anaesthetic agent gas analysis couldbe performed electrochemically, and this could offer a cheapand viable alternative for monitoring the gas output concentra-tion of the anaesthetic machine.
One final comment in this measurement summary section ison the question ‘Why devise new sensors to make “old”measurements?’. Every reviewer will have his/her own opinionon this matter. By the time the reader has finished reading thisreview, it will be clear that all electrochemical sensors havetheir own drawbacks (some more major than others) and it istherefore perfectly legitimate for the chemist to explore otherelectrochemical avenues, or techniques, to make the samemeasurements. This is how research and development pro-gresses in any science. If the new technique works better, ismore reliable, is less invasive and is much better or cheaper,then the old technique will be abandoned and relegated to theelectrochemical museum. If the new technique is no better thanthe old, then at least this avenue has been explored and tested.For this reason alone, clinicians and electrochemists alike havecontinued over the past four decades their relentless pursuit ofdeveloping the ideal chemical sensor for the respiratory andanaesthetic gases.
So, the clinical demands have already been outlined and haveremained essentially unchanged over the past four decades.Many more chemical sensors have been developed over theyears for PO2
and PCO2measurements than can be mentioned in
this tutorial review. They have all had their moments of gloryand some examples include quinhydrone, conductometric,potentiometric, and CHEMFET sensors. Many of these havebeen described in past reviews13–15 and in the historical seriesby Severinghaus and Astrup.1–6 Also, the past two decades haswitnessed a burgeoning interest in the measurement of O2 andCO2 using optical techniques, especially in the field of in vivo‘intravascular’ blood-gas analysis, and a fibre-optic in vivoblood-gas monitor is now available for hospital use.12 Thisparticular topic is, again, outside the brief of this tutorial reviewand so will not be considered here.
Space constraints permit only a selection of electrochemicalsensors to be described, and this reviewer has made his choiceselectively, concentrating on those devices which have madethe greatest impact or have shown the most promise. Electro-chemical techniques still remain supreme in the laboratory
60R Analyst, June 1998, Vol. 123

bench blood-gas analyser, and they are likely to do so for theforeseeable future.
Analytical techniques
Gas phase
Because steady state gas-phase measurements require only arelatively slow response time, electrochemical gas sensors areusually placed at the gas output of the gas delivery system (i.e.,the anaesthetic machine or the ventilator). The actual position ofthe gas sampling site can be important as far as patient safety isconcerned. It is possible to sample at a given point in thepatient’s gas delivery system, in the belief that this measure-ment point is the correct one for monitoring the safety of thepatient, and yet place the patient in danger—because anundetected gas delivery disconnection can occur between thepatient and the point of gas measurement. These issues andpotential mistakes are subtle in clinical practice, and have beendiscussed and illustrated by Sykes.16 The ideal measurementpoint is at the patient's mouth, but this is impractical forelectrochemical sensors, because of their size and the constantrisk of infection—clinical electrochemical gas-phase sensorsare not amenable to sterilisation. Furthermore, gas measurementat the mouth must be made with a very fast time responsedevice, since the measurements must be able to follow both theinspiratory and the expiratory gas concentration patterns. Aslow time response sensor will simply measure a runningaverage of the inspiratory and expiratory gases, rendering themeasurement useless for respiratory analysis. Thus, in theabsence of very fast time response electrochemical sensors,measurements at the mouth are out of the question (even withside-stream remote analysis), and so electrochemical gasmeasurements must be confined to the parts of the gas deliverysystem which are distal to the patient's airway.
Blood phase
Here, three techniques are commonly used. The major tech-nique, and that most used, is in vitro analysis of the blood, usingelectrochemical sensors installed in a blood-gas analysersituated either close to, or some distance away from, the patient.A blood sample is taken from the patient’s artery in a gas-tightsyringe, and this sample is then introduced to three electro-chemical sensors which determine PO2
, PCO2and hydrogen ion
concentration separately. Less commonly used are in vivotechniques, which can be sub-divided into two approaches. Thefirst approach (which is rarely used in the adult patient) is toinsert an electrochemical sensor into the patient’s artery so thatblood-gas measurements can be made in vivo. The alternativeapproach is a non-invasive (transcutaneous) method of measur-ing blood-gas partial pressures, where the electrochemicalsensor is placed on the patient’s skin, and the measurementrelies on O2 and CO2 diffusing through the skin to theelectrochemical sensor.
Each different measurement approach has certain advantagesand disadvantages, but all methods employ the same electro-chemical principles to determine the gases in question. Almostwithout exception, separate electrochemical sensors are used tomeasure PO2
and PCO2, and these sensors invariably use a two-
electrode cell, with a working electrode to measure the variableand a reference electrode to standardise the measurement. Athree-electrode cell is rarely employed, and this tutorial reviewwill concentrate on the working electrode, at which the O2, CO2or anaesthetic agent measurement is made. The referenceelectrodes (which are standard Ag/AgCl or calomel referenceelectrodes) will not be considered any further.
Aqueous electrolyte solution electrochemistry:carbondioxide determination
Since the history and development of the electrochemicaldetermination of CO2 is less varied than that of O2 determina-tion, this topic will be considered first. Apart from very recentdevelopments (to be described later), CO2 determination in theblood has always been performed by potentiometric meansusing aqueous electrolytes. The PCO2
sensor, first described byStow et al.17 in 1957 and then by Gertz and Loeschcke18 in1958, was developed into its present form by Severinghaus andBradley19 in 1958. This CO2 sensor is commonly referred to asthe Stow–Severinghaus electrode.
The Stow–Severinghaus sensor
This sensor is, in effect, a glass pH electrode housed behind athin membrane which is permeable to CO2, with a thinhydrogencarbonate layer placed between the pH electrode andthe membrane. The working principle of this sensor can beillustrated by reference to Figs. 2 and 3. Fig. 2 shows a cross-
Fig. 2 A schematic outline of the Stow–Severinghaus PCO2sensor,
suitable for in vitro blood-gas measurement.
Fig. 3 Schematic diagram of the tip of the Stow-Severinghaus PCO2sensor
showing the membrane, buffer electrolyte layer and the pH-sensitive glassof the pH electrode. The equilibria equations for CO2 transport across themembrane are illustrated.
Analyst, June 1998, Vol. 123 61R

section of a practical PCO2sensor. The end of the pH glass
electrode is covered by a matrix which holds a thin layer ofsolution containing NaHCO3 with some NaCl, and sometimesAgCl, also added. An Ag/AgCl reference electrode, in physicalcontact with the hydrogencarbonate solution, completes theelectrical circuit to the pH working electrode. The potentialdifference between the working electrode and the referenceelectrode is measured by a standard high-impedance voltageamplifier and display system.
Working principle
The pH sensor is separated from the blood, which is to beanalysed, by a membrane (typically 20 mm thick Teflon) whichis highly permeable to CO2. When in practical use, the PCO2
ofthe blood comes into equilibrium with the PCO2
of thehydrogencarbonate solution in the matrix immediately adjacentto the H+ ion-sensitive glass. This process is shown dia-grammatically in Fig. 3. The equilibria now existing in this thinhydrogencarbonate layer are
CO2 + H2O " H2CO3" H+ + HCO32
HCO32 " H+ + CO3
22
NaHCO3" Na+ + HCO32
By writing the dissociation constants K, K1 and K2 in terms ofthe chemical activity of each species present, and noting that theionic products for the dissociation of water are given by
KW = aH+aOH2
it can be shown that the CO2 partial pressure, PCO2, in this thin
film is given by
Pa a a K
K K aCO
H Na H w
H2
2
1 21 2=
+ −
+( )+ + +
+α /(1)
where a is the solubility coefficient of CO2 in the thin film ofhydrogencarbonate, and it is assumed that Henry's solubilitylaw holds in this thin film.
This principle was first determined by Stow in 1952, althoughhis work was not published until 1957.17 However, Stow’ssensor utilised a thin layer of water between the membrane andthe pH working electrode, and the sensor did not work well—itwas unstable in practice, presumably because the pH of thedistilled-water electrolyte changed very easily with slightcontamination. Severinghaus’s key contribution to the develop-ment of the sensor was to add sodium hydrogencarbonate to thewater in order to stabilise the pH and to increase the sensorsensitivity. Accordingly, Severinghaus and Bradley19 demon-strated that the addition of a 5–20 mm hydrogencarbonateconcentration greatly increased the sensitivity of the sensor, andunder these conditions, eqn. (1) simplified to
Pa a
KCONa H
21
=+ +
α(2)
Severinghaus was able to demonstrate that when the PCO2in the
hydrogencarbonate layer changed to a new value, then [bytaking logarithms of both sides of eqn. (2) and noting that bothK1 and aNa+ are constants, and therefore cancel out when twoaH+ values are inserted], the relationship between the changes inthe PCO2
and pH in the bicarbonate layer was given by
DlogPCO2= 2DpH (3)
where the D terms represent the change in the logarithm of thePCO2
and the change in pH. It must be noted that -Dlog aH+ =DpH, by definition, in the hydrogencarbonate layer.
These authors also defined the ratio Dlog PCO2/DpH as the
sensitivity, S, of the sensor. Thus, if S is 21.00, then each
10-fold change in PCO2will theoretically induce a one unit
change in the pH of the hydrogencarbonate solution. At a steadytemperature of 37 °C, this would be registered as a voltagechange of 61.5 mV, as predicted by the Nernst equation.Severinghaus and Bradley found that the sensor sensitivity wasslightly less than this predicted change, and that S couldtypically be 20.97. It is clear from eqn. (3) that since therelationship between pH and potential difference is linear, andthe relationship between PCO2
and pH is logarithmic, then thecarbon dioxide sensor produces a logarithmic relationshipbetween PCO2
and output voltage. All blood-gas analyserstherefore employ an algorithm to linearise this relationship, sothat PCO2
output is displayed linearly.
Stability
It is important to note that the bulk of the electrolyte, shown inFig. 2, plays no part in the equilibration process and merelyserves as a reservoir and as electrical conductor. All activeprocesses take place only in the thin hydrogencarbonate layertrapped adjacent to the glass electrode. It is therefore importantto keep a stable calibrating gas, or liquid, solution in the samplechamber between readings, so that the sensor always worksfrom a stable pH reference point in the hydrogencarbonate layerand returns to this same point after sampling. Sensor instabilityor drift will result if this regime is not adhered to, and modernblood-gas analysers pass through a sample analysis/wash/reference calibration point regime when used in clinicalpractice. If a sample is retained too long in the analysingchamber adjacent to the sensor membrane, the bulk of the sensorelectrolyte solution will begin to come into equilibrium with thePCO2
of the sample, and this will destroy the stability of thesensor.
Liquid-gas difference
Because all the electrode reactions described above arereversible, and since pH measurement itself is potentiometric,the overall electrochemical CO2 process does not consume theanalyte. Since the PCO2
sensor does not consume CO2 from thesample, it follows that, in principle, any liquid or gas samplewhich has the same CO2 partial pressure will register the sameoutput when analysed with the same sensor. There is thereforeno so-called ‘liquid–gas measurement difference’ for thepotentiometric Stow–Severinghaus PCO2
sensor, and this is amajor advantage over new rival amperometric techniques.
Calibration
The absence of a liquid–gas difference for the potentiometricCO2 sensor means that the sensor can be calibrated with eithera gas or liquid before it is used to measure the PCO2
of a bloodsample. Since the PCO2
sensor output is logarithmically relatedto PCO2
, a zero PCO2calibration point cannot be used. It is
usually convenient to calibrate the sensor with two gases, or twoliquids equilibrated with these gases, which have CO2 contentswhich span the expected range of the blood PCO2
values. Sincethe clinical range for patient blood PCO2
values is expected to bebetween 2.7 and 8.0 kPa (or above in extreme cases), the twoPCO2
calibration values will normally lie between 3 and10 kPa.
Uses and limitations
The Stow–Severinghaus CO2 sensor, as described above, has atypical outside body diameter of 10 mm and an overall sensorlength of 35 mm. It is very difficult to reduce these overalldimensions because of the very nature of the construction of pHglass electrodes. However, Parker et al.,20 in 1978, made a
62R Analyst, June 1998, Vol. 123

heroic attempt to develop an intravascular dual O2/CO2 sensor,and they managed to reduce the overall diameter of the sensorto 1.6 mm. However, this sensor was obviously very difficult toconstruct and must have been extremely fragile, and it does notappear to have been developed any further. Thus, the standardPCO2
sensor is used solely for in vitro or transcutaneous (seelater) CO2 measurements in clinical practice, and it cannot beused for breath-by-breath CO2 gas analysis because of its slowresponse time.
Nonetheless, this sensor has stood the severe test of time, andhas been used (outside blood-gas measurement in medicine) forambient gas monitoring, tissue studies, industrial fermentationcontrol and even for satellite atmosphere monitoring.4 Ashighlighted by Severinghaus and Astrup, Stow’s developmentof the CO2 sensor was a result of logical thinking and did notdepend on a long series of prior discoveries, apart from theprevious development of the glass pH electrode. The sensor wasnot patented, was not disputed and the inventor did not profitfrom his discovery4—an unusual occurrence in today’s soci-ety.
Determination of oxygen
Danneel,21 in 1897, reported that oxygen in aqueous solutionreacted with negatively charged inert metals, and he demon-strated an approximately linear relationship between oxygenpartial pressure and current when using two large polarisedplatinum electrodes. He, and others, attempted to use platinumelectrodes for oxygen measurement in biological media, butfound that the electrodes were rapidly poisoned, or else werecoated with protein, causing decrease in the oxygen reductioncurrent. Because the measurements were not dependable,Danneel's discovery fell into disuse. Much later, the discoveryof the dropping-mercury electrode, and the subsequent meas-urement of dissolved oxygen with this electrode, was theprelude to a burgeoning interest in the measurement ofdissolved oxygen. According to Severinghaus and Astrup,6 itwas work by Blinks and Skow22 (in which they used platinumor gold instead of mercury as the working electrode) which ledto the use of solid metal working electrodes for the measure-ment of dissolved oxygen, and thus the subsequent measure-ment of an ever-broadening range of other gases. AlthoughHeyrovsky (the discoverer of the dropping-mercury electrodeand the founder of polarography) had strongly objected to theuse of solid metal working electrodes, because of theirinstability due to the ‘poisoning’ of the cathode surface,5 Blinksand Skow persevered with their investigations of the use ofplatinum electrodes, and they demonstrated that they couldproduce results which were identical with those obtained withthe dropping-mercury electrode. In fact they found that goodoxygen reduction plateaux could be obtained in stirred solu-tions, with good current linearity over a range of oxygenconcentration from 0 to 99.5% v/v. They further reported thatoxygen was reduced to hydrogen peroxide during theirinvestigations into oxygen evolution and consumption in plantcells, and they demonstrated that plant catalyse immediatelybroke down the hydrogen peroxide. Thus, Blinks and Skowappear to be the first workers to initiate the use of platinumworking electrodes, at fixed polarising potentials, for theamperometric measurement of oxygen partial pressure inbiological solutions, and they were also the first to demonstratethe linearity of the oxygen reduction current with PO2
.Unfortunately, these workers appear to have been frequentlyoverlooked when the history of the amperometric oxygen sensorhas been reported in the past.
Thereafter, a whole succession of physiologists and chemistsattempted to use solid wire electrodes to measure PO2
, with littleconsistent success in biological media, and the solution to theproblem of the measurement of PO2
in liquids and biological
solutions was finally proposed by Leland Clark.23 Clark’s greatcontribution to this field was the imposition of a gas-permeablemembrane between the liquid sample and the working elec-trode, with the reference electrode also housed behind the samemembrane. This innovative, but simple, step solved the problemof contamination or poisoning of the working electrode in onestroke.
This single change in design was a historical turning point forrespiratory physiology, and led rapidly to the development ofthe modern blood-gas analysis machine. There followed anunparalleled explosion in the use of the oxygen electrode inclinical medicine, and it was rapidly used to measure gaseousoxygen, blood PO2
and blood oxygen content and in, the studyof the oxyhaemoglobin dissociation curve, and its use was alsoextended to the food, alcohol, aircraft and the space industries,to soil chemistry and to waste water and sewerage manage-ment.5,6,13,24–27
The development of this membrane-covered electrode alsoled to a variety of electrochemical control techniques beingapplied to the working electrode, in order to obviate, orovercome, some of the inevitable practical difficulties whichwould be encountered when the sensor was applied to practicalclinical problems. It has also led to a research interest in thedevelopment of mathematical and computer sensor simulationmodels, in order to describe the reaction–diffusion processestaking place in the sensor and at the working electrodesurface.
The Clark sensor
The fundamental principles of the Clark amperometric sensorare illustrated in Fig. 4. As with the Stow–Severinghaus CO2sensor, the Clark sensor comprises a container which houses theelectrolyte, the working electrode (cathode) and the referenceelectrode. The external electrical circuit consists of a fixedvoltage source and a current-to-voltage converter to measure theoxygen reduction current. A gas-permeable membrane sepa-rates the electrolyte from the oxygen sample and the workingelectrode is polarised at a steady negative voltage with respectto the reference electrode (which is almost invariably an Ag/AgCl electrode). The electrolyte solution is, typically, anaqueous buffer solution with the addition of Cl2 ions, and a pHis generally chosen to be in the region of 7. When used in ablood-gas analyser, the complete system is thermostatically
Fig. 4 Schematic outline of the Clark PO2sensor.
Analyst, June 1998, Vol. 123 63R

controlled at 37 °C, so that the blood-gas PO2measurements are
made at normal body temperature.28
Electrode reactions
There has always been discussion and disagreement about theexact nature of the electrochemical reactions taking place at theelectrode surface in the aqueous electrolyte solutions used in theClark sensor.14,27,28 Perhaps there will never be agreement,because the electrode reactions (and any combination of them)appear to depend upon poorly reproducible or uncontrollableconditions such as the past history of the cathode surface, the pHof the electrolyte, the metal used for the cathode and even thegeometry of the cathodic compartment.27 Furthermore, it couldwell be true that the combination of the reactions taking place atmicro-cathodes (diameters less than 20 mm) might not be thesame as those taking place at the conventional macro-cathodes(diameters greater than 200 mm) which are conventionally usedfor monitoring industrial processes. Various schemes have beenproposed in the past,14 with varying degrees of complexity, butit seems clear that the two products for the reduction of O2 atnoble metal surfaces, in alkaline media, are either the hydrogenperoxide ion, HO2
2, or the hydroxyl ion, OH2.A much simplified reaction scheme is given by
O2 +H2O + 2e ? HO22 + OH2 (4a)
HO22 + H2O + 2e ? 3OH2 (4b)
catalytic decompositionHO2
2 –––––––––––––––––? 12O2 + OH2 (4c)
––––?ı
ı
ı
ı
ıı ıı ı––––––––––––––––––––––––––––
or
directO2 + 2H2O + 4e ––––? 4OH2 (4d)
where the HO22 ion is either reduced to OH2, is catalytically
converted back to oxygen, which can further react on thecathode surface, or else escapes from the cathode surface intothe bulk of the electrolyte, in the immediate vicinity of thecathode.
Examples of complex pathways relating to these reactionshave been illustrated by Jacq and Bloch,29 Wroblowaet al.,30Appleby and Savy31 and by Linek et al.27 Althoughthese workers confined their findings to macro-electrodes, thereis no reason to suppose that their general conclusions cannot beapplied, in part, to the processes taking place at micro-cathodesurfaces. The net result of these processes is that the number ofelectrons, n, involved in the reduction of O2 can vary betweenthe limits 2 ≤ n ≤ 4. Hahn et al.32 examined the way in whichn varied with electrolyte pH and cathode metal, with a rotatingring-disc electrode system. The conclusion was that the amountof HO2
2 reduced as the negative polarising voltage wasincreased, for all values of pH. The problem with the productionof the unwanted HO2
2 ion is that it can build up in the bulkelectrolyte if it escapes from the cathode surface. It can thendiffuse back to the cathode to be reduced to OH2 ions, and soconstitute an unwanted current. This takes the form of ahysteresis effect, when a low PO2
sample has been introduced tothe sensor immediately following a high PO2
sample. In thisinstance, there is a long tail in the sensor response time beforeit registers the ‘true’ low PO2
value, and this introduces a longtime constant into the measurement procedure. Both thehysteresis and the over-long time constant effects are reduced asn ? 4, as the polarising voltage is increased to high negativevalues.32
Eqns. (4a) and (4b) suggest that two clearly separated O2reduction waves should be observed when O2 is reduced inaqueous electrolyte solutions. However, this is not necessarilythe case even for unshielded electrodes. The electrode material,
the electrode size and the pH of the electrolyte all play a part inthe reduction process scheme, and the presence of a shieldingmembrane also appears to change the nature of the processesoccurring.
For instance, when O2 is reduced on unshielded gold macro-electrodes, two O2 reduction waves [corresponding to eqns. (4a)and (4b)] are seen. When shielded with a membrane (as in aClark sensor), only one wave [corresponding to eqn. (4d)] isseen. When Pt is used as the cathode material, only onereduction wave is seen for both unshielded and membrane-covered cases.
When 20 mm diameter micro-electrodes are employed, thepH of the electrolyte plays a key role in determining the shapeand position of the O2 reduction voltammogram. Fig. 5 showsvoltammograms for the same 20 mm diameter Pt micro-disccathode, shielded by the same 25 mm polypropylene membrane,for O2 reduction in pH 6.8 and 11.2 electrolyte solutions at37 °C. The voltammogram with pH 6.8 electrolyte shows noclearly defined plateau at the voltage normally used to poiseClark blood-gas PO2
sensors, namely 20.6 V versus Ag/AgCl,whereas with the pH 11.2 electrolyte a clear plateau is seen atpolarising voltages more negative than 20.8 V. Furthermore, alarge degree of hysteresis is evident between the upward anddecreasing sweeps for pH 6.8, and this hysteresis is removed onthe plateau part of the wave for pH 11.2.
Despite this evidence, manufacturers to this day use electro-lyte solutions with pH ≈ 7 in their Pt microdisc blood-gas PO2
sensors and poise them at about 20.6 to 20.7 V, i.e., sensorsappear to work on a voltammogram which does not display aclear diffusion plateau at that voltage.
Cathode size and the stirring problem
The polyethylene membrane covering Clark’s electrode notonly completely avoided the cathode poisoning problem, andmade measurements of gases (and not just liquids) possible(because both cathode and reference electrode were locatedwithin a single electrochemical cell) but also, very importantly,the membrane was relatively impermeable to oxygen. Limitingthe amount of oxygen consumed by the cathode enabled thesensor to measure the oxygen partial pressure in solution.
Fig. 5 Voltammograms for a 20 mm Pt micro-electrode, when coveredwith a 25 mm polypropylene membrane, at 37 °C (normal bodytemperature), when using a pH 6.8 electrolyte (top) and a pH 11.2electrolyte (bottom).
64R Analyst, June 1998, Vol. 123
However, the first sensor had a relatively large cathode (2 mmdiameter) and the sensor reading in stagnant water was 25% toolow when the sensor was calibrated with a gas with the samePO2
.5 This ‘liquid–gas’ difference, to be called later the ‘stirringeffect’, was enormous. Severinghaus and Bradley19 imme-diately saw one solution to this problem, and introduced amagnetic stirring bar in front of the electrode, which greatlyreduced the liquid–gas difference. Thereafter, many magneticstirring systems were described, but alternative methods ofsolving the stirring problem soon appeared. Some methods usedthick polyethylene membranes, some used Mylar (6 mm) as thematerial, but the disadvantage of tackling the problem bymaking the membrane more impermeable to oxygen was thatthe time response of the electrode became unacceptably large( > 2 min).
The final solution of the stirring problem came from attemptsto make the electrode small enough for intravascular use or foruse with very small in vitro samples. The emergence of high-gain current amplifiers made accurate measurement possible forcurrents of the order of several pA. Staub,33 in 1961, designeda micro-electrode in order that it might fit into a very smallcuvette, and he embedded a 50 mm platinum wire in a glassrod—the first reported such small micro-electrode Clark PO2
sensor. This small electrode drew immediate attention to thepossibility of reducing the stirring effect by reducing thecathode diameter and thus the quantity of oxygen consumed bythe sensor. It also enabled researchers to use thinner membranesand so reduce the electrode response time to the order ofseconds. Very soon, cathodes with diameters of 12–25 mm wereproduced, and when these were covered with 25 mm polyethyl-ene, the stirring effect was found to be only about 3–5%. Thiswas an acceptable level for clinical and most research uses,without stirring. Other early approaches included mechanicallyagitating the sample so that it moves to and fro across themembrane face adjacent to the cathode surface, or pulsing thepolarising voltage with a fixed duty cycle and thus using pulsedamperometry to control the electrode. Although sufficientlyshort pulses have the advantage that they can control theexpanding diffusion field, emanating from the vicinity of thecathode, in a space of defined diffusion conditions (e.g., withinthe membrane or with a defined unstirred layer of the solution),the electrode control circuitry is complex. Furthermore, it isonly recently (see below) that realistic two or three layer digitalsimulation models have been developed to describe the complexrelationship between the cathode time-dependent current, thecathode diameter and the electrolyte and membrane layerthicknesses and permeabilities.
Therefore, over the past 40 years, blood-gas analysermanufacturers have accepted the blood-gas difference asinevitable, and strike an empirical compromise between thecathode diameter, the type of membrane material and themembrane thickness. This has inevitably led to a 3–5%difference between gas and blood samples which have the samePO2
, but this difference is automatically accounted for in thesoftware of the analyser.
Calibration and quality control
In vitro blood PO2sensors can be calibrated either with two
gases, or with two liquids which have themselves been broughtinto equilibrium with known gas mixtures. One of these gases(or liquids) will have a zero PO2
, in order to set a ‘zero point’ forthe PO2
sensor. A two-point calibration procedure must beemployed, because the quiescent current present in a micro-cathode PO2
sensor is a sizeable fraction of the oxygen reductioncurrent produced when blood samples are introduced into theanalyser. Typically, the current generated by a blood-gas PO2
sensor is of the order of 70–100 pA per kPa PO2. With such a
small current sensitivity, it is clear that even a quiescent
background current of 10–20 pA has to be ‘backed off’ by thecontrol circuitry. The ‘high’ calibration point will typically beset somewhere between a PO2
of 10 and 21 kPa. The other maingas in the two calibration mixtures will be CO2, with ‘low’ and‘high’ PCO2
values, for calibrating the Stow–Severinghaus CO2sensor.
A modern blood-gas analyser will go through an automatictwo-point calibration procedure every 2–4 h, to account for theinevitable drift of the output signals from these electrochemicalsensors and to correct for changes in their sensitivity to PO2
andPCO2
; however, they will also go through a ‘single point’ checkcalibration after each blood sample has been analysed.
Ways in which the accuracy of blood PO2(and PCO2
)measurements can be assessed has always been controversial,and this subject matter really belongs in the domain of clinicalbiochemistry. The ‘gold standard’ should be samples of freshtonometered human blood, but this is an artform in itself andmany laboratories have not had, in the past, the facility forconducting this work. Instead, ampoules of commercial qualitycontrol materials became widely available, based on aqueoussolutions with O2 solubilities equivalent to water, haemoglobin-containing products, and perfluorocarbon-containing emulsionswith an O2 solubility several times higher than that of water.According to Hansen and Fiel,34 it is not unusual to finddifferences of !20% between model-specific mean PO2
valuesfor a given set of quality control ampoules. In their own work,they found that the perfluorocarbon emulsion materials per-formed better than the other materials. However, good modernpractice now involves the use of tonometered non-human orhuman blood, with a high quality tonometer sited close to theblood-gas analyser unit, so that the performance of the PO2
andPCO2
electrodes can be checked at will.
Theoretical models
Theoretical models describing the output current–PO2relation-
ship of the Clark PO2sensor have changed dramatically over the
past four decades. Perhaps the major problem, at least in theearly years, arose from the application of one-dimensionaldiffusion theory to membrane-covered micro-cathode elec-trodes. Once it had been realised that this was a great mistake,hemispherical and cylindrical diffusion models began toemerge.
All the analytical solutions described below in this section arebased on various solutions of the Fick equation:
δδp
tP p= ∇2 (5)
where P is the oxygen permeability in the medium (P = aD,where a is the oxygen solubility and D is the oxygen diffusioncoefficient in the medium) and p is the oxygen partial pressurein the medium (written with a lower case p here to avoidconfusion with the permeability term, P).
Steady-state models
One-dimensional linear diffusion model. This three-layermodel, which only strictly applies to macro-cathodes employedin gas-phase PO2
sensors, is described in Fig. 6. In this model,the constraint is normally made that the cathode surface ispolarised sufficiently negatively enough to ensure that alloxygen molecules reaching it are immediately destroyed.
For linear diffusion, eqn. 5 reduced to
δδ
δδ
p
tP
p
z=
2
2
and the current at the (disc) cathode surface is given byevaluating the oxygen flux to the cathode.
The steady-state limiting current, iL, is given by
Analyst, June 1998, Vol. 123 65R

inF R p
d P d PLs
e e m m
=+π 2
/ /(6)
where Pm and Pe are the oxygen permeabilities in the membraneand electrolyte layer respectively, ps is the prevailing PO2
in thesample, n is the number of electrons involved in the reaction, Fis Faraday's constant, R is the radius of the disc electrode and deand dm are the thicknesses of the electrolyte and membranelayers, respectively.
Since, in practice, dm ≈ 20 mm, de ≈ 5 mm, Pm ≈ 8 3 10211
m2 s21 atm21 and Pe ≈ 2.7 3 1029 m2 s21 atm21, it is clear thatthe ratio dm/Pm is much greater than de/Pe and eqn. (6) reducesto
i nF RP P
dLm s
m
= π 2 (7)
Eqn. (7) describes adequately the steady-state behaviour ofmacro-disc gas-phase PO2
electrodes, but the current generatedby this equation fails, by at least an order of magnitude, toapproach those measured experimentally for in vitro blood-gaselectrodes which have cathode diameters of the order of 20 mm.In this case, ‘edge diffusion’ of oxygen towards the cathodesurface is of paramount importance, and models employinghemispherical or cylindrical polar coordinates have to beemployed.
One-dimensional hemispherical diffusion model. A simplifiedone-dimensional diffusion model which has been used todescribe the behaviour of microdisc electrodes is the semi-hemispherical model. Hahn,14,35 in 1974, described such amodel which included a first-order reaction rate term to describethe reduction of oxygen at the cathode surface, and so allow themodel to generate voltammograms. A schematic diagram of thismodel is shown in Fig. 7, which also describes the sensorparameters. Eqn. (5) in this instance is
δδ
δδ
δδ
p
tP
p
r r
p
r= + ×
2
2
2
and the current is derived from half the oxygen flux at thecathode surface. In the limiting current case, where all theoxygen molecules reaching the cathode surface are immediatelydestroyed (i.e., the micro-disc cathode is polarised sufficientlynegative enough for the reaction current to be diffusion-limited), then the sensor current equation simplifies to
inFp
d
P r r
d
P r R
=+
2π s
m
m m e
e
e e
(8)
This model is obviously not a true representation of physicalreality, but its analytical simplicity enables the effects ofvarying parameters such as R, de, dm, Pm and Pe to beinvestigated with ease. The sensor currents generated by this
simple theoretical model, for micro-disc diameters of the orderof 20 mm, can agree closely with those measured by experiment,if the electrolyte layer thickness (de) is assumed to be about5–10 mm.
This simple hemispherical model (excluding the reaction rateterms) was replicated by Ultman et al.36 in 1981, where it can beseen that their eqn. (5) is identical with that published by Hahnpreviously.4,35 They later extended the steady-state hemi-spherical model to a three-layer model, where a flowing liquidmedium constituted the third layer.37
Linek et al.27 relaxed the steady-state constraint, previouslyapplied to the three-layer hemispherical model, and developed aseries of much more complex time-dependent equations whichdescribed the sensor current response to a step-change in theoxygen concentration in front of the sensor membrane (i.e., inthe liquid layer). These equations are fully described in theirbook, and they also describe Clark sensor current relationships(for macro-cathodes) when there is disturbed four-electronstoichiometry of the oxygen reduction process at the cathodesurface.27
Two-dimensional cylindrical diffusion models. The precedingmodels, based on oxygen transport by one-dimensional diffu-sion processes, produce analytical solutions, but they do notdescribe the real electrochemical situations occurring in sensorswith micro-cathodes. The contribution of ‘edge’, or radial,diffusion towards the micro-cathode is best described by a two-dimensional oxygen diffusion model, which is based on acombination of two one-dimensional diffusion oxygen flows inmutually perpendicular directions. This model involves solvingthe Fick equation in two separate layers, the first layercomprising the membrane, with diffusion taking place perpen-dicular to the cathode surface, and the second layer comprisingthe electrolyte solution, with oxygen diffusing radially towardsthe micro-cathode surface. This two-layer model is describedschematically in Fig. 8, and was proposed by Hahn14,35 in 1974as a one-dimensional representation of a micro-electrodeoxygen sensor. Again, this early model incorporated a first-order electrochemical reaction, and was used to generatevoltammograms describing the overall sensor current–polaris-ing voltage relationship. The success of this model lies in thefact that since Pm is much less that Pe, then the steady-stateequations in the two layers can be described by
Fig. 6 Coordinate system for a one-dimensional diffusion model for amacro-electrode PO2
sensor, with a large cathode (radius R 9 de; R 9 dm)and electrolyte and membrane thicknesses de and dm, respectively.
Fig. 7 Schematic diagram of the hemispherical diffusion model for a PO2
sensor, with cathode, electrolyte layer and membrane radii Rc, re and rm,respectively. The electrolyte and membrane layer thicknesses are de and dm,respectively.
66R Analyst, June 1998, Vol. 123

m e z e Pp
z
e z Pp
r r
p
r
p
z
r Rp
zz r p p
z r R Dp
zkp r
z m e p p r
z e P
+ > > =
> > + × +
=
≥ =
= → ∞ =
= ≤ = ( )= + =
=
:
:
:
, :
: ,
:
:
m
e
s
e
s
d
d
d
d
d
d
d
d
z = 0,d
d
d
dall
2
2
2
2
2
2
0
01
0
0
0
0 0
mmm
ee
d
d
d
d
p
zP
p
z
=
where k is the reaction rate at the cathode surface.The sensor current is given by
i nFk p r r rR
= ( )∫2 00
π , d (9)
but analytical solutions to these equations are unmanageable,and so the simultaneous equations must be solved by digitalsimulation techniques. Once more, this type of model wasgreatly extended and modified by Linek et al.,27 particularly foruse with macro-cathodes which could be used for oxygen gasanalysis.
Later, Jenson et al.,38 in 1978, made an important contribu-tion to this model when they solved, and balanced, thecontributions from the membrane and electrolyte layers, toproduce a simplified analytical solution for the electrode currentgiven by
i nF RP
dp
x
K x
K xs= + ×
π 2 1
0
12m
m R
R
R
( )
( )(10)
The first part of this relationship:
nF RP
dpm
msπ 2 (11)
represents the current corresponding to one-dimensional diffu-sion through the membrane, i.e., eqn. (7). The second part of theequation:
2 2 1
0
πnFRP
dp
K x
x K xsm
m
R
R R
( )
( )(12)
corresponds to the current due to the radial flux of oxygenthrough the electrolyte, and it is this term which dominates for
R < dm. Linek et al.27 have also further modified thisrelationship to compensate for the possible over-estimation ofthe importance of the radial contribution to the total oxygen fluxby the assumption of an infinitely rapid axial diffusion ofoxygen through the electrolyte layer. They circumvented thisdrawback by introducing a ‘resistance’ to the diffusion in the z-direction, and produced modified equations to describe theircompensation technique.27
Time-dependent models
In most situations, the Clark PO2sensor is continuously
polarised and therefore any time-dependence in the Fickequation [eqn. (5)] normally refers to step changes in the samplePO2
at the face of the membrane. However, in other instances, astep change is forced on the polarising voltage (i.e., pulsechronoamperometry), from a potential where oxygen is notreduced to a potential where oxygen is fully reduced. In thiscase it is assumed that the sample PO2
(ps) remains constant atthe membrane interface, and the Fick equation [eqn. (5)] is thensolved, in two or more layers, to produce the sensor pulseamperometry current–time response. These two different time-dependent models will be considered separately.
Step-change in PO2. In this situation, a step-change in ps is
imposed at the membrane surface, and the Fick equation is(usually) solved for the one-dimensional case (i.e., applying togas-phase Clark sensors with large cathodes). Hitchman13
analysed this situation, again making the assumption that theeffect of the electrolyte layer may be ignored. His solution forthe electrode current at time t after a step change in the samplePO2
is given by
i t i
i i
n D t
dn
n
( )( ) exp
−−
= + − −
∞
=
∞
∑0
0
2 2
2
1
1 2 1π m
m(13)
where i0 is the electrode current immediately preceding the stepchange in PO2
and i∞ is the final current reached, i.e., the steady-state current. Considering the simplest example, where theoxygen step change is from zero to ps, eqn. (13) simplifies to
i t nF R pP
d
n D t
dsn
n
( ) ( ) exp= + − −
=
∞
∑π π22 2
2
1
1 2 1m
m
m
m(14)
and for large t approaches the same steady-state value as givenin eqn. (7).
Eq. (14) is the simplest example of a Clark sensor timeresponse for a step change in sample PO2
, and when solving thisequation workers normally assume four-electron (i.e., n = 4)stoichiometry for the reduction of oxygen at the cathode, andtherefore take no account of disturbed stoichiometry or multi-dimensional diffusion. These extra complications have beendescribed, however, in some depth, in the book by Lineket al.,27 where models with hemispherical and cylindricalcoordinates are considered. Furthermore, these more complexmodels have also been adapted by Linek et al. to take account ofthe influence of the various combinations of the electrochemicalreactions (2 ≤ n ≤ 4) taking place within the electrolytelayer.
Pulse amperometry. The ‘switch-on’ current transient, whichoccurs when the polarising voltage is pulsed, is the mostcomplex of all the models.
An analytical description of the sensor current transient,following the polarising voltage switch-on, for the one-dimensional diffusion model described by Fig. 6, was firstdescribed by Mancy et al.39 in 1962. They produced analyticalcurrent-time solutions for a macro-cathode membrane-covered
Fig. 8 Co-ordinate system of the cylindrical diffusion model for a PO2
sensor, with micro-disc cathode (radius R) and electrolyte and membranelayer thicknesses e and m, respectively. Diffusion in the membrane isassumed to be one-dimensional.
Analyst, June 1998, Vol. 123 67R

Clark sensor, with a steady sample PO2at the membrane surface.
Their analytical solutions can be broadly divided into three timeintervals, namely at very short times when oxygen diffusion waslimited to the electrolyte layer alone, at intermediate times whenthe diffusion layer had entered the membrane and there wasjoint transport control and, finally, at long time intervals whenthe diffusion layer had spread right into the membrane and wasapproaching the outer face of the membrane. By noting that, inpractice, de < dm and Dm ≈ 1022 De, the Mancy solutions canbe summarised as follows.14
(1) At very short time intervals, diffusion in the electrolyte layeralone is rate limiting and the sensor current is given by
i nF RD
tp
n d
D ts
n
=
+ −
=
∞
∑ππ
α21 2 2 2
1
1 2ee
e
e
/
exp(15)
where ae is the oxygen solubility in the electrolyte layer.Since de is typically 5–10 mm and dm is typically about20 mm, then eqn. (15) will only hold for t < 0.1 s, since thediffusion layer must be confined to the electrolyte film.Under these conditions,
i nF RD
tp≈
π α
π2
1 2
ee
s
/
(16)
(2) At short time intervals, when the diffusion layer has enteredthe membrane (but has not reached the face of the membraneadjacent to the sample) there is joint transport control andthe sensor current is given by
i nF RD
tp
n d
D tn
=
+ −
=
∞
∑ππ
α21 2 2 2
1
1 2mm s
m
m
/
exp(17)
This equation can be reduced to a simpler form by notingthat typically b ≈ 20 mm and dm ≈ 1023 m2 s21, and thusthe sensor current can be approximated to
i nF RD
tp=
π α
π2
1 2
mm
s
/
(18)
Eqns. (16) and (18) are similar because, in both cases,diffusional transport is controlling.
(3) At long time intervals, the diffusion layer will have spreadright into the membrane and will be approaching the outerface of the membrane. The current will therefore beapproaching its steady-state value, and under these condi-tions Mancy et al. gave the current as
i nF RP
d
n D t
dn
= +
=
∞
∑π π22 2
2
1
1 2m
m
m
m
exp(19)
and the steady-state current, when the exponential termbecomes negligible, is therefore
i nF RP
dp= π 2 m
ms (20)
This is exactly the same solution as given by eqns. (7) and(11) when transport in the membrane only is of im-portance.
Fig. 9 shows a theoretical plot of sensor current againsttime,13 together with the details of the section of the timeresponse corresponding to the Mancy equations. The values forthe physical parameters of the electrode used in this model aregiven in the book by Hitchman.13
Eqns. (16) and (18) are expressions of the well knownCottrell equation, and Myland and Oldham40 later reworked theMancy theory to describe the current–time behaviour anddiscussed the role of the various geometrical, transport andsolubility factors which could affect this behaviour. Again, thisanalysis was confined to one-dimensional diffusion (i.e., macro-
cathodes) and the Myland and Oldham equations were analysedto predict the duration of the sensor Cottrellian behaviour, andthe interval before the onset of the steady-state sensor current,for gas-phase or liquid-phase sensors. Although both Mancyet al.39 and Myland and Oldham40 made it clear that their theorywas applicable only to one-dimensional diffusion in all threelayers, their theoretical predictions have been mistakenlyextended to include membrane-covered micro-disc electrodesfor which diffusion is two-dimensional. The reason for this ispossibly because both unshielded micro-disc electrodes andshielded macro-disc electrodes demonstrate a Cottrellian tran-sient, following a step change in potential. This makes ittempting to assume implicitly that the same behaviour willfollow when a micro-disc electrode is shielded by a mem-brane.41 Unfortunately, this supposition is erroneous, and wecannot extrapolate the (one-dimensional) Mancy theory to thetype of microdisc cathode Clark PO2
sensor used in medicineand biology.41
This is unfortunate, since inspection of eqn. (16) revealsimportant potential theoretical advantages for a pulsed Clarksensor. Eqn. (16) shows that the sensor current should beproportional to t21
2 for the short time intervals before thediffusion layer reaches the membrane, and therefore a plot of iagainst t21
2 should reveal a straight line of zero slope for thistime epoch. This epoch should therefore define the time span(after the onset of the pulse) during which the sensor current isindependent of the membrane characteristics. If the sensorcharacteristics were to be confined to electrolyte parametersonly (or, at the worst, only weakly dependent on the membrane),then a thin membrane which has a fast time response to changesin oxygen concentration could be employed with the sensor.This ideal and theoretical scenario (i.e., membrane independ-ence) would reduce sensor calibration drift, reduce the problemof membrane fouling, which can ruin sensor performance, andminimise (or theoretically eliminate) the problem of the blood-gas difference effect. Another crucial advantage would havebeen that the sensor could be used as an absolute measuringdevice [i.e., current output could be determined from aknowledge of the physical parameters of the sensor contained ineqn. (16)]. It could therefore be calibrated in the gas phase andthen used in the blood phase without need of furtherrecalibration, because the current output would be independentof the membrane material or properties such as ageing,stretching.41 This would be particularly advantageous forintravascular, or in vivo sensors, of the type described in thein vivo analysis. Unfortunately, all these ideal attributes haveproved to be wishful thinking for the micro-cathode Clarksensors used in clinical medicine. There are two reasons forthis.
First, membrane-covered Clark sensors, when pulsed inpractical situations, produce a non-Faradaic current for an ill-
Fig. 9 Variation of current per unit area with time for the one-dimensionalmacro-cathode PO2
sensor theory. The values for the physical parameters ofthe electrode model are given in the text. (Taken from ref. 13.)
68R Analyst, June 1998, Vol. 123

defined time epoch immediately following the voltage pulse.41
The important thing to note here is that an aqueous solution hasbeen used as the electrolyte and that a four-electron reaction hasbeen assumed to take place. Experiments conducted with eithermacro- or micro-cathode membrane-covered Clark sensorsindicate that the simple ‘Faraday current only’ assumption,common to all the one- and multi-dimensional mathematicalmodels, breaks down in real practice. This phenomenon hasbeen reported time and again, and various suggestions for thisnon-Faradaic time current have been put forward, including theelectrode resistance–capacitance discharge time constant, sen-sor geometry and design and the simultaneous electrochemicalreduction of some other species in the electrolyte.14,27,41 Thefact that the same micro-disc sensor with the same membrane,but with a non-aqueous solvent such as dimethyl sulfoxide(DMSO) used as the electrolyte solution,41 does not demon-strate the long-lasting non-Faradaic current phenomena whenpulsed might indicate that the problem lies with disturbed four-electron reaction stoichiometry. However, since this long-lasting current is still seen when oxygen is totally excluded fromthe sensor (i.e., when the sensor is pulsed in the presence ofnitrogen only), the problem cannot simply be due to disturbedreaction stoichiometry. The non-Faradaic current problem,observed using aqueous electrolytes, is still unresolved.
Second, and very important, the failure of the micro-cathodeClark sensor to display Cottrellian behaviour at any time pointduring the duration of the voltage pulse is due to the radialdiffusion of oxygen to the micro-cathode through the electrolytelayer. Gavaghan and co-workers41–44 have reworked the three-layer cylindrical diffusion model, using digital simulationtechniques to describe the relationship of the sensor current tomicro-cathode size and electrolyte and membrane layer charac-teristics, when the polarising voltage is pulsed. Their solutioninvolved solving the Fick equation:
δδ
δδ
δδ
δδ
p
tP
p
r r
p
r
p
z= + × +
2
2
2
2
1
in the separate electrolyte, membrane and sample layers usingsimilar boundary conditions to those shown in the steady-statecylindrical diffusion model section, with the exception that thepartial pressure at the micro-disc cathode was now taken to bezero immediately following the polarising voltage switch-on.
Also, the previous constraint that diffusion was one-dimensional in the membrane layer was relaxed, and diffusionwas treated as two-dimensional in this layer—as in the sampleand electrolyte layers. All equations, in all layers, were solvednumerically and simultaneously as functions of time, t. Thesensor time-varying current, in this case, is given by
i t nFPp
zr r
R
z
( ) =
∫ =
20
π δδe
o
d (21)
Gavaghan and Rollett45 used an alternating direction implicit(ADI) method to solve the simultaneous equations in a uniformrectangular mesh superimposed on the finite region of Fig. 10,which was then matched to a truncated series solution in theregion of a singularity which occurs at the cathode edge. Theboundary conditions on z = 0 ensure that there is a discontinuityin the first derivative of the oxygen partial pressure at the pointr = R, z = 0, and this forms a ‘boundary singularity’ at thispoint. The numerical simulation of these equations show thatthe i-t21⁄2 behaviour for a micro-disc cathode (diameter< 100 mm) is decidedly non-Cottrellian for all t values. Theconclusion of this work was therefore that analytical solutionsto the Fick diffusion equation would not produce predictionswhich matched practice and that, for the type of micro-discClark sensors used in medicine and biology, it is necessary toresort to less transparent numerical computations in order topredict the electrochemical sensor behaviour.
This becomes even more important when predicting thebehaviour of a Clark PO2
sensor when it is switched both on andoff with a variable duty cycle. Gavaghan et al.44 later extendedtheir work to produce a theoretical computer simulation of thispractical situation, and it is clear that future electroanalyticalchemistry models describing non steady-state membrane-covered micro-disc cathode behaviour must be based oncomputer simulation and not on analytical expressions.
In-vivo analysis
As stated in the Introduction, there is still disagreement betweenclinicians over the clinical necessity, or cost effectiveness, ofmeasuring PO2
in the blood with intravascular sensors. Since theuse of an in vivo sensor necessitates the electrochemicaltransducer into a patient's artery, such measurements are notundertaken lightly and there must be compelling reasons forperforming such measurements. Historically, such a compellingreason arose from the need to monitor, on-line, the arterial PO2
in newborn infants suffering from respiratory distress.46–48
Arterial PO2measurements are particularly important in the
neonatal period (the first month of life) since a high arterial PO2
( > 11.3–13.3 kPa) will lead to damage to the capillaries of theretina in the eye, producing irreversible blindness (retrolentalfibroplasia), and too low a PO2
( < 7.3 kPa) can lead to tissuehypoxia and brain damage. Early intravascular PO2
electrodeswere therefore designed with infants, and not adults, in mind.48
The size of these electrochemical sensors, typically 1.4 and1.7 mm od, presented no great difficulty in neonatal work, sincethey could be inserted safely into the umbilical artery of theinfant. However, these sensor sizes would present greatdifficulty for safe insertion into an adult artery. IntravascularPO2
sensors small enough to be inserted into adult arteries (0.6mm diameter) were produced later,49 but their use has beenseverely limited to those centres which have the technicalexpertise to calibrate them and use them.
The above ethical and practical reservations do not apply tophysiological investigations in non-human subjects, and re-search into the development of in vivo animal PO2
sensorsbegan, remarkably, immediately following the original Clarkpublications. In the late 1950s, Kreuzer and Nessler50 publisheda description of a catheter-tip PO2
sensor, using a 0.8 mmdiameter cathode in a polyethylene catheter, with a thin Teflonmembrane held on the end with a stainless-steel ring. The ring
Fig. 10 Two-dimensional solution region and equations used to model thetime-dependent oxygen diffusion processes in a membrane-covered micro-disc cathode PO2
sensor. The oxygen partial pressures have been normalisedto pA = p/ps, where ps is the initial sample partial pressure of oxygen.
Analyst, June 1998, Vol. 123 69R

did not provide enough tension on the membrane, making itsensitive to arterial blood pulse pressure. One year later, Krogand Johanson51 described an intravascular sensor constructedwith platinum and silver electrodes, on the tip of a cardiaccatheter, and using Teflon as the membrane. Following thesepioneering efforts, a multitude of intravascular PO2
sensors weredevised, mainly for use in animals, but sometimes used inhuman studies lasting several hours.52 Although these earlycatheter electrodes were plagued by pressure sensitivity, thissensitivity was finally eliminated by the use of membranestightly stretched over the cathode. The construction anddevelopment of these devices, up to the 1980s, has beendescribed by Kreuzer et al.25 and by Hahn.15
There has not been much progress in this field since the1980s, perhaps owing to a combination of several disparatefactors. First, there is the inevitable clinical reluctance to useintravascular devices which can cause blood clotting in anartery and create thrombosis, or introduce a potential source ofinfection. Other major practical problems include thrombousformation on the sensor membrane itself, which degrades sensorperformance, the slow response time of the biocompatiblemembrane material, sensor sensitivity to blood flow, effects ofvariations in the patient's temperature on the sensor outputcharacteristics and the sheer magnitude of the problemsassociated with calibrating the sensor in vivo.
Most of these problems, including those of calibration, havestill to be overcome. In vitro electrochemical sensors, built intobench blood-gas analysers, can be calibrated at will and theirperformance can be checked and monitored by quality controlmaterial. This is not the case for an intravascular electro-chemical sensor, which must be calibrated in situ. This willinvolve taking an arterial blood sample from the patient,inserting it into a ‘gold standard’ bench analyser and theninserting the true PO2
value into the electrochemical controlinstrumentation controlling the intravascular sensor. Out ofsheer necessity, this will involve a ‘single-point’ calibration,and the clinician will have no idea whether this is adequate ornot, or whether the transducer is truly linear in its response tochanges in PO2
.The question of time response is also difficult to deal with. A
membrane which is highly permeable to oxygen will give a fasttime response (say of the order of 1 s), but this will increase theoxygen flux through the membrane very considerably and willtherefore introduce a large blood-gas difference effect. This, inturn, will make the sensor highly sensitive to blood flow acrossthe membrane face. A less permeable membrane will reducethis flow effect, but will inevitably lead to a long time responseto changes in arterial PO2
. An inevitable compromise thereforehas to be struck, and a material such as polyethylene orpolystyrene is chosen as the membrane, in order to minimise theflow effect. The usual consequence of choosing this material isthat the sensor response time to a step change in PO2
is typicallyof the order of 60–90 s to 95% of the final response.15 This iscertainly too slow to follow fast physiological changes, but willprovide an indication of slower trends in arterial PO2
, overperiods of several hours.
As explained in the mathematical model section, thepossibility of using pulse amperometry to control the electrodehas not proved successful in practice. Theoretically, pulsingwould appear to be an ideal electrochemical control modality,but the non-Faradaic current following the onset on the pulseappears to render the technique useless for present-dayintravascular sensors which use aqueous electrolyte layers.41
The development of electrochemical intravascular PO2sen-
sors has therefore remained fairly static over the past decade,with little progress being made either in their utilisation ordevelopment. Two sensors which have stood the test of time arethose first described by Parker and co-workers46,47 in 1971 andMindt and co-workers in 197349 and 1979.53 These are shown in
Figs. 11 and 12, since they illustrate two separate approaches tosensor design. Fig. 11 shows the Parker dip-coated catheter PO2
sensor, built into a bi-lumen poly(vinyl chloride) (PVC)catheter. The electrode is at the tip of one lumen of this double-lumen tube, and a rubber-modified polystyrene membrane isdip-coated on to the tip. Prior to this dip-coating, KCl crystalsare dip-coated on to the cathode-reference surface and theelectrode is sterilised by gamma irradiation after packing andstored dry. The cathode and the anode are silver. The sensor inactivated in situ by water transport across the membrane, after ithas been inserted into the artery. The second lumen is used toobtain blood samples, which are then introduced into the benchblood-gas analyser to calibrate the catheter sensor. The outsidediameter of the sensor is either 1.4 or 1.7 mm, making thissensor suitable for insertion into the umbilical artery of aninfant. The characteristics and time response of this sensorcould best be described by linear one-dimensional diffusion.
A later variation in intravascular sensor design was that ofMindt and co-workers,49,53 illustrated in Fig. 12. The geometryof this sensor was completely different to that of theconventional end-on sensors. The Mindt sensor obeys cylindri-cal diffusion, since the catheter body itself forms the membrane,and the end of the sensor is designed to be thick enough to berelatively impermeable to oxygen, as illustrated in Fig. 12. Boththe anode and the cathode are fine silver wires, and theelectrolyte solution is sealed into the catheter with epoxy resin.Hahn15 described the steady-state oxygen transport equationsfor this type of sensor, and derived the sensor current outputas
inFLp
r r P r r P=
+[ ]2
2 1 3 2
π s
e mln( / ) / ln( / ) /(22)
where r1 is the wire cathode radius, L is the wire cathode length,r2 is the inner catheter membrane radius and r3 is the outermembrane radius.
The simplicity of the Mindt design and the stability of itsperformance characteristics have ensured its longevity. It is
Fig. 11 Dip-coated catheter PO2sensor, built into a bi-lumen PVC
catheter. One lumen houses the electral connections to the sensor and theother lumen is used to obtain blood samples for calibrating the sensor insitu.
Fig. 12 In vivo PO2sensor which uses a polyethylene catheter as the
membrane. Both the anode and cathode electrodes are silver wires, and theelectrolyte solution is permanently sealed into the catheter body. A solid‘plug’ at the catheter tip ensures that only radial oxygen diffusion reachesthe silver wire cathode.
70R Analyst, June 1998, Vol. 123

commercially available for use in adult human monitoring,since its outside diameter is 0.65 mm. Its other advantage is thatits electrolyte is in liquid form, and the electrode does not needto be activated in situ.53 Sterilisation is achieved by gammairradiation, as with the Parker design.
One important factor to note about the above two sensors isthat they both use silver as the cathode material. This presentsanother, previously unmentioned, problem concerning the useof intravascular PO2
sensors. Since these sensors are only goingto be used, out of clinical necessity, with severely ill patients, itis almost inevitable that they are going to be used in somepatients who have recently been anaesthetised, or are under-going anaesthesia. Two of the commonly used anaestheticagents, nitrous oxide (dinitrogen oxide) and halothane, havebeen discovered to be extremely electroactive on silver cathodesurfaces, and either of these agents can give rise to a ‘pseudo-oxygen’ signal on the sensor display system. This thereforecauses the sensor to ‘fail dangerously’, and this topic will bedealt with in the Anaesthetic agents section.
Since the electrochemistry of the catheter tip intravascularsensors is identical with that for the in vitro sensors, there is nonew electrochemistry to add here. Because the electrochemistryis established, the haemo-compatibility of the intravascularsensor itself remains the key chemical problem to be solved, ifthese sensors are to realise their clinical potential. The mostimportant unresolved component of an intravascular sensor isthe membrane which is in direct contact with the blood. It istherefore important to try to ensure that the various bloodcomponents (water, proteins, red blood cells, white blood cells,platelets and ions) do not react with the membrane surface, andso alter its characteristics. This problem has still not beenresolved successfully over the past four decades, but perhaps themost significant recent advance in this area has been made byZhang and co-workers.54,55 This group has experimented withcoating conventional intravascular PO2
sensors with a novelcopolymer, poly(MPC-co-BMA), with an electrically neutralhead group, 2-methacrylyloxyethyl phosphorylcholine (MPC)copolymerised with butyl methacrylate (BMA), which mimicsthe lipid bilayer structure of the red cell membrane. Thismaterial, and some other biomembrane mimetic polymersurfaces,55 can significantly reduce protein absorption, plateletadhesion and thrombous formation. Zhang and co-workers54,55
therefore coated two types of intravascular sensor, one based onthe conventional intravascular sensor (Fig. 11) and the otherbased on the Mindt design (Fig. 12) with poly(MPC-co-BMA)and showed dramatic improvements in sensor performancewhen compared with similar sensors not coated with thecopolymer. Scanning electron microscopy showed that sensorscoated with MPC-co-BMA were effectively free of absorptionof blood components on their surfaces.56 Since MPC-co-BMAhas poor mechanical properties, it was coated on to conven-tional intravascular sensor membranes such as polyetherur-ethane (PU) or PVC. An up-to-date account of the haemo-compatibility of various invasive sensors can be found in arecent review by Benmakroha et al.57 If these recent develop-ments do prove successful, there may well be a resurgence in theinterest of developing intravascular PO2
sensors, especially ifthe sensor response time can be reduced to @1 s by using high-permeability membranes, and then reducing the blood-gas, orflow effect, by means of electrochemical control techniquessuch as pulse amperometry or high-speed voltammetry, wherethe electrochemistry only occurs for a defined period and is thenswitched off during a relaxation period.
Transcutaneous sensors
Gerlach,58 in 1851, investigated experimentally the O2 and CO2gas exchange between skin and ambient air in animals andhumans. One hundred years later, Baumberger and Good-
friend59 reported the determination of arterial PO2in humans
through the intact skin, by immersing a finger into a phosphatebuffer solution at 45 °C and measuring its PO2
using a dropping-mercury electrode. These findings were confirmed in 1957 byRooth et al.,60 who used a large bare platinum electrode tomeasure the PO2
.59 A decade later, Huch et al.61 showed thatafter drug-induced hyperaemia, PO2
values very close to arterialoxygen partial pressures could be measured with surface PO2
sensors on the skin of newborn babies. Practical PO2sensors
were then developed using electrical heating to warm the skin to42–43 °C, and these first PO2
sensors were called ‘transcuta-neous’ sensors.62,63 The sensor (shown schematically inFig. 13) is basically a Clark sensor housed behind a membrane,which also incorporates an electrical heating element to warmthe skin. Two thermocouples measure the temperature of theheating element and the temperature of the skin, to ensure thatthe patient is not burned.
Later developments of this sensor led to the development ofa similar sensor for CO2
64 (based on the Stow–Severinghaussensor) and then to the development and testing of combinedO2–CO2 transcutaneous sensors,65 as shown in Fig. 14.
Despite the obvious, and attractive, advantages that suchsensors do not involve taking a blood sample from the patient orinserting a catheter into an artery, they have proved to besuccessful only in babies and small children. The potential riskof burning the patient is always present, and the location of thesensor needs to be changed every 2 h or so, to ensure that ablister-forming injury (second degree burn) does not form.Obviously, the incidence of burns is a function of the electrodetemperature and the length of time the electrode is left in thesame location on the patient’s skin. However, the PO2
measured
Fig. 13 Schematic cross-sectional diagram of a transcutaneous PO2sensor,
showing the main constituent parts. The platinum cathode is typically20 mm in diameter. A small heating element and an NTC resistor are locatedinside the silver anode for measurement and control of the sensortemperature. 1, epoxy resin; 2, retaining ring; 3, O-ring; 4, Teflonmembrane; 5, cuprophane spacer; 6, platinum cathode; 7, silver anode; 8,heating element; 9, NTC resistor; and 10, electrolyte chamber. (From FriisHansen, B., Marstrand-Christiansen, P., Vesterager, P., and Jacobsen, E.,Scand. J. Clin. Lab. Invest., 1976, 37, Suppl., 146.)
Fig. 14 Schematic diagram of a combined O2–CO2 transcutaneous sensor.(From Mahutte, C. K., Michiels, T. M., Hassel, K. T., and Trueblood, D. M.,Crit. Care Med., 1984, 12, 1063.)
Analyst, June 1998, Vol. 123 71R

by a transcutaneous sensor not only reflects the arterial bloodPO2
, but is also influenced by physiological changes such asperipheral blood perfusion and the core temperature of thepatient. When the patient is in shock, or is hypothermic, thetranscutaneous PO2
measurement no longer correlates withcentral arterial PO2
, and the device will under-read the arterialPO2
. This can be potentially dangerous with some patients, sincethe transcutaneous PO2
may indicate that the patient is hypoxic(because the sensor is under-reading the true PO2
) and thepatient might then be given added oxygen to breath. Forchronically sick patients with some respiratory diseases, thisprocedure can endanger the patient's life.
Hence, the transcutaneous sensor is not used routinely withadults, and its use has been mainly confined to special care babyunits. Since the electrochemical principles of the Clark O2 andStow–Severinghaus CO2 electrodes contained in transcuta-neous sensors have already been described in previous sections,no further comments will be made on this particular type ofsensor.
Anaesthetic agents
Two inhalational anaesthetic agents, nitrous oxide (dinitrogenoxide; N2O) and halothane (CF3CHClBr), have been found tobe electrochemically active, in aqueous electrolytes, on thecathodes of Clark PO2
sensors, at the polarising voltagescommonly used with them. The sensor currents generated bythese two anaesthetic agents have been found to be additive tothat of oxygen reduction, thereby producing a ‘pseudo-oxygen’current which suggests that there is more oxygen present in thesample than there is in reality. The oxygen measuring devicescan therefore over-read, and this is a highly dangerous situationsince a life-threatening hypoxic episode may be occurring in thepatient and yet the O2 sensor is indicating that the blood oxygenpartial pressure is ‘normal’ or even ‘high’. In fact, it was theobservation of suspiciously ‘high’ blood PO2
’s, in the presenceof N2O and/or halothane when there was a much lower inspiredoxygen gas partial pressure, which alerted clinicians andscientists to the fact that conventional Clark O2 sensors werealso reducing molecules other than oxygen.66–73
Apart from nitrous oxide and halothane, no other inhalationalagent has been found to be electroactive using the polarisingvoltage window available in aqueous electrolytes, and theseother anaesthetic agents can be treated as ‘inert’ gases as far asthe sensor aqueous solvent electrochemistry is concerned.Similarly, no inhalational anaesthetic agent has yet been foundto interfere electrochemically with the Stow–Severinghaus PCO2
sensor, since its measurement principle is based on potentio-metry.
The electrochemical reduction of nitrous oxide and halothanein aqueous solvents appears to depend critically upon the metalused as the working electrode, in addition to the polarisingvoltage employed. This will be described in the following twosections.
Nitrous oxide
The history of the electrochemical reduction of nitrous oxide inaqueous solutions has followed a staccato pattern over the pastthree decades.74–80 Early attempts to reduce N2O with Pt, Au,Hg or Pb electrodes showed that it was either inactive, or at bestgave only a transient reduction current.81 Much of this earlywork was conducted in acid solutions, using macro-electrodesand in the absence of oxygen, presumably because the reductionof O2 might interfere with the interpretation of the resultsobtained. During this period of initial interest, Johnson andSawyer80 specifically examined the electrochemical reductionof N2O on platinum electrodes in alkaline solutions of pH 10and 14. Their experiments did not reveal any N2O electrode
activity on Pt surfaces until the surface was deliberately pre-treated. When their platinum electrode had obtained a freshplatinum surface, formed by the prior reduction of a platinumoxide film, the reduction of N2O was found to proceed at apolarising potential of -0.8 V (pH 14) or -0.65 V (pH 10). Theirdata clearly established that the N2O molecule had to beabsorbed on the Pt electrode surface before reduction wouldtake place, and that the dependence of the N2O reduction currenton electrolyte composition was due to the change of potential ofdesorption towards more positive values as pH increased. Theytherefore proposed that the reduction of N2O on a PtO surfacefollowed the sequence80
PtO + 2e2 + H2O ? Pt* + 2OH2 (23a)
Pt* + N2O ? Pt(N2O) (23b)
Pt(N2O) + 2e2 + H2O ? Pt* + 2OH2 + N2 (23c)
Overall, the process could be expressed as
N2O + H2O + 2e2 ? N2 + 2OH2 (23d)
This work clearly indicated that N2 was formed as a product ofthe reaction, in aqueous alkaline solutions, their resultscorroborated those of Zagorski and Suwalski,79 who had, a yearearlier, examined the electroreduction of N2O with a dropping-mercury electrode in both acidic and alkaline solutions.Although Zagorski and Suwalski failed to produce limitingcurrents for N2O reduction, their experimental results showedclear erratic N2O reduction current oscillations, whose ampli-tude grew more and more as the potential was driven morenegative. They concluded that the average current intensity, at achosen potential, was proportional to the concentration of N2O,and we can now deduce that the reduction current oscillationswere due to the formation of N2O bubbles from the reductionprocess eqn. (23).
Matters seem to have lain at rest at this point, since mostClark sensors used in medicine and biology employed Ptelectrodes and aqueous electrolytes with a pH close to 7.0, andJohnson and Sawyer's work had concluded that N2O would beelectrochemically inert on non-pre-treated Pt surfaces. Underthese circumstances, N2O would not be expected to beelectrochemically active and, in any case, the solvent decom-position potential would be certainly too low to enable the N2Omolecule to be reduced. It was therefore clearly assumed, at thattime, that N2O was not reducible and would not interfere withblood or gas PO2
measurements. However, a second wave ofinterest in the electrochemical activity of N2O was alreadybeginning to emerge, when clinicians reported that PO2
measurements could, in fact, be affected by the level of N2O ina blood or gas sample.70,71,73 This ‘interference’ effect wasreported70 to be intermittently present in conventional Clark Ptcathode PO2
sensors, but was found to be consistently present inan Au cathode respiratory PO2
sensor. This effect, whichcorresponded to a ‘pseudo-oxygen’ signal of 7–15% (dependingon the polarising voltage) in the presence of pure N2O gas wasconfirmed on the examination of a Beckman LB1 O2 gasanalyser, which incorporated a Clark-type sensor with a goldcathode. When pure N2O was introduced to the gas analyser, theanalyser signal read between ‘1% and 5% O2’. The mostpuzzling feature of this N2O interference effect was that itappeared to occur on gold electrodes used in the clinicalenvironment, but not on gold electrodes used in the electro-chemistry laboratory. This dilemma was resolved when it wasrealised that the clinical sensor Ag/AgCl reference electrodewas the culprit, with silver ions from the reference electrodebeing plated out on the working cathode of the clinical sensor.70
Silver can be easily plated onto either Pt or Au, but the layer isso thin that it is invisible to the eye. However, this silver layeris certainly very electroactive. Detailed studies soon revealedthat N2O was reduced quantitatively in the potential region
72R Analyst, June 1998, Vol. 123

21.5 to 21.6 V (versus Ag/AgCl) on pure silver electrodes, andthat when the reduction process proceeded gas bubbles began toappear on the electrode surface. It was found that the half-wavepotential was independent of pH indicating that the rate-determining step in the reduction was the transfer of the firstelectron to N2O and this reaction scheme was written asfollows:
rate determining step:N2O + e ? N2O2
fast steps:N2O2 + H2O + e ? N2 + 2OH2
and so the overall reaction isN2O + H2O + 2e ? N2 + 2OH2
agreeing with Johnson and Sawyers’ conclusion [eqn. (23d)].The fact that the reaction took place on Ag, and not on Pt or
Au, and that the transfer coefficient was 0.28 (i.e., significantlyless than 0.5), showed that the first step was not an outer-sphereelectron transfer, but that the N2O must have been absorbed onthe electrode surface probably through a bond between theoxygen atom and silver.70 This work was conducted in thepresence of oxygen, and this highlights the important axiom thatelectrochemical experiments on clinical sensors must beconducted under those conditions which are expected to befound in clinical practice–for example, experimental resultsobtained in the absence of oxygen might be totally different tothose obtained when oxygen is present in abundance.
These studies on the electrochemical reduction of N2O andO2 in the presence of each other revealed clearly separated O2and N2O reduction waves,70 as illustrated in Fig. 15, whichshows voltammograms obtained with a 0.66 mm diameter Agdisc cathode, covered with a 12 mm Teflon membrane, whenhoused in a Clark sensor body (Fig. 4) at 25 °C. The O2–N2Ogas mixture was varied between 0 and 100% v/v for each gas,with the other making up the balance. The net result was a seriesof O2 and N2O voltammograms as shown in Fig. 15, each withclearly identified and separated half-wave potentials and goodplateaux.
The absolute size of the current is a reflection of the transportproperties of the membrane for O2 and N2O and, apart from thenumber of electrons involved, the ratio of the N2O and O2currents is governed by the permeabilities of these two gases inTeflon.
When the limiting currents for O2 and N2O (corrected in thiscase for the O2 current) were plotted against the percentage ofeach gas in the mixture, straight line relationships were obtainedshowing that nitrous oxide concentration (in addition to oxygen)could now be measured electrochemically.
Following the report which clearly indicated that N2O couldbe reduced electrochemically on silver contaminated surfaces,70
other reports then began to appear on oxygen gas analysersfailing dangerously in the presence of N2O, on blood-gasanalysers becoming sensitive to N2O and so leading to thepotential non-diagnosis of arterial hypoxaemia,71,73 and on anintravascular PO2
blood sensor grossly over-reading in patientsbreathing O2 and N2O gas mixtures.82,83 The intravascularblood PO2
sensors which were commercially available in the1970s often employed silver cathodes. Because silver has amuch wider electrochemical reduction voltage window than Pt(at the same electrolyte pH), silver cathode PO2
sensors were(and are) exquisitely sensitive to N2O, if the polarising potentialis not kept low enough to escape the rising portion of the secondreduction (N2O) wave (Fig. 15). Clinical reports, published atthat time, which used Ag cathode intravascular PO2
sensors inthe presence of N2O, appeared to be unaware of this ‘fail-dangerous’ phenomenon.84
One positive outcome of this work was that it was realisedthat a Clark-type sensor, employing a silver micro-discelectrode and a conventional aqueous electrolyte solution, couldbe used for the simultaneous determination of O2 and N2O ingas or blood.70,85 Since the outcome of the N2O reductionprocess was the formation of N2 gas bubbles [eqn. (23d)], whichrapidly occluded the electrode surface and prevented any furtherelectrochemistry occurring, the Ag micro-cathode membrane-covered sensor could not be polarised in the conventionalconstant-potential manner. The solution to this problem was toemploy a train of polarising voltages in a pulsing regime (withan appropriate duty cycle) to avoid the build-up of N2 on themicro-electrode surface.86 The first voltage pulse was used toreduce O2 and the second to reduce both O2 + N2O. Since thesimultaneous O2 and N2O reduction processes did not interferewith each other, the current obtained from the second pulse wassimply an addition of the O2 and N2O reducing currents.87 Anappropriate computer algorithm was therefore employed todeconvolute the O2 and N2O current–concentration contribu-tions. The determination of the appropriate duty cycle to employunder these experimental conditions can be obtained fromanalysis of the digital pulse simulation procedure described inthe computer model simulation section.
In 1982, a novel prototype O2–N2O ‘sandwich electrode’ wasdescribed,88 based on a metallised membrane PO2
sensor byBergman,89–91 to measure O2 and N2O in gas mixtures. Theoutline design is shown in Fig. 16 and it comprised two separateelectrochemical sensors. The first sensor was a Teflon mem-
Fig. 15 Voltammograms for O2–N2O gas mixtures, obtained with amembrane-covered (12 mm Teflon) 0.66 mm diameter electrode, showingdistinct and separate plateaux for O2 and N2O reduction.
Fig. 16 Schematic cross-sectional view of a composite O2–N2O sandwichelectrode. A nylon spacer is inserted between the metallised membrane andthe inner (second) macrodisc cathode. (Taken from ref. 88.)
Analyst, June 1998, Vol. 123 73R

brane with one surface coated with a thin layer (5–10 nm) ofgold, deposited by vacuum evaporation. This layer, whenpolarised at -0.6 V formed an oxygen filter, which effectivelyscrubbed all oxygen from any gas sample diffusing through themembrane. The limiting current generated at the metallisedlayer was proportional to the PO2
of the gas sample. If the gassample contained N2O, these molecules passed through themembrane (since they were not reduced at 20.6 V, on Ausurfaces) to the second sensor, which consisted of a silver disccathode (3 mm diameter) which was pulsed with a regimesimilar to that described above for the intravascular sensors.Thus, the N2O concentration in the gas mixture was measuredby pulse amperometry at the second cathode.
It was hoped that this design would also facilitate theelectrochemical measurement of halothane (see the nextsection) and so create a composite O2 + N2O + halothane sensor,but technical difficulties precluded any further development,despite its success at measuring O2 + N2O simultaneously.
More recently, there has been yet another resurgence ofinterest in the electrochemical reduction of N2O on metalelectrodes, but this more recent work (with one exception) hasbeen confined to the non-clinical area.92–96 The one exception isthe discovery that N2O can be reduced on gold micro-electrodesin aprotic media, and this will be described further in the non-aqueous section of this review.
Halothane
Halothane was the first satisfactory non-explosive and potentinhalational anaesthetic agent. It is a fluorinated hydrocarbon,liquid at room temperature, with the structural formulaCF3CHClBr, and was synthesised in 1951.97 By the late 1950s,clinical evaluations of halothane showed that it was effectiveand safe in a wide assortment of clinical conditions and in allage groups, and its great versatility became apparent. Halothanetherefore rapidly spread into worldwide use, and it is still in usetoday despite worries concerning its hepatotoxicity. What wasnot realised, in the early days following its introduction toclinical practice, was that halothane was electrochemicallyactive on both silver and gold surfaces.
The reasons for not observing this electrochemical activityare as follows. Halothane is a large molecule, with a relativemolecular mass of 197, and so the membranes used inconventional Clark blood-gas sensors, such as polypropyleneand Teflon, provide a natural barrier to the potential penetrationof the halothane molecule to the sensor cathode surface.Furthermore, if a conventional Pt surface is uncontaminatedfrom the deposition of Ag+ ions, the halothane molecule is‘reluctant’ to be reduced on the ‘clean’ (platinum) surface. Itneeds a long dwell time of a blood sample, containinghalothane, in the analysis chamber of a blood-gas analyser,combined with a membrane reasonably permeable to halothaneand a silver-contaminated platinum micro-cathode surface,before electrochemical activity is observed.
However, these particular and necessary requirements can bemet in clinical practice and Severinghaus et al.,98 in 1971,reported that conventional Pt micro-cathode membrane-coveredClark sensors could become extremely sensitive to the presenceof halothane vapour (over-reading the PO2
for room air by up to1600%), following a 5 min exposure of the sensor to a gaseoussample of halothane vapour in N2. The sensor was covered witha 25 mm polyethylene membrane but when it was covered witha 25 mm polypropylene membrane the equilibrium withhalothane was delayed by about 20 min, probably owing to thereduced permeability of the polypropylene. (When covered withthis material, one sensor did eventually over-read by 800%,under the same conditions as before.) Severinghaus et al. foundthat the sensitivity of the O2 sensor to halothane depended uponthe polarising voltage, the membrane material, the electrolyte
pH and the deposition of Ag on the Pt cathode surface. Similarstudies conducted with oxygenated blood, brought into equilib-rium with 2.6% v/v halothane, demonstrated a slow upwarddrift of the sensor PO2
reading by 100% after 1 min. Thus, anearly clear warning was established that the presence ofhalothane, in clinical concentrations, could cause PO2
sensors toover-read dangerously.
This report was soon followed by further examples. Bateset al.,99 in 1975, reported that intravascular PO2
sensors withgold micro-cathodes and covered with a hydrophilic membrane(Hydron) were sensitive to halothane when polarised at 20.7 V,and the time required to achieve maximum halothane effect wasapproximately 18 min. Soon after this, Dent and Netter100
demonstrated that halothane (in the presence of oxygen) couldalso be reduced on gold micro-electrodes which had beenspecifically developed for measuring oxygen partial pressuresin micro-areas of living tissue during anaesthesia. Since it wasapparent from their work that the halothane and oxygenreduction waves overlapped, it was impossible to distinguishbetween the halothane and oxygen reduction currents, and sothis rendered the sensor useless for oxygen tissue measurementsin the presence of halothane anaesthesia. Their only solution tothis dilemma was the hope that a coating material permeable tooxygen, but impermeable to halothane, might be developed andso permit oxygen measurements to be made with their micro-electrode in the presence of halothane.100 These reports weresoon followed by a clear clinical warning, in a letter to TheLancet in December 1978,72 which highlighted the need forvigilance in exposing commercial blood-gas analysers to bloodsamples containing halothane. The letter described a gradualupward drift in the analyser PO2
readings, following halothaneexposure, and vigilance was emphasised because the errorsinduced dangerous over-reading of PO2
in critically ill patients.Following this warning, steps were taken either to abrade thecathode surface to remove silver deposition, or else to clean thePt surface regularly in a nitric acid solution in order to removepotentially harmful Ag deposits. However, the problem ofhalothane reduction on Ag or Au micro-cathodes used inintravascular sensors still remained unsolved, since thesesensors inevitably used hydrophobic membranes which werevery permeable to halothane molecules. The only solution wasto not use these types of intravascular PO2
sensors in thepresence of halothane anaesthesia.
The chemistry of the reduction of halothane is not clear-cut,since both the reaction mechanism and the role of the cathodemetal have been a matter of controversy. Early studies wereconcerned with the reduction of halothane on the dropping-mercury electrode and are of little relevance to clinicalsensors.101–103 The fact that these matters are still unresolved isperhaps due to the way in which studies in different centres haveemployed different experimental conditions, with large rotatingring-disc electrodes, large stationary wire electrodes or micro-electrodes being employed in some studies, and some con-ducted in the absence and some in the presence of oxygen. Mostof the studies were conducted at unshielded electrodes, with justtwo reported with membrane-covered micro-disc elec-trodes.104,105 Hence it is possible that the wide variety of resultsand mechanisms proposed are due solely to the particularexperimental conditions encountered when the studies wereconducted.
Albery and coworkers,104 in 1981, reported on the ampero-metric reduction of halothane in 1 m KOH solution using a 1.35mm diameter silver disc rotating-disc electrode and a mem-brane-covered 50 mm diameter silver micro-disc electrode, with25 mm silicone film and 75 mm silastic rubber membranes.104
Measurements were made both in the presence and absence ofoxygen, but their results showed that a micro-disc silver cathodeelectrode covered with a suitable polymer membrane, such assilicone film, might be used to measure halothane concentration
74R Analyst, June 1998, Vol. 123

in the absence of oxygen, but not in the presence of oxygen. Thedifficulty was that the half-wave potentials for oxygen andhalothane were too close, 20.425 and 20.565 V (versus SCE),respectively. Fig. 17 shows the reduction wave for halothane ata silver rotating disc electrode in 1 m KOH solution, taken fromthe work of Albery et al.104 The halothane reduction effectcommences early at approximately 20.3 V versus SCE and thecurrent is transport limited for potentials more negative than20.7 V. Thus, the halothane wave overlaps that of oxygen (cf.,Fig. 5) in addition to that of nitrous oxide (cf., Fig. 15) inalkaline electrolyte solutions.
Their conclusion was that the reaction of halothane, in theabsence of oxygen, is a two-electron reduction:
Ag + e2 + CHClBrCF3
¡ slow–
(Ag···Br···CHClCF3)2
¡ fast, H2O, e2–
Ag + Br2 + CH2ClCF3 + OH2
The overall mechanism therefore leads to 2-chloro-1,1,1-tri-fluorethane and bromide, with the overall equation written as:
CHClBrCF3 + 2e2 + H2O ? CH2ClCF3 + Br2 + OH2 (24)
with the bond split in the reaction almost certainly being the C–Br bond, since bromide is detected as a reaction product. Thiswork suggested that the silver electrode might have a particularaffinity for Br.104
Later studies suggested that gold was a better cathodematerial to use,105 since O2 and halothane displayed clearlyseparate reduction waves on gold. Unlike on silver, whereoxygen reduction appears as a single diffusion-controlled wave,on gold two plateaux of similar magnitude were observed,attributed to two two-electron steps:
O2 + H2O + 2e ? HO22 + OH2 (25a)
HO22 + H2O + 2e ? 3OH2 (25b)
A comparison of the current–voltage plots for oxygen andhalothane revealed two potential domains of interest, whereoxygen alone was reduced between 20.3 and 20.8 V versusSCE [eqn. (25a)], and between 21.1 and 21.6 V where thesecond oxygen wave [eqn. (25b)] was coincident with thehalothane reduction. The separation between these two wavestherefore appeared suitable for the application of a doublepotential pulse experiment, of the type already described for theoxygen/nitrous oxide assay on a membrane-covered silvermicro-disc electrode. (This approach was also encouraged bythe absence of a nitrous oxide reduction wave on gold, under theprescribed experimental conditions.)
However, when these conclusions from the rotating discexperiments were tested with a membrane-covered 125 mm
diameter gold disc micro-electrode, current–voltage plotsrevealed that the magnitude of the current on the first oxygenwave was depressed (at a constant O2 concentration) in thepresence of halothane, as shown in Fig. 18. The depression wasnon-linear, with the largest reduction being observed between 0and 1% v/v halothane. Therefore, unlike the rotating discelectrode, the membrane-covered sensor assay of O2 was notindependent of halothane, and the presence of the anaestheticagent led to large discrepancies in the determination of theoxygen concentration.
Hall et al.105 developed a strategy for assaying halothane inthe presence of oxygen by applying a potential step to apolarising voltage where, for short times, the oxygen reductionwas under diffusion control whereas the halothane reductionwas under mixed kinetic and diffusion control. Oxygen andhalothane were thus assayed by the application of a singlerectangular wave polarising voltage and current sampling at twopoints, one at very short times and the other at longer timeswhen both analytes were approaching diffusion control. Theresultant current–concentration plot was linear for halothane upto a saturation value, but the sensor still suffered from problemswhen the gold electrode was contaminated with trace amountsof silver.
A second attempt at the development of a practical halothanesensor, to be used in the presence of oxygen, was reported in1989, again using a rotating ring-disc electrode for fundamentalstudies and then a 125 mm gold micro-disc electrode, coveredwith a 6 mm thick silastic membrane.106 Again, results with theunshielded and shielded electrodes differed (with one problembeing that the reduction of oxygen on a gold electrode behind amembrane with only a thin electrolyte layer appeared as a singlewave, in contradistinction to the two waves which appeared atan unshielded electrode), and the membrane-covered sensorappeared to give a linear halothane current response (up to 4%v/v halothane) only as long as the prevailing oxygen concentra-tion was above 60% v/v. As with the previous attempt,105 thedevelopment of a sensor which would unambiguously assayboth oxygen and halothane in the presence of each other wasproving to be an extremely difficult task.
At the beginning of the 1990s, a third attempt was made, thistime by Mount and co-workers,107,108 to study the electro-chemical reduction of halothane and to develop a practical O2/halothane sensor. Accordingly, the first studies were conductedwith silver, platinum, gold and glassy carbon ring-disc elec-trodes, with silver used as the ring in each case and with copperdisc electrodes. In all cases, the diameter of the disc was
Fig. 17 Current–voltage curve for halothane reduction on a rotating-discAg electrode in 1 m KOH electrolyte solution.
Fig. 18 Voltammograms for 0–4% halothane in oxygen, at a 125 mmdiameter gold cathode membrane-covered Clark sensor at a constant PO2
.The depression of the first reduction wave (O2 reduction) is clearly seen asthe halothane concentration is increased.
Analyst, June 1998, Vol. 123 75R

approximately 7 mm. The mechanistic studies were conductedin the absence of oxygen in an electrolyte solution of 0.1 mpotassium hydroxide. Halothane was supplied from an anaes-thetic vaporiser in the range 1–4% v/v, and the studiesconcluded that, for a wide variety of electrode materials,electrochemical reduction of halothane involved two electronsand resulted in the production of a bromide ion at the silver ringelectrode. As far as the mechanism was concerned, theconclusion was that the first electron transfer was irreversibleand was the slowest of the two, followed by a chemical stepwhich was always fast and never rate-determining, followed bya second electron transfer which might be irreversible or by asubsequent fast chemical step. The following mechanism waspostulated:107
CHClBrCF3 + e2 ? (CHClBrCF3).2 (26a)
(CHClBrCF3).2 ? (CHClCF3). + Br2 (26b)
(CHClCF3). + e2 ? (CHClCF3)2 (26c)
(CHClCF3)2 + H2O ? CH2ClCF3 + OH2 (26d)
and so, overall,
CF3CHClBr + H2O + 2e2? CH2ClCF3 + Br2 + OH2 (26e)
agreeing with the conclusions of Albery et al.104 [eqn. (24)].Because both chemical steps were never rate determining, it
was impossible to know the precise sequence of the electro-chemical and chemical steps. A further paper by the samegroup108 examined the electrochemical reduction of halothanein the presence of oxygen, and this work concluded that silver orgold was the choice of disc electrode metal and that thedetection of the bromide ion product from the halothanereduction (at a silver ring electrode) provided a highlysuccessful method for measuring the concentration of halothanein the presence of oxygen, in any mixture of the two gases usedfor anaesthesia. In this instance, oxygen concentration would bemeasured at the silver or gold disc electrode. This work alsodemonstrated that the pH of the electrolyte solution had to be11, since some oxygen reduction species were also detected onthe ring at pH 13. In this technique, both the ring current due tothe formation of solid silver bromide and the subsequentreduction charge required for its removal could be used tomeasure the halothane concentration.109
Since it was clear that a clinical sensor needed a singlestationary working electrode rather than a ring-disc electrodeconfiguration, Mount and Clark described, in a subsequentpaper,109 an unshielded halothane/oxygen sensor utilising thechronoamperometric measurement of halothane and oxygenconcentrations at a silver electrode. The silver disc electrodewas 7 mm in diameter and the studies were conducted in astandard electrochemical reaction cell at room temperature, i.e.,the sensor was not membrane covered. Their techniqueemployed a triple potential step regime, where the electrode wasinitially at a potential of 20.15 V. The electrode was thenpulsed to 20.85 V, at which point mass transport-limitedreduction of halothane (two electrons) and oxygen (fourelectrons) occurred. The electrode potential was then stepped toa potential between 0.1 and 0.2 V, at which solid silver bromidewas formed on the electrode surface from the bromide ionproduced by the halothane reduction which took place duringthe first pulse. Finally, after a time delay, the electrode waspulsed to its starting potential of 20.15 V where the reductionof the solid silver bromide on the electrode occurred accordingto the reverse reaction
Ag(s) + Br2(aq) " AgBr(s) + e2 (27)
From their experimental data, it was clear that the currentmeasured during the second pulse was not a good measure of theamount of halothane present, because of complications of eithernucleation effects or secondary oxidation reactions. However,
the oxidation of bromide which occurs during the second pulse[and which formed the solid silver bromide according to theforward reaction in eqn. (27)] was reduced according to thereverse reaction during the third pulse and this was found to bea good measure of the amount of halothane present. The authorsrecognised that their system was ‘idealised’ since the sensor didnot have a membrane,109 and a membrane will alwayscomplicate gas transport considerably, as highlighted in the O2Clark sensor section of this teaching review. Thus, the Mount-Clark O2/halothane sensor will have a much more complexcurrent–time response when the sensor is covered by amembrane; transport of the gas in the thin layer of electrolytewill be bounded rather than governed by semi-infinite lineardiffusion and the finite rate of transport of gas through themembrane will determine the sensor response. Also, the pH inthe thin layer of electrolyte adjacent to the disc may rise morerapidly above pH 11 during the first reduction pulse and thenfall more slowly, as radial diffusion of hydroxide ions in the thinelectrolyte layer will be less efficient at maintaining the pH at asteady level. However, despite these complications, the triplepulsing regime is clearly a promising way forward, and it shouldbe possible to model this type of sensor using numericalanalysis techniques analogous to those described in the Clark O2sensor section.
More recently, Langmaier and Samec110 have questioned theECEC mechanism proposed in eqn. (26), and have commentedthat the absence of electrocatalysis in this reaction is surprising.Their criticism is that the mechanism described by eqn. (26)does not account for the strong effect of the nature of the metalon the halothane reduction process. In their examination of thereduction of halothane (in nitrogen) on a wide variety of metalelectrodes, they found that the half-wave potentials of halothanereduction at various metal electrodes could differ by severalhundred millivolts in both methanol and water. They concludedthat such behaviour might be due to the absorption of halothaneon the metal surface M, following the scheme
(M···S) + CHClBrCF3" (M···Br···CHClCF3) + S (27a)
followed by uptake of the first electron as the rate-determiningstep:
(M···Br···CHClCF3) + e2 ? M + Br2 + (CHClCF3). (27b)
where S is the absorbed solvent molecule. These steps wouldthen be followed by the fast reactions in eqns. (26c) and (26d).However, their work confirmed the previous conclusions thatthe electrochemical reduction of halothane proceeded through atwo-electron overall scheme yielding 2-chloro-1,1,1-trifluoro-ethane and bromide as the main product, with the uptake of thefirst electron by the halothane molecule being the rate-determining step.
The latest word (up to this present time) in this quest to detecthalothane in the presence of oxygen must belong to Caruana andGiglio,111 who have devised a method of measuring halothaneby anodic stripping voltammetry, although they appeared to beunaware of the chronoamperometric technique of Mount andClark.109 The technique of Caruana and Giglio is different tothat of other workers in that they used an acidic electrolytesolution (based on citric acid) with a pH of 4.0. Their electrodewas a 0.698 cm diameter gold electrode and cyclic voltammo-grams were measured in the range 20.3 to +0.9 V. These cyclicvoltammograms showed a clear irreversible reduction peak at20.3 V and a sharp peak at +0.62 V, the height of which waslinearly dependent on scan rate. This suggested that the oxidisedspecies was absorbed on the electrode surface, and the oxidationpeak only occurred when reduction had taken place on theelectrode, confirming that that peak at +0.62 V was due to theoxidation of the absorbed products from the reduction ofhalothane. Initial calibration plots of halothane concentrationagainst the peak oxidation current showed that the peak current
76R Analyst, June 1998, Vol. 123

was independent of oxygen concentration in the electrolytesolution, but the linear range for halothane measurement wasbetween 18 and 155 nm, since beyond 155 nm the responsesaturated at a constant peak height. Since the equivalenthalothane concentration in pH 4.0 buffer for 4% v/v halothanewould be 0.44 mm, the cyclic voltammetric technique could notbe used to measure halothane under clinical conditions. Thisproblem was obviated by adjusting the sensor sensitivity byusing a short duration potential step for 50 ms at 20.7 V,followed immediately by a potential sweep from 0 to +0.8 V ata sweep rate of 50 mV s21. The result of this pulsing/sweepingregime was that there was a clear linear relationship betweenoxidation peak current and halothane concentration between 0and 4% v/v halothane. Furthermore, this linearity was unaf-fected by the presence of oxygen. Although this new develop-ment is obviously very promising, it must be remembered thatthese experiments112 were conducted in a reaction cell, and thesensor (like that of Mount and Clark109) was not covered by amembrane permeable to halothane. Furthermore, the sensorwould not provide a cotemporal measurement of O2 concentra-tion, unlike the Mount and Clark device.
It is clear from the above that a further (and possibly large)step is required before a practical membrane-covered sensor forhalothane can be developed, and this development would begreatly aided by a digital simulation model which incorporatedboth membrane and electrolyte layers, and which would enableboth pulsing and sweep control techniques to be modelled. Thisstage has yet to be realised.
There is an ironic practical twist to this quest to develop anelectrochemical halothane sensor since the increasing availabil-ity of alternative volatile anaesthetic agents, and the worriesabout the pathophysiology of post-halothane hepatic dysfunc-tion, have led to cautionary advice regarding the medico-legalimplications of the repeated use of halothane,112 including callsfor it to be made obsolete.113 Although halothane will no doubtremain popular in undeveloped countries, by virtue of its lowcost and high anaesthetic potency, opinion seems to behardening that the days of halothane anaesthesia in the UK arelimited. A recent anaesthetic survey has clearly indicated that acombination of the fear of litigation and the availability ofnewer ‘cleaner’ inhalational anaesthetic agents has broughtabout a sharp decline in the use of halothane, especially amongstanaesthetists in training.114 Halothane has for years been areliable agent for use in difficult situations, but as alternativeagents are developed for the safe inhalational induction ofanaesthesia (a field where halothane has been dominant), thenhalothane may become little more than an item of historicalinterest to a new generation of anaesthetists. Unfortunately forthe electrochemist, the new inhalational agents, includingisoflurane (CHF2OCHClCF3), enflurane (CHF2OCF2CHClF),sevoflurane [CH2FOCH(CF3)2] and desflurane(CHF2OCHFCF3), all appear to be electrochemically inert inaqueous electrolytes. However, all is not lost electrochemically,since it is becoming apparent that most of these agents might beelectrochemically active on micro-electrodes in non-aqueousmedia, as described in the following non-aqueous section.
Non-aqueous solution electrochemistry
The history of the electrochemical measurement of O2 and CO2in non-aqueous solutions is much shorter than that in aqueoussolutions, as described in the previous sections, and aproticsolutions have certainly not been used in blood-gas sensors sofar. Furthermore, aprotic electrochemistry has not been used forthe gaseous determination of O2, CO2 or the inhalationalanaesthetic agents in clinical medicine, although prototype gassensors have been developed in recent years. This apparent lackof interest is probably due to the success of the well tried andtested Stow–Severinghaus and Clark aqueous electrolyte sen-
sors, and to the fact that aprotic electrolyte solutions could posenew dangers to the users of blood (or gas-phase) sensors owingto the potential toxicity of these substances. Furthermore, sincethey would attack the plastic materials currently used in clinicalsensors, their use would necessitate new materials and newdesign procedures.
Why, then, should we bother to design new clinical sensorsusing aprotic solutions? The answer is that aprotic solutionsprovide a very wide voltage window (up to 23.0 V) for theelectrochemical reduction of potentially reducible clinical gasesand vapours. This opens up the possibility of developing asingle sensor which could measure a mixture of gases andvapours with a single electrochemical technique. This is alaudable aim, but the journey towards realising this aim hasbeen bedeviled with problems so far, notably the cross-interference of the various reaction products. These problemswill be described in the following sections. The non-aqueouselectrochemistry will be described taking DMSO as the solvent,since DMSO is already used therapeutically in clinical medicinefor urinary disorders and as an anti-viral preparation. Ittherefore does not pose a toxic hazard to the user provided thatstandard laboratory precautions are employed.
Because of the way in which this particular electrochemicalhistory has evolved, the reduction of O2 and CO2 in aproticmedia will be described first, and the following two sectionsdescribe the electro-reduction of oxygen and carbon dioxide, inthe absence of each other, although these conditions aredecidedly non-clinical. Special problems exist when these twogases are reduced in the presence of each other, and this isconsidered in the third section. Finally, preliminary results onthe electro-reduction of inhalational anaesthetic agents inDMSO are described.
Oxygen reduction
The electrochemical reduction of oxygen in aprotic media wasstudied in the 1960s by a small group of workers.115–117 This,and subsequent, work was extensively discussed by Bauer andBeck,118 in 1972, who reviewed the electrochemical behaviourof O2 in no fewer than 33 solvents and fused salts. Most of thesestudies were conducted with either Pt or Au solid macro-electrodes, or with the dropping-mercury electrode, usingcyclic-voltammetry. In one instance, controlled amounts ofwater were added to DMSO and the effect of this on theelectrochemical reduction of O2 in DMSO was examined.119
The results of these investigations in DMSO, with tetraalk-ylammonium salts as the supporting electrolyte, showed thattwo distinctive, and clearly separated, oxygen reduction waves,as shown in Fig. 19. The first wave is due to the electroreductionof oxygen to the superoxide ion, O2
.2 produced by a one-electron process. The second wave is due to the furtherreduction of O2
.2 via one electron, to O222. Furthermore, since
the first process is reversible, the overall process can be writtenas
O2 + e " O2.2 (28a)
O2.2 + e ? O2
22 (28b)
If the electrode polarisation is maintained in the vicinity of thefirst wave, it has been shown that stable solutions of O2
.2 can begenerated, and that O2
.2 undergoes several reactions where itcan function as a base, a nucleophile and a one-electrondonor.120,121 In the mid-1990s, renewed interest in the electro-reduction of oxygen in aprotic media led to investigations on thereactivity of O2
.2, following the electrochemical reduction ofoxygen using cyclic voltammetry and rotating-disc electrodes,and to hydrodynamic chronocoulometric studies to determinethe diffusion coefficients and concentrations of oxygen inaprotic media.122,123 These studies confirmed the earlierconclusions, namely that oxygen is reduced initially in a one-
Analyst, June 1998, Vol. 123 77R
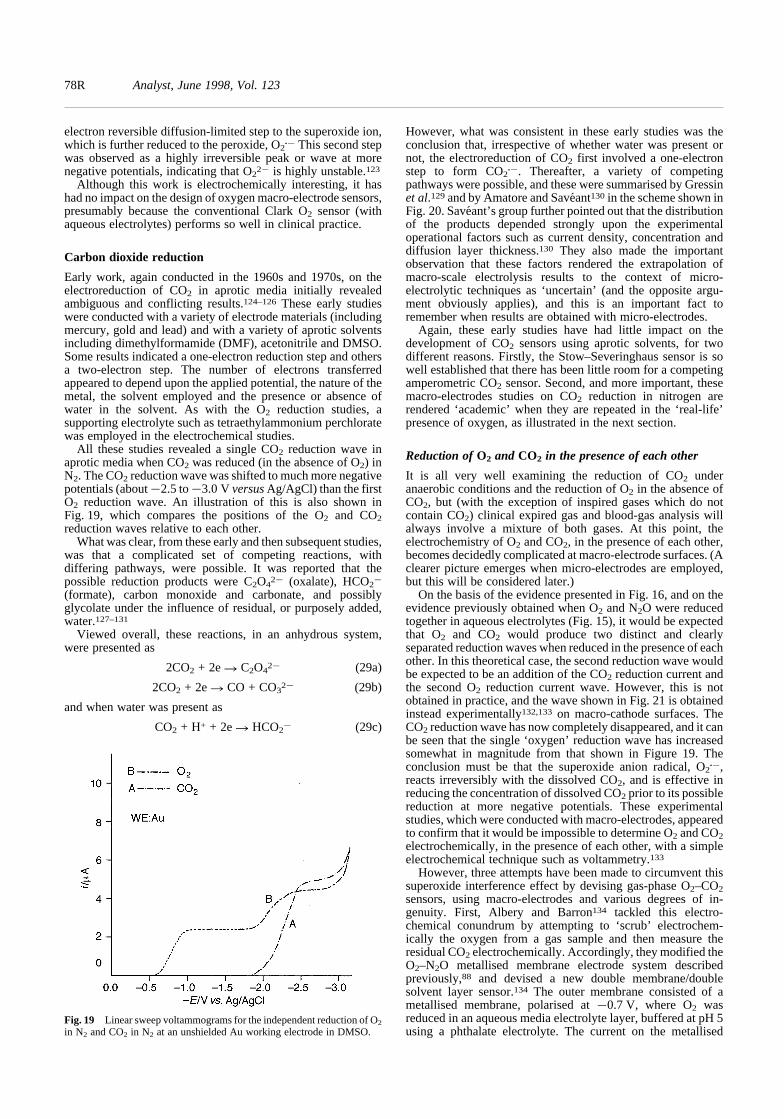
electron reversible diffusion-limited step to the superoxide ion,which is further reduced to the peroxide, O2
.2 This second stepwas observed as a highly irreversible peak or wave at morenegative potentials, indicating that O2
22 is highly unstable.123
Although this work is electrochemically interesting, it hashad no impact on the design of oxygen macro-electrode sensors,presumably because the conventional Clark O2 sensor (withaqueous electrolytes) performs so well in clinical practice.
Carbon dioxide reduction
Early work, again conducted in the 1960s and 1970s, on theelectroreduction of CO2 in aprotic media initially revealedambiguous and conflicting results.124–126 These early studieswere conducted with a variety of electrode materials (includingmercury, gold and lead) and with a variety of aprotic solventsincluding dimethylformamide (DMF), acetonitrile and DMSO.Some results indicated a one-electron reduction step and othersa two-electron step. The number of electrons transferredappeared to depend upon the applied potential, the nature of themetal, the solvent employed and the presence or absence ofwater in the solvent. As with the O2 reduction studies, asupporting electrolyte such as tetraethylammonium perchloratewas employed in the electrochemical studies.
All these studies revealed a single CO2 reduction wave inaprotic media when CO2 was reduced (in the absence of O2) inN2. The CO2 reduction wave was shifted to much more negativepotentials (about 22.5 to 23.0 V versus Ag/AgCl) than the firstO2 reduction wave. An illustration of this is also shown inFig. 19, which compares the positions of the O2 and CO2reduction waves relative to each other.
What was clear, from these early and then subsequent studies,was that a complicated set of competing reactions, withdiffering pathways, were possible. It was reported that thepossible reduction products were C2O4
22 (oxalate), HCO22
(formate), carbon monoxide and carbonate, and possiblyglycolate under the influence of residual, or purposely added,water.127–131
Viewed overall, these reactions, in an anhydrous system,were presented as
2CO2 + 2e ? C2O422 (29a)
2CO2 + 2e ? CO + CO322 (29b)
and when water was present as
CO2 + H+ + 2e ? HCO22 (29c)
However, what was consistent in these early studies was theconclusion that, irrespective of whether water was present ornot, the electroreduction of CO2 first involved a one-electronstep to form CO2
.2. Thereafter, a variety of competingpathways were possible, and these were summarised by Gressinet al.129 and by Amatore and Saveant130 in the scheme shown inFig. 20. Saveant’s group further pointed out that the distributionof the products depended strongly upon the experimentaloperational factors such as current density, concentration anddiffusion layer thickness.130 They also made the importantobservation that these factors rendered the extrapolation ofmacro-scale electrolysis results to the context of micro-electrolytic techniques as ‘uncertain’ (and the opposite argu-ment obviously applies), and this is an important fact toremember when results are obtained with micro-electrodes.
Again, these early studies have had little impact on thedevelopment of CO2 sensors using aprotic solvents, for twodifferent reasons. Firstly, the Stow–Severinghaus sensor is sowell established that there has been little room for a competingamperometric CO2 sensor. Second, and more important, thesemacro-electrodes studies on CO2 reduction in nitrogen arerendered ‘academic’ when they are repeated in the ‘real-life’presence of oxygen, as illustrated in the next section.
Reduction of O2 and CO2 in the presence of each other
It is all very well examining the reduction of CO2 underanaerobic conditions and the reduction of O2 in the absence ofCO2, but (with the exception of inspired gases which do notcontain CO2) clinical expired gas and blood-gas analysis willalways involve a mixture of both gases. At this point, theelectrochemistry of O2 and CO2, in the presence of each other,becomes decidedly complicated at macro-electrode surfaces. (Aclearer picture emerges when micro-electrodes are employed,but this will be considered later.)
On the basis of the evidence presented in Fig. 16, and on theevidence previously obtained when O2 and N2O were reducedtogether in aqueous electrolytes (Fig. 15), it would be expectedthat O2 and CO2 would produce two distinct and clearlyseparated reduction waves when reduced in the presence of eachother. In this theoretical case, the second reduction wave wouldbe expected to be an addition of the CO2 reduction current andthe second O2 reduction current wave. However, this is notobtained in practice, and the wave shown in Fig. 21 is obtainedinstead experimentally132,133 on macro-cathode surfaces. TheCO2 reduction wave has now completely disappeared, and it canbe seen that the single ‘oxygen’ reduction wave has increasedsomewhat in magnitude from that shown in Figure 19. Theconclusion must be that the superoxide anion radical, O2
.2,reacts irreversibly with the dissolved CO2, and is effective inreducing the concentration of dissolved CO2 prior to its possiblereduction at more negative potentials. These experimentalstudies, which were conducted with macro-electrodes, appearedto confirm that it would be impossible to determine O2 and CO2electrochemically, in the presence of each other, with a simpleelectrochemical technique such as voltammetry.133
However, three attempts have been made to circumvent thissuperoxide interference effect by devising gas-phase O2–CO2sensors, using macro-electrodes and various degrees of in-genuity. First, Albery and Barron134 tackled this electro-chemical conundrum by attempting to ‘scrub’ electrochem-ically the oxygen from a gas sample and then measure theresidual CO2 electrochemically. Accordingly, they modified theO2–N2O metallised membrane electrode system describedpreviously,88 and devised a new double membrane/doublesolvent layer sensor.134 The outer membrane consisted of ametallised membrane, polarised at 20.7 V, where O2 wasreduced in an aqueous media electrolyte layer, buffered at pH 5using a phthalate electrolyte. The current on the metallised
Fig. 19 Linear sweep voltammograms for the independent reduction of O2
in N2 and CO2 in N2 at an unshielded Au working electrode in DMSO.
78R Analyst, June 1998, Vol. 123

C2O42–
CO2•–
HCO2•
CO2 + 1e–
HCO2–
C C
O
OO
O•
C
O
OO
O C
C
O
OO
O C
C
O
OO
O C
C2O4 2–
C2O4 2– + CO2
•CO + CO3
2–
+ CO2•–
+ CO2
+ H2O
+ 1 e– + CO2•–
+ 1e–
+ CO2•–
+ 1e–
+ CO2•–
+ CO2
membrane was proportional to the concentration of O2, and itwas found that the metallised membrane filtered the O2 with99% efficiency. The remaining CO2 molecules then passedthrough the metallised membrane, and through the aqueouselectrolyte, to another membrane with an inner compartmentcontaining a non-aqueous electrolyte (usually DMSO) and asilver macro-cathode. The CO2 was reduced to CO2
.2 at thissecond electrode surface. As is clear from the above description,the electrode construction was complicated and a majorproblem with this approach was that the two-compartmentarrangement introduced a considerable gas diffusion barrier,which manifested itself in a relatively slow response time.Although Albery and Barron134 published results showing thissensor could be used to determine gaseous O2 and CO2 on abreath-by-breath basis, this work could not be replicated byCoombs132 and Clark,133 and the sensor appears not to havebeen developed any further.
In the second attempt to develop a practical sensor, theelectrochemical filter technique was abandoned, and a pulsedtitration technique was developed in its stead.135,136 Theprinciple of this approach for the electrochemical analysis ofmixed gaseous samples of O2 and CO2 is shown schematicallyin Fig. 22. The method of determination depends on reducingO2 for a fraction of a second, at a potential where CO2 isinactive, in order to generate a known amount of the reactiveO2
.2 anion radical, and thereby initiate the fast O2.2–CO2
reaction. The amount of O2.2 subsequently left unreacted after
a given time was then determined by pulsing the workingelectrode potential to a more positive potential, and re-oxidisingthe remaining O2
.2 to O2. The collection efficiency for the O2–O2
.2 redox couple was estimated in the absence of CO2, andthen subsequently with CO2 present, and the changes in both thegeneration and recovery transients due to the deactivation ofO2
.2 and the regeneration of O2 were observed. By quantifyingthese observed changes with respect to a theoretical model ofthe overall system, it was possible to infer the sampleconcentrations of O2 and CO2. In this sensor, DMSO was usedas the solvent, and a large Au working electrode, approximately1.5 mm in diameter, was employed.
The overall reaction scheme for this sensor is shown inFig. 23, and several practical problems emerge. First, since thesensor design necessitated a gold macro-cathode where thereaction processes could be contained in the thin layer of solventtrapped between the membrane and the cathode surface, the
sensor could only be used for gaseous analysis. It had no futurefor blood-gas analysis. Second, as is clear from the reactionscheme presented in Fig. 23, the very nature of the O2
.2–CO2reaction pathways regenerates O2, which is further reducedduring the first voltage pulse. This additional O2 elevates theobserved overall O2 reduction signal. Therefore, a complexmathematical model136 had to be devised to deconvolute thetrue O2 and CO2 concentrations, and the analysis systembecame more and more complicated. Because of this complex-ity, and the impossibility of using this system for blood-gasanalysis, the pulse-titration technique made no further pro-gress.
A third attempt was made, this time by Qian et al.,137 todevise an electrochemical method for the simultaneous meas-urement of CO2 and O2 and they combined two separateamperometric sensors. In this technique, a gaseous sample isdrawn through an electrolytic cell designed to scrub the oxygenfrom the gas sample. This device consisted of a Pt-catalysedTeflon-bonded hydrophobic porous electrode, which had beenpreviously developed for fuel-cell applications. The electrolytewas 0.5 m sulfuric acid. Qian et al.137 demonstrated that all theoxygen was virtually completely consumed by electro-reduc-tion, and the remaining gas then passed to a CO2 sensorconsisting of a Pt micro-disc of 60 mm diameter, with a DMSOsolution. The gas-permeable membrane employed was eitherporous Teflon or solid polyethylene. Again, this sensor could
Fig. 20 Possible reduction processes for the electrochemical reduction of CO2 in aprotic media with and without the addition of water. (Taken fromref. 128.)
Fig. 21 Experimental linear sweep voltammogram for the mixed electro-chemical reduction of O2 + CO2 in N2 under the same experimentalconditions as in Fig. 19, showing only one reduction wave. Note the absenceof the CO2 reduction wave and the second O2 reduction wave, both of whichare present in Fig. 19.
Analyst, June 1998, Vol. 123 79R

CO4•– C2O6
•–
CO42– C2O6
2–
O2•–O2 + e–
CO2 CO2
CO2
fast
fast
O2•– O2
•–
O2 O2
electrode solution
only be employed for gaseous samples, and since both the O2and CO2 sensors had different response times (compounded bythe transport lag time between the sample gas reaching the twoseparate cells) the overall system had serious disadvantages.Furthermore, since the quoted response times were 15 and 35 sfor 90% changes in O2 and CO2, respectively, the combinedsensors were far too slow for the required response time (about0.1 s) for breath-by-breath O2 and CO2 determination. As withthe two previous design attempts, the sensor system could notbe used for the determination of dissolved O2 or CO2 inblood.
Reduction of O2 and CO2 at micro-electrodes
The solution to the electrochemical conundrum of the cross-interference of the O2 and CO2 reduction processes, in non-aqueous media, finally came by returning to the originalelectrochemical roots of biology and medicine. By the verynature of their work, biological and clinical scientists use micro-electrodes to investigate biological phenomena—as described
in the early sections on aqueous amperometric sensors. Micro-electrodes not only perturb (e.g., consume in this case) as littleas possible the biological system in which they are measuring,but they also produce a minimal quantity of reaction by-products—which are often unwanted in any electrochemicalsystem, anyway. Hence it could be a sensible proposition tosuppose that a micro-disc electrode in either an unshielded, ormembrane-covered, system might produce amounts of O2 andCO2 reduction products which were too small to interferesignificantly with the simultaneous reduction of these two gasesin non-aqueous media.
This proposition was tested in a series of studies138,139 (whichhave yet to be completed) which analysed the reduction of O2and CO2 in the presence of each other, and in the presence ofinhalational anaesthetic agents,140 at gold micro-cathodes inDMSO. These studies have been conducted with Au micro-discelectrodes of 2–80 mm diameter, with sweep voltammetry ratesvarying between 0.1 and 5.0 V s21. It has been demonstratedconclusively that it is most unwise to extrapolate electro-chemical results obtained on macro-electrodes to micro-discelectrodes, so confirming the warning by Amatore andSaveant.130
Although these micro-disc electrodes replicated the macro-electrode studies, when O2 was reduced in the absence of CO2and CO2 was reduced in the absence of O2, the results wereentirely different when O2 and CO2 were reduced in thepresence of each other.138,139 In this instance, in both theunshielded and membrane-covered cases, clearly separated O2and CO2 reduction waves were obtained. Both produced goodlinear relationships between the limiting currents of the twowaves and the oxygen and CO2 concentrations. Oxygen pluscarbon dioxide voltammograms are illustrated in Fig. 24,showing the reduction waves in both the unshielded andmembrane-covered sensor cases. The membrane-covered sen-sor was a conventional Clark-type sensor, as shown in Fig. 4,and the electrodes were gold wires sealed in glass rods, obtainedeither from commercial sources or from La Trobe University,Melbourne, Australia. They were ‘non-ideal’ for sensor design
Fig. 22 Pulsing regime for the pulse-titration technique when (a) O2 onlyis present and (b) both O2 and CO2 are present. It can be seen in (b) that therecovery signal from the oxidation of O2
.2 is significantly less in thepresence of CO2 and that the O2 signal is enhanced in the presence of CO2,as explained in the text.
Fig. 23 General reaction scheme for the homogeneous deactivation ofO2
.2 by CO2 in DMSO, which occurs in the solvent layer adjacent to themacro-cathode in the pulse-titration sensor.
Fig. 24 Voltammograms for the reduction of CO2 in O2, with the balancebeing N2, for a 10 mm diameter Au microdisc electrode. (i) Voltammogramsfor an unshielded electrode for (a) 3, (b) 6, (c) 9, (d) 12 and (e) 15% v/v CO2
in 25% v/v O2. (ii) Voltammograms for the gold micro-cathode whencovered with a 12 mm PTFE membrane at CO2 concentrations of (a) 3, (b)6 and (c) 9% v/v, when the O2 concentration was kept constant at 10%v/v.
80R Analyst, June 1998, Vol. 123

since they had flattened surfaces and were not shaped for aClark sensor, and yet they gave excellent results. This clearlyindicates that specially designed sensors could be designedfairly easily.
The key to the success of this dual O2–CO2 system obviouslylies in the utilisation of micro-disc electrodes, and it seemsreasonable to suppose that the smaller the microdisc thebetter.
Recalling the reaction scheme of the O2–CO2 pulsed titrationsensor (Fig. 23):
CO2 + O2.2 ? CO4
.2 (30a)
CO4.2 + CO2 ? C2O6
.2 (30b)
C2O6.2 + O2
.2 ? C2O622 + O2 (30c)
the ‘feed-forward’ process [eqn. (30a)] destroyed the CO2present in the DMSO layer adjacent to the gold surface, and the‘feed-back’ process [eqn. (30c)] produced O2, which thenelevated the original oxygen signal given by
O2 + e2 " O2.2
To eliminate the ‘feed-forward’ and ‘feed-back’ mechanisms,which destroy any direct relationship between current and gasconcentration, it is necessary to prevent eqn. (30c) fromoccurring and to generate species such as C2O6
2 via directelectron transfer (heterogeneously at the electrode surface):
C2O62 + e ? C2O6
22 (31)
rather than homogeneously via eqn. (30c), so that a new processis available which is proportional to CO2 concentration. Byusing micro-disc electrodes, the product O2
.2 is produced insufficiently small amounts that eqn. (30c) does not occur to anysubstantial extent, and by sweeping the polarising voltage thereis also insufficient time under steady-state conditions prevailingat the micro-electrode for this reaction to take place homoge-neously in the region of the electrode surface. Hence any O2
.2
reaction with CO2 produces very little O2 and this does not thenelevate the oxygen reduction signal via the feed-back process ineqn. (30c).
Micro-disc electrode studies, in the absence of CO2, haveindicated that the reduction of CO2 provides either a drawn-outsingle process or two barely resolved processes. However, thelimiting current obtained represented the summation of bothprocesses and was well defined. The data can be explained byassuming that the short time-scale and low concentration ofCO2
.2 lead to conditions where the reactions in Fig. 20:
2CO2.2 ? CO + CO3
22
CO2.2 + CO2
.2 ? C2O422
2CO2.2 + H2O ? HCO2
2 + HCO32
are unimportant, i.e., the CO2.2 has a finite existence at the
electrode surface and can be directly reduced to a transientCO2
2 moiety:
fastCO2.2 + e ? CO2
.22 –––? products (32)
It was clear that the second reduction process in the presenceof O2 and CO2 mixtures was not simply a summation of thesecond O2 reduction process:
O2.2 + e ? O2
22
and the CO2 reduction processes. In the absence of eqn. (30c),direct reaction of the product of the reaction of CO2 and O2
.2
must occur to give a single multi-electron irreversible process.The exact details of this new process are not known, but directelectron transfer at the electrode surface occurs and O2 is notgenerated homogeneously as is the case at macro-electrodes. Asa consequence, when O2 and CO2 gas mixtures are present inclinical concentrations, the limiting current for the first
reduction process was found to be proportional to the O2concentration and the limiting current for the second processwas directly proportional to the CO2 concentration. Fur-thermore, when the membrane-covered sensor studies wererepeated after the deliberate addition of 5 and 10% v/v of waterto the DMSO solvent, the O2 and CO2 reduction results wereessentially unchanged, with the only apparent change being thatthe magnitude of the CO2 reduction current was decreased onthe addition of H2O to the solvent.138 Within the measurementerror, the O2 reduction current was essentially the same wheneither 5 or 10% H2O was added to the DMSO. In both cases, thesensor responded linearly to changes in CO2 concentration, andthe reduction processes appeared to occur at the same polarisingvoltages whether the solvent was wet or dry. It is thus clear that‘unexpected’ results can be obtained with micro-disc electrodes,and further studies on this new system are required.
So far, the reported studies have used 6 and 12 mm Teflonmembranes to cover the sensor, and the gold micro-discelectrodes have varied, in practice, between 2 and 10 mm indiameter. The voltage sweep rates have varied between 0.1 and5 V s21. As stated in the Aqueous electrolyte amperometric PO2
sensor section, the use of thin membranes produces conflictingadvantages and disadvantages. A thin membrane will yield afast time response (and hence a fast analysis update) but willinevitably increase the sensor liquid–gas difference by facilitat-ing O2 transport from the liquid sample to the gas speciesconsuming cathode. This was partly compensated for byemploying micro-disc electrodes, but since they were polarisedcontinuously the O2 consumption process was also continuous,and so a compromise had to be struck between electrode sizeand membrane permeability and thickness.
However, in the case of the micro-disc O2–CO2 sensordescribed above, the liquid–gas current difference can beobviated by the employment of suitable electrochemicaltechniques. First, the minute micro-disc electrode will reducethe depletion of the gas species from the liquid sample, and,further, the polarising voltage is swept only for a finite time andcan then be switched off. After a suitable quiescent time, theduty cycle can be repeated, allowing the overall diffusionsystem to relax during the ‘pause’ period. This sensor thereforelends itself to the type of ‘on-off’ computer simulationdescribed in the sensor simulation model, where the pulsingregime is replaced by sweep voltammetry, and the character-istics of the membrane and solvent layers are woven into thegeneral equations, together with the size of the micro-discelectrode employed. In this fashion, the actual operatingcharacteristics of a sensor can be optimised by computersimulation to produce the minimum liquid–gas difference effectand yet maximise the analysis update time. Furthermore, the useof an array of micro-disc electrodes, wired in parallel andsuitably spaced so that their diffusion-reaction patterns do notoverlap each other, would greatly increase the total sensoroutput signal, and also build ‘redundancy’ into the sensorperformance.
O2 + N2O reduction
The same micro-disc electrode sensor was tested in the presenceof O2 and N2O binary gas mixtures.141 Studies were conductedwith both shielded and membrane-covered micro-disc goldelectrodes, and similar results were obtained in both in-stances.
As with the aqueous electrolyte sensor, two distinct andclearly separated reduction waves were observed for thereduction of O2 and N2O in DMSO. The addition of 5 and10% v/v of H2O to the DMSO did not appear to affect thereduction processes, although the overall voltage windowwherein the reduction processes took place was reduced. Also,as with the aqueous electrolyte studies, N2 appeared to be the
Analyst, June 1998, Vol. 123 81R

main product of the reduction process, and care had to be taken(as with the aqueous solvents) to avoid the problem of N2bubble formation on the micro-disc surface.141
Fig. 25 shows the voltammograms (sweep rate 0.1 V s21)obtained from a 10 mm diameter Au micro-disc electrode, whenshielded with a 12 mm PTFE membrane for O2 and N2O gasmixtures, where both the O2 and N2O concentrations variedfrom 10 to 90% v/v. Although there does not appear to be an O2reduction current in Fig. 25(a), it is in fact there as a‘background current’ on the current scale displayed. When thissection of the voltammogram is magnified, as shown inFig. 25(b), the O2 voltammograms become clearly defined. Thesteps in the O2 current are due to the resolution of thepotentiostat output, representing the last significant bit in thedigital output. The N2O and O2 limiting currents from Fig. 25(a)and (b) translate into linear current–gas concentration relation-ships, and it is therefore clear that a membrane-covered Aumicro-disc sensor can be designed to measure O2 and N2O in thepresence of each other. The design characteristics of this sensorhave yet to be optimised in order to facilitate liquid samplemeasurements of O2 and N2O.
Reduction of O2, CO2 and N2O in the presence of eachother
The next complication in the quest for a multi-gas sensor is thedetermination of O2, CO2 and N2O in the presence of eachother.
Results, published only in patent form at the moment,140 haveclearly revealed that three waves are seen on the current–voltage voltammogram when O2, CO2 and N2O are simultane-ously reduced in the presence of each other. Fig. 26 illustrates
this phenomena clearly, where it is seen that the O2, CO2 andN2O reaction processes are clearly separated and identified bytheir positions on the voltammogram. Furthermore, the limitingcurrents, within the gas species concentrations examined so far,have indicated that the three waves produce linear relationshipsbetween current and gas concentration for the individual gasspecies. Clearly, there is still much more work to be done on thisnew type of sensor, but the indications, so far, are that micro-disc sensors, in aprotic media such as DMSO, clearly hold muchpromise for the future. The range of solvents examined so farhas been severely limited, but a practical sensor might wellemploy a gel-type electrolyte layer, rather than a liquid layer.
Inhalational anaesthetic agents
It is here that a possible clear distinction appears, once more,between electrochemical results obtained with macro- andmicro-electrodes.
The first real attempt to devise an electrochemical sensor foran inhalational anaesthetic agent, other than halothane, wasmade by Compton and co-workers142,143 in 1988. The agentthey chose to examine was isoflurane, a fluorinated ether(CHF2OCHClCF3), which is now commonly used in anaes-thetic practice worldwide. In their first reports, they used a0.682 cm diameter macro-electrode in a rotating-disc assemblyto investigate the electrode activity, or otherwise, of isofluraneat a range of conventional electrode materials.142,143 Theirresults, using rotating-disc voltammetry, showed that isofluranewas inert towards reduction at silver, gold, mercury andplatinum macro-electrodes, in both aqueous and non-aqueoussolutions. The sole exception was on mercury in dime-thylformamide solvent, where reduction was observed at around23.0 V (with reference to a saturated calomel electrode), butthis was so close to the potential of the solvent decompositionthat any analytical applications were precluded. They thereforedirected their attention towards finding a possible mediator forelectron transfer. Their investigations demonstrated that thefluoranthene radical anion could mediate the reduction ofisoflurane in acetonitrile solution and they then developed apolymer-modified electrode for the reduction of isofluranebased on these observations. In this particular case, the polymer[poly(11-vinylfluoranthene (PVF)] containing electroactivependant groups was synthesised and deposited on a platinumdisc electrode of diameter 0.702 cm. The solvent used wasacetonitrile and cyclic voltammetry was employed to in-vestigate the electrochemical processes. Cyclic voltammograms
Fig. 25 (a) Voltammograms obtained using a 2 mm diameter Au micro-disc electrode, when shielded with a 12 mm PTFE membrane for O2 + N2Ogas mixtures. The O2 concentration varied from 10 to 80% v/v and the N2Oconcentration from 90 to 20% v/v. The O2 reduction current is so minutethat it appears as a ‘background current’ on the current scale displayed here(full scale 80 nA). (b) The greatly amplified O2 voltammograms for the datadisplayed in (a), with the exception that the full-scale current is now 1.8 nAand the voltage scale is from 0 to 21.4 V versus Ag. The steps in the O2
current are due to the ‘last bit’ resolution of the potentiostat output.
Fig. 26 Voltammograms for an unshielded 2 mm diameter gold micro-discelectrode in a gas mixture containing 10% v/v O2 and 5, 10, 15 and 20%CO2, with the balance being N2O. The oxygen signal is so low comparedwith the CO2 and N2O signals that it appears as a ‘baseline’ current. Clearlyseparated diffusion plateaux are seen for CO2 and N2O. Diffusion plateauxfor oxygen could also be seen if the oxygen reduction current part of thevoltammogram was magnified sufficiently (see Fig. 25).
82R Analyst, June 1998, Vol. 123
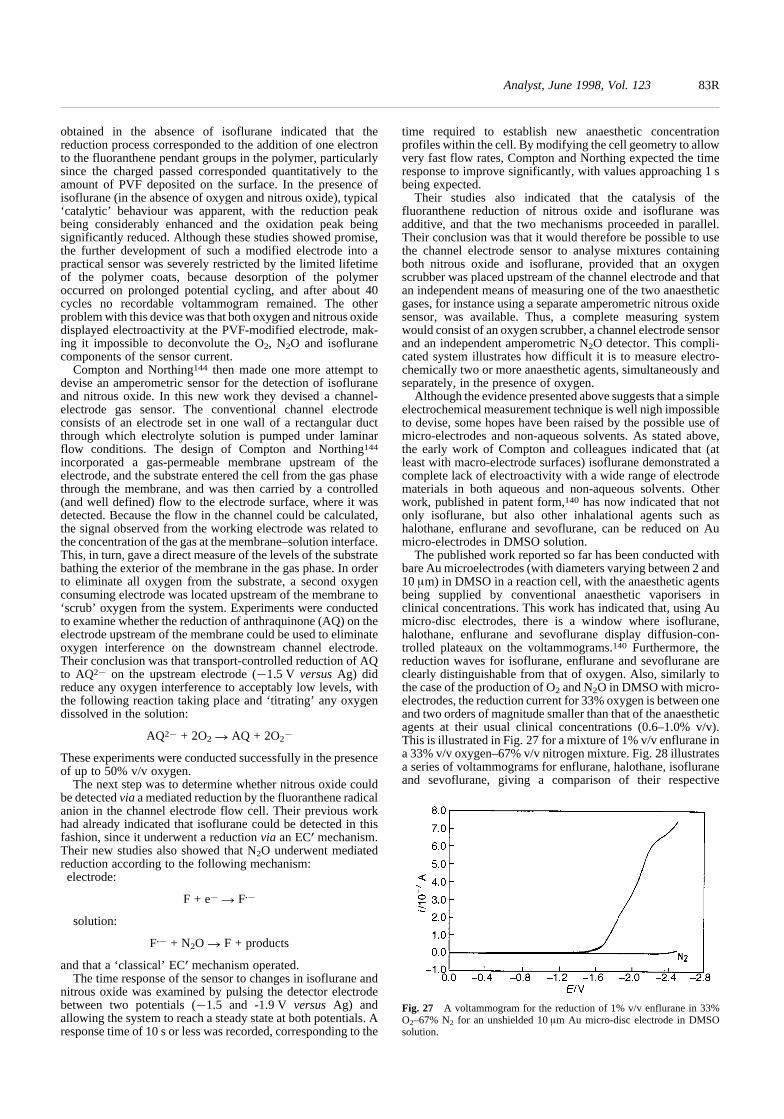
obtained in the absence of isoflurane indicated that thereduction process corresponded to the addition of one electronto the fluoranthene pendant groups in the polymer, particularlysince the charged passed corresponded quantitatively to theamount of PVF deposited on the surface. In the presence ofisoflurane (in the absence of oxygen and nitrous oxide), typical‘catalytic’ behaviour was apparent, with the reduction peakbeing considerably enhanced and the oxidation peak beingsignificantly reduced. Although these studies showed promise,the further development of such a modified electrode into apractical sensor was severely restricted by the limited lifetimeof the polymer coats, because desorption of the polymeroccurred on prolonged potential cycling, and after about 40cycles no recordable voltammogram remained. The otherproblem with this device was that both oxygen and nitrous oxidedisplayed electroactivity at the PVF-modified electrode, mak-ing it impossible to deconvolute the O2, N2O and isofluranecomponents of the sensor current.
Compton and Northing144 then made one more attempt todevise an amperometric sensor for the detection of isofluraneand nitrous oxide. In this new work they devised a channel-electrode gas sensor. The conventional channel electrodeconsists of an electrode set in one wall of a rectangular ductthrough which electrolyte solution is pumped under laminarflow conditions. The design of Compton and Northing144
incorporated a gas-permeable membrane upstream of theelectrode, and the substrate entered the cell from the gas phasethrough the membrane, and was then carried by a controlled(and well defined) flow to the electrode surface, where it wasdetected. Because the flow in the channel could be calculated,the signal observed from the working electrode was related tothe concentration of the gas at the membrane–solution interface.This, in turn, gave a direct measure of the levels of the substratebathing the exterior of the membrane in the gas phase. In orderto eliminate all oxygen from the substrate, a second oxygenconsuming electrode was located upstream of the membrane to‘scrub’ oxygen from the system. Experiments were conductedto examine whether the reduction of anthraquinone (AQ) on theelectrode upstream of the membrane could be used to eliminateoxygen interference on the downstream channel electrode.Their conclusion was that transport-controlled reduction of AQto AQ22 on the upstream electrode (21.5 V versus Ag) didreduce any oxygen interference to acceptably low levels, withthe following reaction taking place and ‘titrating’ any oxygendissolved in the solution:
AQ22 + 2O2? AQ + 2O22
These experiments were conducted successfully in the presenceof up to 50% v/v oxygen.
The next step was to determine whether nitrous oxide couldbe detected via a mediated reduction by the fluoranthene radicalanion in the channel electrode flow cell. Their previous workhad already indicated that isoflurane could be detected in thisfashion, since it underwent a reduction via an ECA mechanism.Their new studies also showed that N2O underwent mediatedreduction according to the following mechanism:
electrode:
F + e2 ? F.2
solution:
F.2 + N2O ? F + products
and that a ‘classical’ ECA mechanism operated.The time response of the sensor to changes in isoflurane and
nitrous oxide was examined by pulsing the detector electrodebetween two potentials (21.5 and -1.9 V versus Ag) andallowing the system to reach a steady state at both potentials. Aresponse time of 10 s or less was recorded, corresponding to the
time required to establish new anaesthetic concentrationprofiles within the cell. By modifying the cell geometry to allowvery fast flow rates, Compton and Northing expected the timeresponse to improve significantly, with values approaching 1 sbeing expected.
Their studies also indicated that the catalysis of thefluoranthene reduction of nitrous oxide and isoflurane wasadditive, and that the two mechanisms proceeded in parallel.Their conclusion was that it would therefore be possible to usethe channel electrode sensor to analyse mixtures containingboth nitrous oxide and isoflurane, provided that an oxygenscrubber was placed upstream of the channel electrode and thatan independent means of measuring one of the two anaestheticgases, for instance using a separate amperometric nitrous oxidesensor, was available. Thus, a complete measuring systemwould consist of an oxygen scrubber, a channel electrode sensorand an independent amperometric N2O detector. This compli-cated system illustrates how difficult it is to measure electro-chemically two or more anaesthetic agents, simultaneously andseparately, in the presence of oxygen.
Although the evidence presented above suggests that a simpleelectrochemical measurement technique is well nigh impossibleto devise, some hopes have been raised by the possible use ofmicro-electrodes and non-aqueous solvents. As stated above,the early work of Compton and colleagues indicated that (atleast with macro-electrode surfaces) isoflurane demonstrated acomplete lack of electroactivity with a wide range of electrodematerials in both aqueous and non-aqueous solvents. Otherwork, published in patent form,140 has now indicated that notonly isoflurane, but also other inhalational agents such ashalothane, enflurane and sevoflurane, can be reduced on Aumicro-electrodes in DMSO solution.
The published work reported so far has been conducted withbare Au microelectrodes (with diameters varying between 2 and10 mm) in DMSO in a reaction cell, with the anaesthetic agentsbeing supplied by conventional anaesthetic vaporisers inclinical concentrations. This work has indicated that, using Aumicro-disc electrodes, there is a window where isoflurane,halothane, enflurane and sevoflurane display diffusion-con-trolled plateaux on the voltammograms.140 Furthermore, thereduction waves for isoflurane, enflurane and sevoflurane areclearly distinguishable from that of oxygen. Also, similarly tothe case of the production of O2 and N2O in DMSO with micro-electrodes, the reduction current for 33% oxygen is between oneand two orders of magnitude smaller than that of the anaestheticagents at their usual clinical concentrations (0.6–1.0% v/v).This is illustrated in Fig. 27 for a mixture of 1% v/v enflurane ina 33% v/v oxygen–67% v/v nitrogen mixture. Fig. 28 illustratesa series of voltammograms for enflurane, halothane, isofluraneand sevoflurane, giving a comparison of their respective
Fig. 27 A voltammogram for the reduction of 1% v/v enflurane in 33%O2–67% N2 for an unshielded 10 mm Au micro-disc electrode in DMSOsolution.
Analyst, June 1998, Vol. 123 83R

reduction potentials in DMSO solution. Although this work hasyet to be reported in detail, it does illustrate that the use ofmicro-disc electrodes and aprotic solutions may lead to a wholenew understanding of the electrochemistry of anaesthetic agentsin clinical gas mixtures.
Conclusion
This review has attempted to chart a pathway through theundeniably difficult waters of the electrochemistry of clinicalgases and vapours. Despite valiant efforts by many researchers,little real electrochemical progress seems to have been madeover the past four decades, following the discovery anddemonstration of the ever-popular Clark and Stow–Severing-haus O2 and CO2 sensors. It is only, perhaps, when both theelectrochemist and the physiologist/clinician turn their eyesback to the roots of electrochemical research in biology andmedicine, namely that of the micro-disc electrode, that newprogress will be made in this field. As far as this reviewer isconcerned, the macro-disc electrode has had its day, perhapseven in the field of gaseous analysis. Although the supply ofanalyte molecules is essentially ‘infinite’ in a gas sample, and itis therefore tempting to manufacture macro-electrode sensors,the clear indications are that micro-electrodes allow individualgas species in gas mixtures to be separated electrochemically onthe same surface, and thus analysed simultaneously andseparately. It is beginning to appear that this process mightapply not only to simple gas species such as O2 and CO2 but alsoto the anaesthetic gases and vapours. Only further research anddevelopment in this area will prove whether this hypothesis isshort- or long-lived.
References
1 Astrup, P., and Severinghaus, J. W., The History of Blood Gases,Acids and Bases, Munksgaard, Copenhagen, 1st edn., 1986.
2 Severinghaus, J. W., and Astrup, P., J. Clin. Monit., 1985, 1, 180.3 Severinghaus, J. W., and Astrup, P., J. Clin. Monit., 1985, 1, 259.4 Severinghaus, J. W., and Astrup, P., J. Clin. Monit., 1986, 2, 60.5 Severinghaus, J. W., and Astrup, P., J. Clin. Monit., 1986, 2, 125.6 Severinghaus, J. W., and Astrup, P., J. Clin. Monit., 1986, 2, 174.7 Nunn, J. N., Nunn’s Applied Respiratory Physiology, Butterworth
Heinemann, London, 4th edn., 1993.8 Sykes, M. K., Principles and Practice of Respiratory Support, BMJ
Publishing Group, London, 1st edn., 1995.9 Gilbert, H. C., and Vender, J. S., J. Clin. Monit., 1996, 12, 179.
10 Hoffer, J. L., and Norfleet, E. A., J. Clin. Monit., 1996, 12, 183.11 Market Opportunities for Advanced Sensors in Healthcare, Report to
the Department of Trade and Industry, C3326-FR-002a, CambridgeConsultants, Cambridge, 1989, p. 18 and Table 1.
12 Hutton, P., and Prys-Roberts, C., Monitoring in Anaesthesia andIntensive Care, Saunders, Philadelphia, 1st edn., 1994.
13 Hitchman, M. L., Measurement of Dissolved Oxygen, Wiley,Chichester, 1978.
14 Hahn, C. E. W., J. Phys., 1980, 13, 470.15 Hahn, C. E. W., J. Phys. E, 1981, 14, 783.16 Sykes, M. K., J. Clin. Monit., 1987, 3, 116.17 Stow, R. W., Baer, R. F., and Randall, B., Arch. Phys. Med. Rehabil.,
1957, 38, 646.18 Gertz, K. H., and Loeschcke, H. H., Naturwissenschaften, 1958, 148,
115.19 Severinghaus, J. W., and Bradley, A. F., J. Appl. Physiol., 1958, 13,
515.20 Parker, D., Delpy, D., and Lewis, M., Med. Biol. Eng. Comput., 1978,
16, 599.21 Daneel, H. L., Z. Elektrochem., 1897/8, 4, 227.22 Blinks, L. R., and Skow, R. K., Proc. Natl. Acad. Sci. USA, 1938, 24,
420.23 Clark, L. C., Trans. Am. Soc. Artif. Intern. Organs, 1956, 2, 41.24 Fatt, I., Polarographic Oxygen Sensor: Its Theory of Operation and
Its Application in Biology, Medicine and Technology, CRC Press,Cleveland, OH, 1976.
25 Kreuzer, F., Kimmich, H. P., and Brezina, M., in Medical andBiological Applications of Electrochemical Devices, Wiley, Chiches-ter, 1980, pp. 173–261.
26 Polarographic Oxygen Sensors: Aquatic and Physiological Applica-tions, ed. Gnaiger, E., and Forstner, H., Springer, New York, 1983.
27 Linek, V., Vacek, V., Snikule, J., and Benes, P., Measurement ofOxygen by Membrane-Covered Probes: Guidelines for Applicationsin Chemical and Biochemical Engineering, Ellis Horwood, Chiches-ter, 1988.
28 Adams, A. P., and Hahn C. E. W., Principles and Practice of Blood-Gas Analysis, Churchill Livingstone, London, 2nd edn., 1982.
29 Jacq, J., and Bloch, O., Electrochim. Acta, 1964, 9, 551.30 Wroblowa, H. S., Yen, C.-P., and Razumney, G., J. Electroanal.
Chem., 1976, 69, 195.31 Appleby, A. J., and Savy, M., J. Electroanal. Chem., 1978, 92, 15.32 Hahn, C. E. W., Davis, A., and Albery, W. J., Respir. Physiol., 1975,
25, 109.33 Staub, N. C., J. Appl. Physiol., 1961, 16, 192.34 Hansen, J. E., and Fiel, M. C., Chest, 1988, 94, 49.35 Hahn, C. E. W., DPhil Thesis, University of Oxford, 1974.36 Ultman, J. S., Firouztale, E., and Skerpon, M. J., J. Electroanal.
Chem., 1981, 127, 59.37 Firouztale, E., Skerpon, M. J., and Ultman, J. S., J. Electroanal.
Chem., 1982, 134, 1.38 Jenson, O. J., Jacobson, T., and Thomas, K., J. Electroanal. Chem.,
1978, 87, 203.39 Mancy, K. H., Okun, D. A., and Reilley, C. N., J. Electroanal. Chem.,
1962, 4, 65.40 Myland, J. C., and Oldham, K. B., J. Electrochem. Soc.,1984, 131,
1815.41 Sutton, L., Gavaghan, D. J., and Hahn, C. E. W., J. Electroanal.
Chem., 1996, 408, 21.42 Gavaghan, D. J., Rollett, J. S., and Hahn, C. E. W., J. Electroanal.
Chem., 1992, 325, 23.43 Gavaghan, D. J., Rollett, J. S., and Hahn, C. E. W., J. Electroanal.
Chem., 1993, 348, 1.44 Gavaghan, D. J., Rollett, J. S., and Hahn, C. E. W., J. Electroanal.
Chem., 1993, 348, 15.45 Gavaghan, D. J., and Rollett, J. S., J. Electroanal. Chem., 1990, 295,
1.46 Parker, D., Key, A., and Davies, R., Lancet, 1971, i, 952.47 Parker, D., Key, A., Davies, R. Scopes, J. W., and Marcovitch, H.,
Biomed. Eng., 1971, 6, 313.48 Rolfe, P., in IEE Medical Electronics Monographs, ed. Hill, D. W.,
and Watson, B. W., Peregrinus Press, London, 1976, vol. 18–22,pp. 126–158.
49 Mindt, W., Proc. Jahrestagung D. G. Biomed. Technol. Erlangen,1973, 29.
50 Kreuzer, F., and Nessler, C. G., Science, 1958, 128, 1005.51 Krog, J., and Johanson, K., Rev. Sci. Instrum., 1959, 30, 108.
Fig. 28 Voltammograms for the reduction of enflurane, halothane,isoflurane and sevoflurane at an unshielded 12 mm Au micro-disc electrode,all on the same voltage scale, giving a comparison of their respectivereduction potentials. (a) 1% v/v sevoflurane; (b) 1% v/v enflurane; (c) 0.6%v/v halothane; and (d) 0.6% v/v isoflurane.
84R Analyst, June 1998, Vol. 123

52 Charlton, G., Read, D., and Reed, J., J. Appl. Physiol., 1963, 18,1247.
53 Eberhard, P., Fehlmann, W., and Mindt, W., Biotelemetry PatientMonit., 1979, 6, 16.
54 Zhang, S., Wright, G., Kingston, M. A., and Rolfe, P., Med. Biol. Eng.Comput., 1996, 34, 313.
55 Zhang, S., Benmakroha, Y., and Rolfe, P., Biosens. Bioelectron.,1996, 11, 1019.
56 Chapman, D., Biochem. Soc. Trans., 1993, 21, 258.57 Benmakroha, Y., Zhang, S., and Rolfe, P., Med. Biol. Eng. Comput.,
1995, 33, 811.58 Gerlach, V., Arch. Anat. Physiol. Lp3, 1851, 431.59 Baumberger, J. P., and Goodfriend, R. B., Fed. Proc. Fed. Am. Soc.
Exp. Biol., 1951, 10, 10.60 Rooth, G., Sjosted, S., and Caligara, F., Sci. Tools, 1957, 4, 37.61 Huch, A., Huch, R., and Lubbers, D. W., Arch. Gynaekol., 1969, 207,
443.62 Huch, A., and Huch, R., Birth Defects, 1979, 15, 5.63 Eberhart, P., Hammacher, K., and Mindt, W., Med. Technol.
(Stuttgart), 1972, 26.64 Berran, A. V., Huxtable, R. F., and Sperling, D. R., J. Appl. Physiol.,
1976, 41, 442.65 Whitehead, M. D., Halsall, D., Pollitzer, M. J., Delpy, D., Parker, D.,
and Reynolds, E. O. R., Paediatr. Res., 1980, 14, 1426.66 Severinghaus, J. W., Weiskopf, R. B., Nishimura, M., and Bradley, A.
F., J. Appl. Physiol., 1971, 31, 640.67 Bates, M. L, Feingold, A., and Gold, M. I., Am. J. Clin. Pathol., 1975,
64, 448.68 Dent, J. G., and Netter, K. J., Br. J. Anaesth., 1976, 48, 195.69 Stosseck, K., Anaesthetist, 1977, 26, 1977.70 Albery, W. J., Brooks, W. N., Gibson, S. P., and Hahn, C. E. W., J.
Appl. Physiol., 1978, 45, 637.71 Evans, M. C., and Cameron, I. R., Lancet, 1978, ii, 1371.72 Douglas, I. H. S., McKenzie, P. J., McA Ledingham, I., and Smith,
G., Lancet, 1978, ii, 1370.73 Brown, B. R., Anesthesiology, 1979, 30, 146.74 Norden, A. G. W., and Flynn, F. V., Clin. Chim. Acta, 1979, 99,
229.75 Eletskii, V. V., Rotenberg, Z. A., and Pleskov, Y. V., Sov.
Electrochem., 1969, 5, 428.76 Stegan, von der J. H. G., Visscher, W., and Hoogland, J. G.,
Electrochem. Technol., 1966, 4, 564.77 Dutta, D., and Landolt, D., J. Electrochem. Soc., 1972, 119, 1320.78 Gadde, R., and Burchenstein, S., J. Electroanal. Chem., 1974, 50,
163.79 Zakorski, S. P., and Suwalski, J. P., J. Electroanal. Chem., 1973, 46,
353.80 Johnson, K. E., and Sawyer, D. T., J. Electroanal. Chem., 1974, 49,
95.81 Gutmann, V., Gritzner G., and Schrober, G., Mikrochim. Acta, 1964,
193.82 Eberhard, P., and Mindt, W., paper presented at the First International
Symposium, Marburg, 1978.83 Sugioka, K. Cattermole, R. W., and Sebel, P.S ., Br. J. Anaesth., 1987,
59, 1548.84 Armstrong, R. F., Hutchinson, J. M., Lincoln, C., Ingram, D., and
Soutter, L., Br. J. Anaesth., 1976, 48, 1005.85 Albery, W. J., Brooks, W. N., Gibson, S. P., Heslop, M. W., and
Hahn, C. E. W., Electrochim. Acta, 1979, 24, 108.86 Hahn, C. E. W., Brooks, W. N., Albery, W. J., and Rolfe, P.,
Anaesthesia, 1979, 34, 263.87 Brooks, W. N., Hahn, C. E. W., Foëx, P., Maynard, P., and Albery, W.
J., Br. J. Anaesth., 1980, 52, 715.88 Hahn, C. E. W., Hall, E. A. H, Maynard, P., and Albery, W. J., Br. J.
Anaesth., 1982, 54, 681.89 Bergman, I., Br. Pat., 1 200 595, 1966.90 Bergman, I., Nature (London), 1968, 218, 266.91 Bergman, I., and Windle, D. A., Ann. Occup. Hyg., 1972, 15, 329.92 Ebert, H., Parsons, R., Ritzoulis, G., and VanderNoot, T., J.
Electroanal. Chem., 1989, 264, 181.93 Ritzoulis, G., J. Electroanal. Chem., 1992, 327, 209.94 Ahmadi, A., Bracey, E., Evans, R. W., and Attard, G., J. Electroanal.
Chem., 1993, 350, 297.95 Attard, G. A., and Ahmadi, A., J. Electroanal. Chem., 1995, 389,
175.96 Kudo, A., and Mine, A., J. Electroanal. Chem., 1996, 408, 267.
97 Dobkin, A. B., Development of New Volatile Inhalation Anaesthetics,Elsevier, Amsterdam, 1979, 51.
98 Severinghaus, J. W., Weiskopf, R. B., Nishimura, M., and Bradley,A. F., J. Appl. Physiol., 1971, 31, 640.
99 Bates, M. L., Feingold, A., and Gold, M. I., J. Clin. Pathol., 1975, 64,448.
100 Dent, J. G., and Netter, K. J., Br. J. Anaesth., 1976, 48, 195.101 Smirnov, P. N., Izd. Kazansk. Univ., Kazan’, 1962, 120.102 Smirnov, P. N., Sov. Invent. Illustr., Gen. Org., 1963, 6.103 Gol'din, M. M., Feoktistov, L. G., Tomilov, A. P., and Smirnov, K.
M., J. Gen. Chem. USSR, 1972, 42, 2552.104 Albery, W. J., Hahn, C. E. W., and Brooks, W. N., Br. J. Anaesth.,
1981, 53, 447.105 Hall, E. A. H., Conhill, E. J., and Hahn, C. E. W., J. Biomed. Eng.,
1988, 10, 319.106 Tebbutt, P., and Hahn, C. E. W., J. Electroanal. Chem., 1989, 261,
205.107 Mount, A. R., Appleton, M. S and Albery, W. J., J. Electroanal.
Chem., 1992, 334, 155.108 Mount, A. R., Appleton, M. S., Albery, W. J., and Hahn, C. E. W., J.
Electroanal. Chem., 1992, 340, 287.109 Mount, A. R., and Clark, D., J. Electroanal. Chem., 1994, 367,
175.110 Langmaier, J., and Samec, Z., J. Electroanal. Chem., 1996, 402,
107.111 Caruana, D. J., and Giglio, J., J. Chem. Soc., Faraday Trans., 1996,
92, 3669.112 Elliott, R. H., and Strunin, L., Br. J. Anaesth., 1993, 70, 339.113 Blogg, C. E., Br. Med. J., 1986, 292, 1691.114 O’Connor, Today’s Anaesth., 1996, 11, 19.115 Peover, M. E., and White, B. S., Chem. Commun., 1965, 183.116 Maricle, D. J., and Hodgson, W. G., Abstracts, 149th Meeting of the
American Chemical Society, Division of Analytical Chemistry,Detroit, 1965, p. 9B.
117 Sawyer, D. T., and Roberts, J. L., J. Electroanal. Chem., 1966, 12,90.
118 Bauer, D., and Beck, J.-P., J. Electroanal. Chem., 1972, 40, 233.119 Fujinaga, T., Izutsu, K., and Adachi, T., Bull. Chem. Soc. Jpn., 1969,
42, 140.120 Sawyer, D. T., and Gibian, M.-J., Tetrahedron, 1979, 35, 1471.121 Sawyer, D. T., and Valentine, J. S., Acc. Chem. Res., 1981, 14,
393.122 Tsushima, M., Tokuda, K., and Ohsaka, T., Anal. Chem., 1994, 66,
4551.123 Vasudevan, D., and Wendt, H., J. Electroanal. Chem., 1995, 192,
69.124 Dehn, H., Gutmann, V., Kirch, H., and Schöber, G., Monatsh. Chem.,
1962, 93, 1348.125 Roberts, J. L., and Sawyer, D. T., J. Electroanal. Chem., 1965, 9,
1.126 Haynes, L. V., and Sawyer, D. T., Anal. Chem., 1967, 39, 332.127 Lamy, E., Nadjo, L., and Saveant, J. M., J. Electroanal. Chem., 1977,
78, 403.128 Kaiser, Von U., and Heitz, E., Reaktionslenk. Elektrochem., 1977, 77,
818.129 Gressin, J. C., Michelet, D., Nadjo, L., and Saveant, J. M., Nouv. J.
Chim., 1979, 3, 545.130 Amatore, C., and Saveant, J. M., J. Am. Chem. Soc., 1981, 103,
5021.131 Eggins, B. R., and McNeill, J., J. Electroanal. Chem., 1983, 148,
17.132 Coombs, A. M., DPhil Thesis, Oxford University, 1985.133 Clark, D., DPhil Thesis, Oxford University, 1987.134 Albery, W. J., and Barron, P., J. Electroanal. Chem., 1982, 138,
79.135 Albery, W. J., Clark, D., Drummond, H. J. J., Coombs, A. J. M,
Young, W. K., and Hahn, C. E. W., J. Electroanal. Chem., 1992, 340,99.
136 Albery, W. J., Clark, D., Young, W. K., and Hahn, C. E. W., J.Electroanal. Chem., 1992, 340, 111.
137 Qian, F., Lu, J., Zhou, Z., and Cha, C., Sens. Actuators B, 1993, 17,77.
138 Hahn, C. E. W., McPeak, H., Bond, A. M. S., and Clark, D., J.Electroanal. Chem., 1995, 393, 61.
139 Hahn, C. E. W., McPeak, H., and Bond, A. M., J. Electroanal. Chem.,1995, 393, 69.
Analyst, June 1998, Vol. 123 85R

140 Hahn, C. E. W., and Clark, D., Eur. Pat., 704054B, 1997; US Pat.,5720870, 1998.
141 McPeak, H., and Hahn, C. E. W., J. Electroanal. Chem., 1997, 427,179.
142 Compton, R. G., Northing, R. J., Waller, A. M., Fleet, G. W. J., andBashyal, B. P., J. Electroanal. Chem., 1988, 244, 203.
143 Compton, R. G., Northing, R. J., Fleet, G. W., Son, J. C., and Bashyal,B. P., Clin, Phys. Physiol. Meas., 1988, 9, 133.
144 Compton, R. G., and Northing, R. J., J. Chem. Soc., Faraday Trans.,1990, 86, 1077.
Paper 7/08951AAccepted December 12, 1997
86R Analyst, June 1998, Vol. 123
![Efficiency of the Electrochemical methods for the repair of ... ouarti-2018.pdf• Electrochemical chloride extraction [14-17] • Electrochemical realkalisation. [18.19] Electrochemical](https://static.fdocuments.in/doc/165x107/610237547e288528f40cbc06/efficiency-of-the-electrochemical-methods-for-the-repair-of-ouarti-2018pdf.jpg)