Tutorial: Finding Hotspots on the Intel Xeon Phi™ … · Tutorial: Finding Hotspots on the...
24
Tutorial: Finding Hotspots on the Intel ® Xeon Phi™ Coprocessor Intel ® VTune™ Amplifier for Linux* OS C++ Sample Application Code Legal Information
Transcript of Tutorial: Finding Hotspots on the Intel Xeon Phi™ … · Tutorial: Finding Hotspots on the...
Tutorial: Finding Hotspots on the Intel®Xeon Phi™ CoprocessorIntel® VTune™ Amplifier for Linux* OS
C++ Sample Application Code
Legal Information

ContentsLegal Information................................................................................ 3Overview..............................................................................................4
Chapter 1: Navigation Quick Start
Chapter 2: Finding HotspotsBuild Application .......................................................................................8Create Project and Configure Target........................................................... 11Run Advanced Hotspots Analysis................................................................ 13Interpret Results......................................................................................14Analyze Code.......................................................................................... 16Tune Algorithms.......................................................................................17Compare with Previous Result....................................................................19
Chapter 3: Summary
Chapter 4: Key Terms
Tutorial: Finding Hotspots on the Intel® Xeon Phi™ Coprocessor
2

Legal InformationNo license (express or implied, by estoppel or otherwise) to any intellectual property rights is granted by thisdocument.
Intel disclaims all express and implied warranties, including without limitation, the implied warranties ofmerchantability, fitness for a particular purpose, and non-infringement, as well as any warranty arising fromcourse of performance, course of dealing, or usage in trade.
This document contains information on products, services and/or processes in development. All informationprovided here is subject to change without notice. Contact your Intel representative to obtain the latestforecast, schedule, specifications and roadmaps.
The products and services described may contain defects or errors which may cause deviations frompublished specifications. Current characterized errata are available on request.
Intel processor numbers are not a measure of performance. Processor numbers differentiate features withineach processor family, not across different processor families. Go to: Learn About Intel® Processor Numbers
Software and workloads used in performance tests may have been optimized for performance only on Intelmicroprocessors. Performance tests, such as SYSmark and MobileMark, are measured using specificcomputer systems, components, software, operations and functions. Any change to any of those factors maycause the results to vary. You should consult other information and performance tests to assist you in fullyevaluating your contemplated purchases, including the performance of that product when combined withother products.
Cilk, Intel, the Intel logo, Intel Atom, Intel Core, Intel Inside, Intel NetBurst, Intel SpeedStep, Intel vPro,Intel Xeon Phi, Intel XScale, Itanium, MMX, Pentium, Thunderbolt, Ultrabook, VTune and Xeon aretrademarks of Intel Corporation in the U.S. and/or other countries.
*Other names and brands may be claimed as the property of others.
Microsoft, Windows, and the Windows logo are trademarks, or registered trademarks of Microsoft Corporationin the United States and/or other countries.© 2016, Intel Corporation.
3

Overview
Discover how to analyze a native application running on an Intel® Xeon Phi™ coprocessor card with theIntel® VTune™ Amplifier and identify the most performance-critical code.
About ThisTutorial
This tutorial uses the sample matrix application and guides you through basic stepsrequired to analyze the code for hotspots on the Intel Xeon Phi coprocessor (codename: Knights Corner) based on Intel Many Integrated Core architecture (Intel MICarchitecture).
EstimatedDuration
10-15 minutes.
LearningObjectives
After you complete this tutorial, you should be able to:
• Create a VTune Amplifier project.• Configure an analysis target for Intel Xeon Phi coprocessor (native) target system
type and run it on a card.• Configure and run Advanced Hotspots analysis for the Intel Xeon Phi coprocessor.• Identify the modules/functions that consumed a lot of CPU time.• Analyze the source code to locate the most critical code lines.
More Resources • Intel VTune Amplifier tutorials (HTML, PDF): https://software.intel.com/en-us/articles/intel-vtune-amplifier-tutorials/
• Intel VTune Amplifier support page: https://software.intel.com/en-us/intel-vtune-amplifier-xe-support/
• Intel Parallel Studio XE support page: https://software.intel.com/en-us/intel-parallel-studio-xe/
Tutorial: Finding Hotspots on the Intel® Xeon Phi™ Coprocessor
4

Navigation Quick Start 1 Intel® VTune™ Amplifier provides information on code performance for users developing serial and
multithreaded applications on Windows*, Linux*, and OS X* operating systems. VTune Amplifier helps youanalyze algorithm choices and identify where and how your application can benefit from available hardwareresources.
VTune Amplifier XE AccessVTune Amplifier installation includes shell scripts that you can run in your terminal window to set upenvironment variables:
1. From the installation directory, type source amplxe-vars.sh.
This script sets the PATH environment variable that specifies locations of the product graphical userinterface utility and command line utility.
NOTE:
The default installation directory is:
• For root users: /opt/intel/vtune_amplifier_xe_version• For non-root users: $HOME/intel/vtune_amplifier_xe_version
2. Type amplxe-gui to launch the product graphical interface.
5
VTune Amplifier GUI
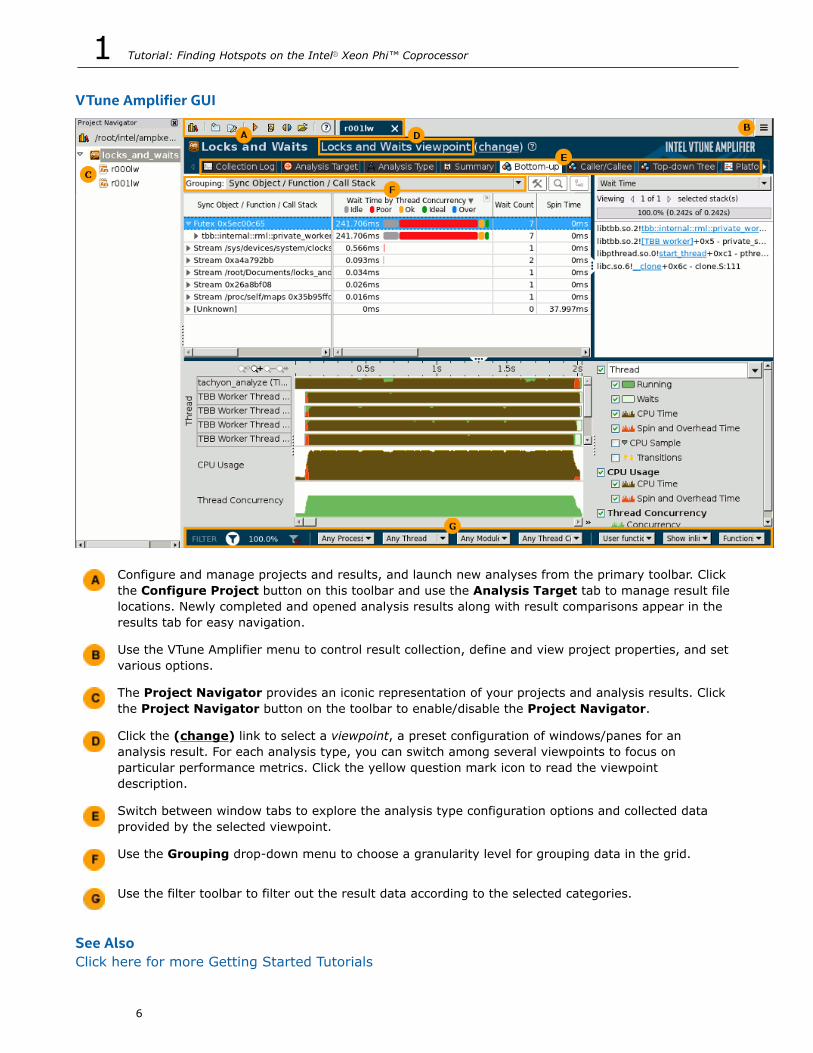
Configure and manage projects and results, and launch new analyses from the primary toolbar. Clickthe Configure Project button on this toolbar and use the Analysis Target tab to manage result filelocations. Newly completed and opened analysis results along with result comparisons appear in theresults tab for easy navigation.
Use the VTune Amplifier menu to control result collection, define and view project properties, and setvarious options.
The Project Navigator provides an iconic representation of your projects and analysis results. Clickthe Project Navigator button on the toolbar to enable/disable the Project Navigator.
Click the (change) link to select a viewpoint, a preset configuration of windows/panes for ananalysis result. For each analysis type, you can switch among several viewpoints to focus onparticular performance metrics. Click the yellow question mark icon to read the viewpointdescription.
Switch between window tabs to explore the analysis type configuration options and collected dataprovided by the selected viewpoint.
Use the Grouping drop-down menu to choose a granularity level for grouping data in the grid.
Use the filter toolbar to filter out the result data according to the selected categories.
See AlsoClick here for more Getting Started Tutorials
1 Tutorial: Finding Hotspots on the Intel® Xeon Phi™ Coprocessor
6

Finding Hotspots 2 You can use the Intel® VTune™ Amplifier to identify the most performance-critical functions in an
application running on the Intel® Xeon Phi™ coprocessor (code name: Knights Corner). This tutorial guidesyou through workflow steps running Advanced Hotspots analysis type on a sample application, matrix.
Step 1: Preparefor analysis
• Build an application, copy it to the card, and set a performance baseline.• Create a VTune Amplifier project, specify the Intel Xeon Phi (native) target
system, provide a full path to the target application on the card , and configuresearch directories
Step 2: Findhotspots
• Choose and run Advanced Hotspots analysis.• Explore performance metrics and identify a hotspot.• View and analyze code of the performance-critical function.
Step 3: Eliminatehotspots
• Modify the code to resolve the detected performance issues and rebuild the codeenabling the vectorization option of the Intel compiler.
7

Step 4: Checkyour work
• Re-run the analysis and compare results before and after optimization
Optimization Notice
Intel's compilers may or may not optimize to the same degree for non-Intel microprocessors foroptimizations that are not unique to Intel microprocessors. These optimizations include SSE2, SSE3, andSSSE3 instruction sets and other optimizations. Intel does not guarantee the availability, functionality, oreffectiveness of any optimization on microprocessors not manufactured by Intel. Microprocessor-dependent optimizations in this product are intended for use with Intel microprocessors. Certainoptimizations not specific to Intel microarchitecture are reserved for Intel microprocessors. Please refer tothe applicable product User and Reference Guides for more information regarding the specific instructionsets covered by this notice.
Notice revision #20110804
Build Application
Before you start identifying hotspots in your native Intel® Xeon Phi™ coprocessor application, do thefollowing:
1. Get software tools.2. Build application with full optimizations on the host.3. Create a performance baseline.
Get Software ToolsYou need the following tools to try these tutorial steps yourself using the matrix sample application:
• Intel® VTune™ Amplifier, including sample applications• Sampling driver, set up during the VTune Amplifier installation
NOTE:
If, for some reason, the VTune Amplifier was not able to install the driver, you will not be able to runthe analysis and will see a warning message. See online help for additional instructions how to installthe driver manually.
• Intel® Manycore Platform Software Stack (Intel® MPSS). See Release Notes for more information.
• tar file extraction utility• Intel® C++ Compiler installed on the host. See Release Notes for more information.
Acquire Intel VTune Amplifier
If you do not already have access to the VTune Amplifier, you can download an evaluation copy from http://software.intel.com/en-us/articles/intel-software-evaluation-center/.
Install and Set Up VTune Amplifier Sample Applications
1. Copy the matrix_vtune_amp_xe.tgz file from the <install_dir>/samples/<locale>/C++directory to a writable directory or share on your system.
2 Tutorial: Finding Hotspots on the Intel® Xeon Phi™ Coprocessor
8

NOTE:
The default installation path for the VTune Amplifier XE is /opt/intel/vtune_amplifier_xe_version. For the VTune Amplifier for Systems, the default <install_dir> is:
• For super-users: /opt/intel/system_studio_version/vtune_amplifier_for_systems• For ordinary users: $HOME/intel/system_studio_version/vtune_amplifier_for_systems
2. Extract the sample from the .tgz file.
NOTE:
• Samples are non-deterministic. Your screens may vary from the screen captures shown throughoutthis tutorial.
• Samples are designed only to illustrate the VTune Amplifier features; they do not represent bestpractices for creating code.
Build the TargetBuild the target on the host with full optimizations, which is recommended for performance analysis.
1. Browse to the linux directory within where you extracted the sample code (for this example assumethat location is /home/sample/matrix/linux). Make sure this directory contains Makefile.
2. Set up the environment for Intel C++ Compiler:
source <path_to_compiler_bin>/compilervars.sh intel643. Build the code using the make command:
$ make micThe matrix application is built as matrix.mic and stored in the matrix/linux directory.
NOTE:
This application uses OpenMP* library for compilation. To run the sample on the Intel Xeon Phicoprocessor, make sure to copy the OpenMP library to the card and set up the default path.
Create a Performance BaselineTo communicate with the Intel Xeon Phi coprocessor cards, you may use any of the following mechanisms:
• Mount an NFS share. See the NFS Mounting a Host Export topic in the Intel Manycore ProgrammingSoftware Stack help for details.
• Use existing SSH tools.
1. Ensure that the binary to analyze is copied to the Intel Xeon Phi coprocessor. You can do this by usingscp, for example:
scp matrix.mic mic0:/tmp
Finding Hotspots 2
9

NOTE:
You may add this command to build scripts to automate a copy action after the binary recompilation.In this tutorial's scenario, scp command is added to the Makefile. So, the matrix application is builtand automatically copied to the Intel Xeon Phi coprocessor.
2. Run the application on the coprocessor using ssh and record the results to establish a performancebaseline:
3. Note the execution time displayed at the bottom. For the matrix.mic executable in the figure above,the execution time is 30.466 seconds. Use this metric as a baseline against which you will comparesubsequent runs of the application.
NOTE:
Run the application several times, noting the execution time for each run, and use the average time.This helps to minimize skewed results due to transient system activity.
NOTE:
• If you experience a problem with permissions to run the commands, use sudo or root access.• Alternatively, you may create an ssh script to copy and launch your application on a card or use
the micnativeloadex utility. For details, see the Preparing an Intel® Xeon Phi™ CoprocessorSystem for Analysis online help topic.
Key Terms• Target
Next StepCreate Project and Configure Target
2 Tutorial: Finding Hotspots on the Intel® Xeon Phi™ Coprocessor
10

Create Project and Configure Target
To start performance analysis for an application on the Intel® Xeon Phi™ coprocessor, do the following:
1. Create a VTune Amplifier project.2. Specify an analysis target.3. Configure search directories for symbol resolution.
Create a VTune Amplifier Project1. Type amplxe-gui to launch the VTune Amplifier GUI.2. Create a new project via New > Project... menu.
The Create a Project dialog box opens.3. Specify the project name matrix that will be used as the project directory name and click the Create
Project button.
By default, the VTune Amplifier creates a project directory under the $HOME/intel/amplxe/projects(for VTune Amplifier XE) or $HOME/intel/amplsys/projects (for VTune Amplifier for Systems)directory and opens the Choose Target and Analysis Type window with the Analysis Target tabactive.
Specify an Analysis Target
NOTE:
This tutorial focuses on analyzing a native Intel Xeon Phi coprocessor application that is copied and runon the card. To configure an analysis for an offload application target, make sure to select the IntelXeon Phi coprocessor (host launch) type of the target system and specify the application namewith the full path on the host in the Application field in the Analysis Target tab. See VTune AmplifierHelp for more details.
1. In the Analysis Target tab, select the Intel Xeon Phi coprocessor (native) type from the left pane.
The configuration pane on the right is updated with the options applicable to the selected target systemtype.
2. Make sure the Launch Application target type is selected in the drop-down menu on the right.3. Specify the Intel Xeon Phi coprocessor card where your application is located. By default, 0(mic0) card
is pre-selected.4. In the Application field, specify a full path to the matrix application on the card: /tmp/matrix.mic as
an application to launch.
Finding Hotspots 2
11

Configure Search DirectoriesVTune Amplifier resolves symbols for Intel Xeon Phi coprocessor-based modules on the host during collectionpost-processing. For proper symbol resolution, you need to specify host search paths for the application andfor Intel Xeon Phi coprocessor modules before the collection:
1. In the Choose Target and Analysis Type window, click the Binary/Symbol Search button on theright.
The Binary/Symbol Search dialog box opens.2. In the Search Directories field, click the Browse button to add the application directory on the host
and OpenMP* directory.3. Click OK to save your changes.
Key Terms• Target• Project
2 Tutorial: Finding Hotspots on the Intel® Xeon Phi™ Coprocessor
12

Next StepRun Hotspots Analysis
Run Advanced Hotspots Analysis
After building the sample application and collecting baseline performance data for it, rerun it under thescrutiny of Intel® VTune™ Amplifier to discover what parts of the code are being most used. AdvancedHotspots analysis collects event and IP (Instruction Pointer) information to reveal evidence of a basic set ofhardware issues induced by the application code that may be affecting its performance.
Prerequisites: You created a project and specified your sample application as an Intel Xeon Phicoprocessor (native) target in the Analysis Target tab.
To run the analysis:
1. Click the Choose Analysis button on the right, or switch to the Analysis Type tab.
NOTE:
VTune Amplifier automatically detects your target system configuration and displays analysis typesapplicable to the Intel® Xeon Phi™ coprocessor.
2. From the analysis tree on the left, select the Algorithm Analysis > Advanced Hotspots analysistype.
The Advanced Hotspots predefined configuration opens on the right.
3. Click the Start button on the right to run the analysis.
VTune Amplifier starts the matrix.mic application on the Intel Xeon Phi coprocessor card via SSHconnection. The application calculates a large matrix multiply before exiting. When the application exits orafter a predefined interval, depending on how the collection run was configured, collection is completed andthe VTune Amplifier enters its finalization process, where data are coalesced, symbols are reconnected totheir addresses, and certain data are cached to speed the display of results.
Finding Hotspots 2
13
NOTE:
To make sure the performance of the application is repeatable, go through the entire tuning processon the same system with a minimal amount of other software executing.
Key Terms• Finalization• Viewpoint
Next StepInterpret Results
Interpret Results
When the sample application exits, the Intel® VTune™ Amplifier finalizes the results and opens theHotspots viewpoint where each window or pane is configured to easily identify code regions that consumed alot of CPU time. To interpret the data on the sample code performance, do the following:
• Analyze basic performance statistics.• Identify most performance-critical functions
NOTE:
The screenshots and execution time data provided in this tutorial are created on a system with morethan 240 logical cores. Your data may vary depending on the number and type of CPU cores on yoursystem.
Analyze Basic Performance Statistics
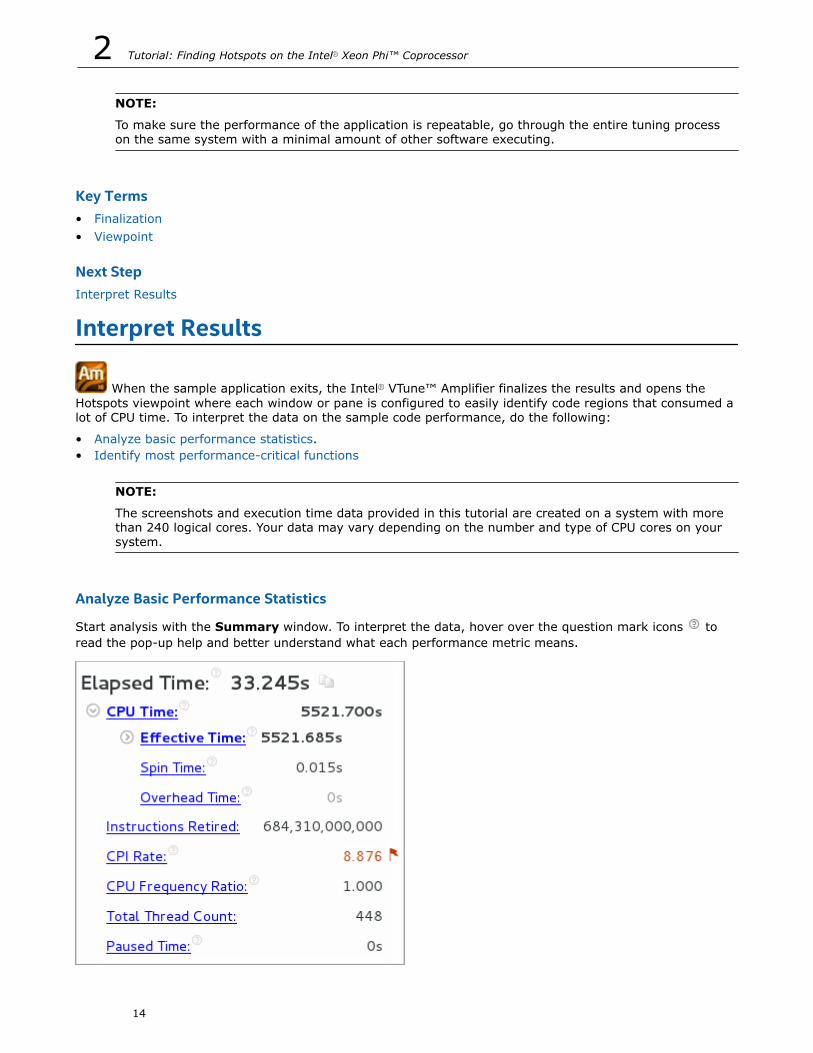
Start analysis with the Summary window. To interpret the data, hover over the question mark icons toread the pop-up help and better understand what each performance metric means.
2 Tutorial: Finding Hotspots on the Intel® Xeon Phi™ Coprocessor
14
• Elapsed time for the matrix application is 33.245 seconds. This is wall clock time from the beginning tothe end of the collection, including data allocation and calculation. Note that Elapsed time metric providedin the Summary window is different from the Execution time provided in the application output, whichincludes calculation only.
• CPU Time is equal to 5521.685 seconds. It is the sum of CPU time for all application threads.• Instructions Retired metric displays an estimated number of instructions executed during the collection
(captured in the INSTRUCTIONS_EXECUTED hardware event), which is an essential component of theratio given below.
• Clockticks per Instructions Retired (CPI) Rate is an event ratio, also known as Cycles perInstructions, which is one of the basic performance metrics. High CPI Rate is marked with a red flag andsignals a possible performance issue. Potential causes are memory stalls, instruction starvation, branchmisprediction, or long-latency instruction.
For more detailed analysis, switch to the Bottom-up window to identify code sections responsible fordetected problems.
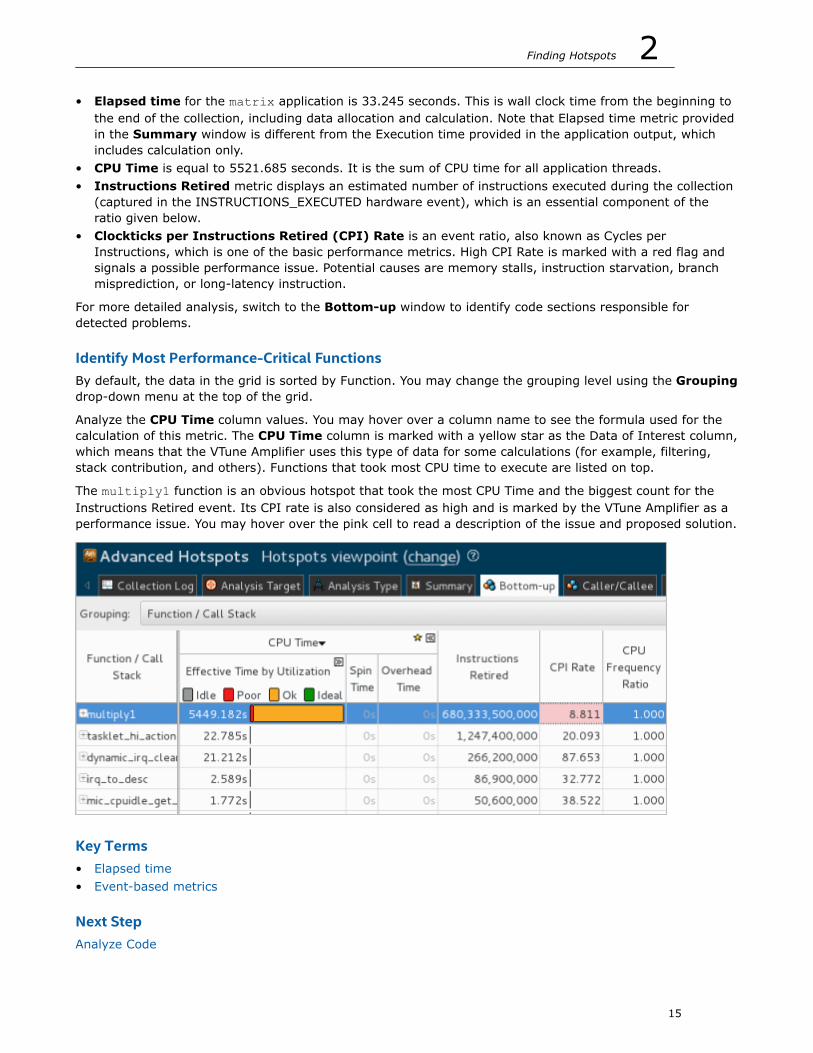
Identify Most Performance-Critical FunctionsBy default, the data in the grid is sorted by Function. You may change the grouping level using the Groupingdrop-down menu at the top of the grid.
Analyze the CPU Time column values. You may hover over a column name to see the formula used for thecalculation of this metric. The CPU Time column is marked with a yellow star as the Data of Interest column,which means that the VTune Amplifier uses this type of data for some calculations (for example, filtering,stack contribution, and others). Functions that took most CPU time to execute are listed on top.
The multiply1 function is an obvious hotspot that took the most CPU Time and the biggest count for theInstructions Retired event. Its CPI rate is also considered as high and is marked by the VTune Amplifier as aperformance issue. You may hover over the pink cell to read a description of the issue and proposed solution.
Key Terms• Elapsed time• Event-based metrics
Next StepAnalyze Code
Finding Hotspots 2
15
Analyze Code
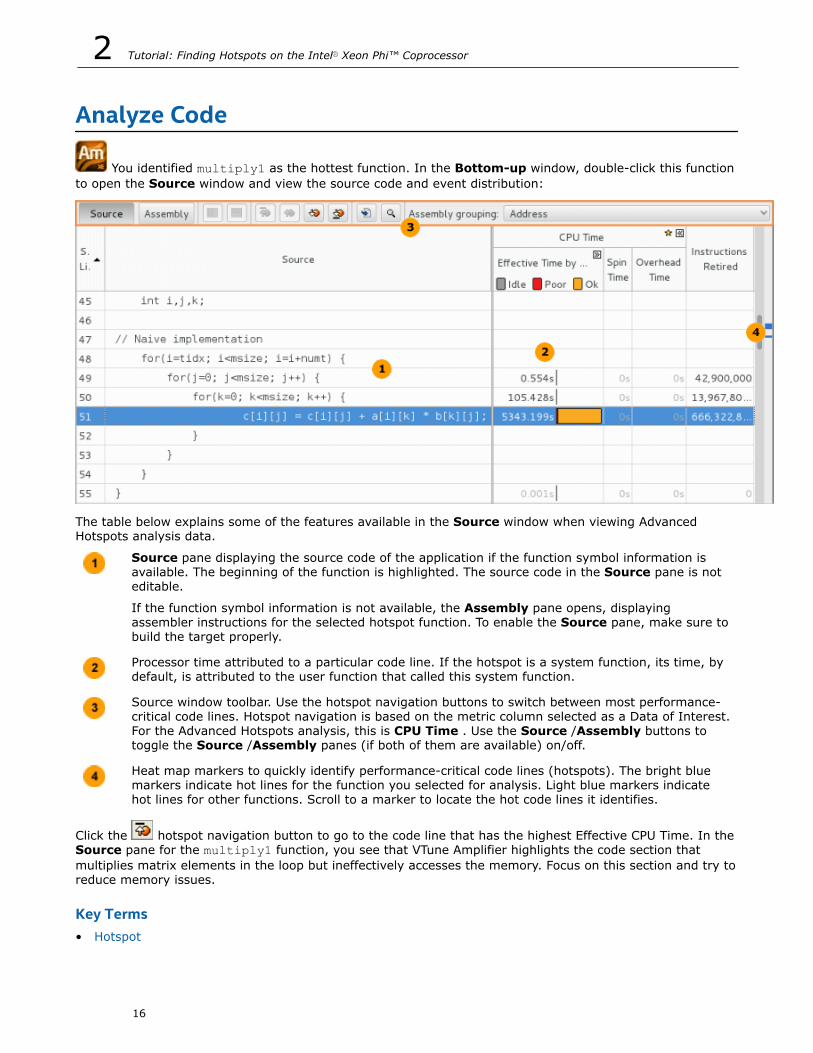
You identified multiply1 as the hottest function. In the Bottom-up window, double-click this functionto open the Source window and view the source code and event distribution:
The table below explains some of the features available in the Source window when viewing AdvancedHotspots analysis data.
Source pane displaying the source code of the application if the function symbol information isavailable. The beginning of the function is highlighted. The source code in the Source pane is noteditable.
If the function symbol information is not available, the Assembly pane opens, displayingassembler instructions for the selected hotspot function. To enable the Source pane, make sure tobuild the target properly.
Processor time attributed to a particular code line. If the hotspot is a system function, its time, bydefault, is attributed to the user function that called this system function.
Source window toolbar. Use the hotspot navigation buttons to switch between most performance-critical code lines. Hotspot navigation is based on the metric column selected as a Data of Interest.For the Advanced Hotspots analysis, this is CPU Time . Use the Source /Assembly buttons totoggle the Source /Assembly panes (if both of them are available) on/off.
Heat map markers to quickly identify performance-critical code lines (hotspots). The bright bluemarkers indicate hot lines for the function you selected for analysis. Light blue markers indicatehot lines for other functions. Scroll to a marker to locate the hot code lines it identifies.
Click the hotspot navigation button to go to the code line that has the highest Effective CPU Time. In theSource pane for the multiply1 function, you see that VTune Amplifier highlights the code section thatmultiplies matrix elements in the loop but ineffectively accesses the memory. Focus on this section and try toreduce memory issues.
Key Terms• Hotspot
2 Tutorial: Finding Hotspots on the Intel® Xeon Phi™ Coprocessor
16

Next StepTune Algorithms
Tune Algorithms
In the Source pane, you identified the code line in the multiply1 function that accumulated thehighest Effective Time values. To solve this issue, do the following:
1. Change the multiplication algorithm and enable vectorization.2. Re-run the analysis to verify optimization.
Change Algorithm
NOTE:
The proposed solution is one of the multiple ways to optimize the memory access and is used fordemonstration purposes only.
1. Open the multiply.h file from the sample code directory (for example, /home/sample/matrix/src).
For this sample, the multiply.h file is used to initialize the functions used in the multiply.c file.
2. Replace the #define MULTIPLY multiply1 with the #define MULTIPLY multiply2.
The new multiply2 function swaps the indices of the innermost two loops, in a method called loopinterchange. Note in the innermost loops that three of the array references use j as the second indexand the fourth reference does not use j at all. In C that last index addresses locations adjacent inmemory sequence, taking advantage of cache locality to use adjacent data all in one pass, and thatoptimizes the memory access in the code by minimizing cache line thrash. Moreover, arrangingsuccessive computations in array order this way makes them more likely to be recognized by thecompiler for vectorization.
Finding Hotspots 2
17

When you build the code with the Intel® C++ Compiler, it vectorizes the computation, which means thatit uses SIMD (Single Instruction Multiple Data) style instructions that can work with several dataelements simultaneously. If only one source file is used, the Intel compiler enables vectorizationautomatically. The current sample uses several source files, which is why the multiply2 function uses#pragma ivdep to instruct the compiler to ignore assumed vector dependencies. This information letsthe compiler employ the Supplemental Streaming SIMD Extensions (SSSE).
3. Save files and rebuild the application:
$ make micWhen the matrix.mic application is built and stored in the matrix/linux directory, copy it to thecoprocessor.
Verify OptimizationRe-run the application via ssh script:
You see that the Execution time has reduced significantly and you got about 27 seconds of optimization.
2 Tutorial: Finding Hotspots on the Intel® Xeon Phi™ Coprocessor
18

Key Terms• Elapsed time• Event-based metrics
Next StepCompare with Previous Result
Optimization Notice
Intel's compilers may or may not optimize to the same degree for non-Intel microprocessors foroptimizations that are not unique to Intel microprocessors. These optimizations include SSE2, SSE3, andSSSE3 instruction sets and other optimizations. Intel does not guarantee the availability, functionality, oreffectiveness of any optimization on microprocessors not manufactured by Intel. Microprocessor-dependent optimizations in this product are intended for use with Intel microprocessors. Certainoptimizations not specific to Intel microarchitecture are reserved for Intel microprocessors. Please refer tothe applicable product User and Reference Guides for more information regarding the specific instructionsets covered by this notice.
Notice revision #20110804
Compare with Previous Result
You optimized your code to apply a loop interchange mechanism that gave you 27 seconds ofimprovement in the application execution time. To understand whether you got rid of the hotspot and whatkind of optimization you got per function, re-run the Advanced Hotspots analysis on the optimized code andcompare results:
1. Compare results before and after optimization.2. Identify the performance gain.
Compare Results Before and After Optimization1. From the product menu select New > Advanced Hotspots Analysis.
VTune Amplifier reruns Advanced Hotspots analysis for the updated matrix target and creates a newresult (for example, r002ah) that opens automatically.
2.Click the Compare Results button on the Intel® VTune™ Amplifier toolbar.
The Compare Results window opens.3. Specify the Advanced Hotspots analysis results you want to compare and click the Compare Results
button.
Finding Hotspots 2
19

The Summary window opens displaying application-level performance statistics for both results andtheir difference values.
Identify the Performance GainThe Result Summary section of the Summary window shows difference information as follows: <Result 1metric> – <Result 2 metric> = <metric Difference>.
You see that after optimization all metrics values have reduced significantly, though CPI Rate is still an issue(>1).
Switch to the Bottom-up window to view the CPU time usage per function for each result and theirdifferences side by side.
2 Tutorial: Finding Hotspots on the Intel® Xeon Phi™ Coprocessor
20

Since for the second run you removed the multiply1 function, its time shows up in the Difference columnas a performance gain.
Click the CPU Time:r001ah column to sort the data in the grid by this column.
The multiply2 function shows up on top as the biggest CPU Time hotspot for the result r001ah, though itperforms better than multiply1. You may try to optimize the code further using more advanced algorithms,for example, block-structuring access to matrix data to maximize cache reuse.
Key Terms• Elapsed time• Event-based metrics
See AlsoSummary
Finding Hotspots 2
21

Summary 3 You have completed the Finding Hotspots on the Intel® Xeon Phi™ Coprocessor tutorial. Here are some
important things to remember when using the Intel® VTune™ Amplifier to analyze your code for hotspots:
Step Tutorial Recap Key Tutorial Take-aways
1. Prepare foranalysis
• You built and copied thematrix application to the cardafter each recompilation.
• You built the target applicationwith the Intel® C++ Compiler,ran it on the card via ssh, andrecorded a performancebaseline.
• You created a VTune Amplifierproject, specified the sshscript as an application tolaunch and specified the pathto the application on the cardas application parameters.
• You configured searchdirectories to resolve symbolinformation for Intel Xeon Phicoprocessor-based modulesand application modules.
• Create a VTune Amplifier project and usethe Analysis Target tab to specify thetarget system and an application toanalyze.
• VTune Amplifier starts target applications.It is not able to start an application directlyon Intel Xeon Phi coprocessor architecturecards.
• To copy the target native application to thecard, you may either add the copy actionto the build script or mount the hostdirectory so that the binary is visible onthe Intel MIC architecture target.
• Use the Analysis Type tab to choose,configure, and run the analysis. You maychoose between a predefined analysis typelike the Advanced Hotspots type used inthis tutorial, or create a new customanalysis type and add events of yourchoice. For more details on the customcollection, see the Custom Analysis topic inthe product online help.
• See the Details section of an analysisconfiguration pane to get the list ofprocessor events used for this analysistype.
2. Find hotspots You launched Advanced Hotspotsanalysis that analyzes CPU timespent in each program unit ofyour application and identified thefollowing hotspots:
• Identified a function that tookthe most CPU time, the highestevent count and CPI Rate. Thisfunction is a good candidate foralgorithm tuning.
• Identified the code section thattook the most CPU time toexecute.
• Start analyzing the performance of yourapplication from the Summary window toexplore the event-based performancemetrics for the whole application. Mouseover help icons to read metric descriptions.Use the Elapsed time value as yourperformance baseline.
• Move to the Bottom-up window andanalyze the performance per function.Focus on the hotspots - functions thatconsumed the most CPU Time. In theinitial sort, they are located at the top ofthe table. Use the CPU Rate metric tounderstand the efficiency of your code. Ifthe metric value exceeds a threshold, theVTune Amplifier highlights it in pink as aperformance issue. Mouse over ahighlighted value to read the issuedescription and see the threshold formula.
3 Tutorial: Finding Hotspots on the Intel® Xeon Phi™ Coprocessor
22

Step Tutorial Recap Key Tutorial Take-aways
• Double-click the hotspot function in theBottom-up pane to open its source codeand identify the code line that took themost CPU Time and accumulated events.
3. Eliminatehotspots
You solved the memory accessissue for the sample applicationby interchanging the loops andsped up the execution time. Youalso used the Intel compiler toenable instruction vectorization.
Consider using the Intel compiler to vectorizeinstructions. Explore the compilerdocumentation for more details.
4. Check yourwork
You ran Advanced Hotspotsanalysis on the optimized codeand compared the results beforeand after optimization
Perform regular regression testing bycomparing analysis results before and after
optimization. From GUI, click the Compare Results button on the VTuneAmplifier toolbar. From command line, use theamplxe-cl command.
Next step: Prepare your own application(s) for analysis. Then use the VTune Amplifier to find and eliminatehotspots.
Optimization Notice
Intel's compilers may or may not optimize to the same degree for non-Intel microprocessors foroptimizations that are not unique to Intel microprocessors. These optimizations include SSE2, SSE3, andSSSE3 instruction sets and other optimizations. Intel does not guarantee the availability, functionality, oreffectiveness of any optimization on microprocessors not manufactured by Intel. Microprocessor-dependent optimizations in this product are intended for use with Intel microprocessors. Certainoptimizations not specific to Intel microarchitecture are reserved for Intel microprocessors. Please refer tothe applicable product User and Reference Guides for more information regarding the specific instructionsets covered by this notice.
Notice revision #20110804
See AlsoClick here for more Getting Started Tutorials
Summary 3
23

Key Terms 4baseline : A performance metric used as a basis for comparison of the application versions before and afteroptimization. Baseline should be measurable and reproducible.
Elapsed time : The total time your target ran, calculated as follows: Wall clock time at end ofapplication – Wall clock time at start of application.
Effective time: CPU time spent in the user code. This metric does not include Spin and Overhead time.
event-based metrics : Event ratios with their own threshold values. VTune Amplifier collects event data,calculates the ratios, and provides the results in the corresponding columns of the Bottom-up /Top-downTree windows and in the Summary window. As soon as the performance of a program unit per metricexceeds the threshold, the VTune Amplifier marks this value as a performance issue (in pink) and providesrecommendations how to fix it. For the full list of metrics used by the VTune Amplifier, see the Reference forPerformance Metrics chapter in the online help.
event skid: An event detected not exactly on the code line that caused the event. Event skids may evenresult in a caller function event being recorded in the callee function. See the online help for more details.
finalization : A process during which the Intel® VTune™ Amplifier converts the collected data to a database,resolves symbol information, and pre-computes data to make further analysis more efficient and responsive.
hotspot: A section of code that the processors spend a lot of time executing. Some hotspots may indicatebottlenecks and can be removed, while other hotspots inevitably take a long time to execute due to theirnature.
project: A container for an analysis target configuration and data collection results.
target : A target is an executable file you analyze using the Intel® VTune™ Amplifier .
viewpoint : A preset result tab configuration that filters out the data collected during a performance analysisand enables you to focus on specific performance problems. When you select a viewpoint, you select a set ofperformance metrics the VTune Amplifier shows in the windows/panes of the result tab. To select therequired viewpoint, click the (change) link and use the drop-down menu at the top of the result tab.
See AlsoClick here for more Getting Started Tutorials
4 Tutorial: Finding Hotspots on the Intel® Xeon Phi™ Coprocessor
24