Tutorial 2: Pathway Analysis -...
42
Tutorial 2: Pathway Analysis CSIRO Tutorial Series: Pathway and Network Analysis CSIRO NUTRITION & FOOD Martina Summer-Kutmon, PhD | Department of Bioinformatics, Maastricht University, The Netherlands 01 December 2015
Transcript of Tutorial 2: Pathway Analysis -...

Tutorial 2: Pathway Analysis CSIRO Tutorial Series: Pathway and Network Analysis
CSIRO NUTRITION & FOOD
Martina Summer-Kutmon, PhD | Department of Bioinformatics, Maastricht University, The Netherlands 01 December 2015

Tutorial series
• Tutorial 1: Pathway creation • 24 November 2015, 2-4 PM
• Tutorial 2: Pathway analysis • 1 December 2015 , 2-4 PM
• Tutorial 3: Network analysis • 8 December 2015 , 2-4 PM
• Material (presentations and hands-on instructions) will be available on the website • http://projects.bigcat.unimaas.nl/adelaide-tutorials-2015/
CSIRO Tutorial Series: Pathway Creation | Martina Summer-Kutmon 2 |

Introduction

Data analysis
CSIRO Tutorial Series: Pathway Creation | Martina Summer-Kutmon 4 |
Quantitative measurements
Isolated data points
Slide adapted from Thomas Kelder

Data analysis
CSIRO Tutorial Series: Pathway Creation | Martina Summer-Kutmon 5 |
Comparative statistics
Isolated lists
Clustering
Isolated groups
Gene sets
Functional groups
Slide adapted from Thomas Kelder

Data analysis
CSIRO Tutorial Series: Pathway Creation | Martina Summer-Kutmon 6 |
Functional organisation
Pathways
Slide adapted from Thomas Kelder
FOCUS OF TODAY’S TUTORIAL

Data analysis
CSIRO Tutorial Series: Pathway Creation | Martina Summer-Kutmon 7 |
Systems organisation
Networks
Slide adapted from Thomas Kelder

Pathway analysis

Why pathway analysis?
CSIRO Tutorial Series: Pathway Creation | Martina Summer-Kutmon 9 |
Scanned microarrays
Raw intensities
Normalized intensities
Gene level statistics
Set of affected pathways
Set of overrepresentated
GO terms
Set of co-regulated genes
Biological Interpretation
Image analysis
QC Normalization
Statistical analysis
Pathway analysis
Clustering
GO analysis

Why pathway analysis?
CSIRO Tutorial Series: Pathway Creation | Martina Summer-Kutmon 10 |
Hmgcr
Dgat1
Ldlr
Mttp
Soat1
Lipc
Pltp
Lcat

Why pathway analysis?
“A picture is worth a thousand words.”
• Intuitive
• Puts data into biological context
• More efficient than looking up single gene information
11 CSIRO Tutorial Series: Pathway Creation | Martina Summer-Kutmon

Why pathway analysis?
• Involvement in pathways • Group genes, proteins and other biological molecules
• Reducing complexity
• Several hundred pathways instead of thousands of genes
• Analysis on functional level
• Identify active pathways that differ between two conditions • Higher explanatory power than a simple list of genes
12 CSIRO Tutorial Series: Pathway Creation | Martina Summer-Kutmon

Pathway analysis methods
• Overrepresentation analysis (ORA)
• Functional Class Scoring (FCS)
• Pathway Topology (PT) Based
13
Khatri, Purvesh, Marina Sirota, and Atul J. Butte. "Ten years of pathway analysis: current approaches and outstanding challenges.“ PLoS computational biology 8.2 (2012): e1002375.
CSIRO Tutorial Series: Pathway Creation | Martina Summer-Kutmon

Pathway analysis methods
• Overrepresentation analysis • Define input list through criteria
– Which genes are significantly up- or down-regulated
• Count genes in pathway for input and background list
• Perform statistical test for over- or under-representation (e.g. hypergeometric test)
14 CSIRO Tutorial Series: Pathway Creation | Martina Summer-Kutmon

Pathway analysis methods
15
1. Total number of genes measured in experiment = N
2. Set criteria to define total number of “differential expressed genes” = R (p-value<0.05)
3. Total number of genes in pathway that are measured in experiment = n
4. Number of genes changed in the pathway = r
N = 35 genes
R = 9 genes
n = 12 genes
r = 6 genes
Z-Score = 2.34033
Pathway X
CSIRO Tutorial Series: Pathway Creation | Martina Summer-Kutmon

Pathway analysis methods
• What does the Z-Score tell you? • Z-Score > 1.96:
– Significantly more genes are changed in the pathway compared to the complete data set
• Z-Score = 0:
– Distribution of changed genes in the pathway is the same as in the complete data set
• Z-Score < -1.96
– Significantly less genes are changed in the pathway compared to the complete data set
16
BUT ...
CSIRO Tutorial Series: Pathway Creation | Martina Summer-Kutmon

Pathway analysis methods
• Be aware!
• Overrepresentation analysis and functional class scoring DO NOT take
pathway topology into account!
• Always manually verify the pathways to make the right conclusions!
17 CSIRO Tutorial Series: Pathway Creation | Martina Summer-Kutmon

Pathway analysis in PathVisio

PathVisio 3.2.1
a tool to edit and analyze biological pathways
19
www.pathvisio.org
CSIRO Tutorial Series: Pathway Creation | Martina Summer-Kutmon

PathVisio 3.2.1
• What can you do with PathVisio? • Draw your pathways
• Visualize your data on pathways
• Find pathways regulated in your data set
• More functionality through plugins • Plugin repository with 16 plugins and more coming
• Many different plugin developers
20 CSIRO Tutorial Series: Pathway Creation | Martina Summer-Kutmon

PathVisio application
21
Toolbar: drawing objects, layout, view, visualization
Sidepanel: Drawing, Editing, Backpage, Search, Legend
Status bar: Loaded databases, data sets
Pathway display area
CSIRO Tutorial Series: Pathway Creation | Martina Summer-Kutmon

PathVisio walkthrough
22
Load identifier mapping databases
Create new pathway Load dataset
Create data visualization
Find regulated pathways
WikiPathways
Export pathway image with data
1
Select pathway collection
Draw pathways
Visualize data on pathway
2 Visualize data
3 Pathway statistics Share/Upload
CSIRO Tutorial Series: Pathway Creation | Martina Summer-Kutmon

Load identifier mapping databases
• Identifier mapping datbases from • Download bridge files from http://bridgedb.org/data/gene_database/
• Gene products (based on Ensembl)
• Metabolites (based on HMDB)
• Data -> Select Gene/Metabolite Database
23
Check status bar!
CSIRO Tutorial Series: Pathway Creation | Martina Summer-Kutmon

Identifier mapping
• Annotation of data nodes and interactions
• Xref → identifier + database
24 CSIRO Tutorial Series: Pathway Creation | Martina Summer-Kutmon

Identifier mapping
How does it work in PathVisio?
25
Annotation
ID Mapping
CSIRO Tutorial Series: Pathway Creation | Martina Summer-Kutmon

Data visualization
• Load dataset • Quantitative data
• Comma separated file (.csv or .txt)
• Identifier column
• System code (1-2 letter code) column → datasource (optional)
26 CSIRO Tutorial Series: Pathway Creation | Martina Summer-Kutmon

Data visualization
• Create visualization • Basic – one value (e.g. logFC)
• Advanced – multiple values (e.g. logFC + p.value)
• Gradient based visualization • logFC
• Rule based visualization • p.value
27 CSIRO Tutorial Series: Pathway Creation | Martina Summer-Kutmon

Data visualization
• Visualize data on pathway
28 CSIRO Tutorial Series: Pathway Creation | Martina Summer-Kutmon

Data visualization
• Export high quality pathway image with data for publications
• Plugins: • HTMLexport plugin
• BioPAX plugin
29 CSIRO Tutorial Series: Pathway Creation | Martina Summer-Kutmon

Pathway statistics
• Download pathway collection from WikiPathways
• http://www.wikipathways.org/index.php/Download_Pathways
• 20 different species
• Find regulated pathways
• Default method: Z-Score statistics
30 CSIRO Tutorial Series: Pathway Creation | Martina Summer-Kutmon

Use cases

Time series data
32
JR Tisoncik et al. Microbiology and Molecular Biology Reviews (2012)
Acute-phase response during
H5N1 virus infection.
CSIRO Tutorial Series: Pathway Creation | Martina Summer-Kutmon

Tissue expression data
33
DGJ Jennen et al. Drug Discovery Today (2010)
Comparison of expression in
different cell types.
CSIRO Tutorial Series: Pathway Creation | Martina Summer-Kutmon
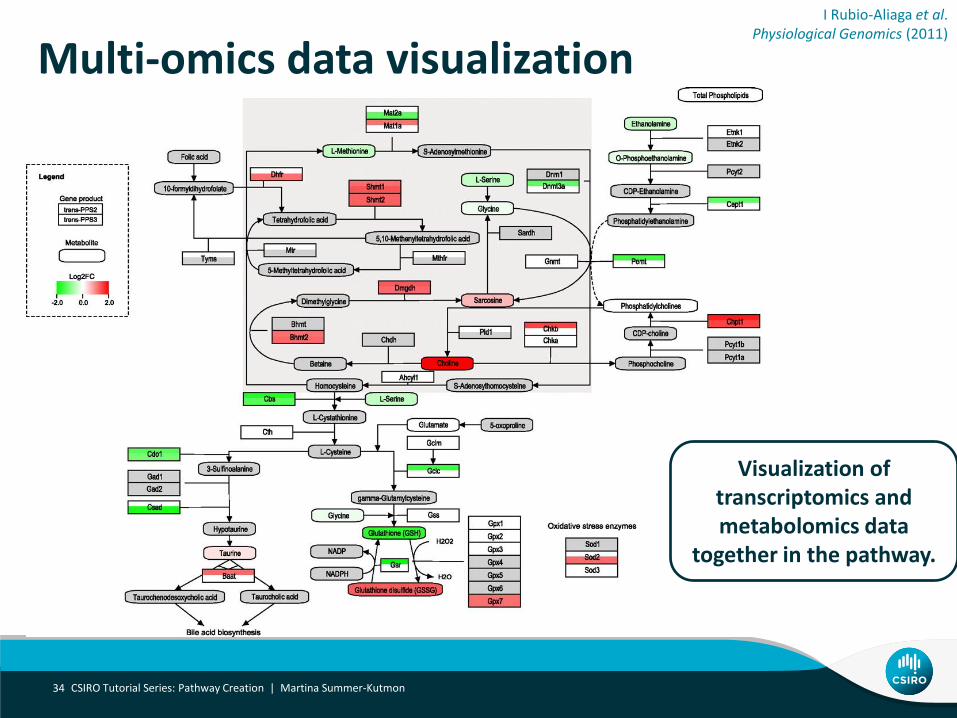
Multi-omics data visualization
34
I Rubio-Aliaga et al. Physiological Genomics (2011)
Visualization of transcriptomics and metabolomics data
together in the pathway.
CSIRO Tutorial Series: Pathway Creation | Martina Summer-Kutmon

Nutritional studies
35
M Kutmon et al. Genes & Nutrition (2015)
Cell cycle down-regulation in
prostate cancer cells after vitamin
D treatment
CSIRO Tutorial Series: Pathway Creation | Martina Summer-Kutmon

Highlighting genes
• List of genes targeted by a set of microRNAs
CSIRO Tutorial Series: Pathway Creation | Martina Summer-Kutmon 36 |
Different color for each microRNA
Highlighting of target genes in pathways

Hands-on session

Dataset
• Publicly available gene expression datasets
• Vitamin B12
• Expression data collections: • Gene Expression Omnibus (GEO)
• Array Express
• 1 human dataset studying the effect of different vitamin B12 concentrations in human adipocytes
– http://www.ncbi.nlm.nih.gov/geo/query/acc.cgi?acc=GSE43166
• Treatment with B12-50uM vs. No treatment (control)
• Data pre-processing is already performed
CSIRO Tutorial Series: Pathway Creation | Martina Summer-Kutmon 39 |

Dataset
CSIRO Tutorial Series: Pathway Creation | Martina Summer-Kutmon 40 |

Step-by-step instructions
• On the website Material for tutorial 2 Hands-on session material
• Questions to guide you through the tutorial • Answers will be provided
• Ask if you have any questions or problems!
• http://projects.bigcat.unimaas.nl/adelaide-tutorials-2015/
CSIRO Tutorial Series: Pathway Creation | Martina Summer-Kutmon 41 |

Data import
• Files generated:
• .pgex data file that can be loaded with “Select expression dataset”
• .pgex.xml visualization options are saved and loaded with the dataset
• .pgex.txt identifiers not recognized by identifier mapping database
CSIRO Tutorial Series: Pathway Creation | Martina Summer-Kutmon 42 |