Turtles on the edge: movement of loggerhead turtles
12
Turtles on the edge: movement of loggerhead turtles (Caretta caretta) along oceanic fronts, spanning longline fishing grounds in the central North Pacific, 1997–1998 JEFFREY J. POLOVINA, 1, * DONALD R. KOBAYASHI, 1 DENISE M. PARKER, 2 MICHAEL P. SEKI 1 AND GEORGE H. BALAZS 1 1 Honolulu Laboratory, Southwest Fisheries Science Center, National Marine Fisheries Service, NOAA, 2570 Dole Street, Honolulu, Hawaii, USA 96822–2396 2 Joint Institute for Marine and Atmospheric Research, University of Hawaii, 1000 Pope Road, Honolulu, Hawaii, USA 96822 ABSTRACT Nine juvenile loggerhead sea turtles tracked during 1997 and 1998 in the central North Pacific by satellite telemetry all travelled westward, against prevailing currents, along two convergent fronts identified by satellite remotely sensed data on sea surface tempera- ture (SST), chlorophyll and geostrophic currents. These fronts are characterized by gradients in sea surface height that produce an eastward geostrophic current, with gradients in surface chlorophyll and SST. Six of the turtles were associated with a front characterized by 17°C SST, surface chlorophyll of about 0.2 mg m –3 , and eastward geostrophic current of about 4 cm s –1 , while the other three turtles were as- sociated with a front with 20°C SST, surface chloro- phyll of about 0.1 mg m –3 , and eastward geostrophic flow of about 7 cm s –1 . These results appear to explain why incidental catch rates of loggerheads in the Ha- waii longline fishery are highest when gear is set at 17°C and 20°C, SST. Further, from the seasonal dis- tribution of longline effort relative to these fronts, it appears that the surface longline fishing ground lies largely between these two fronts during the first quarter and well to the south of the 17°C front, but including the 20°C front, in the second quarter. These findings suggest seasonal or area closures of the long- line fishery that could be tested to reduce incidental catches of loggerheads. Finally, these results illustrate the insights which can be achieved by combining data on movement of pelagic animals with concurrent re- motely sensed environmental data. Key words: Caretta caretta, central North Pacific, loggerhead turtles, longline fishery, satellite remote sensing, subtropical front INTRODUCTION Loggerhead sea turtles (Caretta caretta) travel across the Pacific between their nesting beaches in Japan and Australia and their foraging habitat in the eastern Pacific. Large aggregations of juvenile log- gerheads have been found off Baja California feeding on a pelagic red crab found in association with the coastal upwelling (Bowen et al., 1995). Genetic analyses of the loggerheads off Baja California con- cluded that 95% came from Japanese nesting beaches and 5% from nesting colonies in Australia (Bowen et al., 1995). The route these juveniles take during this remarkable migration across the North Pacific, travelling almost one-third of the way around the earth, and how they find food and avoid predation in these typically unproductive oceanic waters are not fully resolved. However, about a decade ago, the hypothesis was developed that oceanic fronts provided nursery habitat for juvenile turtles, based on a compilation of occa- sional but persistent observations of juvenile turtles found in the middle of ocean gyres in the Atlantic and Caribbean Oceans, far from land, together with an understanding that convergent oceanic fronts could provide forage habitat for juvenile turtles (Carr, 1987). More recently, and in large part owing to significant catches of juvenile loggerheads in fishing gear from both the Atlantic and the Pacific, it has been hypothesized that juvenile loggerhead turtles (2–8 years old) inhabit mid-oceanic regions far from continental shelf environments and migrate with predominant ocean gyres from west to east (Musick and Limpus, 1997). However, defining juvenile loggerhead distribution based on incidental catches in fishing gear may be a biased sampling of their habitat because the fishing *Correspondence. e-mail: [email protected] Received 14 April 1999 Revised version accepted 24 August 1999 FISHERIES OCEANOGRAPHY Fish. Oceanogr. 9, 71–82, 2000 Ó 2000 Blackwell Science Ltd. 71
Transcript of Turtles on the edge: movement of loggerhead turtles
Turtles on the edge: movement of loggerhead turtles(Caretta caretta) along oceanic fronts, spanning longline®shing grounds in the central North Paci®c, 1997±1998
JEFFREY J. POLOVINA,1,*DONALD R. KOBAYASHI,1
DENISE M. PARKER,2
MICHAEL P. SEKI1 AND GEORGE H. BALAZS1
1Honolulu Laboratory, Southwest Fisheries Science Center,National Marine Fisheries Service, NOAA, 2570 Dole Street,Honolulu, Hawaii, USA 96822±23962Joint Institute for Marine and Atmospheric Research, Universityof Hawaii, 1000 Pope Road, Honolulu, Hawaii, USA 96822
ABSTRACT
Nine juvenile loggerhead sea turtles tracked during1997 and 1998 in the central North Paci®c by satellitetelemetry all travelled westward, against prevailingcurrents, along two convergent fronts identi®ed bysatellite remotely sensed data on sea surface tempera-ture (SST), chlorophyll and geostrophic currents.These fronts are characterized by gradients in seasurface height that produce an eastward geostrophiccurrent, with gradients in surface chlorophyll andSST. Six of the turtles were associated with a frontcharacterized by 17°C SST, surface chlorophyll ofabout 0.2 mg m±3, and eastward geostrophic current ofabout 4 cm s±1, while the other three turtles were as-sociated with a front with 20°C SST, surface chloro-phyll of about 0.1 mg m±3, and eastward geostrophic¯ow of about 7 cm s±1. These results appear to explainwhy incidental catch rates of loggerheads in the Ha-waii longline ®shery are highest when gear is set at17°C and 20°C, SST. Further, from the seasonal dis-tribution of longline effort relative to these fronts, itappears that the surface longline ®shing ground lieslargely between these two fronts during the ®rstquarter and well to the south of the 17°C front, butincluding the 20°C front, in the second quarter. These®ndings suggest seasonal or area closures of the long-line ®shery that could be tested to reduce incidentalcatches of loggerheads. Finally, these results illustrate
the insights which can be achieved by combining dataon movement of pelagic animals with concurrent re-motely sensed environmental data.
Key words: Caretta caretta, central North Paci®c,loggerhead turtles, longline ®shery, satellite remotesensing, subtropical front
INTRODUCTION
Loggerhead sea turtles (Caretta caretta) travel acrossthe Paci®c between their nesting beaches in Japanand Australia and their foraging habitat in theeastern Paci®c. Large aggregations of juvenile log-gerheads have been found off Baja California feedingon a pelagic red crab found in association with thecoastal upwelling (Bowen et al., 1995). Geneticanalyses of the loggerheads off Baja California con-cluded that 95% came from Japanese nestingbeaches and 5% from nesting colonies in Australia(Bowen et al., 1995). The route these juveniles takeduring this remarkable migration across the NorthPaci®c, travelling almost one-third of the wayaround the earth, and how they ®nd food and avoidpredation in these typically unproductive oceanicwaters are not fully resolved.
However, about a decade ago, the hypothesis wasdeveloped that oceanic fronts provided nursery habitatfor juvenile turtles, based on a compilation of occa-sional but persistent observations of juvenile turtlesfound in the middle of ocean gyres in the Atlantic andCaribbean Oceans, far from land, together with anunderstanding that convergent oceanic fronts couldprovide forage habitat for juvenile turtles (Carr, 1987).More recently, and in large part owing to signi®cantcatches of juvenile loggerheads in ®shing gearfrom both the Atlantic and the Paci®c, it hasbeen hypothesized that juvenile loggerhead turtles(2±8 years old) inhabit mid-oceanic regions far fromcontinental shelf environments and migrate withpredominant ocean gyres from west to east (Musickand Limpus, 1997).
However, de®ning juvenile loggerhead distributionbased on incidental catches in ®shing gear may be abiased sampling of their habitat because the ®shing
*Correspondence. e-mail: [email protected]
Received 14 April 1999
Revised version accepted 24 August 1999
FISHERIES OCEANOGRAPHY Fish. Oceanogr. 9, 71±82, 2000
Ó 2000 Blackwell Science Ltd. 71
gear is not targeting turtles. In this paper we willdescribe the oceanic habitat of juvenile loggerheads inthe central North Paci®c and their movement relativeto this oceanic habitat with a combination of data.The position and movement of nine loggerhead turtlesare obtained from satellite telemetry; information onthe environment around the turtle positions is derivedfrom satellite remote sensing data. These data consistof sea surface temperature (SST), surface chlorophylldensity, and geostrophic currents.
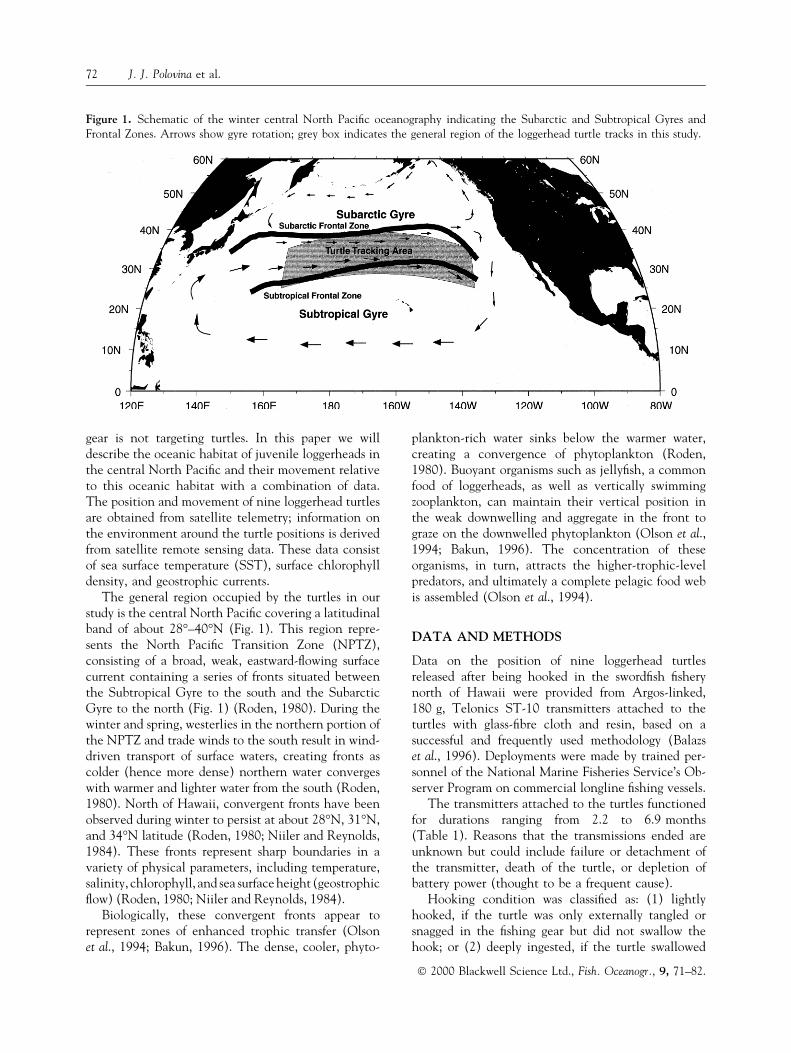
The general region occupied by the turtles in ourstudy is the central North Paci®c covering a latitudinalband of about 28°±40°N (Fig. 1). This region repre-sents the North Paci®c Transition Zone (NPTZ),consisting of a broad, weak, eastward-¯owing surfacecurrent containing a series of fronts situated betweenthe Subtropical Gyre to the south and the SubarcticGyre to the north (Fig. 1) (Roden, 1980). During thewinter and spring, westerlies in the northern portion ofthe NPTZ and trade winds to the south result in wind-driven transport of surface waters, creating fronts ascolder (hence more dense) northern water convergeswith warmer and lighter water from the south (Roden,1980). North of Hawaii, convergent fronts have beenobserved during winter to persist at about 28°N, 31°N,and 34°N latitude (Roden, 1980; Niiler and Reynolds,1984). These fronts represent sharp boundaries in avariety of physical parameters, including temperature,salinity, chlorophyll, and sea surface height (geostrophic¯ow) (Roden, 1980; Niiler and Reynolds, 1984).
Biologically, these convergent fronts appear torepresent zones of enhanced trophic transfer (Olsonet al., 1994; Bakun, 1996). The dense, cooler, phyto-
plankton-rich water sinks below the warmer water,creating a convergence of phytoplankton (Roden,1980). Buoyant organisms such as jelly®sh, a commonfood of loggerheads, as well as vertically swimmingzooplankton, can maintain their vertical position inthe weak downwelling and aggregate in the front tograze on the downwelled phytoplankton (Olson et al.,1994; Bakun, 1996). The concentration of theseorganisms, in turn, attracts the higher-trophic-levelpredators, and ultimately a complete pelagic food webis assembled (Olson et al., 1994).
DATA AND METHODS
Data on the position of nine loggerhead turtlesreleased after being hooked in the sword®sh ®sherynorth of Hawaii were provided from Argos-linked,180 g, Telonics ST-10 transmitters attached to theturtles with glass-®bre cloth and resin, based on asuccessful and frequently used methodology (Balazset al., 1996). Deployments were made by trained per-sonnel of the National Marine Fisheries Service's Ob-server Program on commercial longline ®shing vessels.
The transmitters attached to the turtles functionedfor durations ranging from 2.2 to 6.9 months(Table 1). Reasons that the transmissions ended areunknown but could include failure or detachment ofthe transmitter, death of the turtle, or depletion ofbattery power (thought to be a frequent cause).
Hooking condition was classi®ed as: (1) lightlyhooked, if the turtle was only externally tangled orsnagged in the ®shing gear but did not swallow thehook; or (2) deeply ingested, if the turtle swallowed
Figure 1. Schematic of the winter central North Paci®c oceanography indicating the Subarctic and Subtropical Gyres andFrontal Zones. Arrows show gyre rotation; grey box indicates the general region of the loggerhead turtle tracks in this study.
72 J. J. Polovina et al.
Ó 2000 Blackwell Science Ltd., Fish. Oceanogr., 9, 71±82.
the hook. Lightly hooked turtles were unhooked andreleased, while deep ingesting turtles were releasedwith the hook in the animal but with the mono®la-ment leader cut close to the turtle's mouth. All nineturtles were determined, by mtDNA analysis, to haveoriginated from nesting beaches in Japan (Duttonet al., in press).
The physical and biological environmental datathat were used to describe the environment at andaround the migrating loggerheads are sea surfacetemperature (SST), surface chlorophyll a density, andgeostrophic current. The SST data are multichannelSST (MCSST) from the University of Miami, withweekly temporal resolution and one-tenth of onedegree of longitude and latitude spatial resolution.Global comparisons between MCSST and ship-basedtemperature measurements indicated MCSST is 0.3±0.4°C lower than ship-based temperature with crosscorrelations ranging from +0.3 to +0.7 (McClain et al.,1985). The chlorophyll density is estimated from two
satellite sensors. For January±June 1997 we use theOcean Color and Temperature Scanner (OCTS)version 3 data from the Japanese Adeos satellite(Shimada et al., 1998), while for September 1997±August 1998 we use Sea-viewing Wide Field-of-viewSensor (SeaWiFS) version 2 data (O'Reilly et al.,1998). The data resolution is monthly at 0.088 degreeof latitude and longitude. The accuracy of SeaWiFSchlorophyll estimates is within 30±50% of ship-basedobservations (McClain et al., 1998). Geostrophic cur-rents are computed from satellite altimetry data fromTOPEX/Poseidon with 10-day and 0.5 degree of lati-tude and longitude resolution (Polovina et al., 1999).Comparisons between current speed determined froman acoustic Doppler current pro®ler along TOPEX/Poseidon track lines around the Hawaiian Archipelagoagreed with estimates from TOPEX/Poseidon towithin a few cm s±1 (Mitchum, 1996).
The environmental data are linked to the turtle'sposition by spatial interpolation of the environmental
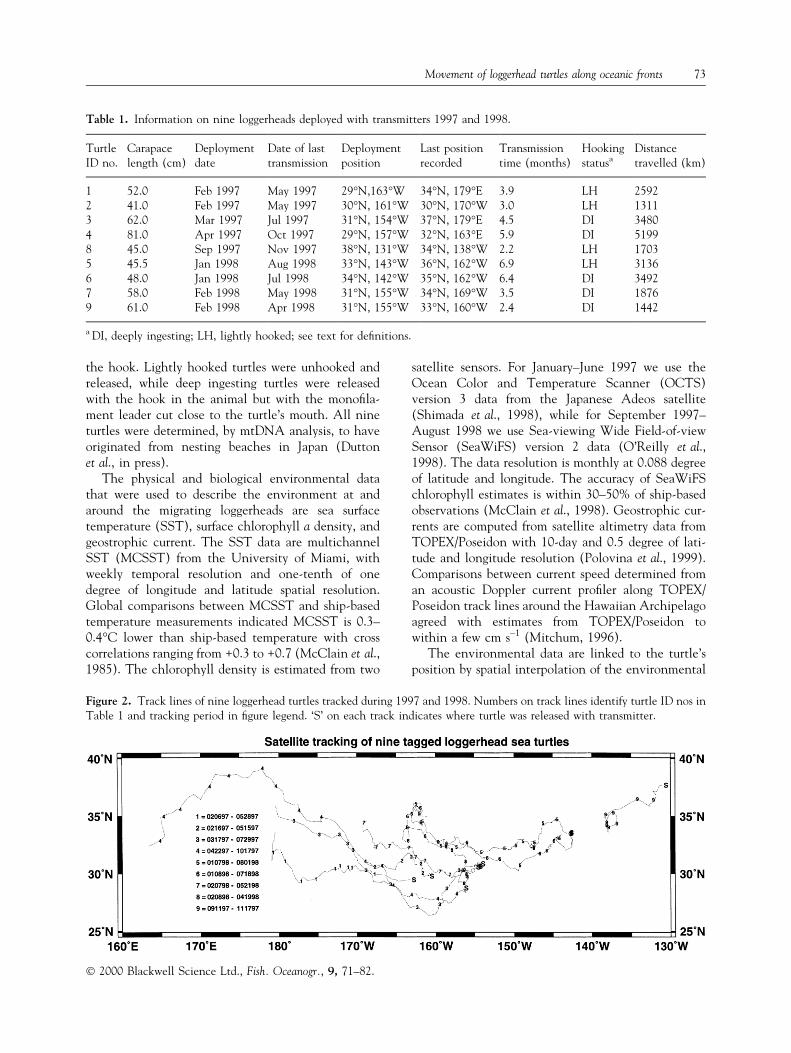
Table 1. Information on nine loggerheads deployed with transmitters 1997 and 1998.
TurtleID no.
Carapacelength (cm)
Deploymentdate
Date of lasttransmission
Deploymentposition
Last positionrecorded
Transmissiontime (months)
Hookingstatusa
Distancetravelled (km)
1 52.0 Feb 1997 May 1997 29°N,163°W 34°N, 179°E 3.9 LH 25922 41.0 Feb 1997 May 1997 30°N, 161°W 30°N, 170°W 3.0 LH 13113 62.0 Mar 1997 Jul 1997 31°N, 154°W 37°N, 179°E 4.5 DI 34804 81.0 Apr 1997 Oct 1997 29°N, 157°W 32°N, 163°E 5.9 DI 51998 45.0 Sep 1997 Nov 1997 38°N, 131°W 34°N, 138°W 2.2 LH 17035 45.5 Jan 1998 Aug 1998 33°N, 143°W 36°N, 162°W 6.9 LH 31366 48.0 Jan 1998 Jul 1998 34°N, 142°W 35°N, 162°W 6.4 DI 34927 58.0 Feb 1998 May 1998 31°N, 155°W 34°N, 169°W 3.5 DI 18769 61.0 Feb 1998 Apr 1998 31°N, 155°W 33°N, 160°W 2.4 DI 1442
a DI, deeply ingesting; LH, lightly hooked; see text for de®nitions.
Figure 2. Track lines of nine loggerhead turtles tracked during 1997 and 1998. Numbers on track lines identify turtle ID nos inTable 1 and tracking period in ®gure legend. `S' on each track indicates where turtle was released with transmitter.
Ó 2000 Blackwell Science Ltd., Fish. Oceanogr., 9, 71±82.
Movement of loggerhead turtles along oceanic fronts 73
data between grid points. Speci®cally, a cubic poly-nomial was used to estimate the environmental data at
and around all turtles' locations from the observedenvironmental grid. A computer routine, `grdtrack',within Generic Mapping Tools (GMT) was used forthe interpolation.
RESULTS
Tracks for all nine turtles over both 1997 and 1998 areshown in Fig. 2. They ranged from 26°N to 39°N lat-itude and from 164°E to 131°W longitude but mostobservations occur between 30±35°N latitude and 150±180°W longitude (Fig. 2). A series of location accuracyclassi®cations are assigned to the reported turtle posi-tions by Argos, computed as a function of the numberand con®guration of satellites and number of trans-missions received for each position calculation. For theset of all of our loggerhead positions, we estimated thedistance between the reported and true positions to beless than 1 km for about 57% of the positions, and atleast 1 km for 37% of the positions, but the accuracy ofthe remaining 6% could not be determined. All posi-tion data were used in subsequent analyses. The dates ofthe positions cover all months except July, August andDecember, with most of the coverage from the periodFebruary to June. While we do not know the extent oftrauma that turtles may incur from the hooking, interms of time tracked and their speed, there does notappear to be any difference in performance between thetwo groups of turtles. For the ®ve deeply ingestingturtles, their mean tracking duration was 4.5 months(range: 2.4±6.4 months) compared to 4.6 months(range: 2.2±6.9 months) for the four lightly hookedturtles. Mean speeds for the two groups of turtles werenot statistically different at 30 cm s±1 (SE 0.03 cm s±1)and 35 cm s±1 (SE 0.02 cm s±1) for the lightly hookedand deeply ingesting groups, respectively (P > 0.05).Further, two turtles (nos 5 and 6, Fig. 2), one deeplyingesting and the other lightly hooked, were releasedwithin a day of each other and exhibit nearly identicaltracks and speed over their entire 7-month trackingperiod (Fig. 2).
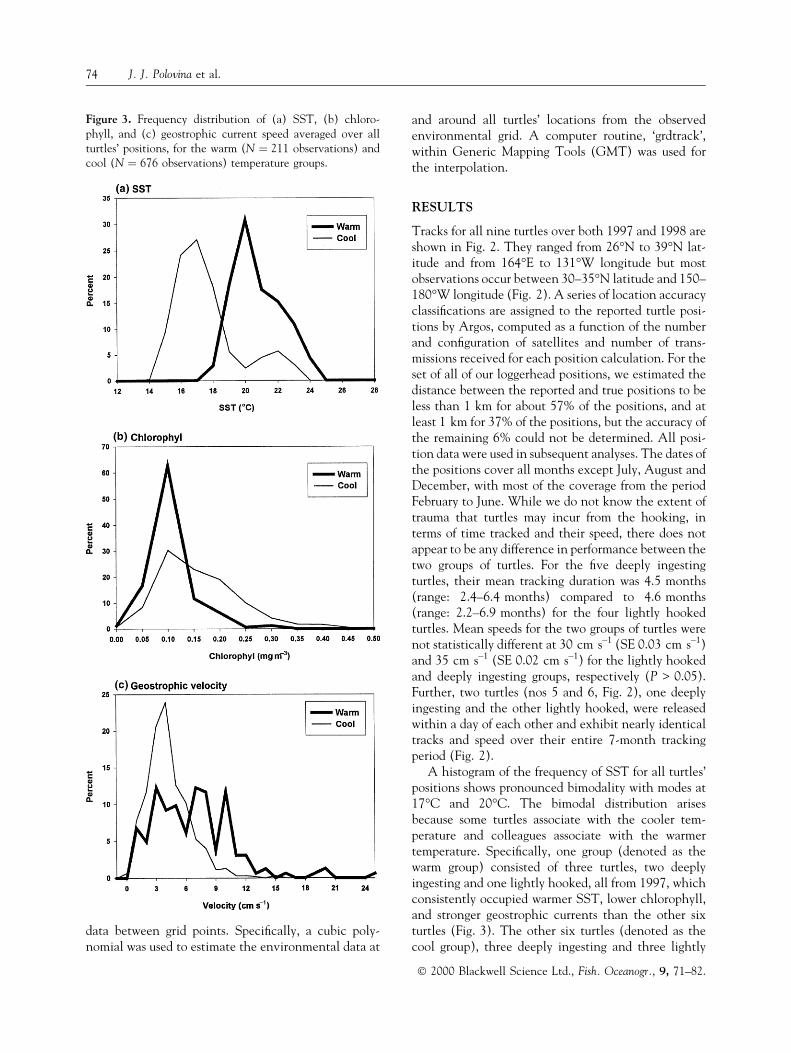
A histogram of the frequency of SST for all turtles'positions shows pronounced bimodality with modes at17°C and 20°C. The bimodal distribution arisesbecause some turtles associate with the cooler tem-perature and colleagues associate with the warmertemperature. Speci®cally, one group (denoted as thewarm group) consisted of three turtles, two deeplyingesting and one lightly hooked, all from 1997, whichconsistently occupied warmer SST, lower chlorophyll,and stronger geostrophic currents than the other sixturtles (Fig. 3). The other six turtles (denoted as thecool group), three deeply ingesting and three lightly
Figure 3. Frequency distribution of (a) SST, (b) chloro-phyll, and (c) geostrophic current speed averaged over allturtles' positions, for the warm (N � 211 observations) andcool (N � 676 observations) temperature groups.
Ó 2000 Blackwell Science Ltd., Fish. Oceanogr., 9, 71±82.
74 J. J. Polovina et al.
hooked, two from 1997 and four from 1998, consis-tently occupied relatively cooler water with higherchlorophyll and weaker geostrophic currents (Fig. 3).The mean SST, chlorophyll, and geostrophic currentencountered by the two groups were statistically dif-ferent for all three parameters (SST, chl P < 0.01,current P < 0.05). For the warm group the mean SST,chlorophyll, and geostrophic current were 20.7°C,0.11 mg m±3, and 6.7 cm s±1, respectively, comparedwith the means for the cool group of 17.6°C,0.22 mg m±3, and 4.2 cm s±1, respectively (Fig. 3).The SST encountered by the turtles tightly clustersaround the modes for each group, 17°C and 20°C,with very little overlap (Fig. 3).
Oceanographic cruises and satellite remote sensingwork recognize 20°C and 17°C, SST isotherms asindicators of two persistent fronts within the Sub-
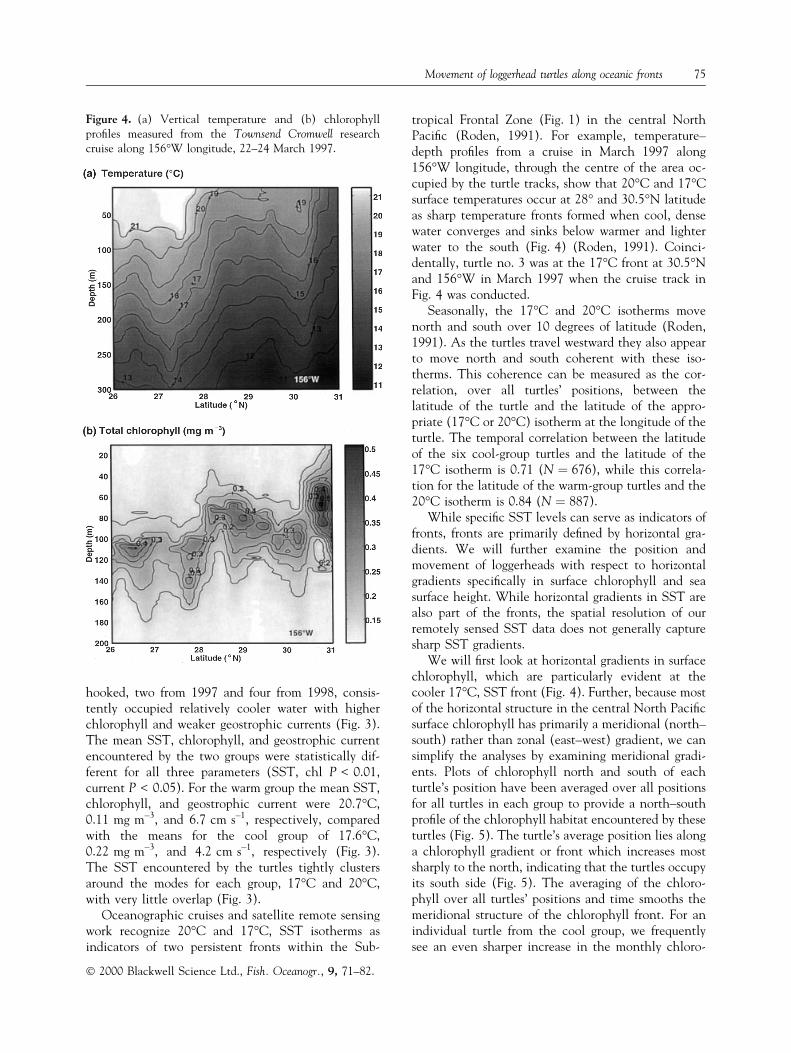
tropical Frontal Zone (Fig. 1) in the central NorthPaci®c (Roden, 1991). For example, temperature±depth pro®les from a cruise in March 1997 along156°W longitude, through the centre of the area oc-cupied by the turtle tracks, show that 20°C and 17°Csurface temperatures occur at 28° and 30.5°N latitudeas sharp temperature fronts formed when cool, densewater converges and sinks below warmer and lighterwater to the south (Fig. 4) (Roden, 1991). Coinci-dentally, turtle no. 3 was at the 17°C front at 30.5°Nand 156°W in March 1997 when the cruise track inFig. 4 was conducted.
Seasonally, the 17°C and 20°C isotherms movenorth and south over 10 degrees of latitude (Roden,1991). As the turtles travel westward they also appearto move north and south coherent with these iso-therms. This coherence can be measured as the cor-relation, over all turtles' positions, between thelatitude of the turtle and the latitude of the appro-priate (17°C or 20°C) isotherm at the longitude of theturtle. The temporal correlation between the latitudeof the six cool-group turtles and the latitude of the17°C isotherm is 0.71 (N � 676), while this correla-tion for the latitude of the warm-group turtles and the20°C isotherm is 0.84 (N � 887).
While speci®c SST levels can serve as indicators offronts, fronts are primarily de®ned by horizontal gra-dients. We will further examine the position andmovement of loggerheads with respect to horizontalgradients speci®cally in surface chlorophyll and seasurface height. While horizontal gradients in SST arealso part of the fronts, the spatial resolution of ourremotely sensed SST data does not generally capturesharp SST gradients.
We will ®rst look at horizontal gradients in surfacechlorophyll, which are particularly evident at thecooler 17°C, SST front (Fig. 4). Further, because mostof the horizontal structure in the central North Paci®csurface chlorophyll has primarily a meridional (north±south) rather than zonal (east±west) gradient, we cansimplify the analyses by examining meridional gradi-ents. Plots of chlorophyll north and south of eachturtle's position have been averaged over all positionsfor all turtles in each group to provide a north±southpro®le of the chlorophyll habitat encountered by theseturtles (Fig. 5). The turtle's average position lies alonga chlorophyll gradient or front which increases mostsharply to the north, indicating that the turtles occupyits south side (Fig. 5). The averaging of the chloro-phyll over all turtles' positions and time smooths themeridional structure of the chlorophyll front. For anindividual turtle from the cool group, we frequentlysee an even sharper increase in the monthly chloro-
Figure 4. (a) Vertical temperature and (b) chlorophyllpro®les measured from the Townsend Cromwell researchcruise along 156°W longitude, 22±24 March 1997.
Ó 2000 Blackwell Science Ltd., Fish. Oceanogr., 9, 71±82.
Movement of loggerhead turtles along oceanic fronts 75
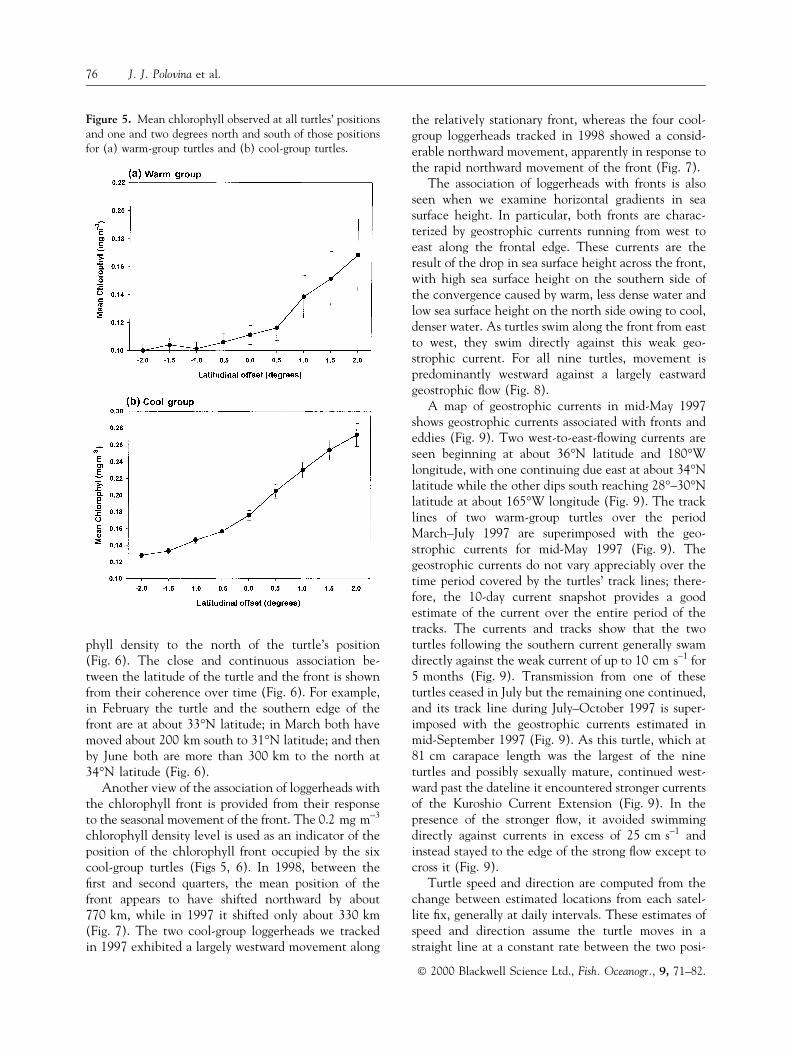
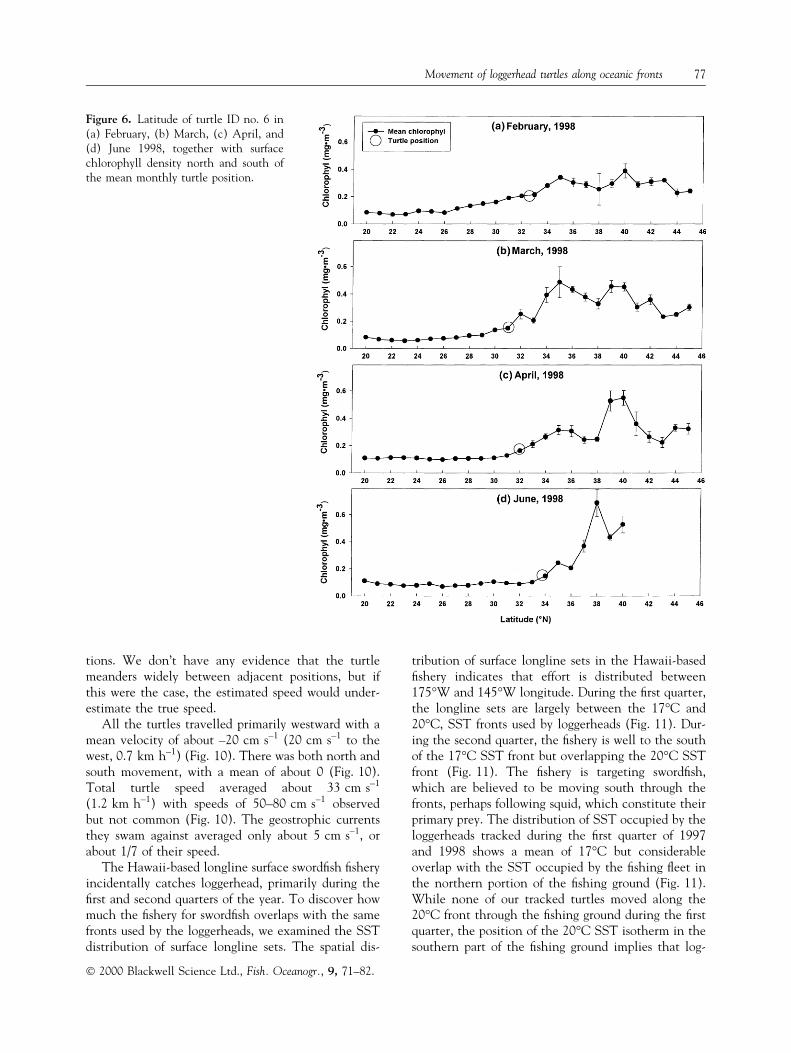
phyll density to the north of the turtle's position(Fig. 6). The close and continuous association be-tween the latitude of the turtle and the front is shownfrom their coherence over time (Fig. 6). For example,in February the turtle and the southern edge of thefront are at about 33°N latitude; in March both havemoved about 200 km south to 31°N latitude; and thenby June both are more than 300 km to the north at34°N latitude (Fig. 6).
Another view of the association of loggerheads withthe chlorophyll front is provided from their responseto the seasonal movement of the front. The 0.2 mg m±3
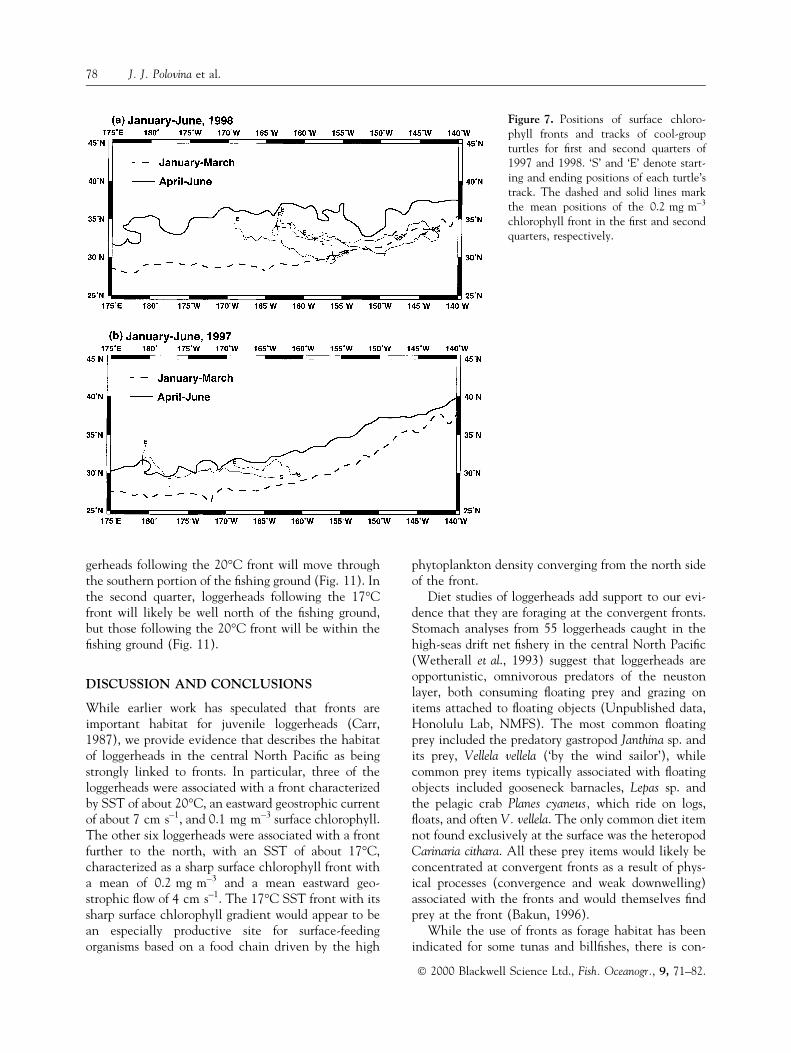
chlorophyll density level is used as an indicator of theposition of the chlorophyll front occupied by the sixcool-group turtles (Figs 5, 6). In 1998, between the®rst and second quarters, the mean position of thefront appears to have shifted northward by about770 km, while in 1997 it shifted only about 330 km(Fig. 7). The two cool-group loggerheads we trackedin 1997 exhibited a largely westward movement along
the relatively stationary front, whereas the four cool-group loggerheads tracked in 1998 showed a consid-erable northward movement, apparently in response tothe rapid northward movement of the front (Fig. 7).
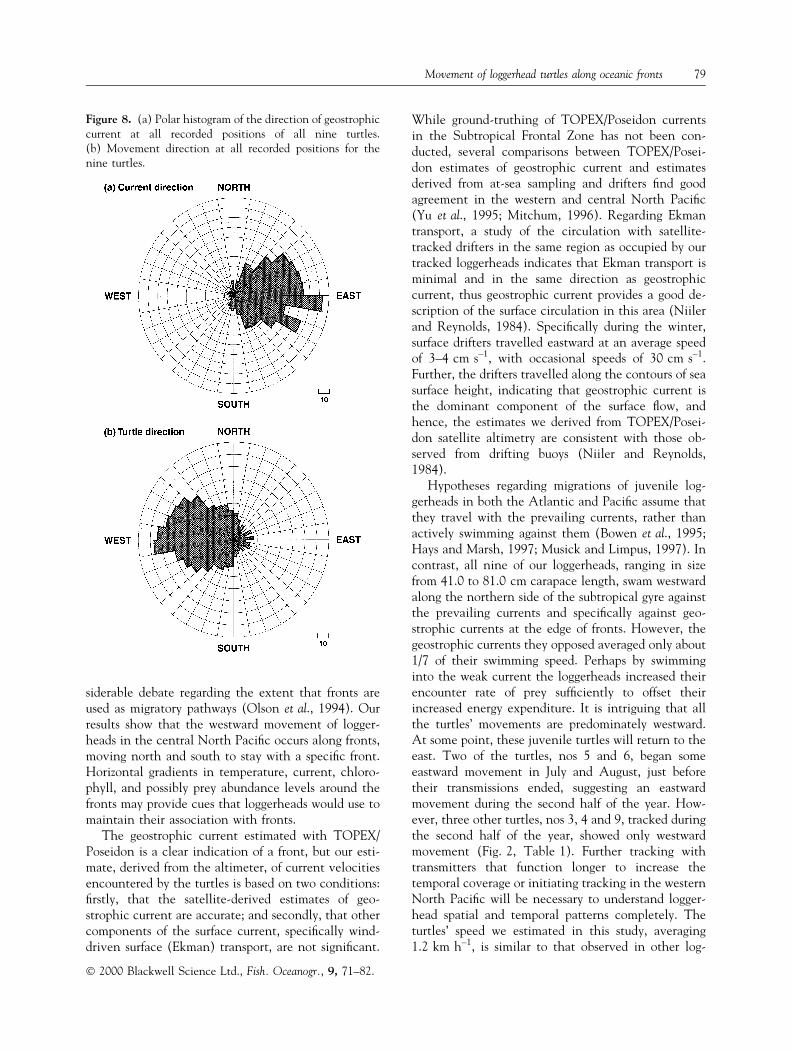
The association of loggerheads with fronts is alsoseen when we examine horizontal gradients in seasurface height. In particular, both fronts are charac-terized by geostrophic currents running from west toeast along the frontal edge. These currents are theresult of the drop in sea surface height across the front,with high sea surface height on the southern side ofthe convergence caused by warm, less dense water andlow sea surface height on the north side owing to cool,denser water. As turtles swim along the front from eastto west, they swim directly against this weak geo-strophic current. For all nine turtles, movement ispredominantly westward against a largely eastwardgeostrophic ¯ow (Fig. 8).
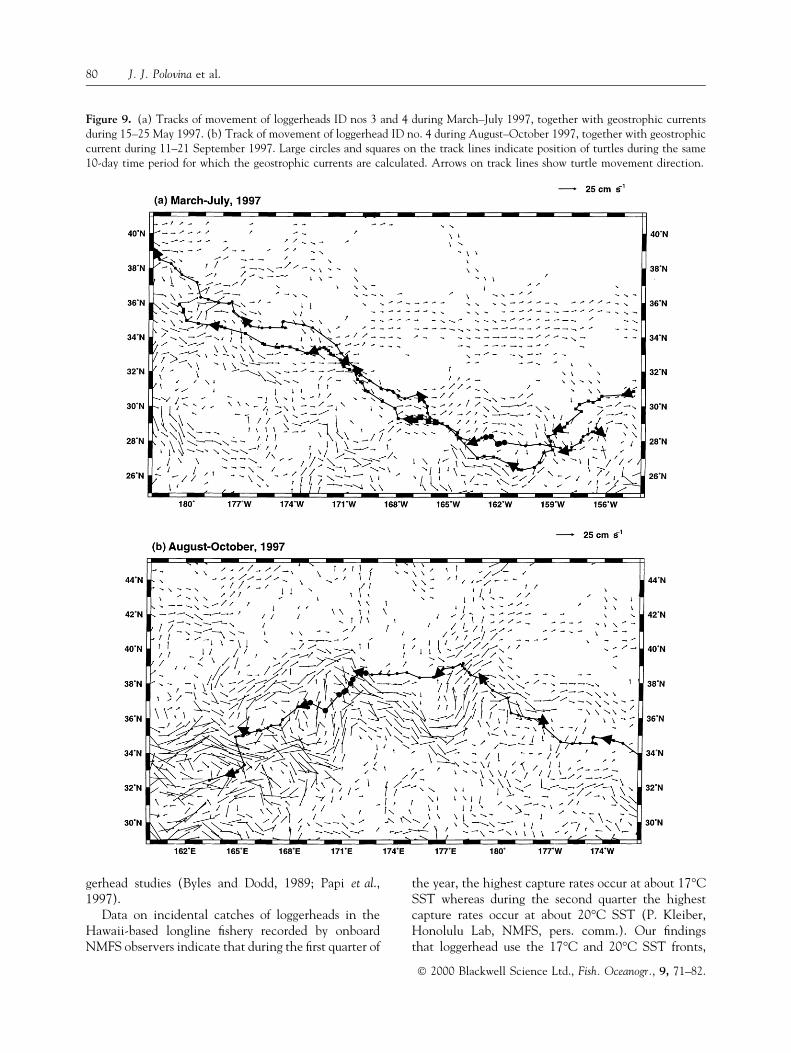
A map of geostrophic currents in mid-May 1997shows geostrophic currents associated with fronts andeddies (Fig. 9). Two west-to-east-¯owing currents areseen beginning at about 36°N latitude and 180°Wlongitude, with one continuing due east at about 34°Nlatitude while the other dips south reaching 28°±30°Nlatitude at about 165°W longitude (Fig. 9). The tracklines of two warm-group turtles over the periodMarch±July 1997 are superimposed with the geo-strophic currents for mid-May 1997 (Fig. 9). Thegeostrophic currents do not vary appreciably over thetime period covered by the turtles' track lines; there-fore, the 10-day current snapshot provides a goodestimate of the current over the entire period of thetracks. The currents and tracks show that the twoturtles following the southern current generally swamdirectly against the weak current of up to 10 cm s±1 for5 months (Fig. 9). Transmission from one of theseturtles ceased in July but the remaining one continued,and its track line during July±October 1997 is super-imposed with the geostrophic currents estimated inmid-September 1997 (Fig. 9). As this turtle, which at81 cm carapace length was the largest of the nineturtles and possibly sexually mature, continued west-ward past the dateline it encountered stronger currentsof the Kuroshio Current Extension (Fig. 9). In thepresence of the stronger ¯ow, it avoided swimmingdirectly against currents in excess of 25 cm s±1 andinstead stayed to the edge of the strong ¯ow except tocross it (Fig. 9).
Turtle speed and direction are computed from thechange between estimated locations from each satel-lite ®x, generally at daily intervals. These estimates ofspeed and direction assume the turtle moves in astraight line at a constant rate between the two posi-
Figure 5. Mean chlorophyll observed at all turtles' positionsand one and two degrees north and south of those positionsfor (a) warm-group turtles and (b) cool-group turtles.
Ó 2000 Blackwell Science Ltd., Fish. Oceanogr., 9, 71±82.
76 J. J. Polovina et al.
tions. We don't have any evidence that the turtlemeanders widely between adjacent positions, but ifthis were the case, the estimated speed would under-estimate the true speed.
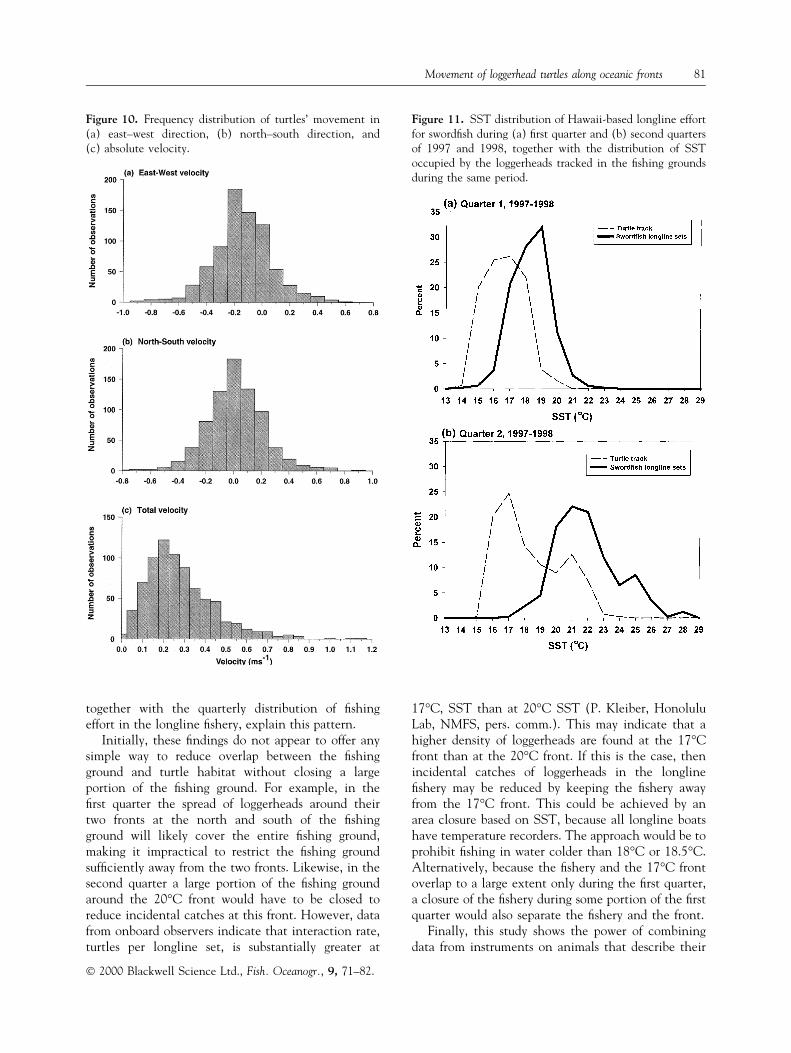
All the turtles travelled primarily westward with amean velocity of about ±20 cm s±1 (20 cm s±1 to thewest, 0.7 km h±1) (Fig. 10). There was both north andsouth movement, with a mean of about 0 (Fig. 10).Total turtle speed averaged about 33 cm s±1
(1.2 km h±1) with speeds of 50±80 cm s±1 observedbut not common (Fig. 10). The geostrophic currentsthey swam against averaged only about 5 cm s±1, orabout 1/7 of their speed.
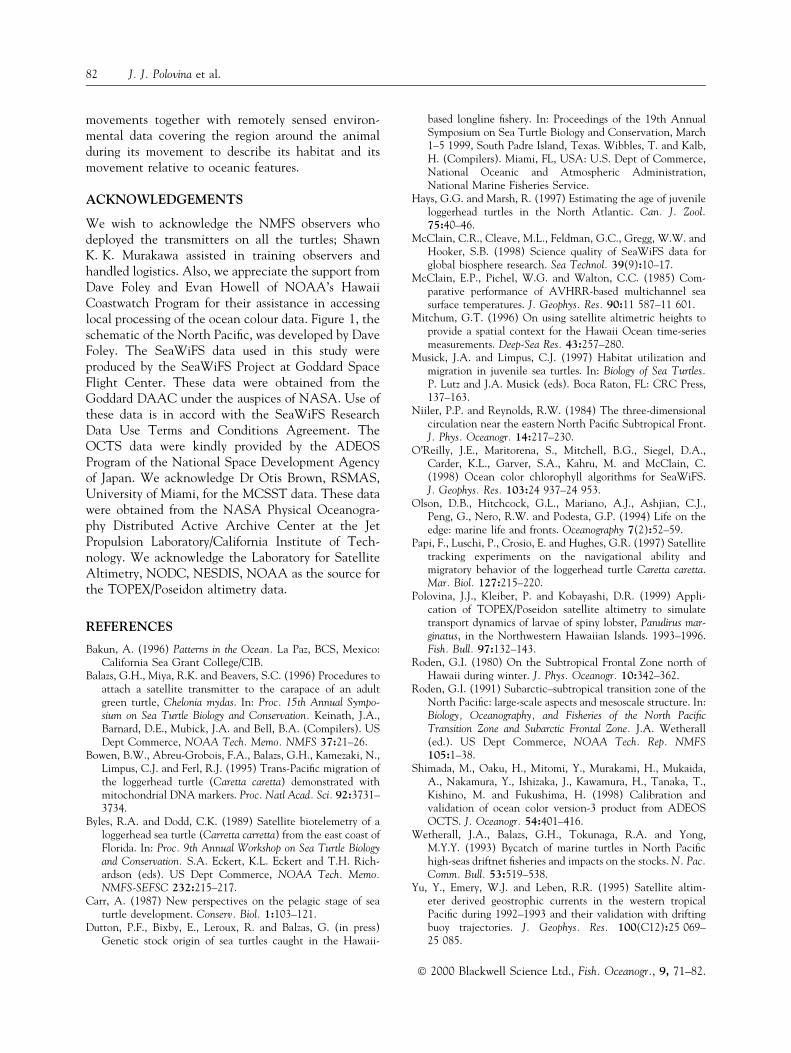
The Hawaii-based longline surface sword®sh ®sheryincidentally catches loggerhead, primarily during the®rst and second quarters of the year. To discover howmuch the ®shery for sword®sh overlaps with the samefronts used by the loggerheads, we examined the SSTdistribution of surface longline sets. The spatial dis-
tribution of surface longline sets in the Hawaii-based®shery indicates that effort is distributed between175°W and 145°W longitude. During the ®rst quarter,the longline sets are largely between the 17°C and20°C, SST fronts used by loggerheads (Fig. 11). Dur-ing the second quarter, the ®shery is well to the southof the 17°C SST front but overlapping the 20°C SSTfront (Fig. 11). The ®shery is targeting sword®sh,which are believed to be moving south through thefronts, perhaps following squid, which constitute theirprimary prey. The distribution of SST occupied by theloggerheads tracked during the ®rst quarter of 1997and 1998 shows a mean of 17°C but considerableoverlap with the SST occupied by the ®shing ¯eet inthe northern portion of the ®shing ground (Fig. 11).While none of our tracked turtles moved along the20°C front through the ®shing ground during the ®rstquarter, the position of the 20°C SST isotherm in thesouthern part of the ®shing ground implies that log-
Figure 6. Latitude of turtle ID no. 6 in(a) February, (b) March, (c) April, and(d) June 1998, together with surfacechlorophyll density north and south ofthe mean monthly turtle position.
Ó 2000 Blackwell Science Ltd., Fish. Oceanogr., 9, 71±82.
Movement of loggerhead turtles along oceanic fronts 77
gerheads following the 20°C front will move throughthe southern portion of the ®shing ground (Fig. 11). Inthe second quarter, loggerheads following the 17°Cfront will likely be well north of the ®shing ground,but those following the 20°C front will be within the®shing ground (Fig. 11).
DISCUSSION AND CONCLUSIONS
While earlier work has speculated that fronts areimportant habitat for juvenile loggerheads (Carr,1987), we provide evidence that describes the habitatof loggerheads in the central North Paci®c as beingstrongly linked to fronts. In particular, three of theloggerheads were associated with a front characterizedby SST of about 20°C, an eastward geostrophic currentof about 7 cm s±1, and 0.1 mg m±3 surface chlorophyll.The other six loggerheads were associated with a frontfurther to the north, with an SST of about 17°C,characterized as a sharp surface chlorophyll front witha mean of 0.2 mg m±3 and a mean eastward geo-strophic ¯ow of 4 cm s±1. The 17°C SST front with itssharp surface chlorophyll gradient would appear to bean especially productive site for surface-feedingorganisms based on a food chain driven by the high
phytoplankton density converging from the north sideof the front.
Diet studies of loggerheads add support to our evi-dence that they are foraging at the convergent fronts.Stomach analyses from 55 loggerheads caught in thehigh-seas drift net ®shery in the central North Paci®c(Wetherall et al., 1993) suggest that loggerheads areopportunistic, omnivorous predators of the neustonlayer, both consuming ¯oating prey and grazing onitems attached to ¯oating objects (Unpublished data,Honolulu Lab, NMFS). The most common ¯oatingprey included the predatory gastropod Janthina sp. andits prey, Vellela vellela (`by the wind sailor'), whilecommon prey items typically associated with ¯oatingobjects included gooseneck barnacles, Lepas sp. andthe pelagic crab Planes cyaneus, which ride on logs,¯oats, and often V. vellela. The only common diet itemnot found exclusively at the surface was the heteropodCarinaria cithara. All these prey items would likely beconcentrated at convergent fronts as a result of phys-ical processes (convergence and weak downwelling)associated with the fronts and would themselves ®ndprey at the front (Bakun, 1996).
While the use of fronts as forage habitat has beenindicated for some tunas and bill®shes, there is con-
Figure 7. Positions of surface chloro-phyll fronts and tracks of cool-groupturtles for ®rst and second quarters of1997 and 1998. `S' and `E' denote start-ing and ending positions of each turtle'strack. The dashed and solid lines markthe mean positions of the 0.2 mg m±3
chlorophyll front in the ®rst and secondquarters, respectively.
Ó 2000 Blackwell Science Ltd., Fish. Oceanogr., 9, 71±82.
78 J. J. Polovina et al.
siderable debate regarding the extent that fronts areused as migratory pathways (Olson et al., 1994). Ourresults show that the westward movement of logger-heads in the central North Paci®c occurs along fronts,moving north and south to stay with a speci®c front.Horizontal gradients in temperature, current, chloro-phyll, and possibly prey abundance levels around thefronts may provide cues that loggerheads would use tomaintain their association with fronts.
The geostrophic current estimated with TOPEX/Poseidon is a clear indication of a front, but our esti-mate, derived from the altimeter, of current velocitiesencountered by the turtles is based on two conditions:®rstly, that the satellite-derived estimates of geo-strophic current are accurate; and secondly, that othercomponents of the surface current, speci®cally wind-driven surface (Ekman) transport, are not signi®cant.
While ground-truthing of TOPEX/Poseidon currentsin the Subtropical Frontal Zone has not been con-ducted, several comparisons between TOPEX/Posei-don estimates of geostrophic current and estimatesderived from at-sea sampling and drifters ®nd goodagreement in the western and central North Paci®c(Yu et al., 1995; Mitchum, 1996). Regarding Ekmantransport, a study of the circulation with satellite-tracked drifters in the same region as occupied by ourtracked loggerheads indicates that Ekman transport isminimal and in the same direction as geostrophiccurrent, thus geostrophic current provides a good de-scription of the surface circulation in this area (Niilerand Reynolds, 1984). Speci®cally during the winter,surface drifters travelled eastward at an average speedof 3±4 cm s±1, with occasional speeds of 30 cm s±1.Further, the drifters travelled along the contours of seasurface height, indicating that geostrophic current isthe dominant component of the surface ¯ow, andhence, the estimates we derived from TOPEX/Posei-don satellite altimetry are consistent with those ob-served from drifting buoys (Niiler and Reynolds,1984).
Hypotheses regarding migrations of juvenile log-gerheads in both the Atlantic and Paci®c assume thatthey travel with the prevailing currents, rather thanactively swimming against them (Bowen et al., 1995;Hays and Marsh, 1997; Musick and Limpus, 1997). Incontrast, all nine of our loggerheads, ranging in sizefrom 41.0 to 81.0 cm carapace length, swam westwardalong the northern side of the subtropical gyre againstthe prevailing currents and speci®cally against geo-strophic currents at the edge of fronts. However, thegeostrophic currents they opposed averaged only about1/7 of their swimming speed. Perhaps by swimminginto the weak current the loggerheads increased theirencounter rate of prey suf®ciently to offset theirincreased energy expenditure. It is intriguing that allthe turtles' movements are predominately westward.At some point, these juvenile turtles will return to theeast. Two of the turtles, nos 5 and 6, began someeastward movement in July and August, just beforetheir transmissions ended, suggesting an eastwardmovement during the second half of the year. How-ever, three other turtles, nos 3, 4 and 9, tracked duringthe second half of the year, showed only westwardmovement (Fig. 2, Table 1). Further tracking withtransmitters that function longer to increase thetemporal coverage or initiating tracking in the westernNorth Paci®c will be necessary to understand logger-head spatial and temporal patterns completely. Theturtles' speed we estimated in this study, averaging1.2 km h±1, is similar to that observed in other log-
Figure 8. (a) Polar histogram of the direction of geostrophiccurrent at all recorded positions of all nine turtles.(b) Movement direction at all recorded positions for thenine turtles.
Ó 2000 Blackwell Science Ltd., Fish. Oceanogr., 9, 71±82.
Movement of loggerhead turtles along oceanic fronts 79
gerhead studies (Byles and Dodd, 1989; Papi et al.,1997).
Data on incidental catches of loggerheads in theHawaii-based longline ®shery recorded by onboardNMFS observers indicate that during the ®rst quarter of
the year, the highest capture rates occur at about 17°CSST whereas during the second quarter the highestcapture rates occur at about 20°C SST (P. Kleiber,Honolulu Lab, NMFS, pers. comm.). Our ®ndingsthat loggerhead use the 17°C and 20°C SST fronts,
Figure 9. (a) Tracks of movement of loggerheads ID nos 3 and 4 during March±July 1997, together with geostrophic currentsduring 15±25 May 1997. (b) Track of movement of loggerhead ID no. 4 during August±October 1997, together with geostrophiccurrent during 11±21 September 1997. Large circles and squares on the track lines indicate position of turtles during the same10-day time period for which the geostrophic currents are calculated. Arrows on track lines show turtle movement direction.
Ó 2000 Blackwell Science Ltd., Fish. Oceanogr., 9, 71±82.
80 J. J. Polovina et al.
together with the quarterly distribution of ®shingeffort in the longline ®shery, explain this pattern.
Initially, these ®ndings do not appear to offer anysimple way to reduce overlap between the ®shingground and turtle habitat without closing a largeportion of the ®shing ground. For example, in the®rst quarter the spread of loggerheads around theirtwo fronts at the north and south of the ®shingground will likely cover the entire ®shing ground,making it impractical to restrict the ®shing groundsuf®ciently away from the two fronts. Likewise, in thesecond quarter a large portion of the ®shing groundaround the 20°C front would have to be closed toreduce incidental catches at this front. However, datafrom onboard observers indicate that interaction rate,turtles per longline set, is substantially greater at
17°C, SST than at 20°C SST (P. Kleiber, HonoluluLab, NMFS, pers. comm.). This may indicate that ahigher density of loggerheads are found at the 17°Cfront than at the 20°C front. If this is the case, thenincidental catches of loggerheads in the longline®shery may be reduced by keeping the ®shery awayfrom the 17°C front. This could be achieved by anarea closure based on SST, because all longline boatshave temperature recorders. The approach would be toprohibit ®shing in water colder than 18°C or 18.5°C.Alternatively, because the ®shery and the 17°C frontoverlap to a large extent only during the ®rst quarter,a closure of the ®shery during some portion of the ®rstquarter would also separate the ®shery and the front.
Finally, this study shows the power of combiningdata from instruments on animals that describe their
Figure 10. Frequency distribution of turtles' movement in(a) east±west direction, (b) north±south direction, and(c) absolute velocity.
Figure 11. SST distribution of Hawaii-based longline effortfor sword®sh during (a) ®rst quarter and (b) second quartersof 1997 and 1998, together with the distribution of SSToccupied by the loggerheads tracked in the ®shing groundsduring the same period.
Ó 2000 Blackwell Science Ltd., Fish. Oceanogr., 9, 71±82.
Movement of loggerhead turtles along oceanic fronts 81
movements together with remotely sensed environ-mental data covering the region around the animalduring its movement to describe its habitat and itsmovement relative to oceanic features.
ACKNOWLEDGEMENTS
We wish to acknowledge the NMFS observers whodeployed the transmitters on all the turtles; ShawnK. K. Murakawa assisted in training observers andhandled logistics. Also, we appreciate the support fromDave Foley and Evan Howell of NOAA's HawaiiCoastwatch Program for their assistance in accessinglocal processing of the ocean colour data. Figure 1, theschematic of the North Paci®c, was developed by DaveFoley. The SeaWiFS data used in this study wereproduced by the SeaWiFS Project at Goddard SpaceFlight Center. These data were obtained from theGoddard DAAC under the auspices of NASA. Use ofthese data is in accord with the SeaWiFS ResearchData Use Terms and Conditions Agreement. TheOCTS data were kindly provided by the ADEOSProgram of the National Space Development Agencyof Japan. We acknowledge Dr Otis Brown, RSMAS,University of Miami, for the MCSST data. These datawere obtained from the NASA Physical Oceanogra-phy Distributed Active Archive Center at the JetPropulsion Laboratory/California Institute of Tech-nology. We acknowledge the Laboratory for SatelliteAltimetry, NODC, NESDIS, NOAA as the source forthe TOPEX/Poseidon altimetry data.
REFERENCES
Bakun, A. (1996) Patterns in the Ocean. La Paz, BCS, Mexico:California Sea Grant College/CIB.
Balazs, G.H., Miya, R.K. and Beavers, S.C. (1996) Procedures toattach a satellite transmitter to the carapace of an adultgreen turtle, Chelonia mydas. In: Proc. 15th Annual Sympo-sium on Sea Turtle Biology and Conservation. Keinath, J.A.,Barnard, D.E., Mubick, J.A. and Bell, B.A. (Compilers). USDept Commerce, NOAA Tech. Memo. NMFS 37:21±26.
Bowen, B.W., Abreu-Grobois, F.A., Balazs, G.H., Kamezaki, N.,Limpus, C.J. and Ferl, R.J. (1995) Trans-Paci®c migration ofthe loggerhead turtle (Caretta caretta) demonstrated withmitochondrial DNA markers. Proc. Natl Acad. Sci. 92:3731±3734.
Byles, R.A. and Dodd, C.K. (1989) Satellite biotelemetry of aloggerhead sea turtle (Carretta carretta) from the east coast ofFlorida. In: Proc. 9th Annual Workshop on Sea Turtle Biologyand Conservation. S.A. Eckert, K.L. Eckert and T.H. Rich-ardson (eds). US Dept Commerce, NOAA Tech. Memo.NMFS-SEFSC 232:215±217.
Carr, A. (1987) New perspectives on the pelagic stage of seaturtle development. Conserv. Biol. 1:103±121.
Dutton, P.F., Bixby, E., Leroux, R. and Balzas, G. (in press)Genetic stock origin of sea turtles caught in the Hawaii-
based longline ®shery. In: Proceedings of the 19th AnnualSymposium on Sea Turtle Biology and Conservation, March1±5 1999, South Padre Island, Texas. Wibbles, T. and Kalb,H. (Compilers). Miami, FL, USA: U.S. Dept of Commerce,National Oceanic and Atmospheric Administration,National Marine Fisheries Service.
Hays, G.G. and Marsh, R. (1997) Estimating the age of juvenileloggerhead turtles in the North Atlantic. Can. J. Zool.75:40±46.
McClain, C.R., Cleave, M.L., Feldman, G.C., Gregg, W.W. andHooker, S.B. (1998) Science quality of SeaWiFS data forglobal biosphere research. Sea Technol. 39(9):10±17.
McClain, E.P., Pichel, W.G. and Walton, C.C. (1985) Com-parative performance of AVHRR-based multichannel seasurface temperatures. J. Geophys. Res. 90:11 587±11 601.
Mitchum, G.T. (1996) On using satellite altimetric heights toprovide a spatial context for the Hawaii Ocean time-seriesmeasurements. Deep-Sea Res. 43:257±280.
Musick, J.A. and Limpus, C.J. (1997) Habitat utilization andmigration in juvenile sea turtles. In: Biology of Sea Turtles.P. Lutz and J.A. Musick (eds). Boca Raton, FL: CRC Press,137±163.
Niiler, P.P. and Reynolds, R.W. (1984) The three-dimensionalcirculation near the eastern North Paci®c Subtropical Front.J. Phys. Oceanogr. 14:217±230.
O'Reilly, J.E., Maritorena, S., Mitchell, B.G., Siegel, D.A.,Carder, K.L., Garver, S.A., Kahru, M. and McClain, C.(1998) Ocean color chlorophyll algorithms for SeaWiFS.J. Geophys. Res. 103:24 937±24 953.
Olson, D.B., Hitchcock, G.L., Mariano, A.J., Ashjian, C.J.,Peng, G., Nero, R.W. and Podesta, G.P. (1994) Life on theedge: marine life and fronts. Oceanography 7(2):52±59.
Papi, F., Luschi, P., Crosio, E. and Hughes, G.R. (1997) Satellitetracking experiments on the navigational ability andmigratory behavior of the loggerhead turtle Caretta caretta.Mar. Biol. 127:215±220.
Polovina, J.J., Kleiber, P. and Kobayashi, D.R. (1999) Appli-cation of TOPEX/Poseidon satellite altimetry to simulatetransport dynamics of larvae of spiny lobster, Panulirus mar-ginatus, in the Northwestern Hawaiian Islands. 1993±1996.Fish. Bull. 97:132±143.
Roden, G.I. (1980) On the Subtropical Frontal Zone north ofHawaii during winter. J. Phys. Oceanogr. 10:342±362.
Roden, G.I. (1991) Subarctic±subtropical transition zone of theNorth Paci®c: large-scale aspects and mesoscale structure. In:Biology, Oceanography, and Fisheries of the North Paci®cTransition Zone and Subarctic Frontal Zone. J.A. Wetherall(ed.). US Dept Commerce, NOAA Tech. Rep. NMFS105:1±38.
Shimada, M., Oaku, H., Mitomi, Y., Murakami, H., Mukaida,A., Nakamura, Y., Ishizaka, J., Kawamura, H., Tanaka, T.,Kishino, M. and Fukushima, H. (1998) Calibration andvalidation of ocean color version-3 product from ADEOSOCTS. J. Oceanogr. 54:401±416.
Wetherall, J.A., Balazs, G.H., Tokunaga, R.A. and Yong,M.Y.Y. (1993) Bycatch of marine turtles in North Paci®chigh-seas driftnet ®sheries and impacts on the stocks. N. Pac.Comm. Bull. 53:519±538.
Yu, Y., Emery, W.J. and Leben, R.R. (1995) Satellite altim-eter derived geostrophic currents in the western tropicalPaci®c during 1992±1993 and their validation with driftingbuoy trajectories. J. Geophys. Res. 100(C12):25 069±25 085.
Ó 2000 Blackwell Science Ltd., Fish. Oceanogr., 9, 71±82.
82 J. J. Polovina et al.