Turnpike trusts and the transportation revolution in 18th...
30
Turnpike trusts and the transportation revolution in 18th century England Dan Bogart Department of Economics, 3151 Social Science Plaza, University of California, Irvine, CA 92697-5100, USA Received 10 May 2004 Abstract There is a long debate in economic history about the causes of the transportation revolu- tion and its economic impact. This paper examines the effects of turnpike trusts in 18th century England. Turnpike trusts were organizations that financed road improvements by levying tolls. They replaced the authority of parishes, which financed road improvements using local taxes. The analysis shows that turnpike trusts contributed to lower freight charges and passen- ger travel times. It also shows that turnpike trusts, generated a social savings of at least 0.5% of national income in 1800 and 1820. Ó 2005 Elsevier Inc. All rights reserved. Keywords: Transportation revolution; Toll roads; Turnpike trusts; Institutional innovation 1. Introduction The transport revolution of the 18th and 19th centuries embodied dramatic reduc- tions in transport costs and improvements in the quality of services. It also had a profound effect on economic development by contributing to the growth of domestic and international trade. 1 Although the transport revolution has been the subject of 0014-4983/$ - see front matter Ó 2005 Elsevier Inc. All rights reserved. doi:10.1016/j.eeh.2005.02.001 E-mail address: [email protected] 1 See OÕRourke and Williamson (1999) and Estevadeordal et al. (2003). Explorations in Economic History xxx (2005) xxx–xxx Explorations in Economic History www.elsevier.com/locate/eeh ARTICLE IN PRESS
-
Upload
nguyenhuong -
Category
Documents
-
view
213 -
download
0
Transcript of Turnpike trusts and the transportation revolution in 18th...

Explorations in
ARTICLE IN PRESS
Explorations in Economic History xxx (2005) xxx–xxx
Economic History
www.elsevier.com/locate/eeh
Turnpike trusts and the transportationrevolution in 18th century England
Dan Bogart
Department of Economics, 3151 Social Science Plaza, University of California, Irvine, CA 92697-5100, USA
Received 10 May 2004
Abstract
There is a long debate in economic history about the causes of the transportation revolu-tion and its economic impact. This paper examines the effects of turnpike trusts in 18th centuryEngland. Turnpike trusts were organizations that financed road improvements by levyingtolls. They replaced the authority of parishes, which financed road improvements using localtaxes. The analysis shows that turnpike trusts contributed to lower freight charges and passen-ger travel times. It also shows that turnpike trusts, generated a social savings of at least 0.5%of national income in 1800 and 1820.� 2005 Elsevier Inc. All rights reserved.
Keywords: Transportation revolution; Toll roads; Turnpike trusts; Institutional innovation
1. Introduction
The transport revolution of the 18th and 19th centuries embodied dramatic reduc-tions in transport costs and improvements in the quality of services. It also had aprofound effect on economic development by contributing to the growth of domesticand international trade.1 Although the transport revolution has been the subject of
0014-4983/$ - see front matter � 2005 Elsevier Inc. All rights reserved.
doi:10.1016/j.eeh.2005.02.001
E-mail address: [email protected] See O�Rourke and Williamson (1999) and Estevadeordal et al. (2003).

2 D. Bogart / Explorations in Economic History xxx (2005) xxx–xxx
ARTICLE IN PRESS
much research, there are still questions about its causes. Some scholars argue thattechnological change was the key factor, whereas others point to a variety of alter-native factors, including the elimination of piracy, changes in loading procedures,and greater coordination in scheduling.2 This paper investigates the impact of aninstitutional innovation by examining the effect of turnpike trusts in 18th centuryEngland.
A turnpike trust was an organization that financed road improvements by levyingtolls and issuing mortgage debt. They were created by Acts of Parliament, whichnamed a body of trustees and gave them authority over a particular roadway thatwas previously maintained by parishes. Unlike turnpike trusts, parishes did not haveaccess to external sources of funding, such as tolls or bonds. Instead, they financedroad improvements by levying local property taxes and by claiming up to six days oflabor per year from their residents. Parishes were also different because they werepart of local government, whereas turnpike trusts were statutory authorities thatwere promoted and managed by local property owners.
The diffusion of turnpike trusts spanned the 17th, 18th, and early 19th centuries.The 1750s and 1760s were the most significant period of adoption as over 300 trustswere established along 10,000 miles of road. By the 1830s, the turnpike network ex-panded further and included around 1000 trusts managing 20,000 miles, or 17% ofthe entire road network in England and Wales.3
The adoption of turnpike trusts had an immediate effect on the economy byincreasing road maintenance and investment. Turnpike trusts generally spent be-tween 10 and 20 times more than the parishes they replaced. Trusts were also thedriving force behind a fourfold increase in total road spending between 1730 and1800.4
At the same time that turnpike trusts were increasing road expenditure, the roadtransport sector was experiencing a number of revolutionary changes, including a40% reduction in freight charges and a 60% decline in passenger travel times. Thiscoincidence has led many scholars to investigate whether turnpike trusts contributedto these developments. The studies by Jackman (1916), Albert (1972), and Pawson(1977) suggested that turnpike trusts were the key innovation because road improve-ments allowed horses to haul larger loads and travel faster. However, Gerhold (1996)has challenged this view by arguing that improvements in horse breeding and in-creases in the size of carriage firms were at least as important as better roads.
This debate has raised a number of questions about the relationship between turn-pike trusts and the road transport revolution. One possibility is that turnpike trustswere responsible for the majority of the efficiency gains because road improvementshad a large effect on transport costs. An alternative possibility is that turnpike trustshad little impact because improvements in horse breeding and the emergence of lar-
2 See North (1968), Shepherd and Walton (1972), Harley (1988), Menard (1991), Kaukiainen (2001), andMohammed and Williamson (2004).3 For information of the length of the road network in England and Wales, see Great Britain, House of
Commons (1841).4 Bogart (Forthcoming).

D. Bogart / Explorations in Economic History xxx (2005) xxx–xxx 3
ARTICLE IN PRESS
ger carriage firms were the primary factors behind lower transport costs. Finally,there is a possibility that turnpike trusts may have reduced efficiency by levying tollson road-users.
This paper examines these possibilities and reassesses the impact of turnpike trustson the road transport sector. It shows that trusts reduced freight charges by an aver-age of 20% and that they accounted for around half of the total decline in freightcharges. It also demonstrates that freight charges were stable immediately beforeturnpike trusts were adopted and that winter freight charges converged to summerfreight charges after trusts were established. The last two findings provide supportingevidence, because they show that the effects of turnpike trusts on freight charges can-not be attributed to improvements in horse breeding or larger carriage firms.
Overall, the analysis demonstrates that turnpike trusts were one of the key inno-vations that caused the road transport revolution. It also shows that turnpike trustshad a greater effect in the London transport market, which was the largest in theBritish economy. In addition, it shows that turnpike trusts generated a social savingsof at least 0.5% of national income in 1800 and 1820. The last two results have moregeneral implications because they indicate that turnpike trusts contributed to theprocess of economic development during the Industrial Revolution.
The paper is organized as follows. Sections 2 and 3 describe the adoption of turn-pike trusts and the major changes in the road transport sector during the 18th cen-tury. Sections 4–6 examine the effects of turnpike trusts on the transport sector.Section 7 presents the social savings estimates and Section 8 concludes.
2. The rise of turnpike trusts
Before turnpike trusts, parishes were responsible for road improvements withintheir jurisdiction. Parishes were local governments that came under the authorityof county magistrates, who were appointed by the crown. Magistrates were to ensurethat parishes complied with their statutory responsibilities, which included the pro-vision of local public goods, such as poor relief, constables, church construction, androad maintenance. Parishes financed these expenditures by levying taxes on propertyincome. In the case of roads, parishes also had the authority to claim at most six daysof unpaid labor from their residents per year.
By most accounts the parish system was generally unsuccessful in financing roadimprovements.5 One problem was that parishes could not force through-travelers tocontribute to the costs of road investment. The through-traffic problem was espe-cially relevant along the highways leading into London, where wagons and carriagesoften passed through dozens of parishes along their route. In such cases, parisheswould be forced to pay for all the maintenance and investment costs, even thoughthey derived only a fraction of the benefits.
5 Ginarlis and Pollard (1988) argued that parish road expenditure was substantial between 1750 and1850; however, Bogart (Forthcoming) has shown that their estimates vastly over-state the roadexpenditures of parishes.
4 D. Bogart / Explorations in Economic History xxx (2005) xxx–xxx
ARTICLE IN PRESS
Borrowing constraints were another reason why the parish system was unsuccess-ful in financing road investment. Legal restrictions on issuing debt forced parishes torely on current tax revenues. As a result, they had little incentive to undertake costlyroad investments with long gestation periods.
Parishes also provided few road improvements because of coordination problems.Coordination was necessary because the benefits associated with improving one roadsegment often depended on the investments in another segment. Therefore, some par-ishes may have decided to leave their roads unimproved because they expected thatother parishes would not make similar investments along neighboring roads.
The shortcomings of the parish system became apparent during the 17th centuryas trade grew and the demand for better roads increased.6 In 1663, an Act of Parlia-ment introduced the first significant reform by granting magistrates in Hertfordshireand Cambridgeshire the authority to levy tolls along a section of the �Great NorthRoad.� In the 1690s, Parliament continued this policy by granting magistrates theright to levy tolls along certain highways in Essex, Norfolk, Gloucestershire, andSurrey.
In the early 1700s, Parliament began passing Acts that granted similar privilegesto bodies of trustees composed of local landowners and merchants. Under thisarrangement, trustees were authorized to finance improvements along a particularstretch of road by issuing debt and levying tolls. Trustees had to keep the tolls belowa maximum schedule that distinguished between wagons, carriages, and livestock.Trustees were also required to devote all the toll revenues to road improvementsand other expenses, which meant that they were not allowed to earn direct profits.7
Turnpike trusts gained popularity during 1710s and 1720s and eventually replacedthe original trusts that were managed by magistrates. Each turnpike trust was cre-ated by an Act of Parliament and continued under a series of renewal Acts passedat least every 21 years. Turnpike Acts were initiated by local property owners,who petitioned Parliament for the right to create a trust. Early in the 18th century,it was common for petitions to fail in Parliament, but by the middle of the century,turnpike petitions were rarely unsuccessful.8
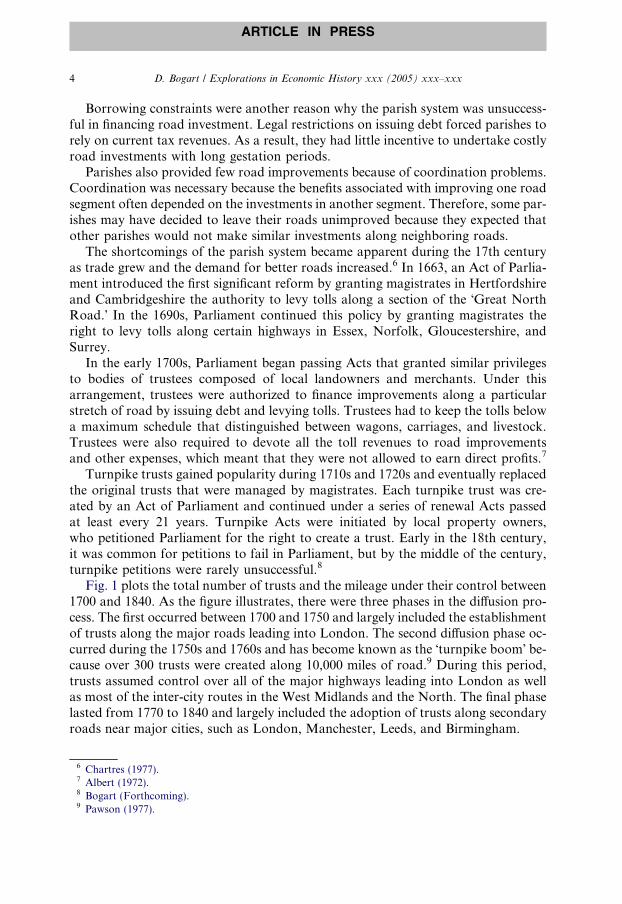
Fig. 1 plots the total number of trusts and the mileage under their control between1700 and 1840. As the figure illustrates, there were three phases in the diffusion pro-cess. The first occurred between 1700 and 1750 and largely included the establishmentof trusts along the major roads leading into London. The second diffusion phase oc-curred during the 1750s and 1760s and has become known as the �turnpike boom� be-cause over 300 trusts were created along 10,000 miles of road.9 During this period,trusts assumed control over all of the major highways leading into London as wellas most of the inter-city routes in the West Midlands and the North. The final phaselasted from 1770 to 1840 and largely included the adoption of trusts along secondaryroads near major cities, such as London, Manchester, Leeds, and Birmingham.
6 Chartres (1977).7 Albert (1972).8 Bogart (Forthcoming).9 Pawson (1977).

Fig. 1. The diffusion of turnpike trusts in England and Wales, 1700–1840.
D. Bogart / Explorations in Economic History xxx (2005) xxx–xxx 5
ARTICLE IN PRESS
The adoption of turnpike trusts resulted in a substantial increase in road expen-diture. Prior to turnpike trusts, most parishes failed to levy any property taxes in or-der to finance highway improvements. As a result, most parishes never hired laborersto work on their roads, nor did they spend anything on land and materials. Instead,most parishes relied entirely on unpaid labor performed by their residents. Whenturnpike trusts were established, financial expenditures on labor, land, and materialsincreased by between 10 and 20 times. This resulted in a dramatic increase in aggre-gate road expenditure, particularly during the 1750s and 1760s when trusts becamewidely diffused throughout the network.10
Turnpike trusts were able to increase road expenditure because they addressed avariety of problems in the parish system. For example, trusts resolved the throughtraffic problem by levying tolls on road-users. They also relieved borrowing con-straints because they were able to issue debt at a low cost. Finally, trusts addressedcoordination problems by replacing a multitude of parishes with a single body oftrustees, who could direct investment over an entire road or a network of roads.
During the same period that turnpike trusts were increasing infrastructure invest-ment, the road transport sector was also experiencing significant changes. The fol-lowing section reviews these developments and introduces the data sources thatare used to evaluate the effects of turnpike trusts.
3. The road transportation revolution
There is a common perception that road transport experienced few changes dur-ing the 18th century and that canals and ocean shipping were the vanguard of thetransport revolution. However, this view is not supported by the evidence, whichshows substantial increases in passenger travel speeds, large reductions in freightcharges, and a significant growth in road traffic. Fig. 2 illustrates the changes in pas-
10 Bogart (Forthcoming).

Fig. 2. Average journey miles per-hour in passenger services, 1750–1829.
6 D. Bogart / Explorations in Economic History xxx (2005) xxx–xxx
ARTICLE IN PRESS
senger travel speeds by plotting average journey miles per-hour between 1750 and1829. The figures are based on a sample of 225 city-pairs drawn from the studiesby Jackman (1916) and Pawson (1977).11 Between 1750 and 1800, average journeymiles per-hour increased from 2.6 to 6.2 and by 1829 it increased to 8.0. In a fewcases, the change in travel times can also be measured over the entire 18th century.For instance, Eric Pawson has shown that travel times between London and Man-chester decreased from around 90 hours in 1700 to 60 hours in 1760 and 24 hoursin 1787.
The increase in passenger travel speeds is also supported by evidence on the dif-fusion of �fly-machines.� Fly-machines were coach services that traveled at a higherspeed because they continuously changed teams of horses.12 Fly-machines were rel-atively rare before 1750, but by 1770 they comprised around 20% of all passengerservices leaving from London and were available to all major cities.13
Increasing travel speeds were accompanied by relatively modest reductions in pas-senger fares. Fig. 3 plots an index of real fares between 1750 and 1830, after deflatinga nominal fare series with Greg Clark�s consumer price index (2001a). The nominalfare series is based on data from Jackman (1916) and Gerhold (1996) as well as newinformation on a large number of passenger fares in 1760 and 1770.14 The new seriesshows that passenger fares fluctuated over time, but that they were lower by an aver-age of 7.5% between 1790 and 1809. Therefore, it appears that passengers generallypaid lower fares for faster services in the early 19th century.
The freight sector had a different experience than the passenger sector, becausefreight charges declined substantially, while travel speeds increased only modestly.The most comprehensive source on freight charges are land carriage rates, which rep-resent the maximum price that a carrier could charge for the shipment of goods be-
11 For information on the data see Third table of Appendix A.12 Gerhold (1996).13 The diffusion of fly-machines can be traced in London travel directories. See the end of this section formore details.14 For more information see Fourth table of Appendix A.

Fig. 3. An index of real passenger fares, 1750–1830.
D. Bogart / Explorations in Economic History xxx (2005) xxx–xxx 7
ARTICLE IN PRESS
tween two cities. Land carriage rates were introduced by legislation passed in the1690s. The legislation gave county magistrates the authority to set maximum freightcharges in order to prevent carriers from colluding and raising their prices. It alsogave magistrates discretion over which markets to regulate. In most cases, magis-trates set the rates on goods shipped from London to their major city, but in othercases they also set rates on goods shipped from other cities.
A number of scholars have shown that land carriage rates were binding on carri-ers and that they were adjusted when underlying costs changed. For example, Free-man (1977) has shown that between London and Portsmouth advertised and actualfreight charges were very close to land carriage rates between 1775 and 1800. Turn-bull (1985) has also provided evidence that carriers in the North of England chargedfreight rates that were identical to land carriage rates. Turnbull also documented thatYorkshire magistrates raised land carriage rates in 1800, because rising feed priceswere forcing carriers to suspend services at the previous price ceiling.15
This study builds on the earlier literature and uses a new data set of over 5000land carriage rates from 130 city-pairs between 1695 and 1827. Fig. 4 combines allthe observations and plots an index of real land carriage rates between 1700 and1819.16 The new series shows that land carriage rates fell by approximately 40% inreal terms between 1750 and 1800. As a result, it provides new evidence that freightcharges fell substantially during the second half of the 18th century.17
The new dataset also reveals that there was variation across city-pairs in terms ofthe magnitude by which freight charges declined. For example, between London andNewcastle real land carriage rates fell by 50% between 1750 and 1800, while they fellby only 25% between Leeds and York over the same period.
15 For more discussion of land carriage rates see Albert (1972) and Willan (1962).16 The series is equal to an index of average land carriage rates in each decade divided by Clark�sconsumer price index (2001a). See Second table of Appendix A for more information.17 Albert (1972) and Gerhold (1996) also used land carriage rates to argue that freight charges declined,but both of these studies relied on fewer observations, especially before 1750.

Fig. 4. Real land carriages, 1700–1819.
8 D. Bogart / Explorations in Economic History xxx (2005) xxx–xxx
ARTICLE IN PRESS
The changes in freight travel speeds were more modest than the changes in freightcharges. In this case, the differences in speed can only be measured by the diffusion offly-wagon services, which were the counterpart of fly-machines in the freight sector.For most of the 18th century, fly-wagons were rare and comprised less than 1% of allfreight services leaving from London. As a result, their effect on travel speeds wasmuch more limited than in the case of fly-machines.
Another development in the road transport sector was the increase in road traffic.Chartres and Turnbull (1983) provided the first estimates of traffic growth by com-paring the number of weekly freight and passenger services listed in London traveldirectories. For example, if directories indicate that the number of listed weekly ser-vices between London and Birmingham increased from 2 to 3 between 1750 and1760, then Chartres and Turnbull inferred that the number of trips between these cit-ies grew by 50%. Using this methodology for a sample of cities, they estimated thatfreight and passenger traffic grew at an average annual rate of 1.2 and 2.9%, respec-tively, between 1715 and 1796.
Chartres and Turnbull�s estimates have not gone unchallenged. In particular, Ger-hold (1988) has suggested that their figures over-state the growth rate in road trafficbecause travel directories do not distinguish between services to a single city and ser-vices to multiple cities. As an illustration, consider a wagon service that traveled oncea week from London to Birmingham and another service that traveled once a weekto Leicester and the neighboring city of Harborough. In travel directories, all ofthese cities would be listed separately, and therefore it would appear as if there werethree separate trips instead of two. Now imagine that the number of weekly trips toLeicester and Harborough increased from 1 to 2, while the number of weekly trips toBirmingham remained constant at 1. In this case, directories would suggest that totalweekly trips increased from 3 to 5, even though the number of actual trips increasedfrom 2 to 3.
As the previous example shows, the growth of listed services may not provide anaccurate measure of traffic growth. Nevertheless, it is still possible to estimate a low-er bound by focusing on the subset of services between London and 45 major cities

Table 1The growth of listed passenger and freight services leaving from London, 1715–1800
Year (1) Number of listedweekly freightservices, major cities
(2) Number of listedweekly freightservices, all cities
(3) Number of listedweekly passengerservices, major cities
(4) Number of listedweekly passengerservices, all cities
1715 140 840 150 6201740 220 1570 110 7801749 230 1610 140 7601760 340 1950 210 9401770 390 2960 410 1,9601779 340 3100 820 3,1901790 520 4590 1590 8,0101800 970 7790 1960 12,210
Average annualgrowth rate
Average annualgrowth rate
Average annualgrowth rate
Average annualgrowth rate
1715–1800 2.3% 2.7% 3.1% 3.6%1760–1800 2.7% 3.5% 5.7% 6.6%
Sources. The figures for 1715 come from the Merchant and Traders Necessary Companion. The figures for1740, 1749, 1760, and 1770 come from the New and Complete Guide to all Persons who have any Trade or
Concern with the City of London. The figures for 1779, 1790, and 1800 come from the Shopkeepers and
Tradesman�s Assistant. Notes. Figures are rounded to the nearest ten and all years exclude services to citiesin Middlesex County.
D. Bogart / Explorations in Economic History xxx (2005) xxx–xxx 9
ARTICLE IN PRESS
with a population above 2500 in 1700.18 Among others, the major cities include Bir-mingham, Leeds, Manchester, Liverpool, and Bristol. These cities were presumablylarge enough to support their own wagon and coach services, and therefore theywould be less likely to have overlapping services with other major cities.
Table 1 displays the number of listed weekly freight and passenger services be-tween London and 45 major cities in 1715, 1740, 1749, 1760, 1770, 1779, 1790,and 1800. For comparison, it also lists the number of weekly services between Lon-don and all cities listed in travel directories. Column (1) shows that the average an-nual growth rate for listed freight services between London and major cities was2.3% between 1715 and 1800, while column (2) shows that listed freight services be-tween London and all cities grew at a higher average rate of 2.7%. Columns (3) and(4) reveal a similar pattern for passenger services, in which listed services betweenLondon and major cities grew at an average rate of 3.1% between 1715 and 1800,in comparison with a 3.6% growth rate between London and all cities. The lowergrowth rate across major cities suggests that the increases in listed services acrossall cities may indeed overstate the true growth in traffic. However, the differencesare not large enough to overturn the conclusion that road traffic increased at a sub-stantial rate. In fact, these figures imply that during the 18th century, output in theroad transport sector grew by at least 2.3% per year for freight and 3.1% for passen-ger services, which is greater than the average growth rate for many sectors in theBritish economy.19
18 The list of major cities is drawn from Corfield (1982).19 See Crafts (1985) for estimates of output growth across sectors.
10 D. Bogart / Explorations in Economic History xxx (2005) xxx–xxx
ARTICLE IN PRESS
The trends in freight and passenger services are also consistent with the earlier evi-dence on travel times and freight charges. In particular, they show that the growthrate in freight services was higher between 1760 and 1800, when freight charges werefalling. Similarly, passenger services grew more rapidly after the 1760s, when travelspeeds were increasing.
To summarize, the road transport sector increased in both size and efficiency be-tween 1750 and 1800. The timing of these changes is significant because it coincideswith the rise of turnpike trusts. The following section examines this relationship anddiscusses why turnpike trusts may (or may not) have contributed to lower transportcosts and higher traffic volumes after 1750.
4. Turnpike trusts and the road transport revolution
There are a number of issues concerning the relationship between turnpike trustsand the road transport revolution. One issue is whether turnpike trusts loweredtransport costs by improving roads, or whether they increased transport costs bylevying tolls. Road improvements included three components: better surfaces, lowergradients, and wider roads.20 Better surfaces and lower gradients reduced transportcosts because they allowed horses to carry larger loads and travel faster.21 Both ofthese effects were confirmed by the experiments of John MacNeill in the early 19thcentury. MacNeill showed that horsepower increased by 23% when a wagon haulingfour tons moved along a dry paved road as opposed to a wet and muddy gravel road.He also showed that horsepower diminished by 50% when gradients increased from 1to 5%.22
Wider roads also increased load sizes by encouraging the replacement of pack-horses with large wagons.23 Packhorses could not carry as many tons as wagons,but they had an advantage in that they could be used on narrow roads. Therefore,in some cases it was necessary that roads be widened before wagons could beadopted. In other cases, wider roads facilitated the use of wagons by increasingcapacity and reducing the effects of congestion.
The tolls had the opposite effect as road improvements because they added to car-riage costs. Each turnpike trust had the authority to set its own tolls, as long as theywere below the maximum schedule defined in each Act of Parliament. In setting thetolls, trustees may have pursued a variety of objectives. For instance, they may haveset the tolls just high enough to pay for maintenance and interest costs. This strategymade sense because trustees often owned property near the road, which could in-crease in value if transport costs were minimized.
Alternatively, trustees may have tried to extract monopoly rents by charging high-er tolls. Trustees were legally prohibited from earning profits, but they could still
20 Gerhold (1993, 1996).21 See Jackman (1916), Albert (1972), and Pawson (1977).22 For more information on McNeill�s study see Great Britain, House of Lords (1834, p. 129).23 See Gerhold (1996) and Pawson (1977).

D. Bogart / Explorations in Economic History xxx (2005) xxx–xxx 11
ARTICLE IN PRESS
benefit by selling land and materials or by lending to the trust. There was great sus-picion among contemporaries that trustees were indeed benefiting in this way. Forexample, in The Wealth of Nations Adam Smith suggested that abuses by trusteesmade the tolls twice as large as was necessary to properly maintain the road net-work.24 Smith�s views were shared by a farmer in Durhamshire, who complained thathigh tolls were likely to persist because turnpike bondholders were earning a 5% re-turn, which was high for that area.25
The manner in which trustees set the tolls has implications for the effect of turn-pike trusts on passenger fares and freight charges. If trustees tried to raise the tollsbeyond the level necessary to pay for maintenance and interest, then fares andfreight charges may have increased because the tolls more than offset the effectsof better roads. On the other hand, if trustees were constrained by the maximumtoll schedules or if they were interested in maximizing property values, then faresand freight charges may have declined because the effects of better roads domi-nated the tolls.
A second issue concerns the relationship between turnpike trusts and other inno-vations in the road transport sector. The two most significant innovations wereimprovements in horse breeding and the rise of large carriage firms.26 Accordingto Gerhold (1996), improvements in breeding allowed horses to haul bigger loadsand travel faster. He also suggested that larger carriage firms made better use ofcapacity and were able to procure inputs more cheaply.
Gerhold also estimated the amount by which various innovations reduced costs.For example, he used records from carriage firms to show that better roads andhorses could reduce feed expenses by 60%. He also used grain prices to show thatlarge firms could reduce their feed expenses by 29%, if they bypassed innkeepersand stored feed in their own facilities. After tallying the effects of various improve-ments, Gerhold concluded that better horses and larger firms combined to reduce to-tal costs by 33%, while road improvements lowered total costs by 31%.
The simultaneous emergence of turnpike trusts, new horse breeds, and larger firmsraises a concern that the effects from at least one of these innovations are over-statedbecause they were induced by other innovations. For example, turnpike trusts mayhave been adopted only after new horse breeds and larger firms reduced transport costsand raised traffic volumes. Alternatively, new horse breeds may have been introducedonce turnpike trusts raised their effectiveness by improving roads. Similarly, largerfirms may have emerged only after turnpike trusts increased average load sizes.
The following section addresses this endogeneity problem by studying the trendsin land carriage rates before trusts were adopted. It also exploits information on the
24 See Smith (1976, p. 1726).25 The farmer�s views come from the diary of the Swedish traveler R. Angerstein, which was translated byBerg and Berg (2001).26 There were also improvements in wagon and carriage design as well as innovations in road buildingtechniques, but most of these developments occurred in the early 19th century, which is after mostturnpike trusts were adopted (Straus, 1912).
12 D. Bogart / Explorations in Economic History xxx (2005) xxx–xxx
ARTICLE IN PRESS
relative changes in winter versus summer land carriage rates. But first, it focuses onthe question of whether turnpike trusts raised land carriage rates by levying tolls.
5. Did turnpike trusts lower land carriage rates?
Land carriage rates are particularly useful for the evaluation of turnpike trusts be-cause they measure freight charges for individual city-pairs over the 18th century. As aresult, they can determine whether freight charges increased or decreased after trustswere established.27 Measuring the effect of turnpike trusts is complicated by the factthat they were not adopted instantly along the entire route connecting city-pairs.For instance, along the 275-mile route between Newcastle and London, 17 separateturnpike trusts were established at various times between 1710 and 1776. To deal withthis issue, adoption is measured by the fraction of route mileage managed by turnpiketrusts in each year.28 In theNewcastle toLondon case, the fraction ofmileagemanagedby trusts was 0.51 in 1740, 0.87 in 1745, and 0.92 in 1750.
Eq. (1) describes one relationship between real land carriage rates and the fractionof route mileage managed by turnpike trusts:
lnðreal land carriage rateijtÞ ¼ bðfraction turnpikeitÞ þ d lnðreal wagejtÞþ q lnðreal feed pricejtÞ þ cþ ai þ eijt: ð1Þ
The subscript i represents each city-pair, j represents one of four regions (South-east, Southwest, North, and Midlands), and t represents each year(t = 1695,1696, . . ., 1827). The variable ln (real land carriage rateijt) is the naturallog of the real land carriage rate for city-pair i in region j in year t; fraction turnpikeitis the fraction of route mileage managed by turnpike trusts for city pair i in year t;ln (real wagejt) is the log of the real wage in region j in year t; ln (real feed pricejt) isthe log of the real price of horse feed in region j in year t; ai is a city-pair dummyvariable, and eijt is the error term.29
The regression includes the real wage and real feed price because they were impor-tant determinates of carriage costs. It also includes a city-pair dummy variable,which captures all time-invariant, unobservable characteristics, such as the distancebetween cities and geographic factors. The coefficient on the variable, fraction turn-pike, measures the percentage change in real land carriage rates after turnpike mile-age increased for a particular city-pair. This coefficient also has a useful economic
27 Ideally, we would like to determine the effects of trusts on both prices and quantities, butunfortunately, this information is not available at a route level.28 To link turnpike trusts with city-pairs, I first identified when and where turnpike trusts were establishedusing the comprehensive studies of Albert (1972) and Pawson (1977). Next, I matched turnpike trusts withcity-pairs using the travel guide, Britannia Depicta (Bowen, 1970) and Paterson�s Roads (Mogg, 1826). In afew cases, a route could not be identified for a city-pair, in which case I used the maps from the Phillimore
Atlas (Humphery-Smith, 1984).29 The variables are deflated using the price index from Clark (2001a). For more information on the datasources see Appendix A.

Table 2The effect of turnpike trusts on land carriage rates: baseline specifications
Variable (1) Coefficient (2) Coefficient
Fraction turnpike �0.500 (0.125)* 5.9131 (0.7710)*
(Fraction turnpike)* (year) �0.0033784 (0.0004)*
Year �0.0028437 (0.0009)*
ln(real wage) 0.557 (0.021)* 0.1943 (0.0374)*
ln(real feed price) �0.269 (0.024)* 0.0609 (0.0400)Constant 1.198 (0.082)* 5.7925 (1.6202)*
City-pair dummies Yes YesYear dummies No YesR2 0.319 0.786City-pairs 130 130
Total observations 5071 5071
Notes. Dependent variable is the natural log of the real land carriage rate for city-pair i in year t.* Standard errors are in parentheses, * indicates statistical significance at the 95% level.
D. Bogart / Explorations in Economic History xxx (2005) xxx–xxx 13
ARTICLE IN PRESS
interpretation because it measures the percentage change after trusts were estab-lished along 100% of the route mileage. For instance, suppose that turnpike trustswere adopted along an entire route during the 1750s. Eq. (1) would imply that afteraccounting for differences in input prices, the log difference in carriage rates between1760 and 1750 equals b (1–0), because the fraction of turnpike mileage increasedfrom 0 to 1.
The results are presented in column (1) of Table 2. They indicate that land car-riage rates declined by 50% in real terms after turnpike trusts were established along100% of the route mileage for a city-pair. Fig. 5 illustrates the result by plotting theevolution of land carriage rates per-mile against the fraction of turnpike mileage be-tween Leeds and London, York and London, Newcastle and London, and Rich-mond and London. In all four cases, land carriage rates declined once turnpiketrusts were established along at least 80% of the route. The most dramatic changeoccurred between Richmond and London, where land carriages rates declined from0.12 pence per stone (14 lbs.) per mile in 1700 to 0.064 pence in 1758. The York toLondon case is also interesting because land carriage rates increased temporarily be-tween 1741 and 1745, at the same time that several turnpike trusts were establishedalong this route. The brief rise in carriage rates suggests that in some cases the tollsraised freight charges, but only in the short-run.
There is also evidence from the maximum schedules, which suggests that thetolls diminished over the 18th century. Across all Turnpike Acts that were passedbetween 1730 and 1744, the average maximum toll for a wagon drawing fourhorses was 0.98 shillings, while among all Acts that were passed between 1800and 1801, the average toll for the same wagon was 1.8 shillings. These figures im-ply that average wagon tolls decreased by around 20% in real terms, because thegeneral price level rose by 150% between 1740 and 1801.30 Therefore, part of
30 The difference in average tolls between 1730–1744 and 1800–1801 is statistically significant (t-statistic,4.69). The data on inflation comes from the price index in Clark (2001a).

Fig. 5. Turnpike trusts and the evolution of land carriage rates in four cases.
14 D. Bogart / Explorations in Economic History xxx (2005) xxx–xxx
ARTICLE IN PRESS
the decline in freight charges may have been due to the lower tolls imposed byParliament.
Overall, the estimates from regression Eq. (1) suggest that turnpike trusts de-creased, rather than increased freight charges. However, the estimates probablyover-state the impact of turnpike trusts, because the regression does not controlfor other factors that affected land carriage rates. For example, it does not ac-count for the possibility that carriage rates declined because a new horse breedwas introduced or because firm sizes increased. Therefore, it is necessary to esti-mate the following equation, which controls for some of these unobservablefactors.
lnðreal land carriage rateijtÞ ¼ bðfraction turnpikeitÞ þ gðyeartÞþ lðyeartÞ � ðfraction turnpikeitÞþ d lnðreal wagejtÞ þ q lnðreal feed pricejtÞþ cþ kt þ ai þ eijt: ð2Þ
The new variables include yeart (i.e., 1695, 1696, . . ., 1827) and kt, which is a dum-my variable for each year. The coefficient on yeart measures the trend reduction inreal land carriage rates over time and captures the effects of innovations that wereunrelated to turnpike trusts. The coefficients on the year dummies measure the an-nual variation around the trend and capture the impact of short-run factors, suchas a brief rise in the price level. Finally, the coefficient on the interaction(yeart) · (fraction turnpikeit) measures the trend change in real land carriage ratesafter turnpike trusts were adopted.
With this specification, the effects of turnpike trusts are measured over a particu-lar time period. For example, if a city-pair had turnpike trusts adopted along its en-tire route during the 1750s, then the log difference in real land carriage rates between1750 and 1800 equals b + g (1800 � 1750) + l (1800), after deducting the impact ofyear specific effects and changes in real wages and feed prices. The change associated

D. Bogart / Explorations in Economic History xxx (2005) xxx–xxx 15
ARTICLE IN PRESS
with turnpike trusts is captured by b + l (1800), whereas the effects of unobservableinnovations are measured by g (1800 � 1750).
The results from the second regression are reported in column (2) of Table 2.They indicate that if a city-pair had a turnpike trust established along its routeduring the 1750s, then it experienced a 31% reduction in real land carriage ratesbetween 1750 and 1800 and a 43.4% reduction between 1750 and 1820. The esti-mates also imply that turnpike trusts accounted for 16.8% (5.9131 � 1800· [0.0033784]) of the change between 1750 and 1800 and 23.5% (5.9131 �1820 · [0.0033784]) between 1750 and 1820. In other words, turnpike trusts wereresponsible for around half of the total reduction in land carriage rates over the18th century.31
These findings show that turnpike trusts still reduced land carriage rates, evenafter controlling for the effects of unobservable factors. Nevertheless, there is stilla concern that the effects are over-stated because turnpike trusts may have been in-duced by other innovations, like larger carriage firms or improvements in horsebreeding. The consistency of the results can be checked by studying the seasonal var-iation in land carriage rates. Seasonality is relevant because travelers often remarkedon the poor condition of roads in the winter, when the rains were heavy. Therefore, ifturnpike trusts lowered freight charges by improving road quality then winter freightcharges should have declined relative to summer charges.
Fig. 6 illustrates the changes in seasonality by plotting the average ratio of win-ter and summer land carriage rates over the 18th century. During the 1730s and1740s, winter rates were between 35 and 50% higher than summer rates, but bythe 1750s and 1760s, they were only 20% higher and by 1800 they were generallyequal to summer rates.32 This finding cannot be explained by improvements inhorse breeding or increases in firm size, because each of these factors affectedfreight charges similarly throughout the year. By contrast, this evidence is consis-tent with the argument that turnpike trusts lowered freight charges by improvingroad surfaces.
The land carriage rates between Leeds and Selby, in the West Riding of York-shire, provide an excellent example of the effect of turnpike trusts on seasonality.Beginning in the 1690s, the summer rate between Leeds and Selby was 6.5 shillingsper four horseback (896 pounds), while the winter rate was 15.5 shillings. These ratescontinued until 1744, when the summer rate was reduced to 6 shillings and the winterrate was reduced to 10.5 shillings. The greater decline in winter rates (32% versus 8%)is significant because it came shortly after the adoption of the Leeds and Selby Turn-pike Trust in 1741. The timing of these changes is unlikely to be coincidental, be-
31 I tested for autocorrelation in the standard errors by using the Baltagi and Wu (1999) procedure forunbalanced panels. The test indicates that we cannot reject the hypothesis of first-order autocorrelation.However, if we assume that the errors follow an AR(1) process, the coefficients on the turnpike variablesremain economically and statistically significant. In particular, they imply that turnpike trusts accountedfor a 22.1% reduction in real land carriage rates by 1820.32 In an unreported regression of the ratio of winter to summer rates on a set of decade dummy variables,all decade dummies are negative and statistically significant beginning in the 1750s.

Fig. 6. Average ratio of winter to summer land carriage rates, 1730–1809.
16 D. Bogart / Explorations in Economic History xxx (2005) xxx–xxx
ARTICLE IN PRESS
cause the parishes which preceded the Leeds and Selby trust did not make any majorroad investments prior to 1741.33
The inducement hypothesis can also be addressed by testing whether land carriagerates fell during the five year period before turnpike trusts were established.34 Forinstance, suppose that a city-pair had trusts established on 50% of its route in1745 and along the other 50% of its route in 1755. If turnpike trusts were inducedby the cost savings from other innovations then land carriage rates should declinein either the early 1740s or the early 1750s, just before new trusts were established.
Table 3 reports the estimates from regression Eqs. (1) and (2) after including avariable that measures the fraction of turnpike mileage that will be created withinthe next five years.35 In column (1) the estimates indicate that land carriages werenot any lower during the 5-year period preceding turnpike trusts. Similarly in col-umn (2), the estimates show that the trend in land carriage rates did not change be-fore trusts were established. As a result, there is no evidence that turnpike trusts wereinduced by other innovations. If fact, the findings suggest the opposite, namely thatother innovations were induced by turnpike trusts.36
The results on the timing of rate reductions as well as the evidence on the relativedecline of winter rates supports the view that turnpike trusts were one of the keyinnovations that caused the road transport revolution. In particular, they reaffirmthe finding that turnpike trusts lowered freight charges by around 20% and that theyaccounted for around half of the total decline in freight charges.
33 See Bogart (Forthcoming) for evidence on parish road expenditure before turnpike trusts.34 In other words, we can test whether the adoption of turnpike trusts in any of the years t + 1, t + 2,t + 3, t + 4, or t + 5, implied lower land carriage rates for a city-pair at date t.35 For instance, in the previous example, this variable will take the value 0.5 from 1740 to 1744, 0 from1745 to 1749, 0.5 from 1750 to 1754, and 0 for every year after 1755.36 It is possible that other innovations preceded turnpike trusts, but their effects are not apparent becauserising traffic volumes raised transport costs. This possibility seems unlikely given that directories show thattraffic growth increased the most during the 1760s and 1770s, which is after most trusts were adopted.

Table 3Did land carriage rates fall before turnpike trusts were adopted?
Variable (1) Coefficient (2) Coefficient
Fraction turnpike �0.4896 (0.0142)* 5.8779 (0.7761)*
Fraction turnpike within the next 5 years 0.0407 (0.0276)(Fraction turnpike)* (year) �0.0033564 (0.0004)*
(Fraction turnpike within the next 5 years)* (year) 0.0000042 (0.00001)Year �0.002876 (0.0009)*
ln(real wage) 0.5521 (0.0210)* 0.1935 (0.0374)*
ln(real feed price) �0.2724 (0.0238)* 0.0605 (0.0400)Constant 1.2093 (0.0823)* 5.8497 (1.6268)*
City-pair dummies Yes YesYear dummies No YesR2 0.319 0.801City-pairs 130 130
Total observations 5071 5071
Notes. Dependent variable is the natural log of the real land carriage rate for city-pair i in year t.* Standard errors are in parentheses, * indicates statistical significance at the 95% level.
D. Bogart / Explorations in Economic History xxx (2005) xxx–xxx 17
ARTICLE IN PRESS
The results are also consistent with Gerhold�s (1996) argument that roadimprovements accounted for half of the reduction in carriage costs, while newhorse breeds and larger firms accounted for the other half. However, the findingthat turnpike trusts lowered freight charges by 20% is different from Gerhold�sestimate that better roads reduced carriage costs by 31%. This inconsistencycan be explained by the fact that Gerhold largely focused on the effects of turn-pike trusts along the London routes, while the present results are based on theireffects throughout the road network. The following section illustrates the differenteffects of turnpike trusts by focusing on their relationship with London transportservices.
6. Turnpike trusts and London transport services
The London transport market deserves special attention because it was the largestand most important transport market in the British economy. It is also possible thatturnpike trusts lowered freight charges by a greater amount along the London routesbecause they invested more and charged lower tolls. This hypothesis is evaluated inTable 4, which presents estimates from regression Eqs. (1) and (2), after including aninteraction between the fraction of turnpike mileage and a dummy variable for Lon-don city-pairs. In column (1), the results indicate that London city-pairs experienceda 76.5% (45.8 + 30.7) reduction in real land carriage rates after trusts were estab-lished. While this estimate provides suggestive evidence, it likely overstates the effectbecause the regression does not include year dummies and a time trend. Column (2)presents the estimates after including these controls. They imply that turnpike trustsaccounted for 24.1% of the reduction in real land carriage rates for London city-pairs by 1800 and 32.2% of the reduction by 1820. These findings provide evidence

Table 4Did turnpike trusts have a larger effect along the roads leading into London?
Variable (1) Coefficient (2) Coefficient
Fraction turnpike �0.4579 (0.0133)* 4.4440 (0.0793)*
(Fraction turnpike)* London dummy �0.3076 (0.0276)* 2.5556 (0.4324)*
(Fraction turnpike)* (year) �0.0025512 (0.0004)*
(Fraction turnpike)* (London dummy)* (year) �0.0014714 (0.0002)*
Year �0.0017917 (0.0009)*
ln(real wage) 0.5521 (0.0210)* 0.0873 (0.0400)*
ln(real feed price) �0.2582 (0.0235)* 0.0575 (0.0398)Constant 1.2227 (0.0814)* 4.19079 (1.6291)*
City-pair dummies Yes YesYear dummies No YesR2 0.329 0.812City-pairs 130 130
Total observations 5071 5071
Notes. Dependent variable is the natural log of the real land carriage rate for city-pair i in year t.* Standard errors are in parentheses, * indicates statistical significance at the 95% level.
18 D. Bogart / Explorations in Economic History xxx (2005) xxx–xxx
ARTICLE IN PRESS
that the effects of trusts varied and were likely to be largest along the heavily traveledroads, such as the London routes.37
Turnpike trusts may have also contributed to the substantial increase in passengertravel speeds between London and the provinces (see Fig. 2). While there are not en-ough observations to perform a regression analysis, the available data indicates thattravel times declined as the fraction of turnpike mileage increased. For example, in1705 when there were no turnpike trusts between Birmingham and London, the jour-ney time was 65 hours. By 1740, when turnpike trusts managed 62% of the route, thejourney time was cut to 40 hours and by 1770 when trusts managed the entire route,the journey time had fallen to 25 hours.38
Another way of measuring the effect of turnpike trusts is to see whether they pre-ceded the introduction of fly-machine services between London and various provin-cial cities. Recall that fly-machine services became widely diffused during the 1760sand that they were unique because they traveled a greater speed than standard coachservices. Table 5 lists all cities where fly-machine services were first identified in the1770 London directory, as well as the first year when trusts were established on atleast 80% of their route mileage. The table shows that in 64 out of the 71 cities, turn-pike trusts preceded the adoption of fly-machines. As a result, it appears that trustsmade an additional contribution by making it more economical for coaches to travelat their maximum speed.
37 The 24.1% figure comes from the calculation, 4.444 + 2.5556 � 1800 · (0.0014714 + 0.0025512) andthe 32.2%% figure comes from the calculation, 4.444 + 2.5556 � 1820 · (0.0014714 + 0.0025512). How-ever, the greater effect of turnpike trusts on London city-pairs is not significant, after assuming first orderautocorrelation in the errors using the Baltagi and Wu (1999) procedure. Therefore, the hypothesis thatturnpike trusts had a larger impact along the London routes is only partially supported by the evidence.38 For more discussion of the effects of trusts on passenger travel times see Pawson (1977).

Table 5Turnpike trusts and the diffusion of fly-machine services
Cities with fly-machineServices to Londonbeginning in 1770
First year whentrusts were establishedon at least 80% of theroute mileage
Cities with fly-machineServices to Londonbeginning in 1770
First year when trustswere established on atleast 80% of the routemileage
Maidenhead 1727 Peterborough 1754Oakingham 1759 Newport Pagnell 1728Reading 1736 Nottingham 1738Windsor 1759 Oxford 1719Sunninghill 1759 Burford 1751Swaffam 1725 Ipswich 1785Chester 1744 Falkenham 1785Stockport 1738 Shrewsbury 1748Blandford 1766 Ludlow 1751Derby 1738 Bath 1727Buxton 1738 Taunton 1753Chelmsford 1725 Wells 1753Harlow 1725 Wolverhampton 1727Stifford 1808 Walsall 1766Cheltenham 1751 Brighton 1770Tewkesbury 1756 Chichester 1749Portsmouth 1749 Horsham 1756Southampton 1758 Epsom 1755Winchester 1762 Godalming 1757Romsey 1764 Guildford 1749Ware 1725 Kingston 1718Deal 1802 Weybridge 1767Maidstone 1752 Witney 1751Margate 1802 Birmingham 1724Sittingbourne 1738 Marlborough 1728Asfhord 1793 Salisbury 1753Manchester 1738 Trowbridge 1728Warrington 1753 Devizes 1728Lincoln 1756 Hull 1765Sleaford 1756 Leeds 1739Stamford 1749 Wakefield 1739Barton Humber 1765 Sheffield 1765Bourne 1756 Tadcaster 1739Norwich 1769 Chestnut 1725Yarmouth 1769 Worcester 1731Northampton 1728
Total number of cities 71Number of cites whereturnpike trusts precededfly machine services
64
Source. Information on fly-machine services comes from the London Directory, The New and Complete
Guide.
D. Bogart / Explorations in Economic History xxx (2005) xxx–xxx 19
ARTICLE IN PRESS
The impact of turnpike trusts along the London routes has broader implicationsbecause London was the focal point for the English economy. It was by far the larg-est market for agricultural and manufactured goods. It was also the major port city

20 D. Bogart / Explorations in Economic History xxx (2005) xxx–xxx
ARTICLE IN PRESS
as well as the financial center. The fact that turnpike trusts increased the efficiency ofLondon transport services implies that they had an impact on the entire Englisheconomy. The following section quantifies their impact, by estimating the socialsavings.
7. The social savings from turnpike trusts
A number of scholars have estimated the social savings of railroads or canals, butnone have examined the effects of an institutional innovation like turnpike trusts.39
This study takes the first step by estimating the social savings from all road transportinnovations along turnpike roads in 1800 and 1820. Then it provides a lower boundfor the proportion of social savings associated with turnpike trusts.
A social savings calculation minimally requires data on ton-miles and passenger-miles as well as the change in freight charges, fares, and travel times.40 In this case,there is no direct information on passenger-miles and ton-miles and therefore, it isnecessary to develop new estimates.41 The output figures are based on an estimateof the total cost of freight and passenger services. According to Barker and Gerhold(1995), the tolls equaled between 10 and 15% of total costs for freight and passengerfirms in the 1820s. These figures imply that the total cost of transport services usingturnpike roads is equal to aggregate toll revenues divided by either 0.1 or 0.15. In1800, aggregate toll revenues in England and Wales were around £0.76 million,which would imply that the total cost of transport services along turnpike roadswas between £5.09 million and £7.64 million. A similar calculation suggests thatthe total cost was between £7.43 million and £11.14 million in 1820.42 These esti-mates are reasonable, because they imply that the total cost of road transport ser-vices equaled between 2.2 and 3.4% of national income in 1800 or 1820.43
If total costs are assumed to equal the total value of services, then ton-miles willequal the total cost of freight services divided by the average freight charge per-mile.Similarly, passenger-miles will equal the total cost of passenger services divided bythe average passenger fare per-mile.44 To perform these calculations we need an esti-mate of the relative value of freight and passenger services. The data from London
39 The social savings measures the amount of national income that would be lost had the transportinnovation not been developed. For the development of this methodology see the well-known studies byFogel (1964), Fishlow (1965), O�Brien (1983), and Hawke and Higgins (1983).40 Ideally, it would also include information on the elasticity of demand. However, in our case thisinformation is not available.41 Baxter (1866) has provided estimates of passenger miles and ton miles in 1834. However, these figuresare too late to properly evaluate the impact of road transport innovations because canals had claimed alarge portion of freight traffic by 1834.42 The figures on turnpike revenues and expenditure come from Bogart (Forthcoming).43 National income in 1800 is taken to be 229 million and 322 million in 1820 (Clark, 2001b).44 The average freight rate per ton-mile was £0.0855 in 1800 and £0.082 in 1820. The average passengerfare per-mile was taken to be £0.02015 in 1800 and £0.0165 in 1820. These figures come from the landcarriage rate and passenger fare data sets. See Appendix A for more information.

Table 6Estimates of the social savings from all road transport innovations: 1800 and 1820
1800 1820
Freight sector
(1) Ton miles along turnpike roads 29,785,575 45,284,553(2) Change in freight charges per mile £0.03839 £0.06289(3) Social savings from lower freight charges � (1) · (2) £1,143,000 £2,848,000
Passenger sector
(4) Passenger miles along turnpike roads 126,385,443 225,050,505(5) Change in fares per-mile £0.00163 £0.00134(6) Social savings from lower fares �(4) · (5) £206,000 £301,000(7) Change in passenger hours traveled 28,338,115 56,145,656(8) Income per hour for passengers £0.02972 £0.03863(9) Social savings from lower travel times � (7) · (8) £844,000 £2,169,000
(10) Total social savings = (3) + (6) + (9) £2,193,000 £5,318,000
Notes. See the text.
D. Bogart / Explorations in Economic History xxx (2005) xxx–xxx 21
ARTICLE IN PRESS
travel directories indicates that the ratio of passenger services to freight services was1.58 in 1800. In addition, the freight charge and fare data indicates that the typicalwagon loaded with four tons earned £0.342 per-mile in 1800, whereas a standardcoach with six passengers earned £0.12 per-mile. Therefore, after adjusting for thedifferent ratio of coaches and wagons, passenger services would represent 35% ofthe total value. However, this figure understates the value of passenger services be-cause coaches often traveled more than 50 miles, whereas wagons generally traveledshorter distances. Therefore, if it is assumed that coaches traveled twice as far aswagons, then passenger services would equal approximately 50% of the total value.Using the lower bound estimate for total costs in 1800 and 1820, this would implythat ton-miles were around 30 million in 1800 and 45 million in 1820, while passen-ger miles were 126 million in 1800 and 225 million in 1820.
Table 6 describes the social savings calculations using the new output estimates.Row (2) lists the change in freight charges for 1800 and 1820 based on the regressionestimates from Table 2. They assume that without any innovations, freight chargeswould not have declined by 31% along turnpike roads between 1750 and 1800 or43.4% between 1750 and 1820. Row (3) lists the social savings for freight servicesafter multiplying the change in freight charges by the number of ton-miles. The sav-ings amount to £1.14 million in 1800 and £2.85 million in 1820 or around 0.5% ofnational income in 1800 and 0.9% in 1820.
Turning to the passenger sector, row (5) lists the change in passenger fares afterassuming that they did not decline by 7.5% between 1750 and the 1790–1809 per-iod. Row (6) lists the social savings after multiplying the change in fares by thenumber of passenger miles. Not surprisingly, the savings were fairly low and
44 The average freight rate per ton-mile was £0.0855 in 1800 and £0.082 in 1820. The average passengerfare per-mile was taken to be £0.02015 in 1800 and £0.0165 in 1820. These figures come from the landcarriage rate and passenger fare data sets. See Appendix A for more information.

22 D. Bogart / Explorations in Economic History xxx (2005) xxx–xxx
ARTICLE IN PRESS
equaled only £0.2 million in 1800 and £0.3 million in 1820. Row (7) lists the changein passenger hours traveled if journey miles per hour remained at 2.6 rather thanincreasing to 6.2 in 1800 and 7.4 in 1820. Row (8) provides an estimate of thehourly income for the typical passenger by using Lindert and Williamson�s(1983) estimate of annual income for white collar workers and Voth�s (2001) esti-mate of annual hours for professionals.45 Row (9) lists the social savings from low-er travel times after multiplying the hours saved by the hourly wage. The savingsequaled £0.84 million in 1800 and £2.17 million in 1820, which amounts to 0.4 and0.7% of national income in 1800 and 1820. After combining these savings withthose arising from lower fares and freight charges, the total equals £2.19 millionin 1800 and £5.32 million in 1820, which represents approximately 1.0 and 1.7%of national income respectively.
It should be noted that the social savings estimates contain an upward bias be-cause they implicitly assume that the number of ton-miles and passenger mileswould be unchanged despite higher freight charges, fares, and travel times. Atthe same time, the estimates also contain a downward bias because they are basedon the lower bound estimate for ton-miles and passenger miles. If it is assumedthat the tolls represented 10% of total costs rather than 15%, then ton-miles wouldincrease to 45 million in 1800 and passenger miles would increase to 190 million.This would increase the total social savings to around 1.5% of national income in1800, rather than 1%. Therefore, it is possible that the downward bias in the out-put estimates offsets the upward bias resulting from the assumption of an inelasticdemand.
The magnitude of the social savings confirms that road transport innovations hadan important effect on economic growth. To put the figures into perspective, Antrasand Voth (2003) estimate that total factor productivity growth averaged 0.27% peryear in the English economy between 1770 and 1800. This would imply that a 1%social savings from road transport innovations accounted for around one eighthof all productivity growth between 1770 and 1800.46
How much did turnpike trusts contribute to the total social savings? In the case ofthe freight sector, the contribution of trusts can be measured by their effect on freightcharges. Recall that the estimates in Table 2 indicate that turnpike trusts loweredfreight charges by 16.8% as of 1800 and 23.5% by 1820. This would imply that trustsgenerated a savings on freight equal to £0.62 million in 1800 and £1.54 million in1820, or 0.3 and 0.5% of national income in the respective years.
These figures represent a lower bound estimate of the social savings from turnpiketrusts because they do not include their effects on the passenger sector. While there is
45 Nominal annual income was assumed to be £100 in 1800 and £130 in 1820. The Lindert andWilliamson series reveals that the distribution of white collar incomes was substantially skewed. Therefore,I used 2/3 of the average income in 1805 and 1819. To arrive at an estimate of the hourly wage, thesefigures were divided by 3365, which is Voth�s (2001) estimate of the annual hours for professionals in 1800.46 Over 30 years, an average annual TFP growth rate of 0.27% would generate a social savings of[(1.0027)30 � 1] or 8.4%. Therefore, roads innovations would account for 1%/8.4% or around one eight ofall productivity growth.

D. Bogart / Explorations in Economic History xxx (2005) xxx–xxx 23
ARTICLE IN PRESS
not enough data to identify the specific contribution of turnpike trusts versus otherinnovations, it is plausible that they contributed to half of the reduction in passengerfares and travel times. This would raise the total contribution of turnpike trusts toaround 0.5% of national income in 1800 and 0.9% in 1820. However, even these fig-ures understate the impact of turnpike trusts because they omit the effect of lowertransport costs on market integration and the adoption of new technologies.47
Therefore, after including these broader effects, along with the gains in the passengersector, it is possible that turnpike trusts generated a social saving equal to 1% of na-tional income in 1800 or 1820.
8. Conclusion
The rise of turnpike trusts transformed the organization and financing of roadinfrastructure in 18th century England. In total, nearly 1000 turnpike trusts wereestablished along 20,000 miles of road, resulting in one of the most expansive tollroad networks in history. At the same time, the road transport sector experienceda number of revolutionary changes, including a 40% reduction in freight chargesand a 60% reduction in passenger travel times.
This paper reassesses the link between turnpike trusts and the transport revolu-tion by using a number of new data sets. It shows that turnpike trusts did not raisefreight charges by levying tolls, and that trusts were not induced by other innova-tions that lowered transport costs. Instead, it demonstrates that turnpike trusts con-tributed to a 20% reduction in freight charges. In addition, it provides evidence thatturnpike trusts had their greatest impact on London transport services, which werethe largest and most important in the British economy. Finally, it shows that turn-pike trusts generated a social savings of at least 0.5% of national income in 1800 and1820.
These findings have implications for the general debate about the causes of thetransport revolution. The key conclusion is that institutional innovations were oneof the factors that contributed to lower transport costs and improvements in thequality of services. In this particular case, turnpike trusts were able to generategreater efficiency because they addressed a variety of issues in the parish system,including fiscal constraints and coordination problems. The turnpike system wasalso successful because the tolls failed to offset the effects of road improvements.The tolls were low because Parliament imposed maximum schedules and becausetrustees had an incentive to keep the tolls low, given that they were local propertyowners.
The turnpike trust system also illustrates how institutional changes were linkedwith the process of economic development during the 18th and 19th centuries.Ever since the work of North (1991), economic historians have debated whetherinstitutional changes cause economic development or whether they are simply a
47 For a detailed discussion of these effects see Szostak (1991).
24 D. Bogart / Explorations in Economic History xxx (2005) xxx–xxx
ARTICLE IN PRESS
consequence of it. Turnpike trusts clearly responded to the expanding economy bysatisfying existing or potential demand for road transport services. However, theyalso created demand for such services by lowering freight charges and travel times.As a result, they made an independent contribution to the process ofdevelopment.
Acknowledgments
I thank Jean-Laurent Rosenthal, Naomi Lamoreaux, Ken Sokoloff, Dan Treis-man, Gary Richardson, John Majewski, Gregory Clark, Charlie Lave, Ken Small,and John Wallis for helpful comments on earlier drafts of this paper. I also thankXiahua Wei for providing valuable research assistance. Finally, I acknowledge thefinancial support of the National Science Foundation (SES-0136749), the Institutefor Humane Studies, and the all-UC group in Economic History.
Appendix A. Data sources
Information on land carriage rates are drawn from Quarter Session OrderBooks and the Returns submitted to the clerks of the peace in Middlesex. The Re-turns are held at the London Metropolitan Archives (MR/WC/1-970), while Quar-ter Sessions Order Books are available on microfilm in the Family History Libraryin Salt Lake City. The references are York (#2045901-5, #2045938-9), West Ridingof Yorkshire (#1657872-4, #1657913-5), North Riding of Yorkshire (#469697-99,#547724-27), Newcastle (#1886204-05), Hull (#1894997-98), Leicestershire(#1470041-42), and Cheshire (#1502213-28). Additional information was drawnfrom Order Books in the Northamptonshire Record Office and the Shropshire Re-cord offices as well as the studies by Freeman (1977) and Albert (1972). The firsttable lists all city-pairs, including the first and last years when land carriage ratesare observed. The second table lists average land carriage in shillings per ton-mile,along with the standard deviation and the number of unique observations. I aver-aged over unique observations in order to avoid biases from city-pairs with moreobservations.

The land carriage rate data set
City one City two First year Last year City one City two First year Last year
Askrigg York 1719 1825 Manchester Newcastle 1800 1821Beverley York 1697 1825 Berwick Newcastle 1802 1821Barnsley York 1814 1825 Alnwick Newcastle 1802 1821Bradford York 1697 1825 Morpeth Newcastle 1802 1821Bedale York 1697 1825 Durham Newcastle 1802 1821Bridlington York 1730 1825 Darlington Newcastle 1802 1821Carlisle York 1814 1815 Barnard Newcastle 1821 1821Coln York 1757 1825 London Richmond 1695 1820Driffield York 1814 1825 London Leeds 1695 1821Durham York 1719 1825 London Boroughbridge 1695 1820Doncaster York 1719 1825 London Settle 1731 1805Darlington York 1810 1825 York Wakefield 1695 1820Easingwold York 1814 1825 Newcastle Pontefract 1763 1820Gainsbrough York 1757 1825 Sheffield Wakefield 1763 1820Halifax York 1697 1825 Skipton Leeds 1773 1820Hull York 1697 1825 Skipton Tadcaster 1773 1820Huddersfield York 1757 1825 Leeds Sheffield 1773 1820Howden York 1757 1825 Sheffield Pontefract 1773 1820Helmsley York 1757 1825 Leeds Selby 1695 1799Kendal York 1757 1825 Selby Leeds 1695 1799Keighley York 1814 1825 Wakefield Tunbridge 1695 1799Knaresborough York 1757 1825 Tunbridge Wakefield 1695 1799Lancaster York 1814 1825 York Hull 1707 1795London York 1697 1825 Scarborough Hull 1717 1795Leeds York 1697 1825 Leeds Hull 1725 1795Middleham York 1697 1825 Wakefield Hull 1725 1795Masham York 1757 1825 London Hull 1749 1795Nottingham York 1765 1825 Lincoln Hull 1749 1795Newcastle York 1705 1825 Beverley Hull 1795 1795North Allerton York 1810 1825 Brigg Hull 1795 1795Otley York 1757 1825 Bridlington Hull 1795 1795Pontefract York 1785 1825 North Cave Hull 1795 1795Pocklington York 1814 1825 Hedon Hull 1795 1795
(continued on next page)
D.Bogart
/Exploratio
nsin
Economic
Histo
ryxxx(2005)xxx–xxx
25
ARTICLE
INPRESS

Appendix Table (continued)
City one City two First year Last year City one City two First year Last year
Pickerington York 1814 1825 Hornsea Hull 1795 1795Rochdale York 1814 1825 Louth Hull 1795 1795Rotherham York 1815 1825 Patrington Hull 1795 1795Ripon York 1697 1825 Weighton Hull 1795 1795Richmond York 1697 1825 Welton Hull 1795 1795Snaith York 1814 1825 London Boston 1749 1780Selby York 1815 1825 London Horncastle 1752 1823Sheffield York 1787 1825 London Lincoln 1764 1825Stockton York 1814 1825 London Louth 1751 1827Skipton York 1697 1825 London Spalding 1749 1826Scarborough York 1719 1825 Boston Spilsby 1752 1821Stamford York 1795 1813 Barton Lincoln 1765 1821Stokesley York 1757 1825 Horncastle Spilsby 1795 1821Tadcaster York 1814 1825 Boston Alford 1751 1821Thorne York 1814 1825 Horncastle Alford 1795 1821Thirsk York 1757 1825 Boston Louth 1763 1821Wakefield York 1697 1825 Lincoln Horncastle 1752 1821Weighton York 1803 1825 Chester London 1695 1814Wetherby York 1814 1825 Shrewsbury London 1695 1794Whitby York 1719 1825 Leicester London 1695 1824Yarm York 1719 1825 Harborough London 1695 1824London Newcastle 1744 1826 Lutterworth London 1695 1824Doncaster Newcastle 1766 1821 Hinckley London 1695 1824York Newcastle 1755 1821 Ashby London 1695 1824Pontefract Newcastle 1768 1821 Melton London 1695 1824Leeds Newcastle 1758 1821 Northampton London 1710 1781Ripon Newcastle 1774 1821 Wellingborough London 1754 1781Hexham Newcastle 1772 1821 Daventry London 1754 1781Carlisle Newcastle 1772 1821 Tiverton London 1758 1782Dorchester London 1750 1786 Bridgport London 1758 1786
Portsmouth London 1718 1786
26D.Bogart
/Exploratio
nsin
Economic
Histo
ryxxx(2005)xxx–xxx
ARTICLE
INPRESS

Average land carriage rates per-mile, 1700–1825
Decade Average land carriagerates in shillings per-tonper mile current prices
Standarddeviation
Number ofobservations
Consumer price index,1700–1709 = 1, fromClark (2001a,b)
Real land carriage rateindex (1700–1709 = 1)
1700–1709 1.22 0.37 52 1 11710–1719 1.23 0.32 32 1.04 0.971720–1729 1.23 0.31 34 1.04 0.971730–1739 1.25 0.25 45 0.95 1.081740–1749 1.26 0.30 58 0.95 1.091750–1759 1.24 0.31 97 1.06 0.961760–1769 1.16 0.27 92 1.13 0.841770–1779 1.13 0.25 97 1.30 0.711780–1789 1.14 0.25 95 1.30 0.721790–1799 1.20 0.28 121 1.53 0.641800–1809 1.46 0.34 157 2.08 0.581810–1819 1.66 0.40 206 2.26 0.601820–1827 1.74 0.45 109 1.69 0.84
Notes. The average is un-weighted across city-pairs. It also includes only one observation for each city-pair per decade, unless land carriage rates changed, inwhich each unique observation is included.
D.Bogart
/Exploratio
nsin
Economic
Histo
ryxxx(2005)xxx–xxx
27
ARTICLE
INPRESS

28 D. Bogart / Explorations in Economic History xxx (2005) xxx–xxx
ARTICLE IN PRESS
For the regressions, the wage data come from Greg Clark�s farm laborer wage series (2001). Horse feedprices come from Quarter sessions records for Hull and from secondary sources, such as Thirsk (1985),
Hill (1966), and Rogers (1963). Feed prices are assumed to be equal to an average of oat prices and beanprices. The general procedure was to match city-pairs with wage and feed prices from one of four regions:the Southeast, the Southwest, the Midlands, and the North. All city-pairs that included London werematched with the input price series from the Southeast, regardless of the final destination.The information on average passenger travel times and fares comes from Jackman (1916), Pawson(1977), and Gerhold (1996). Additional information on fares comes from the 1760 and 1770 London traveldirectory, A New and Complete Guide to all persons who have any trade or Concern with the City of London.The third table provides summary statistics on average journey miles per-hour, while the fourth table pro-vides summary statistics on average passenger fares.
Average journey miles per-hour in the passenger sector, 1750–1830
Decade
Average journey milesper-hour (journey distance/total journey time)Standarddeviation
Number ofobservations
1750–1759
2.61 1.12 20 1760–1769 3.06 1.01 20 1770–1779 4.69 1.19 41 1780–1789 5.36 1.66 51 1790–1799 6.26 1.96 28 1800–1809 5.05 0.56 3 1810–1819 6.85 2.42 21 1820–1829 7.96 1.55 41Sources. Jackman (1916) and Pawson (1977). Notes: Average journey miles per-hour are equal to the totaldistance traveled divided by the total journey time.
Average passenger fares per-mile, 1750–1799
Decade
Average passengerfare per-milein shillingsStandarddeviation
Number ofobservations
Consumer price index,1750–1759 = 1, fromClark (2001a,b)
Real passengerfare index(1750–1759 = 1)
1750–1759
0.216 0.06 14 1.00 1.00 1760–1769 0.216 0.06 215 1.06 0.94 1770–1779 0.223 0.08 418 1.22 0.85 1780–1789 0.265 0.08 140 1.22 1.00 1790–1799 0.278 0.11 37 1.44 0.89 1800–1809 0.403 0.11 13 1.95 0.96 1810–1819 0.327 0.09 15 2.21 0.71 1820–1830 0.337 0.06 8 1.59 0.98Sources. Most of the observations for the 1760s and 1770s come from the London directory, the New and
Complete Guide to all persons who have any trade or Concern with the City of London, (1760) and (1770). Allother observations come from Jackman (1916) and Gerhold (1996). The consumer price index comes fromClark (2001a,b). Notes. The averages are un-weighted across city-pairs.
The information on freight and passenger services comes from a series of London directories including,The Merchant and Trader�s Necessary Companion (1715), The New and Complete Guide (1740, 1749, 1760,1770), and The Shopkeeper�s and Tradesman�s Assistant (1779, 1790, and 1800). All of these directories areavailable in the microfilm series, the 18th Century.
The information on toll schedules comes from the series, Acts of Parliament, available in the Clark Li-brary in Los Angeles and Local and Personal Acts, which is available in the University of Minnesota, LawLibrary.

D. Bogart / Explorations in Economic History xxx (2005) xxx–xxx 29
ARTICLE IN PRESS
References
Albert, W., 1972. The Turnpike Road System in England 1663–1840. Cambridge University Press,Cambridge.
Antras, P., Voth, H.-J., 2003. Factor prices and productivity growth during the British industrialrevolution. Explorations in Economic History, 38.
Baltagi, B., Wu, P., 1999. Unequally spaced panel data regressions with AR(1). Disturbances.Econometric Theory 15, 814–823.
Barker, T., Gerhold, D., 1995. The Rise and Rise of Road Transport 1700–1990. Cambridge UniversityPress, Cambridge.
Baxter, R.D., 1866. Railway extension and its results. Journal of the Statistical Society of London 29, 549–595.
Berg, T., Berg, P., 2001. R. Angerstein�s Illustrated Travel Diary 1753–1755. The Science Museum.Bogart, D., Forthcoming. Did turnpike trusts increase transportation investment in eighteenth century
england? Journal of Economic History.Bowen, E., 1970. Britannia Depicta. Frank Graham, Newcastle.Chartres, J., 1977. Road carrying in England in seventeenth century: myth and reality. Economic History
Review 15, 73–94.Chartres, J., Turnbull, G., 1983. Road transport. In: Aldcroft, D., Michael, F. (Eds.), Transport in the
Industrial Revolution. Manchester University Press, Manchester.Clark, G., 2001a. Farm wages and living standards in the industrial revolution: England, 1670–1869.
Economic History Review 3, 477–505.Clark, G., 2001b. Debt, deficits, and crowding-out: England, 1727–1840. European Review of Economic
History 5, 403–436.Corfield, P., 1982. The Impact of English Towns, 1700–1800. Oxford University Press, Oxford.Crafts, N.F.R., 1985. British Economic Growth during the Industrial Revolution. Clarendon Press,
Oxford.Estevadeordal, A., Frantz, B., Taylor, A.M., 2003. The rise and fall of world trade, 1870–1939. The
Quarterly Journal of Economics 118, 359–407.Fishlow, A., 1965. American Railroads and the Transformation of the Ante-Bellum Economy. Harvard
University Press, Cambridge.Fogel, R., 1964. Railroads and American Economic Growth: Essays in Econometric History. John
Hopkins University Press, Baltimore.Freeman, M.J., 1977. The carrier system of south hampshire, 1775–1851. The Journal of Transport
History 4, 61–85.Gerhold, D., 1988. The growth of the London carrying trade, 1681–1838. Economic History Review 41,
392–410.Gerhold, D., 1993. Road Transport before the Railways: Russell�s London Flying Waggons. Cambridge
University Press, Cambridge.Gerhold, D., 1996. Productivity change in road transport before and after turnpiking, 1690–1840.
Economic History Review 49, 491–515.Ginarlis, J., Pollard, S., 1988. Roads and waterways: 1750–1850. In: Feinstein, C., Pollard, S. (Eds.),
Studies in Capital Formation in the United Kingdom. Oxford University Press, Oxford.Great Britain, House of Commons, 1841. Report of the commisioners for inquiry into the state of the
roads in England and Wales. Sessional Papers, vol. XXVII.Great Britain, House of Lords, 1834. The minutes of evidence before the committee on turnpike road
trusts. Sessional Papers, vol. X.Harley, K., 1988. Ocean freight rates and productivity, 1740–1913: the primacy of mechanical invention
reaffirmed. Journal of Economic History 42, 797–823.Hawke, G., Higgins, J., 1983. Britain. In: O�Brien, P. (Ed.), Railways and the Economic Development of
Western Europe, 1830–1914. St. Anthony�s, London.Hill, F., 1966. Georgian Lincoln. Cambridge University Press, Cambridge.Humphery-Smith, 1984. The Phillimore Atlas and Index of Parish Registers. Phillimore, Chichester.

30 D. Bogart / Explorations in Economic History xxx (2005) xxx–xxx
ARTICLE IN PRESS
Jackman, W.T., 1916. The Development of Transportation in Modern England. Cambridge UniversityPress, Cambridge.
Kaukiainen, Y., 2001. Shrinking the world: improvements in the speed of information transmission.European Review of Economic History 5, 1–29.
Lindert, P., Williamson, J., 1983. English workers living standards during the industrial revolution: a newlook. The Economic History Review 36, 1983.
Menard, R., 1991. Transport costs and long-range trade: was there a European transport revolution in theearly modern era?. In: Tracy, J.D. (Ed.), The Political Economy of Merchant Empires. CambridgeUniversity Press, Cambridge.
Mogg, E., 1826. Paterson�s Roads. A.&R. Spottiswoode, London.Mohammed, S.I.S., Williamson, J., 2004. Freight rates and productivity gains in British tramp shipping
1869–1950. Explorations in Economic History 41, 172–203.North, D., 1968. Sources of productivity change in ocean shipping, 1600–1850. Journal of Political
Economy 76, 953–970.North, D., 1991. Institutions, Institutional Change, and Economic Performance. Cambridge University
Press, Cambridge.O�Brien, P., 1983. Railways and the Economic Development of Western Europe, 1830–1914. St.
Anthony�s, London.O�Rourke, K., Williamson, J., 1999. Globalization and History. MIT Press, Cambridge.Pawson, E., 1977. Transport and Economy: the Turnpike Roads of Eighteenth Century Britain. Academic
Press, New York.Rogers, J.T., 1963. A History of Agriculture and Prices in England. Clarendon Press, Oxford.Shepherd, J., Walton, G., 1972. Shipping, Maritime Trade, and the Economic Development of Colonial
North America. Cambridge University Press, Cambridge.Smith, A., 1976. An Inquiry into the Nature and Causes of the Wealth of Nations. Oxford University
Press, Oxford.Straus, R., 1912. Carriages and Coaches, Their History and Their Evolution. Martin Secker, London.Szostak, R., 1991. The Role of Transportation in the Industrial Revolution. McGill, Montreal.Thirsk, J., 1985. The Agrarian History of England and Wales, vol. 6. Cambridge University Press,
London.Turnbull, G., 1985. State regulation in the eighteenth century English economy: another look at carriers�
rates. Journal of Transport History 6, 18–36.Voth, H.J., 2001. The longest years: new estimates of labor input in Britain, 1760–1830. Journal of
Economic History, 61.Willan, T.S., 1962. The justices of the peace and the rates of land carriage, 1692. Journal of Transport
History 5, 197–204.