Turning Commissioning Inside Out · 22/04/2013 · Presentation Description Are you disappointed...
220
State of Utah DFCM, Architectural Testing, Inc. Turning Commissioning Inside Out 21 st National Conference on Building Commissioning Architectural Testing Inc.
Transcript of Turning Commissioning Inside Out · 22/04/2013 · Presentation Description Are you disappointed...

State of Utah DFCM, Architectural Testing, Inc.
Turning Commissioning Inside Out
21st National Conference on Building Commissioning
Architectural Testing Inc.

AIA Quality Assurance
The Building Commissioning Association is a Registered Provider with The American Institute of Architects Continuing Education Systems (AIA/CES). Credit(s) earned on completion of this program will be reported to AIA/CES for AIA members. Certificates of Completion for both AIA members and non-AIA members are available upon request.
This program is registered with AIA/CES for continuing professional education. As such, it does not include content that may be deemed or construed to be an approval or endorsement by the AIA of any material of construction or any method or manner of handling, using, distributing, or dealing in any material or product.
Questions related to specific materials, methods, and services will be addressed at the conclusion of this presentation.
21st NCBC Conference

Presentation Description
Are you disappointed by or unsure of the energy performance of your new building? The Utah Division of Facilities Construction and Management (DFCM) was, so they challenged local and national commissioning firms to collect information on better ways to achieve and verify the performance of buildings. Hear and see how DFCM had to change the way they did project planning, procured commissioning agents, and educated their architects and contractors in order to achieve the high performance promised.
21st NCBC Conference
At the end of this session, participants will be able to:
1. Understand why / how buildings fail to meet end user expectations. 2. Discuss the disconnect between MEP and Building Envelope professionals
and what this disconnect is costing.3. Review the value of value-based selections.4. Describe the process for an integrated commissioning effort that is truly
whole building Cx.5. Discuss ways to provide the best value commissioning on different sized
projects.6. Learn ways to measure building performance and determine success.7. Understand the future challenges in continuing to raise the performance
bar, provide better value, educate designers and builders, and refine standards.
Learning Objectives
21st NCBC Conference
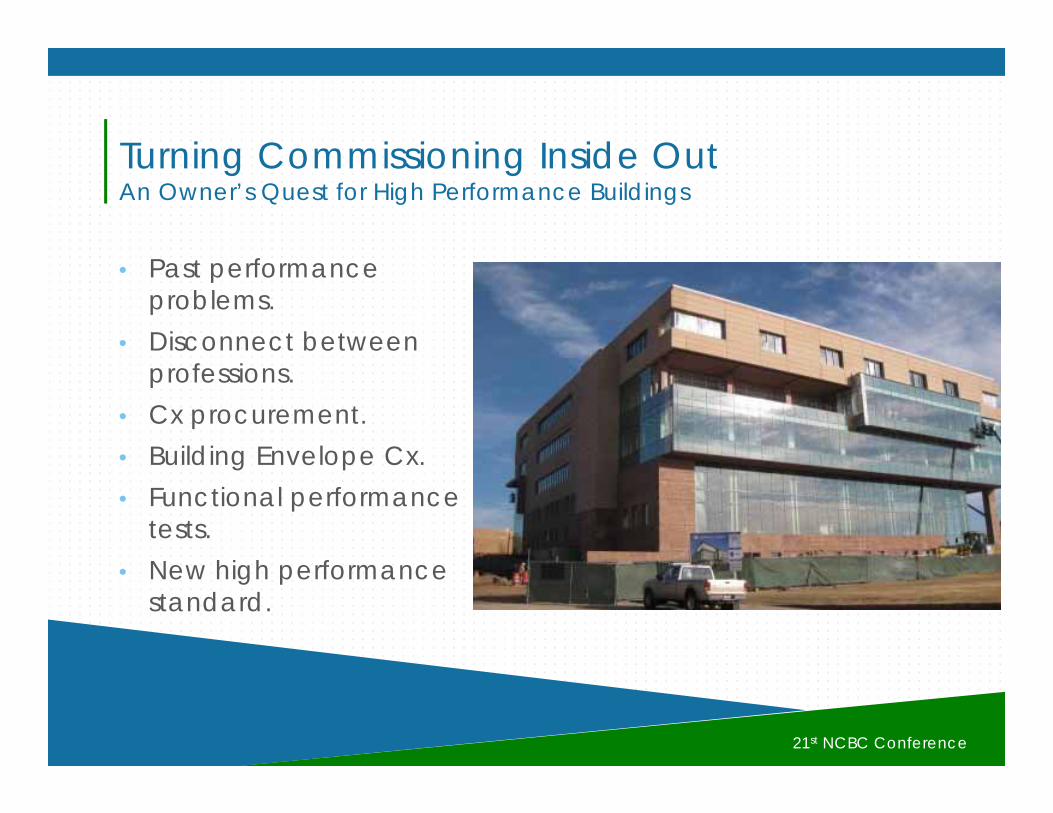
• Past performance problems.
• Disconnect between professions.
• Cx procurement.• Building Envelope Cx.• Functional performance
tests.• New high performance
standard.
21st NCBC Conference
Turning Commissioning Inside Out An Owner’s Quest for High Performance Buildings

© Retro-Specs Consultants


New Technologies
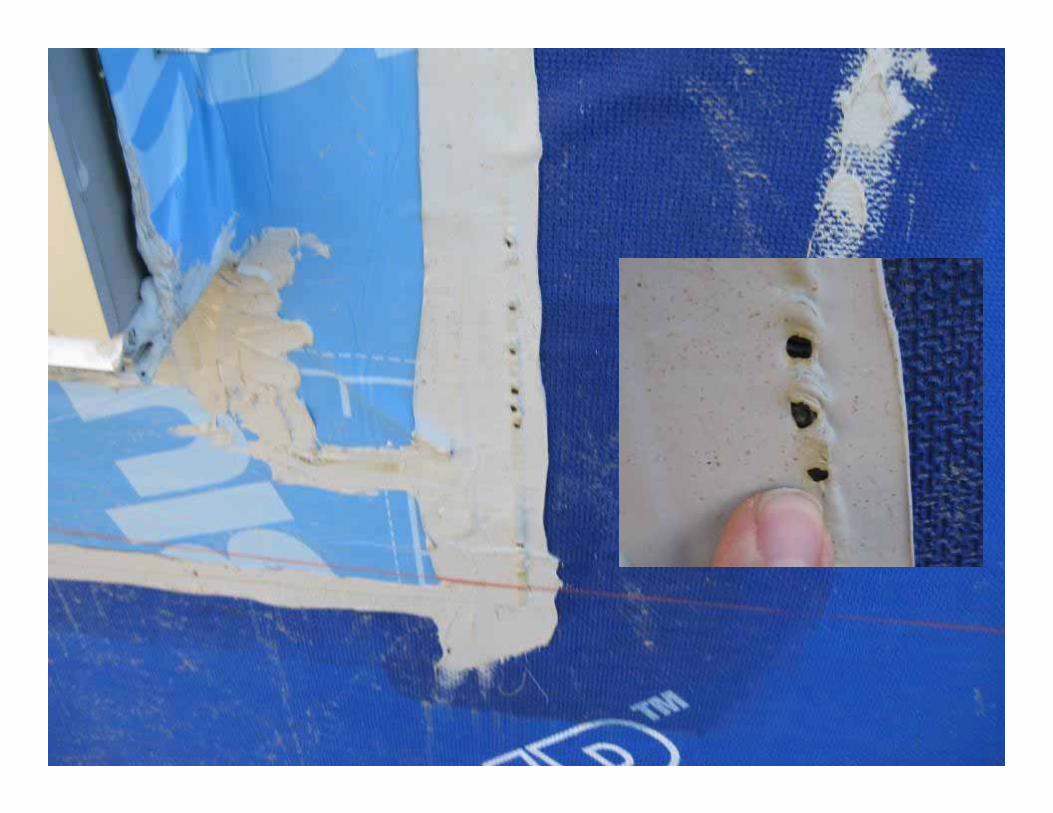
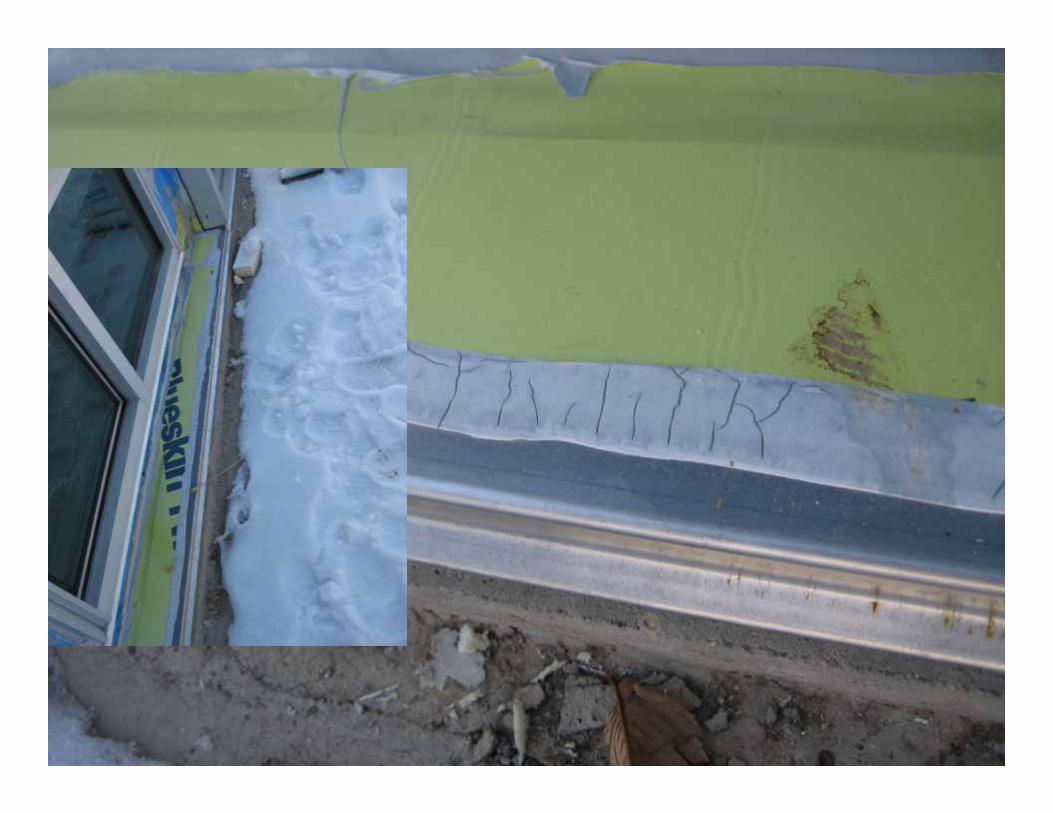

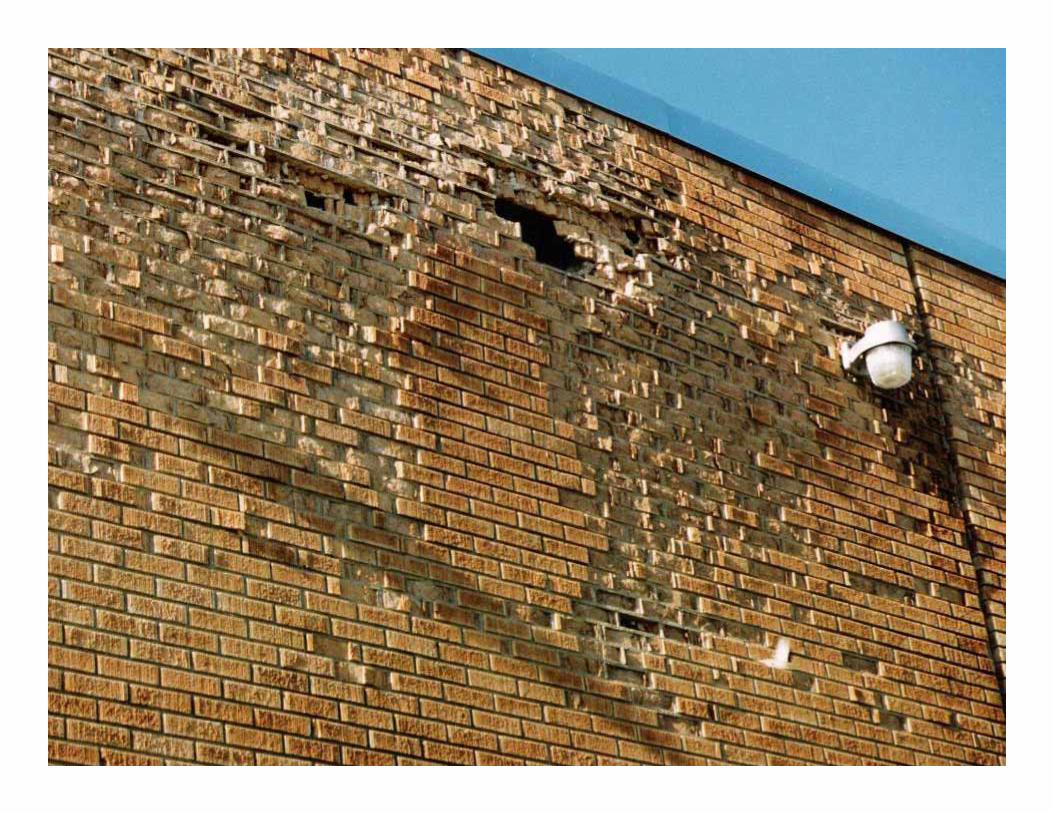
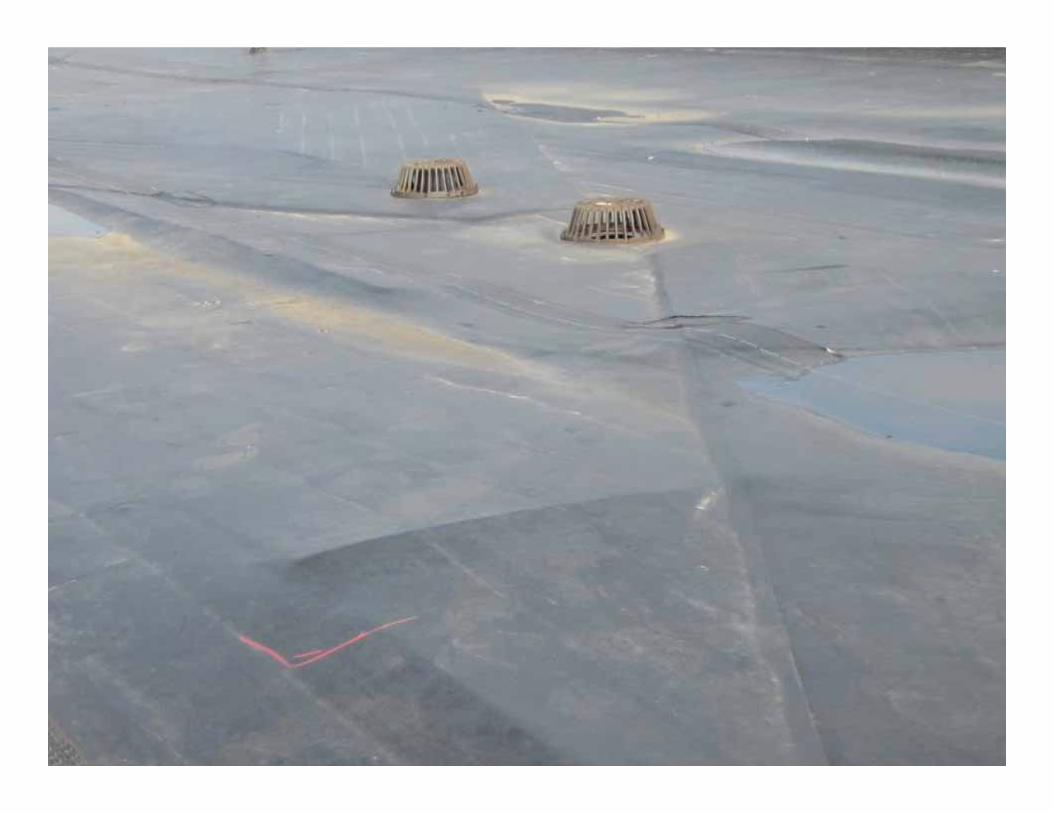
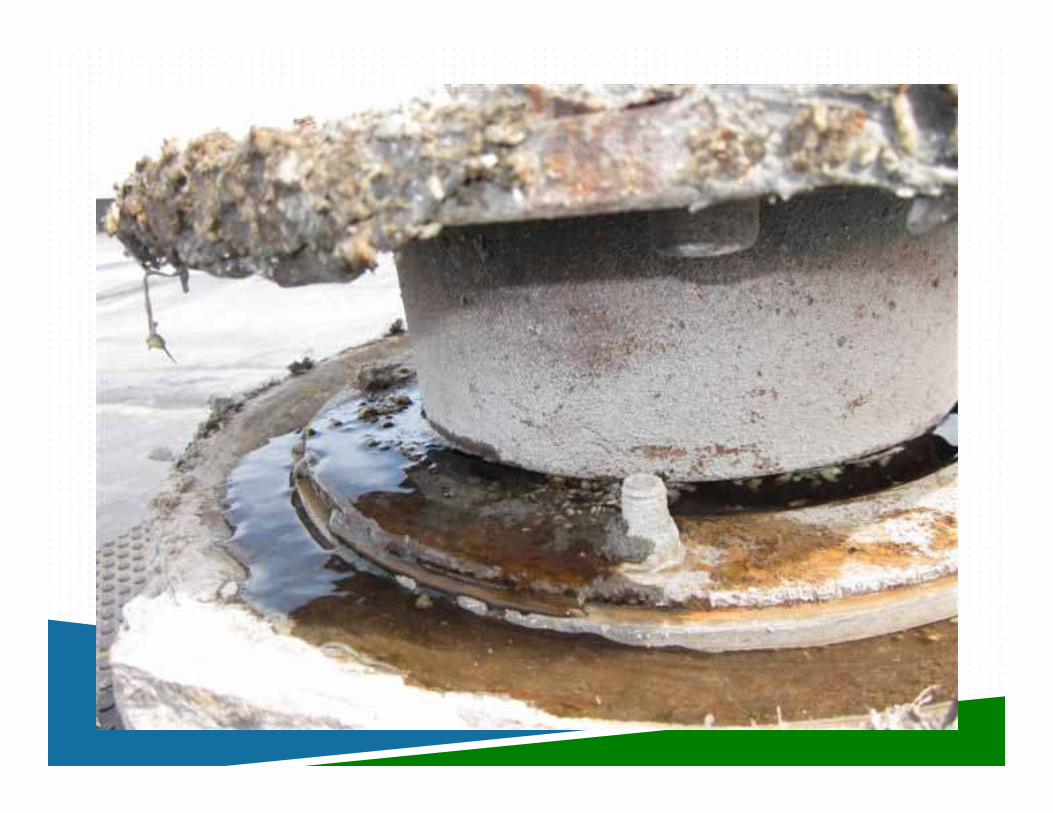
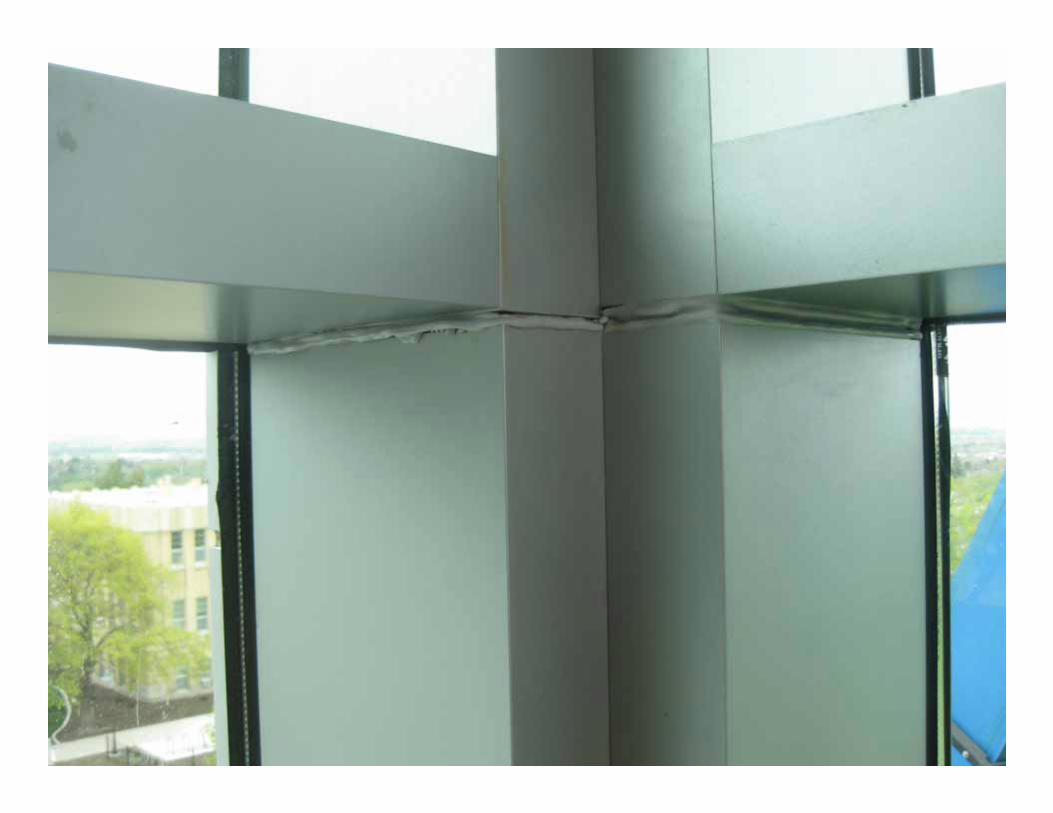
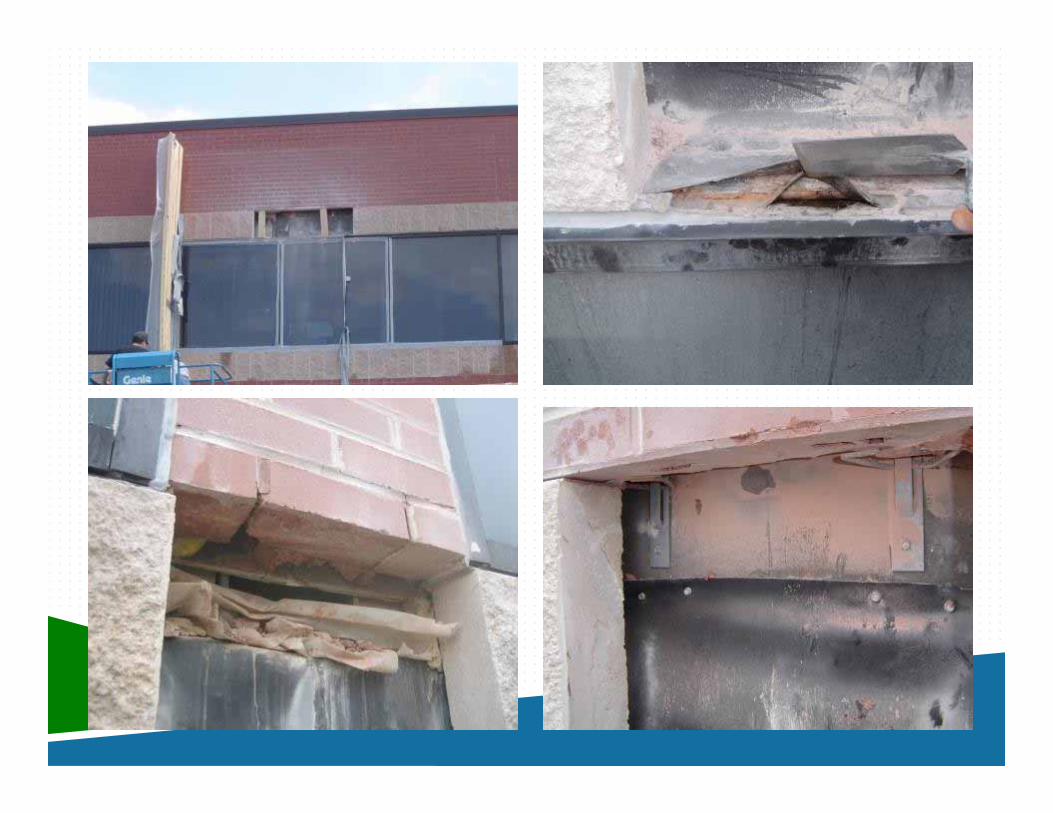
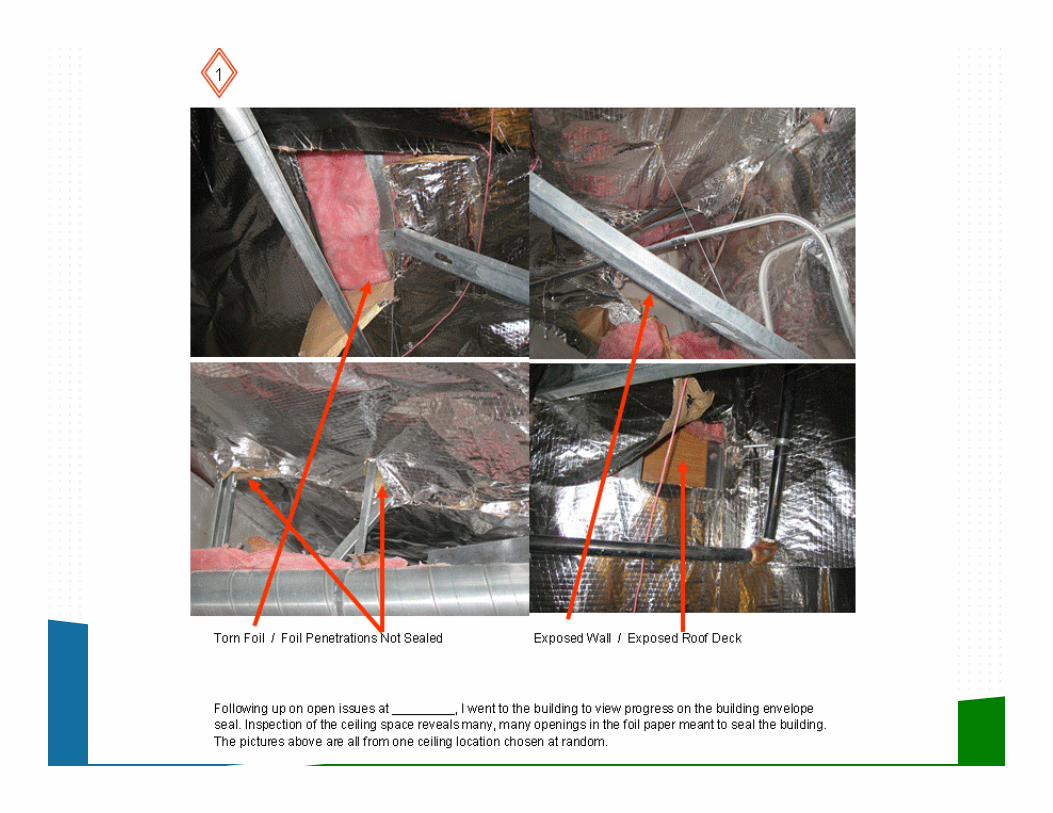
HVAC OR BUILDING ENVELOPE? Air intake, but interior room forms the duct. Floor is waterproofed with roofing membrane. Room hemorrhages air.
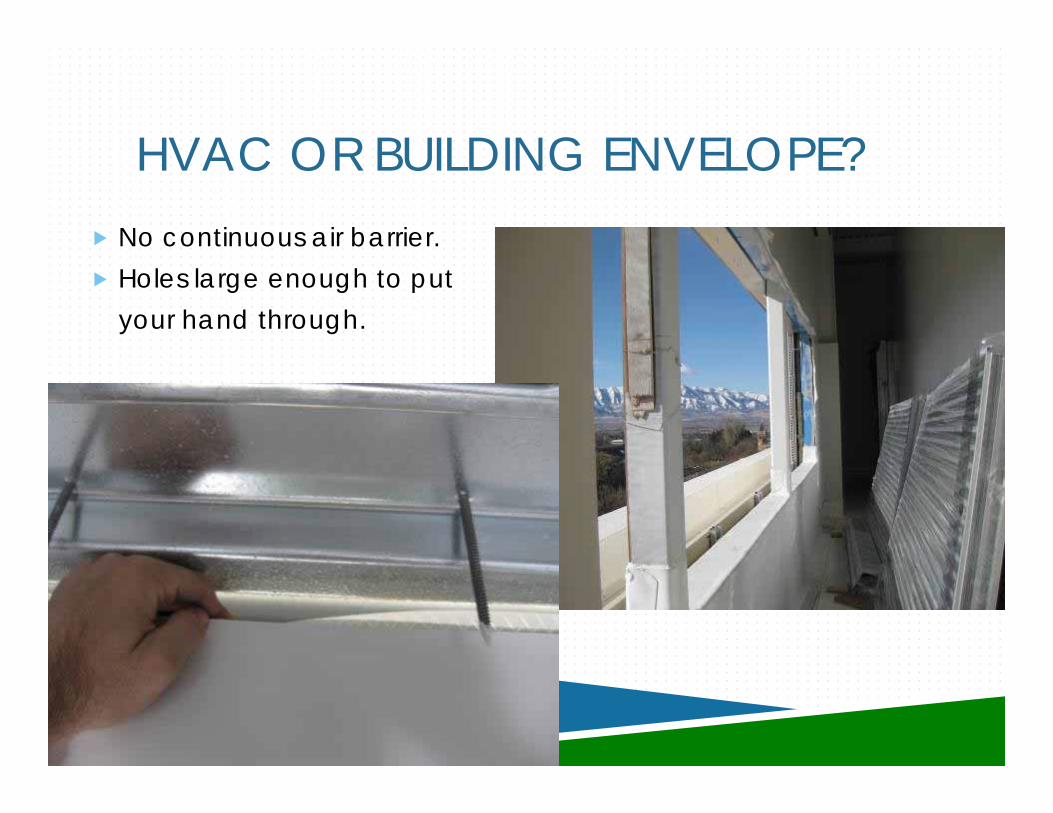
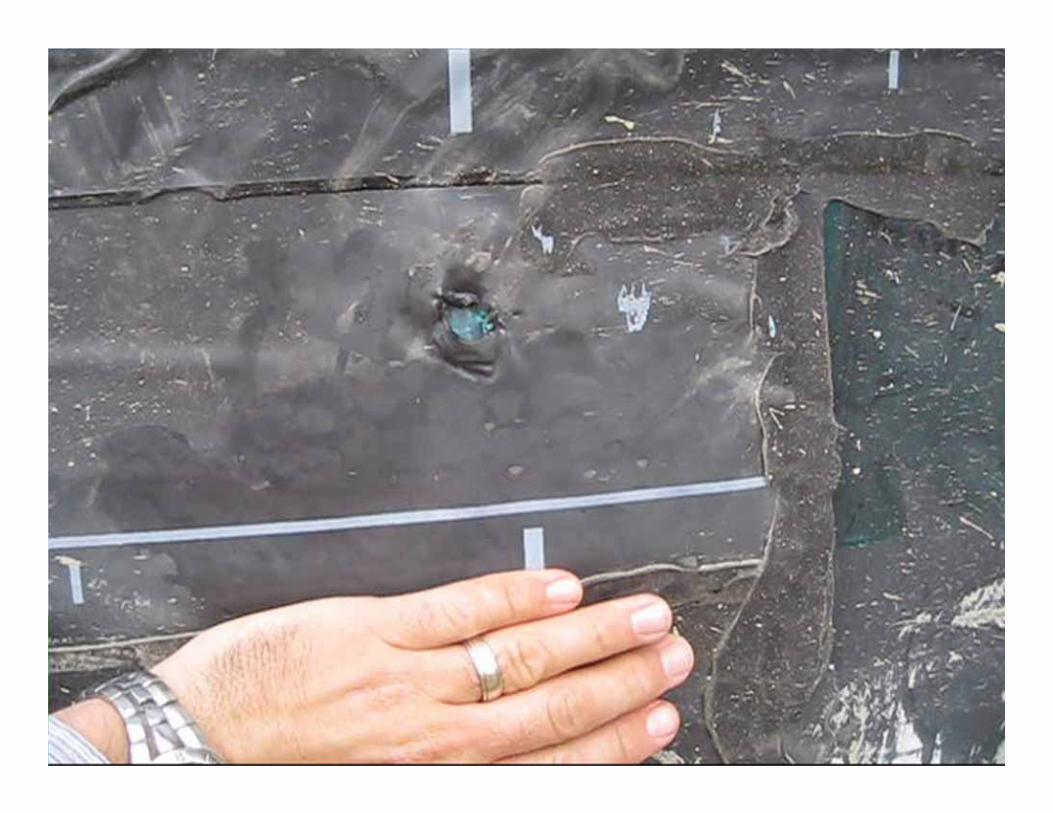
No continuous air barrier. Holes large enough to put
your hand through.
HVAC OR BUILDING ENVELOPE?


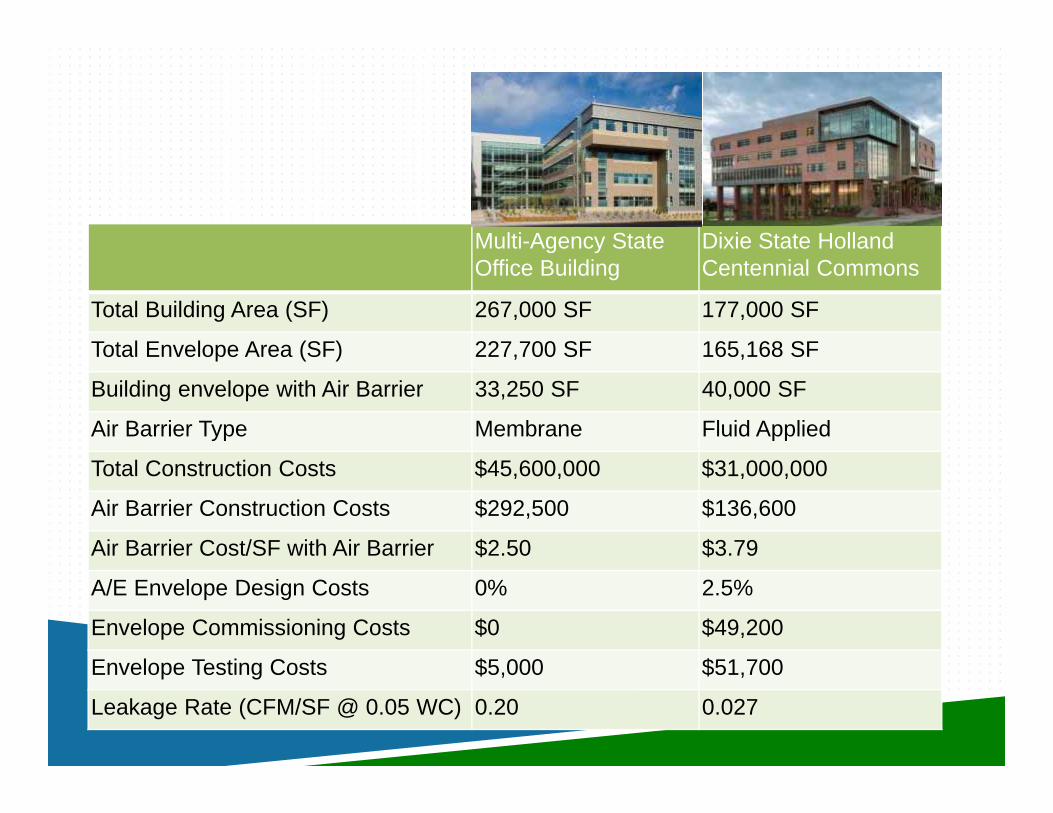
Multi-Agency State Office Building
Dixie State Holland Centennial Commons
Total Building Area (SF) 267,000 SF 177,000 SF
Total Envelope Area (SF) 227,700 SF 165,168 SF
Building envelope with Air Barrier 33,250 SF 40,000 SF
Air Barrier Type Membrane Fluid Applied
Total Construction Costs $45,600,000 $31,000,000
Air Barrier Construction Costs $292,500 $136,600
Air Barrier Cost/SF with Air Barrier $2.50 $3.79
A/E Envelope Design Costs 0% 2.5%
Envelope Commissioning Costs $0 $49,200
Envelope Testing Costs $5,000 $51,700
Leakage Rate (CFM/SF @ 0.05 WC) 0.20 0.027
DFCM VALUE BASED SELECTION
An innovative solution that really works

TWO-AND-A-HALF MILLENNIA OF SELECTING AES& CONTRACTORS
Master builders prepared designs, documented the work requirements, and extended invitations for bids.
The lowest bidders (covered by a financial backer) for each part of the work, were awarded their part and placed under contract.
Detailed project costs were recorded, there were penalties for noncompliance, and processes for resolving claims.
In other words: there were bid documents, a procurement method was used, bonds were required, liquidated damages were set and assessed, and there were lawsuits

DOES IT WORK ANY BETTER TODAY?

THE STATE OF UTAH NEEDED A NEW AE/CONTRACTOR
SELECTION PROCESS –EXISTING PROCUREMENT PROCEDURES DID NOT CONSISTENTLY ACHIEVE
OUR GOALS!
Minimize project risks prior to construction.

VALUE BASED SELECTION (VBS)
SELECTION COMMITTEE
PAST PERFORMANCE
SCHEDULE
STRENGTH OF TEAM
MANAGEMENT PLAN
COST
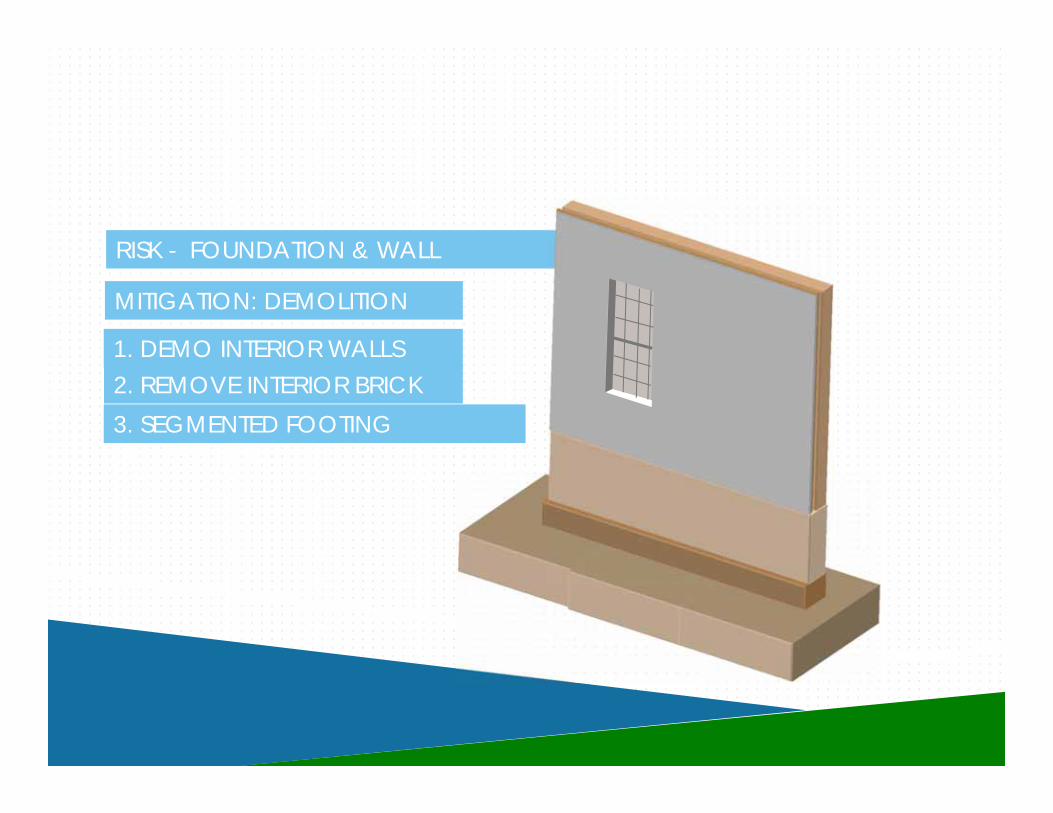
RISK - FOUNDATION & WALL
1. DEMO INTERIOR WALLS2. REMOVE INTERIOR BRICK3. SEGMENTED FOOTING EXCAVATION
MITIGATION: DEMOLITION
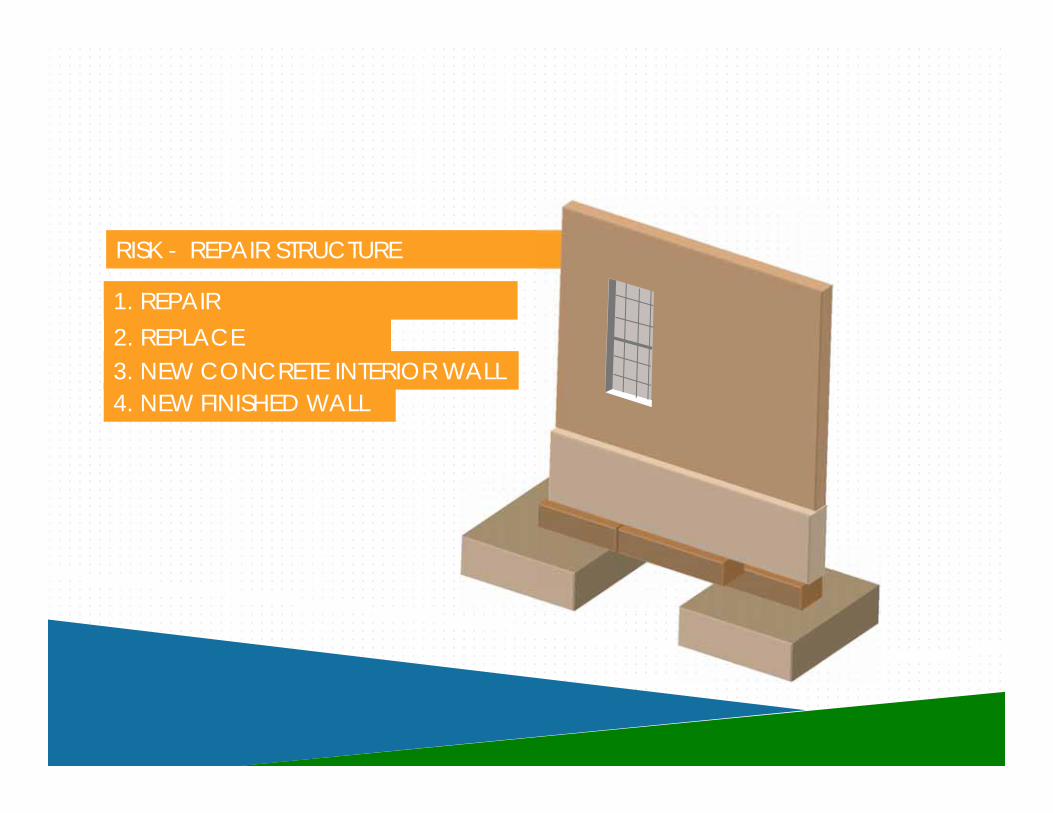
RISK - REPAIR STRUCTURE
1. REPAIR FOOTINGS/FOUNDATIONS2. REPLACE EXCAVATION3. NEW CONCRETE INTERIOR WALL4. NEW FINISHED WALL

For the five years prior to VBS, on average $11M were spent each year on change orders; since VBS, “the cost of change orders dropped to an average of $2M a year.”
For the five years prior to VBS, projects finished on average over 46 days after the scheduled completion date; since VBS, “most projects finished within a week of their scheduled completion.”
The 2004 Performance Audit by Utah’s Legislative Auditor General Evaluated the First Three Years of VBS: “By selecting contractors based on qualitative factors as well as cost, DFCM is hiring better general contractors for its projects . . . more projects are completed on time and within budget, less money is spent on change orders, and the division’s reserve funds have increased.”
Project and contingency reserve funds(accounts into which savings from state construction project are deposited) increased from approximately $4.8 M in 2000 to roughly $10.8 M in 2004, at a time when the state was increasing it expenditures on construction.
THE RESULTS OF VBS
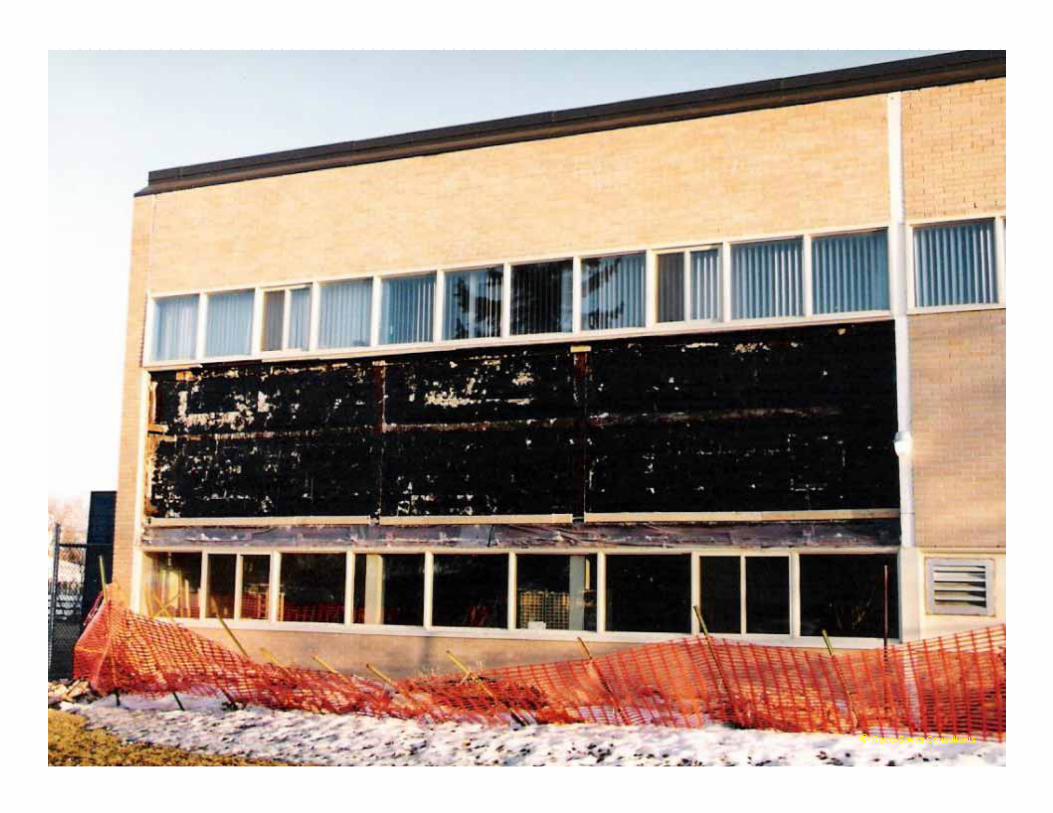
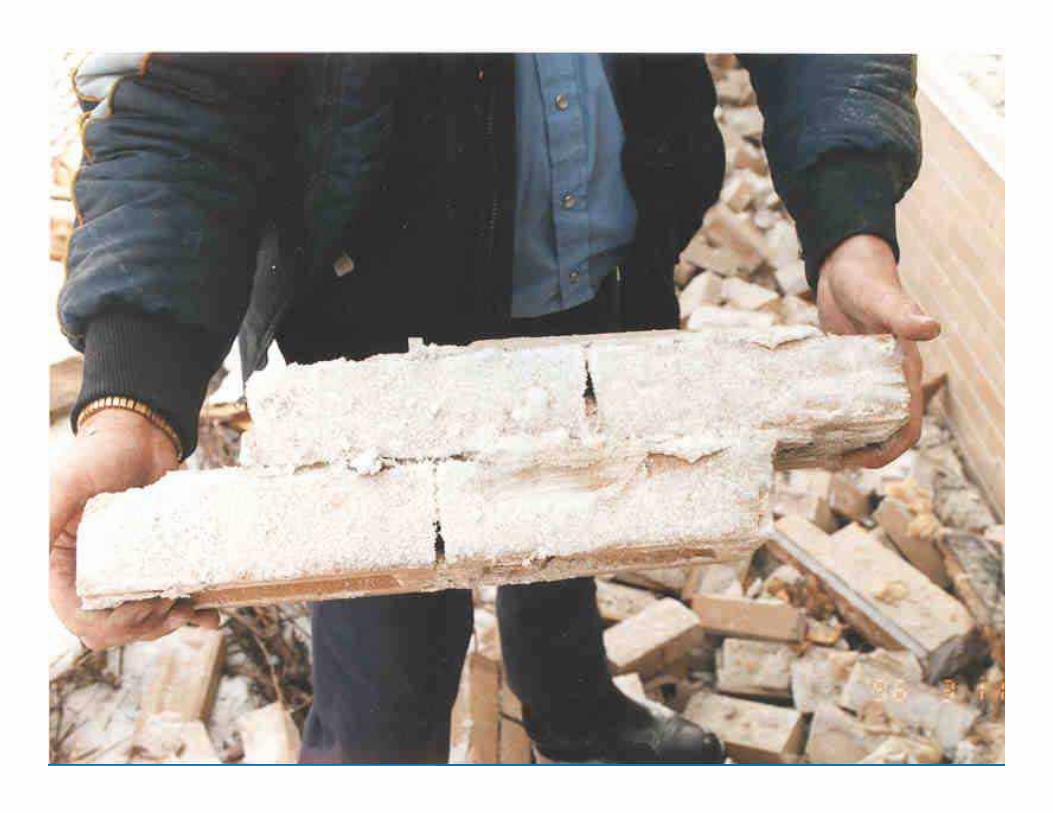
DFCM PAST PROJECT REMEDIATION EFFORTSRemediation efforts
Carried significant costs.Delayed project delivery.Strained relationships between project team
members.

LESSONS LEARNED
Procuring MEP commissioning alone was a good start, but not enough to get whole building performance.
Existing team members did not have the building envelope skills to lead the DFCM to a holistic solution.
National expertise was needed to kick start an effective high performance building strategy.
All team members needed to be involved in the commissioning process (e.g. Architects and Contractors).
A better way to procure commissioning services was needed.
VALUE BASED SELECTION
Value based selection was the solutionCost is a factor, but not the only determining
factor.Past performance rating key. Team experience is key.Review panel must include one representative
from DFCM, Institution/Agency, and professional community.
RFPs written based on whole building.
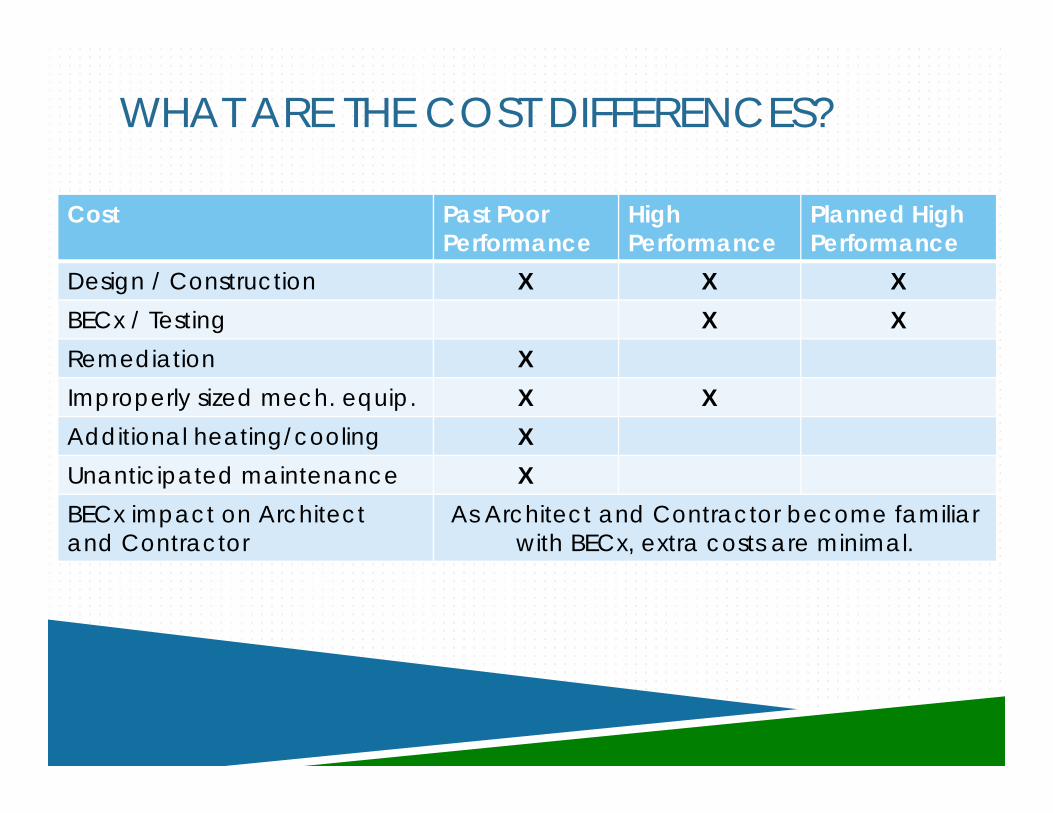
WHAT ARE THE COST DIFFERENCES?
Cost Past Poor Performance
High Performance
Planned High Performance
Design / Construction X X XBECx / Testing X XRemediation XImproperly sized mech. equip. X XAdditional heating/cooling XUnanticipated maintenance XBECx impact on Architect and Contractor
As Architect and Contractor become familiar with BECx, extra costs are minimal.

PAST –VS. PRESENT COSTS
Comparison of Utility Costs of Old Buildings vs. New Buildings with Envelope Technology
SiteElec Cost /Sq
FtNat. Gas Cost
/Sq FtTotal Energy Cost
/SqFtBuilding
SizeAnnual Energy
CostSALT LAKE MULTI AGENCY_1618 $0.78 $0.11 $0.89 267,000 $237,630 COURTS MATHESON_1553 $1.03 $0.23 $1.26 420,000 $529,200 HEBER WELLS_1501 $1.21 $0.16 $1.37 194,400 $266,328 CANNON HEALTH $1.24 $0.14 $1.38 194,120 $267,886 CAPITOL COMPLEX_1652 $1.17 $0.21 $1.38 734,324 $1,013,367 REGIONAL CENTER PROVO_1353 $1.23 $0.17 $1.40 124,987 $174,982
Average Energy Cost/SqFt for new space with Exterior Envelope = $.89
Average Energy Cost/SqFt for old space without Envelope Technology = $1.358
Estimated Annual savings if older 5 buildings above had Exterior Envelope = $767,394
Multi-Agency State Office Building
Dixie State Holland Centennial Commons
Total Building Area (SF) 267,000 SF 177,000 SF
Total Envelope Area (SF) 227,700 SF 165,168 SF
Building envelope with Air Barrier 33,250 SF 40,000 SF
Air Barrier Type Membrane Fluid Applied
Total Construction Costs $45,600,000 $31,000,000
Air Barrier Construction Costs $292,500 $136,600
Air Barrier Cost/SF with Air Barrier $2.50 $3.79
A/E Envelope Design Costs 0% 2.5%
Envelope Commissioning Costs $0 $49,200
Envelope Testing Costs $5,000 $51,700
Leakage Rate (CFM/SF @ 0.05 WC) 0.20 0.027
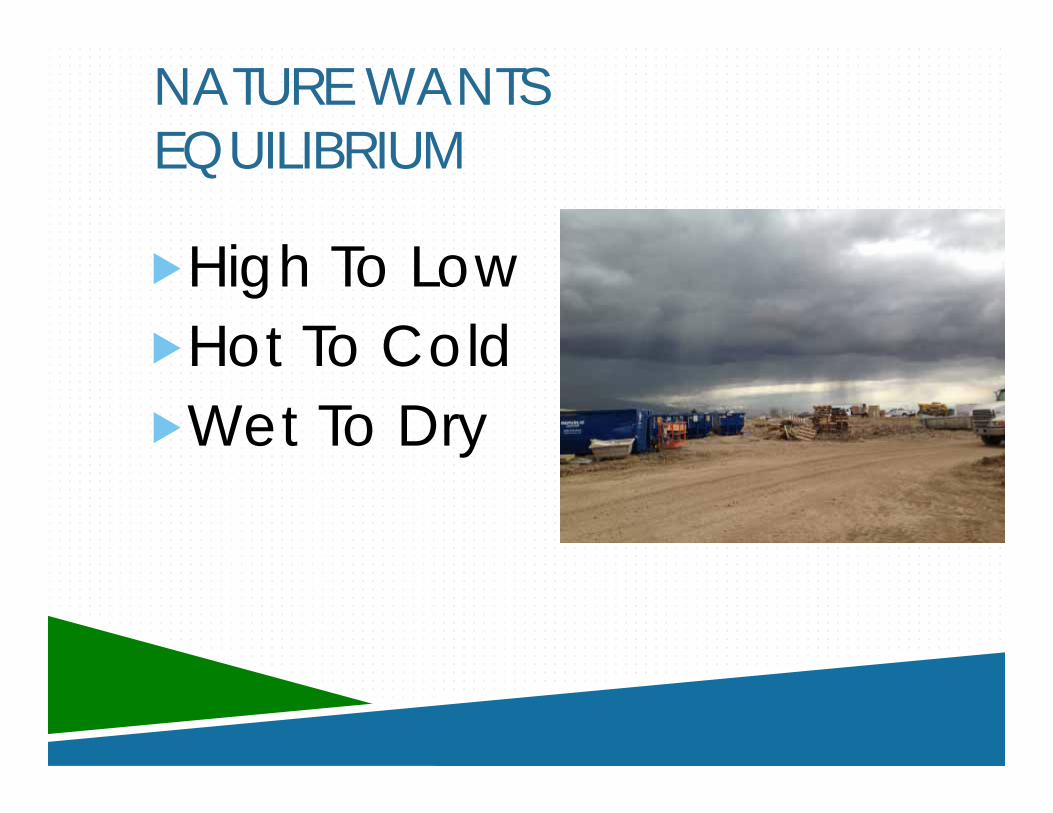
High To LowHot To ColdWet To Dry
NATURE WANTS EQUILIBRIUM

ENVIRONMENTAL SEPARATION
Vapor barriersThermal barriersAir barriersDrainage layers
PRE-DESIGN
Record OPR.Review BOD.Coach team on system
performance/selection.Work with energy modeler on
inputs and design assumptions.
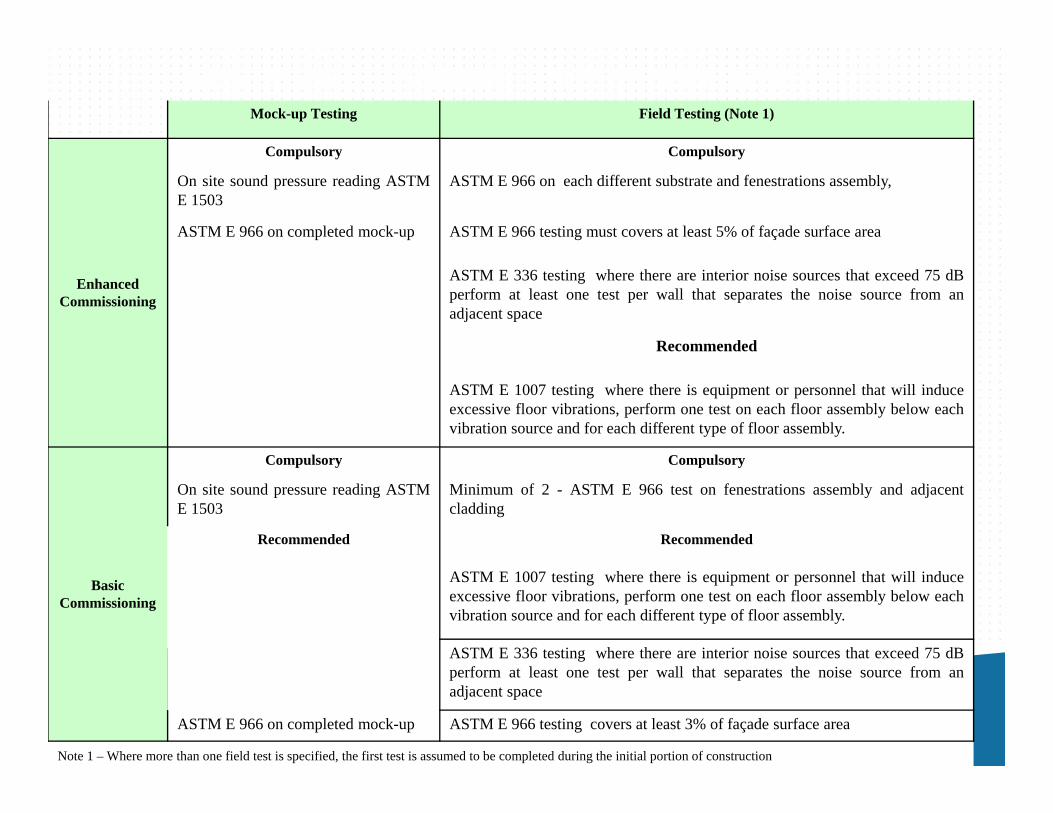
Acoustical Functional Performance TestingMock-up Testing Field Testing (Note 1)
Enhanced Commissioning
Compulsory Compulsory
On site sound pressure reading ASTME 1503
ASTM E 966 on each different substrate and fenestrations assembly,
ASTM E 966 on completed mock-up ASTM E 966 testing must covers at least 5% of façade surface area
ASTM E 336 testing where there are interior noise sources that exceed 75 dBperform at least one test per wall that separates the noise source from anadjacent space
Recommended
ASTM E 1007 testing where there is equipment or personnel that will induceexcessive floor vibrations, perform one test on each floor assembly below eachvibration source and for each different type of floor assembly.
Basic Commissioning
Compulsory Compulsory
On site sound pressure reading ASTME 1503
Minimum of 2 - ASTM E 966 test on fenestrations assembly and adjacentcladding
Recommended Recommended
ASTM E 1007 testing where there is equipment or personnel that will induceexcessive floor vibrations, perform one test on each floor assembly below eachvibration source and for each different type of floor assembly.
ASTM E 336 testing where there are interior noise sources that exceed 75 dBperform at least one test per wall that separates the noise source from anadjacent space
ASTM E 966 on completed mock-up ASTM E 966 testing covers at least 3% of façade surface area
Note 1 – Where more than one field test is specified, the first test is assumed to be completed during the initial portion of construction
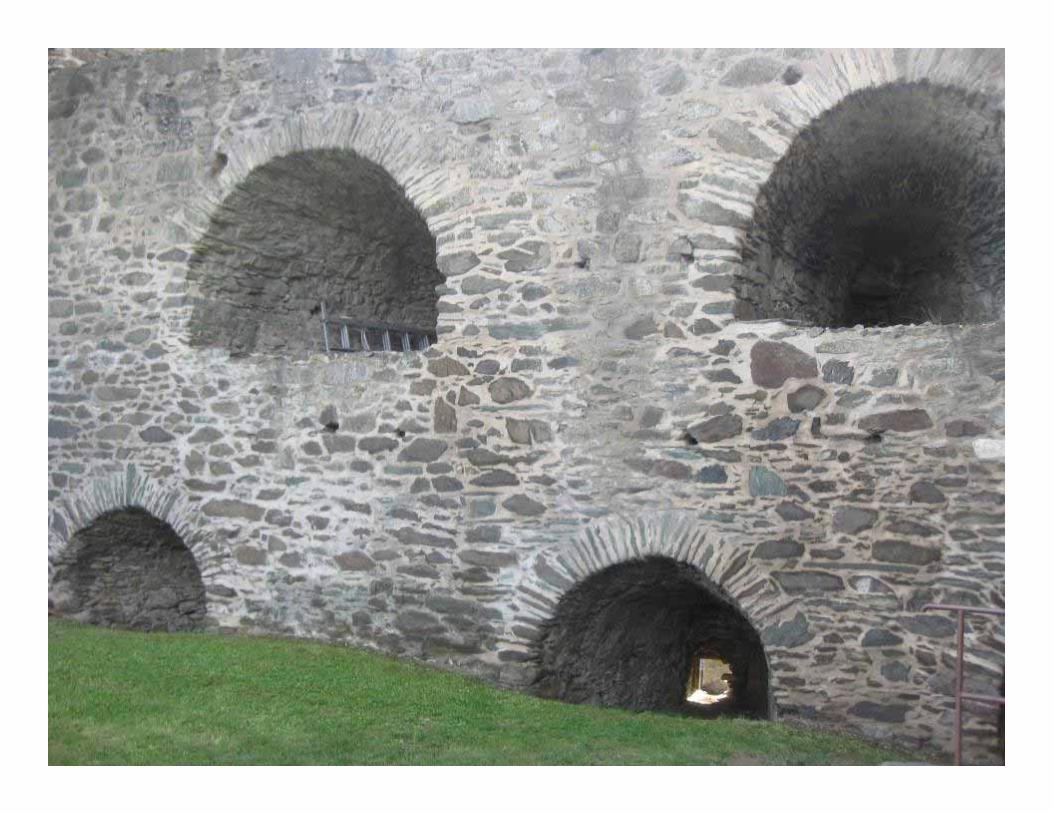
LATTER-DAY BUILDING ENVELOPES
Simple building materials.Limited layers.Master Tradesmen.Apprenticeship training.

TODAY’S BUILDING ENVELOPESComplex building materials.Multi-layers.Depleted number of Master
Tradesmen.Limited on-the-job training.Generally, ‘lowest price wins.’
DESIGN PHASE
Review design against OPR and BOD.Typically multiple reviews.
Check construction sequencing, compatibility, and durability.
Write BECx and functional performance testing specifications.
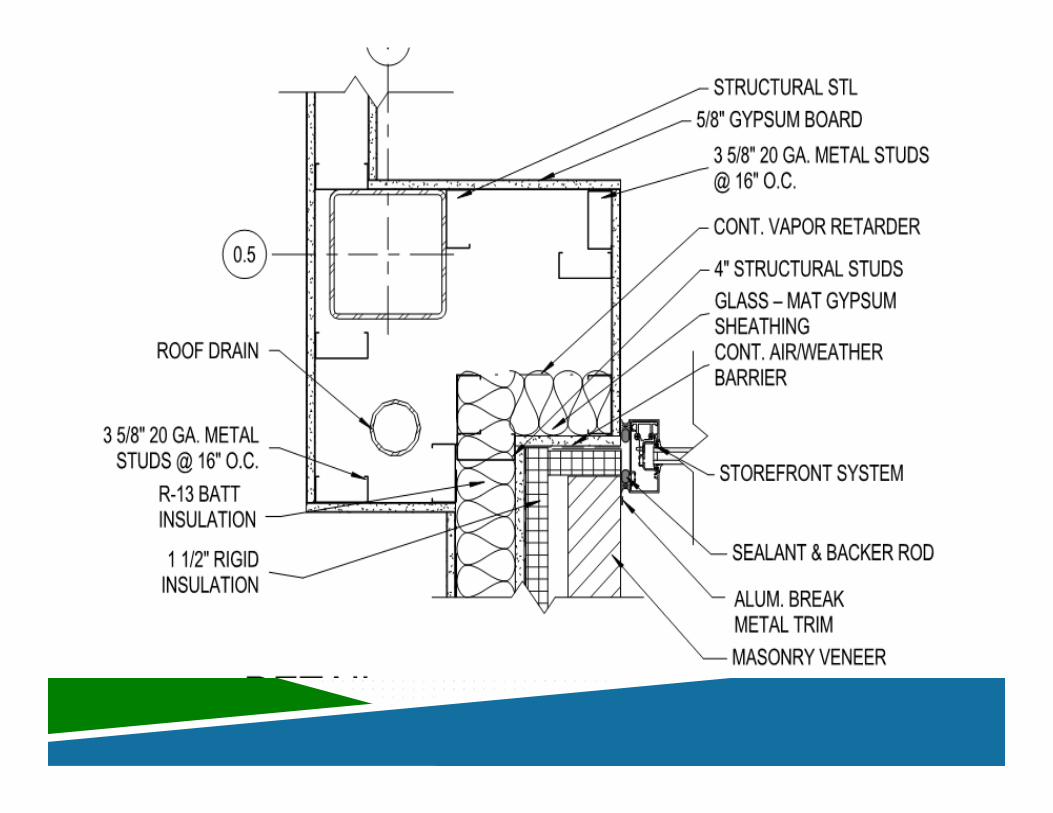


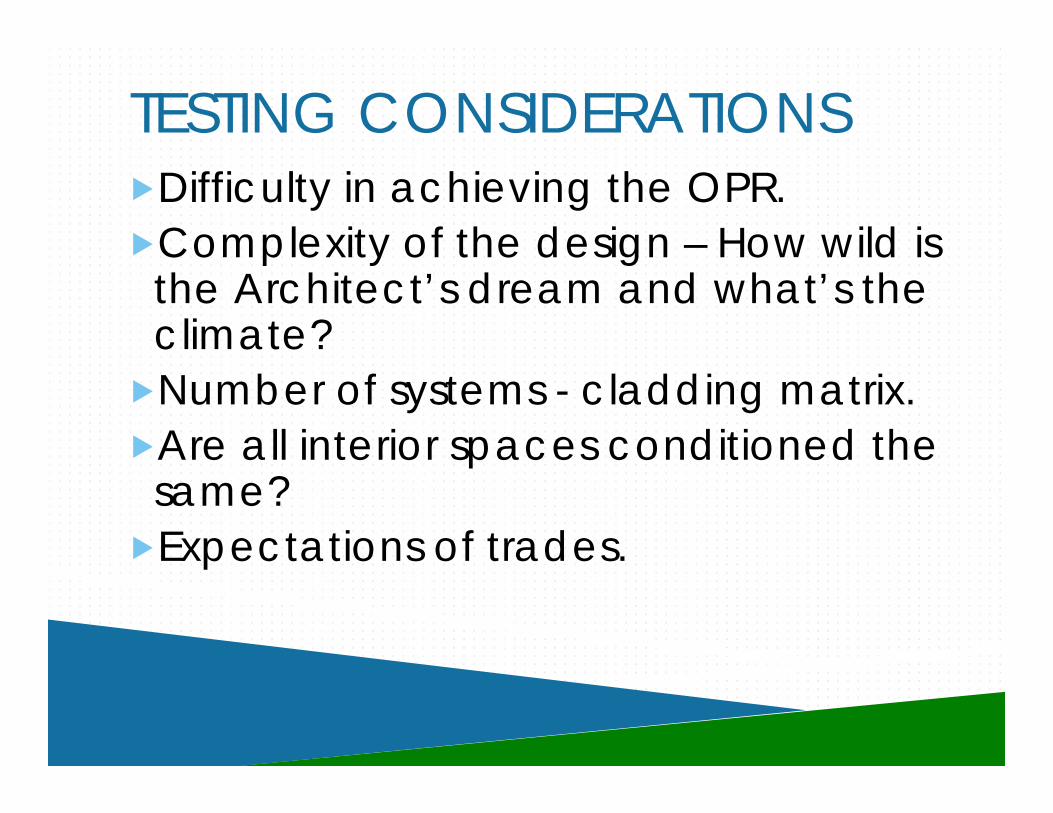
TESTING CONSIDERATIONSDifficulty in achieving the OPR.Complexity of the design – How wild is
the Architect’s dream and what’s the climate?
Number of systems - cladding matrix.Are all interior spaces conditioned the
same?Expectations of trades.

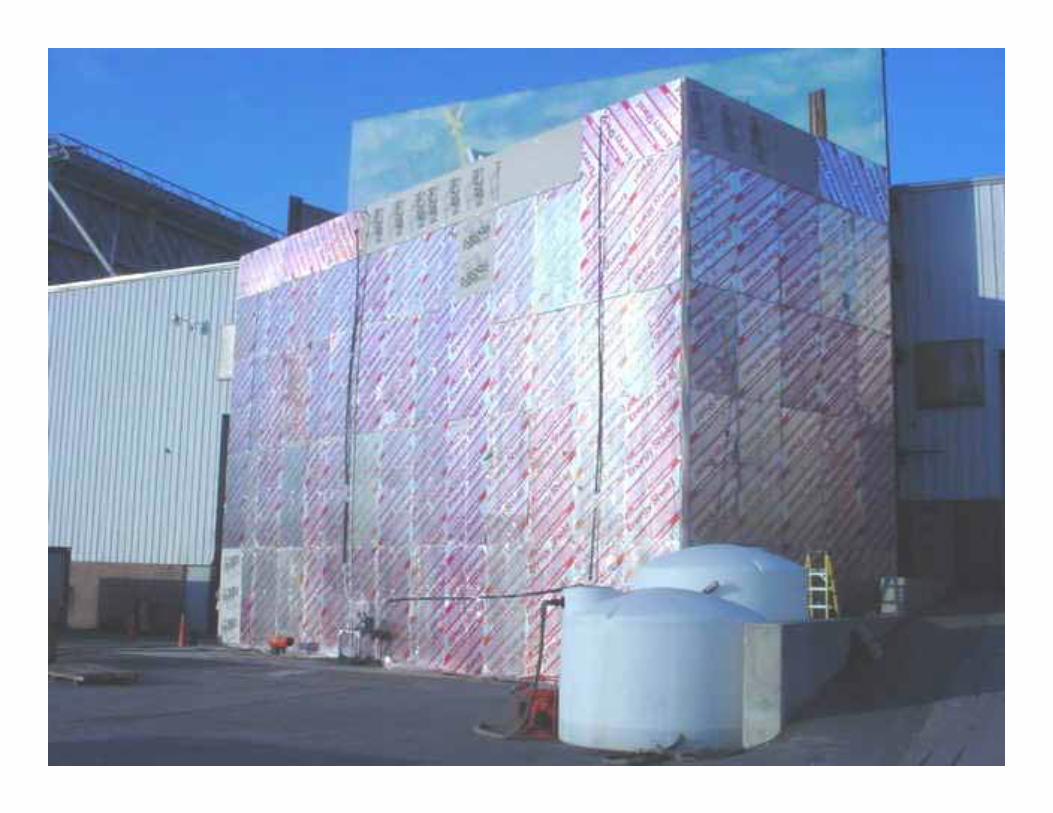
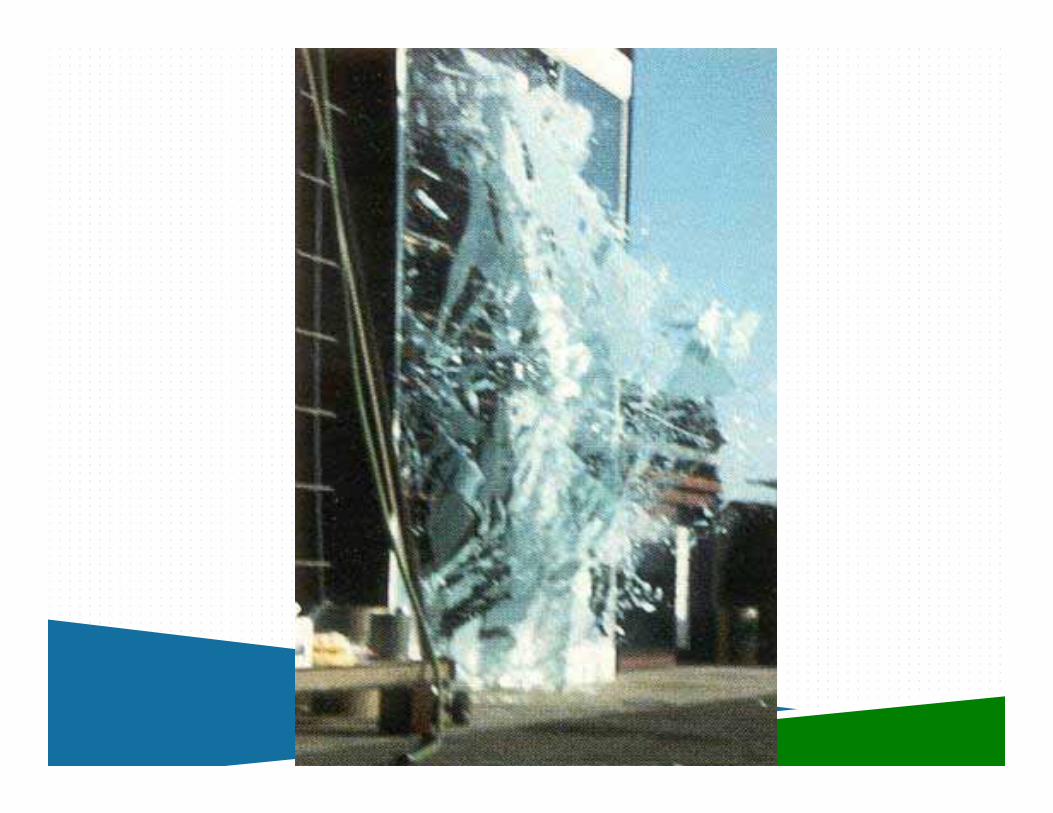
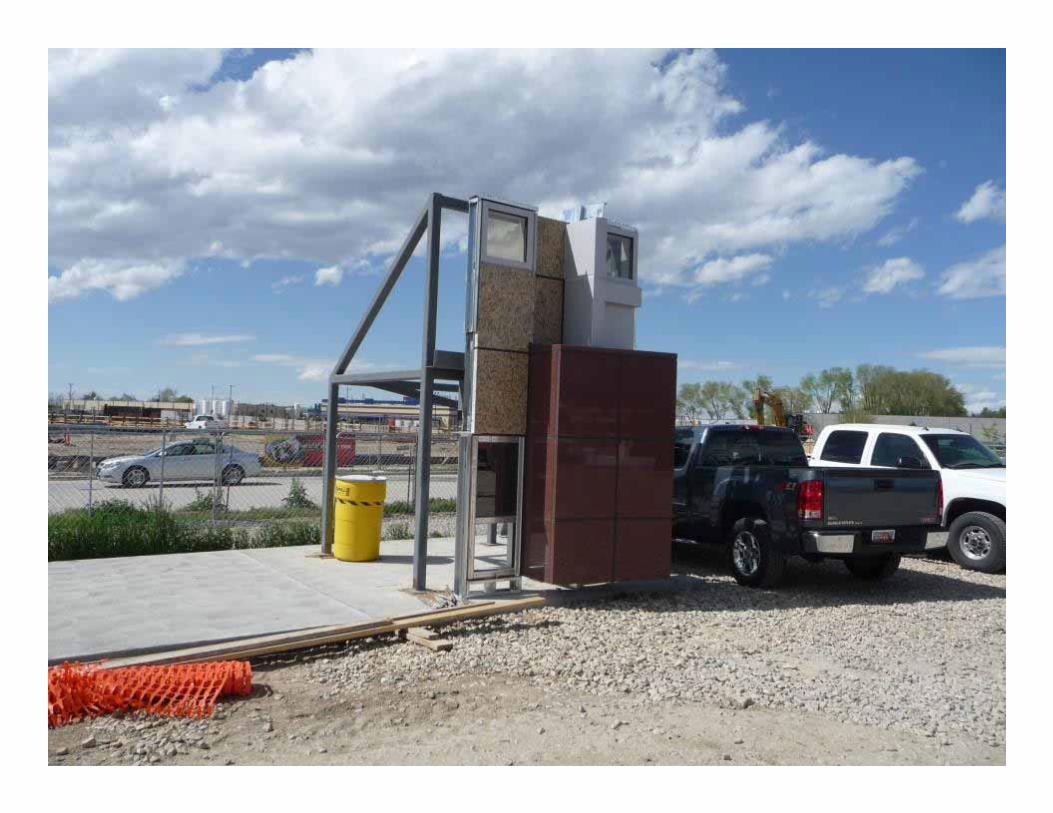
PRE-CONSTRUCTION PHASEStart-up meeting with all parties
involved.Review of shop drawings.Review of proposed materials for
compatibility.Review of ownership/sequence.Finalize testing protocols.Document mock-up construction and
testing.

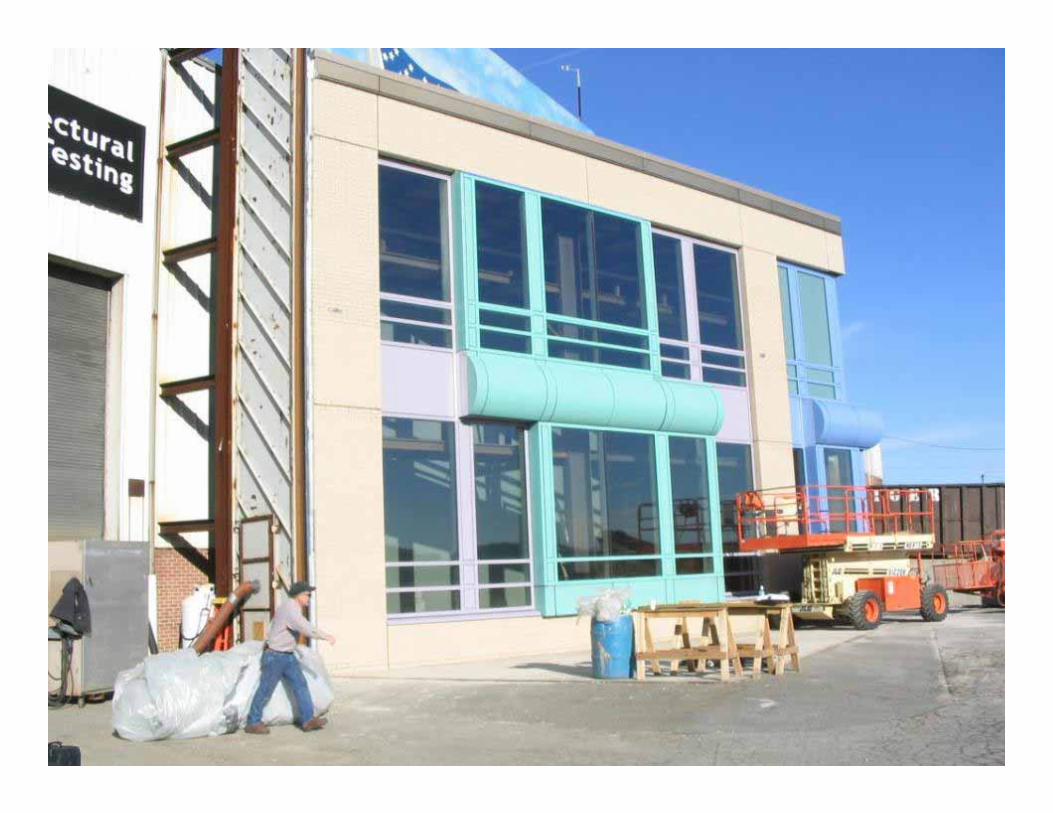
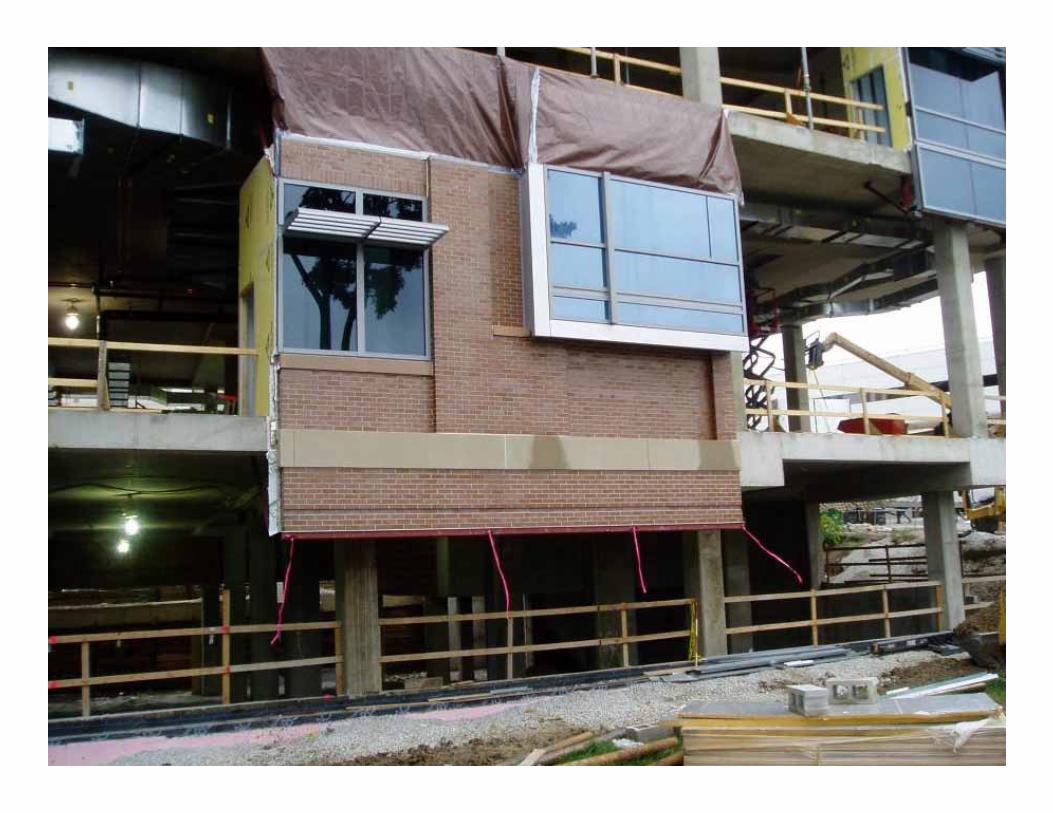
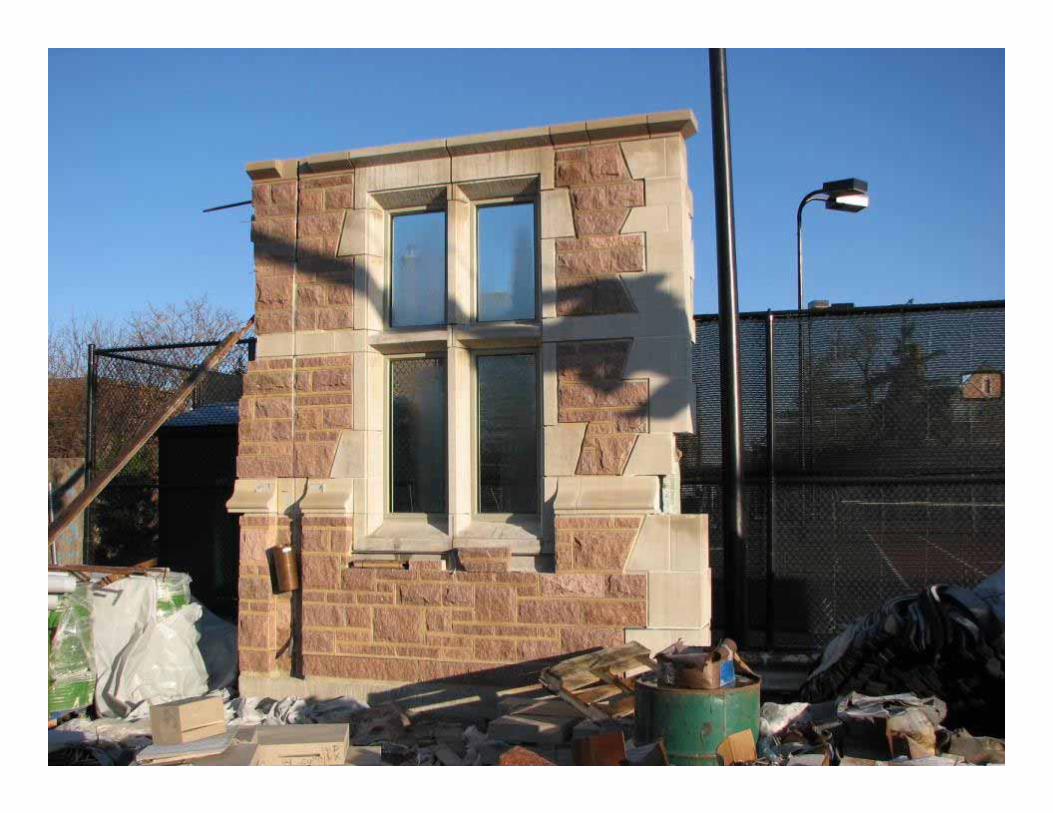
PRE-CONSTRUCTION PHASEMockup:Built by the trades.Represent project design and
materials.May be stand-alone or part of the
final construction.Include as many typical details as
possible.Tested for compliance.Sets the standard of care.


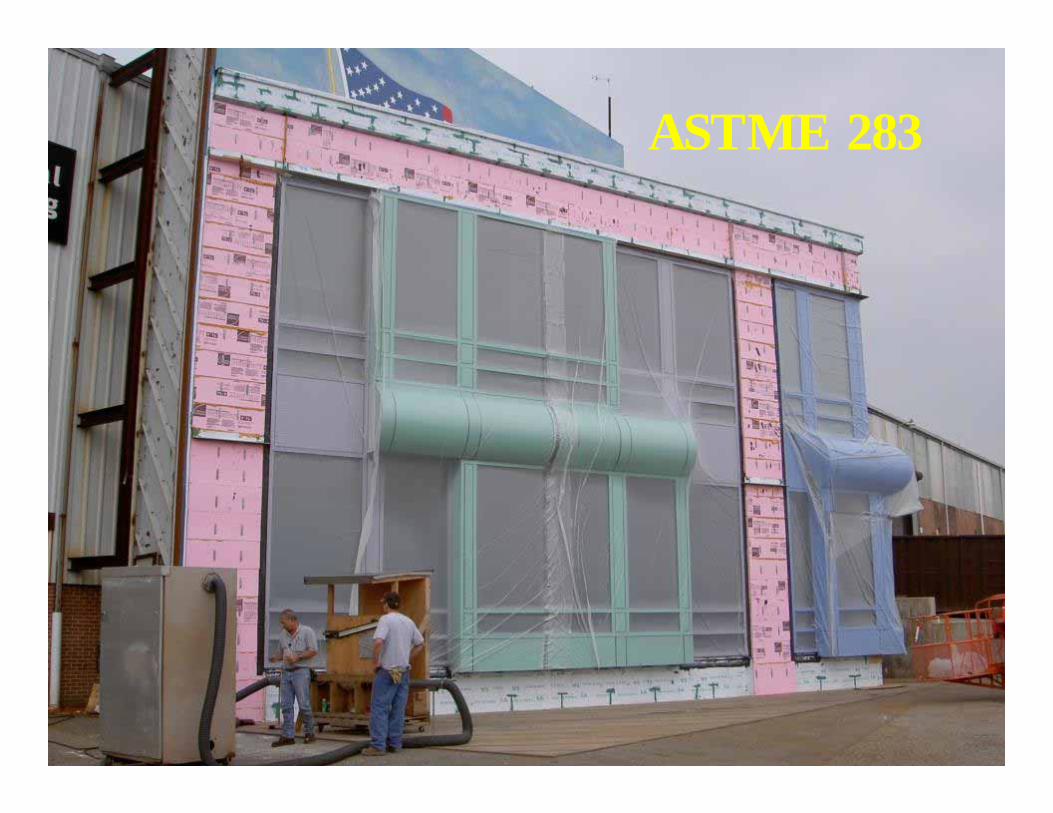
ASTME 283


This image cannot currently be displayed.

This image cannot currently be displayed.

This image cannot currently be displayed.

This image cannot currently be displayed.

This image cannot currently be displayed.

This image cannot currently be displayed.

This image cannot currently be displayed.

This image cannot currently be displayed.

This image cannot currently be displayed.

This image cannot currently be displayed.

This image cannot currently be displayed.

This image cannot currently be displayed.

This image cannot currently be displayed.

This image cannot currently be displayed.


This image cannot currently be displayed.


This image cannot currently be displayed.

This image cannot currently be displayed.

This image cannot currently be displayed.

This image cannot currently be displayed.

This image cannot currently be displayed.

This image cannot currently be displayed.

This image cannot currently be displayed.
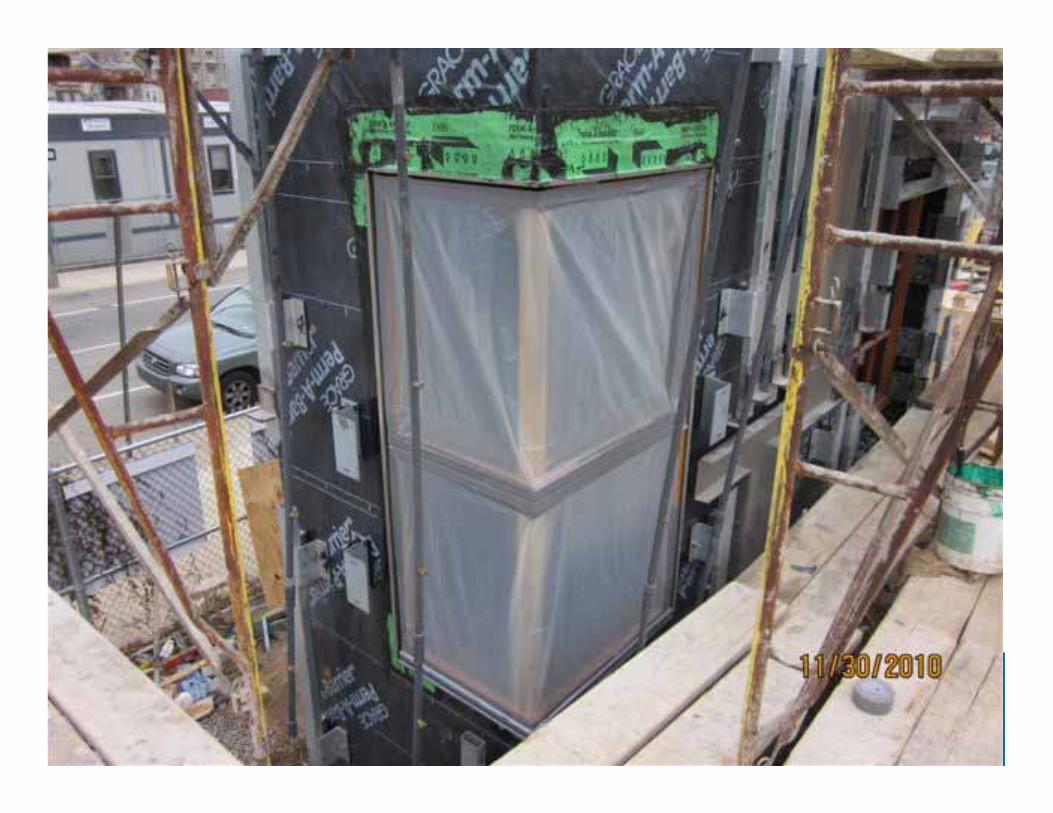
CONSTRUCTION PHASEReview Quality control by
contractors Q/C.Observe/perform functional
performance testing.Observe/inspect construction.Perform as-needed BECx
meetings.Update BECx plan.
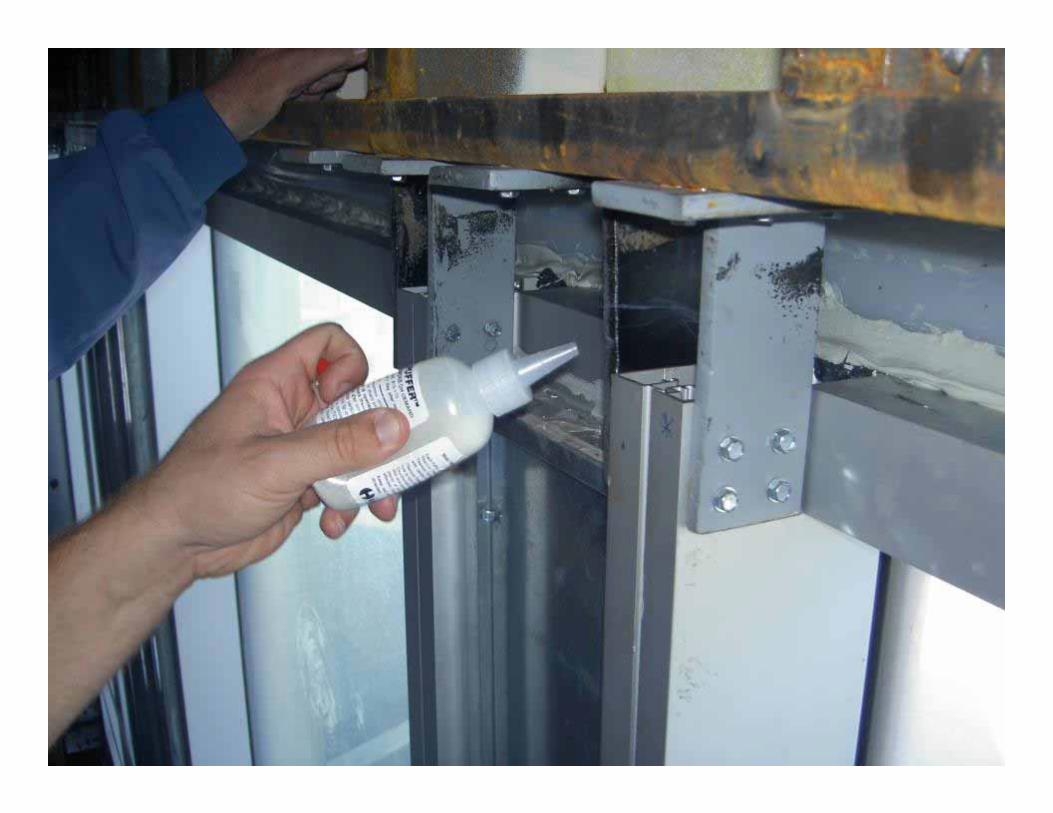
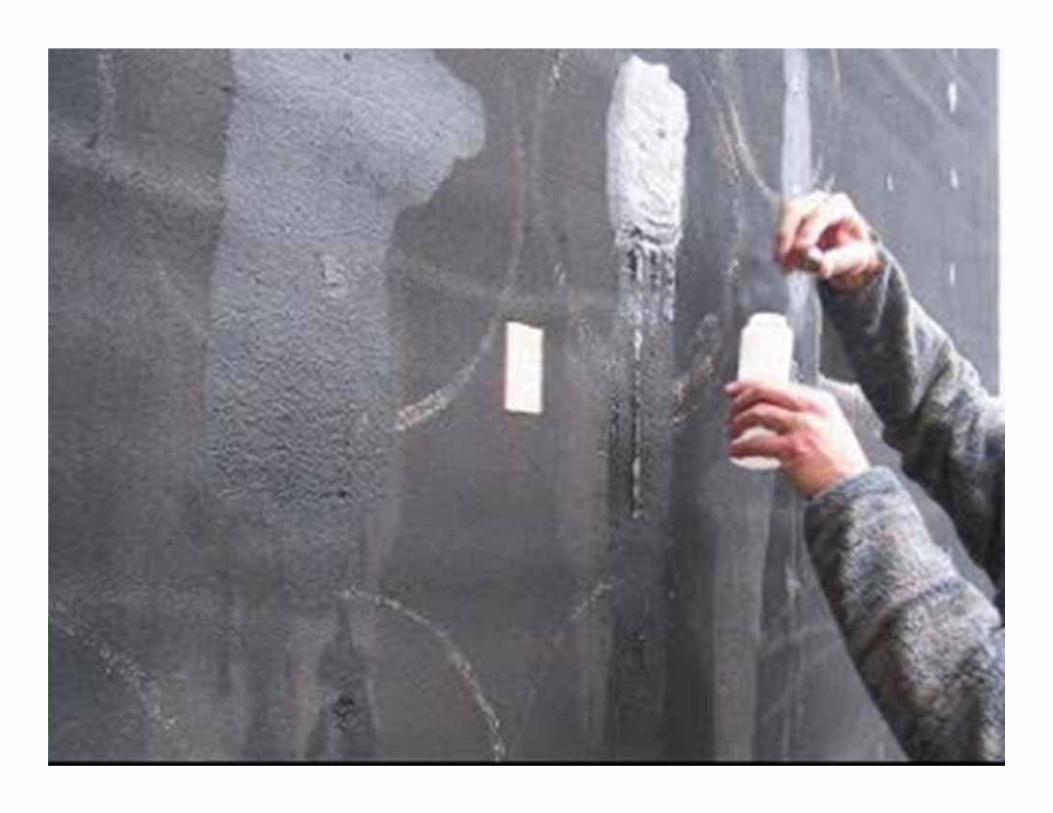
SURFACEPREPARATION
This image cannot currently be displayed.

This image cannot currently be displayed.

This image cannot currently be displayed.

This image cannot currently be displayed.

This image cannot currently be displayed.

This image cannot currently be displayed.

This image cannot currently be displayed.

This image cannot currently be displayed.

This image cannot currently be displayed.

This image cannot currently be displayed.

This image cannot currently be displayed.

This image cannot currently be displayed.

This image cannot currently be displayed.

This image cannot currently be displayed.

This image cannot currently be displayed.
This image cannot currently be displayed.

This image cannot currently be displayed.

This image cannot currently be displayed.


This image cannot currently be displayed.

This image cannot currently be displayed.

This image cannot currently be displayed.not currently be displayed.
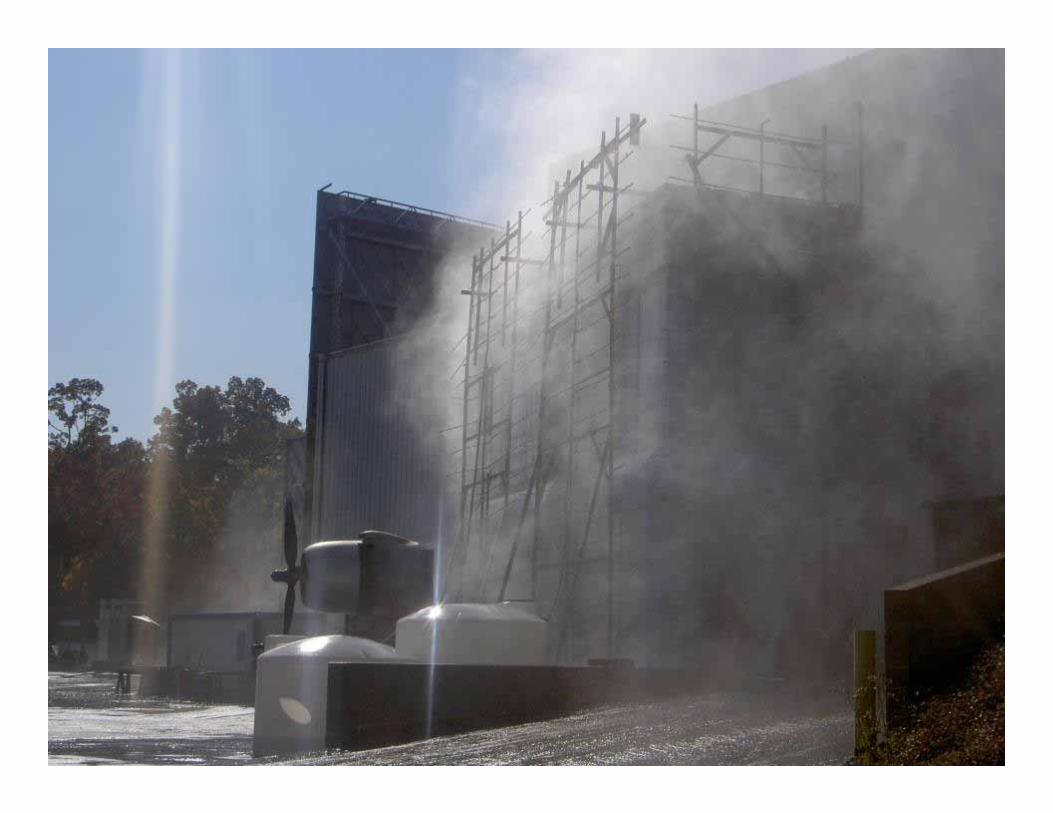
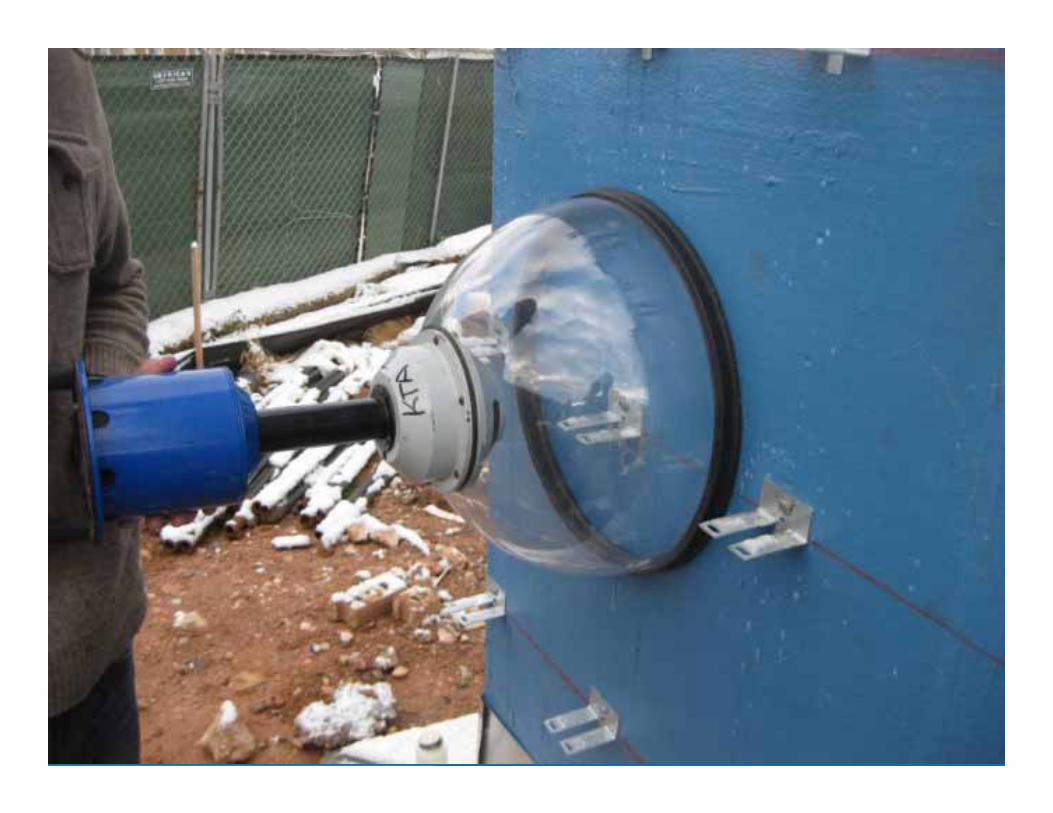
O & M PHASE
Whole building air testing.Infrared scanning.Warranty package.Final BECx record.

This image cannot currently be displayed.

This image cannot currently be displayed.

This image cannot currently be displayed.

This image cannot currently be displayed.

This image cannot currently be displayed.
This image cannot currently be displayed.
This image cannot currently be displayed.
This image cannot currently be displayed.
This image cannot currently be displayed.
This image cannot currently be displayed.
This image cannot currently be displayed.
This image cannot currently be displayed.
This image cannot currently be displayed.

This image cannot currently be displayed.

This image cannot currently be displayed.

This image cannot currently be displayed.
This image cannot currently be displayed. This image cannot currently be displayed.
This image cannot currently be displayed. This image cannot currently be displayed.
Contract Details + Manufacturers Details = Collaborated Shop Drawings

isplayed.
This image cannot currently be displayed.

This image cannot currently be displayed. This image cannot currently be displayed.

This image cannot currently be displayed.

This image cannot currently be displayed.

This image cannot currently be displayed.

This image cannot currently be displayed.

This image cannot currently be displayed.

This image cannot currently be displayed.

This image cannot currently be displayed.
This image cannot currently be displayed.
This image cannot currently be displayed.
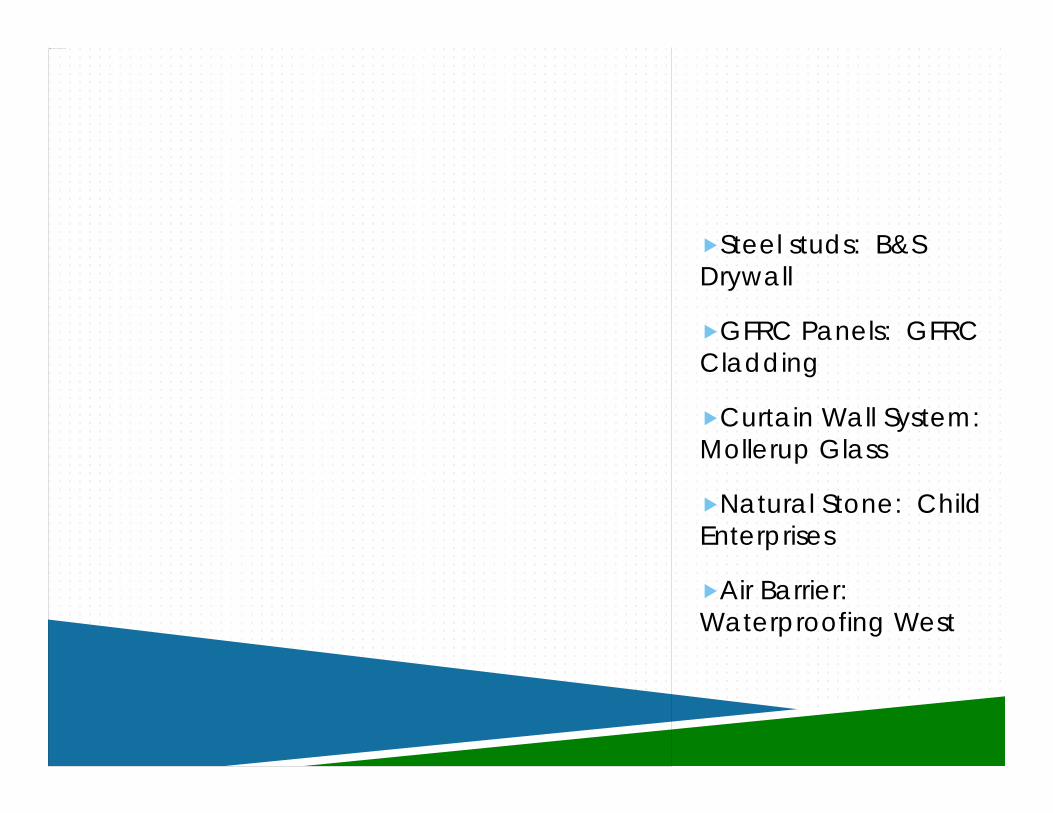
Steel studs: B&S Drywall
GFRC Panels: GFRC Cladding
Curtain Wall System: Mollerup Glass
Natural Stone: Child Enterprises
Air Barrier: Waterproofing West

yed. This image cannot currently be displayed.
yed. This image cannot currently be displayed.

This image cannot currently be displayed.
This image cannot currently be displayed.

This image cannot currently be displayed.
This image cannot currently be displayed.

This image cannot currently be displayed.

Bias minimum 12 points over 10 seconds each with readings/point Yes
Minimum test pressure >=25 Pa AND >= max bias x 10/3 Yes
Minimum test points >=12 over at least 20 seconds each Yes
Correlation and slope within acceptable range Yes
Building pressure variation does not exceed +/- 10% Yes
Combined Test Data
Average air flow at STP and +75 Pa [CFM] 12,550
Average air flow at STP and +12.4 PA [CFM] 4,525
Average equivalent leakage area at -75 Pa [ft2] 9.365
Mean 95% Confidence IntervalLower Upper
Average CFM / ft2 of envelope at +75 Pa [CFM / ft2] 0.076 0.076 0.077
Average CFM / ft2 of envelope at +12.4 Pa [CFM / ft2] 0.027 0.026 0.029

Project NameClimat
e Zone
Gross Wall Area (Above
and Below Grade)
Roof Area
Glazing Area Proposed or Baseline Primary HVAC System Infiltration
Rate
Total Utility Cost
Leakage multiplier
(-) (-) (ft2) (ft2) (%) (P/B) (-)(CFM/ft2 of
Wall)(Annual
$)
SLCC Instructional & Administration
Building
5B 92,753 1.92 42,898 33.5%
B VAV w/ reheat (90.1-2007 App. G System #7)
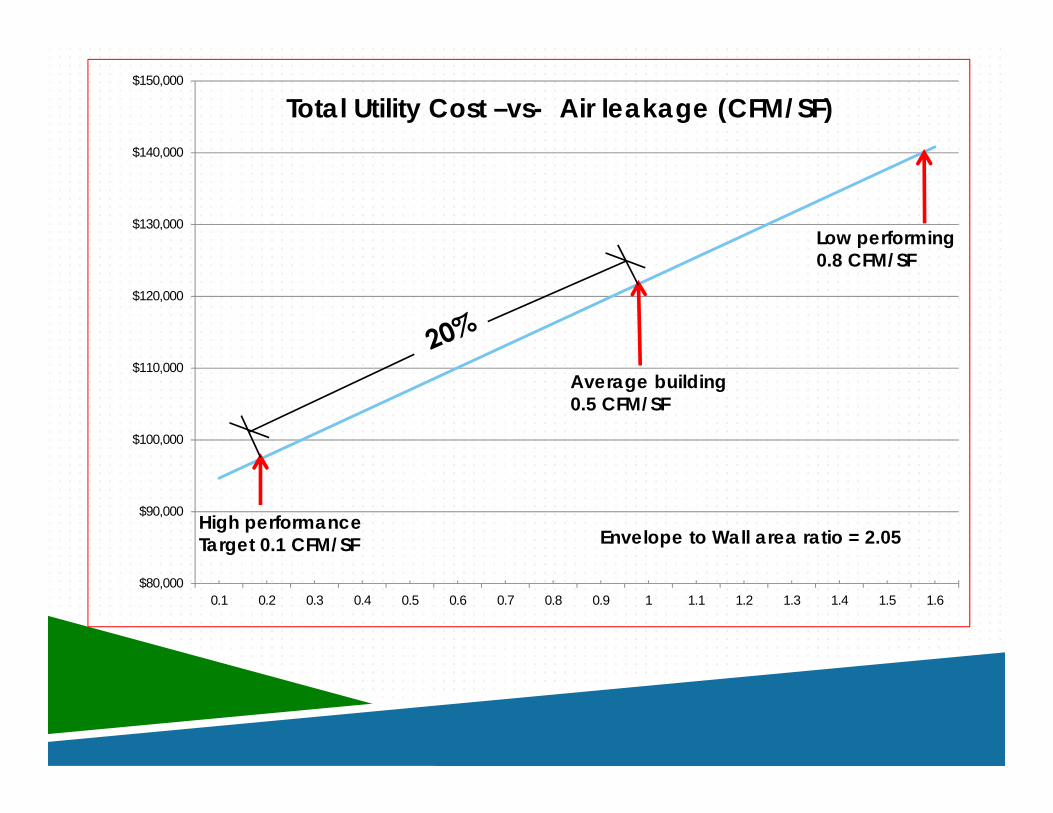
0.1 $155,0830.5 $160,6630.8 $164,613
P IDEC VAV w/ perimeter radiant heating
0.1 $135,0680.5 $139,6590.8 $143,266
UVU Classroom Building 5B 81,550 2.65 67,380 40.0%
B VAV w/ reheat (90.1-2007 App. G System #7)
0.1 $247,8440.5 $252,6640.8 $256,125
P IDEC VAV w/ reheat0.1 $204,5860.5 $209,1220.8 $212,942
Dixie State Holland
Centennial Commons
3B 68,918 2.05 36,300
40.0% B VAV w/ reheat (90.1-2007 App. G System #7)
0.1 $150,8250.5 $157,8830.8 $163,110
40.6% P IDEC VAV w/ Hot Water Reheat
0.1 $94,6820.5 $106,8400.8 $116,212
Ogden Juvenile Courts 5B 66,033 1.69 22,892 39.2%
B VAV w/ reheat (90.1-2007 App. G System #7)
0.1 $96,7180.5 $102,4990.8 $106,662
P IDEC VAV w/ Hot Water Reheat
0.1 $66,2830.5 $68,9540.8 $70,407
Utah National Guard TASS Building B
5B 28,129 2.21 17,003 20.6%
BPackaged VAV w/ reheat (90.1-2007 App. G System
#5)
0.1 $59,6150.5 $77,4460.8 $94,879
P Ground Source Heat Pumps
0.1 $23,3230.5 $69,8230.8 $36,657
SUU Gibson Science Center
Addition5B 45,547 1.63 14,412 25.5%
BPackaged VAV w/ reheat (90.1-2007 App. G System
#5)
0.1 $100,0190.5 $104,3970.8 $104,278
P Direct Evaporative VAV w/ Hot Water Reheat
0.1 $80,3310.5 $80,8090.8 $81,524
$80,000
$90,000
$100,000
$110,000
$120,000
$130,000
$140,000
$150,000
0.1 0.2 0.3 0.4 0.5 0.6 0.7 0.8 0.9 1 1.1 1.2 1.3 1.4 1.5 1.6
High performance Target 0.1 CFM/SF
Average building 0.5 CFM/SF
Low performing 0.8 CFM/SF
Envelope to Wall area ratio = 2.05
Total Utility Cost –vs- Air leakage (CFM/SF)

ENERGY MODELING & BECX
Energy modeling influences design Modeling is performed in programing phase. Used to validate design and evaluation options. Scope of analysis is beyond MEP. Traditionally performed by MEP professionals.
This image cannot currently be displayed.
This image cannot currently be displayed.
This image cannot currently be displayed.
This image cannot currently be displayed.
This image cannot currently be displayed.
ENERGY MODELING & BECX
Trends Model accuracy is increasing. Model comparison with actual performance is increasing. Most projects have modeling requirements. Modeling is dictating some design decisions.

ENERGY MODELING & BECX
Relationship with building envelopeThis image cannot currently be displayed.
This image cannot currently be displayed.This image cannot currently be displayed.
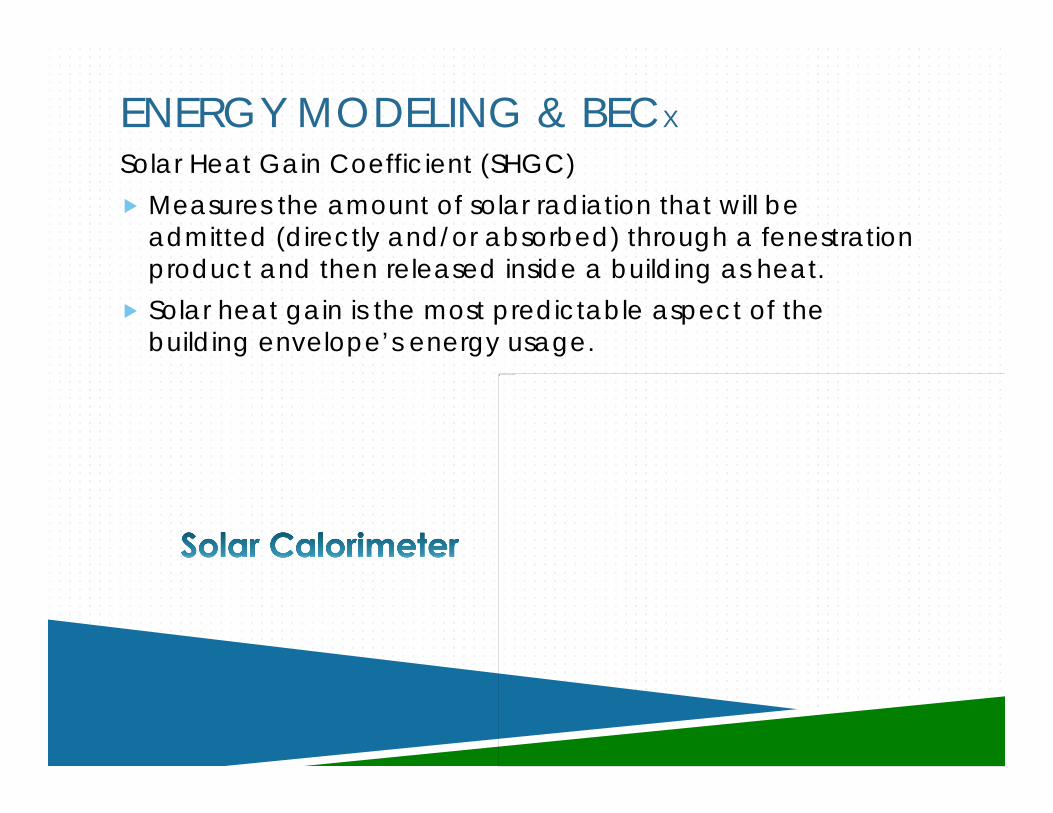
ENERGY MODELING & BECX
Solar Heat Gain Coefficient (SHGC) Measures the amount of solar radiation that will be
admitted (directly and/or absorbed) through a fenestration product and then released inside a building as heat.
Solar heat gain is the most predictable aspect of the building envelope’s energy usage.
This image cannot currently be displayed.
ENERGY MODELING & BECX
R-value / U-factor taken from ASHRAE 90.1 Table 5.5 or Appendix A
This image cannot currently be displayed.

This image cannot currently be displayed.
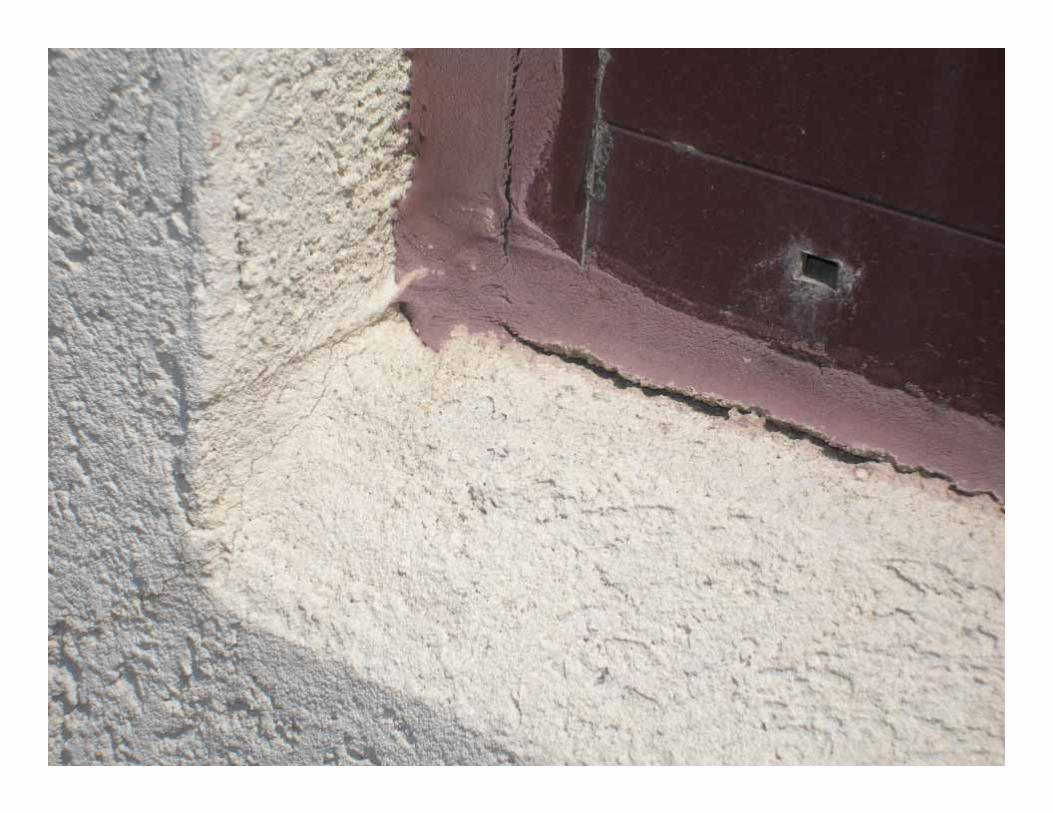
THERMAL DISCONTINUITIES

This image cannot currently be displayed.

This image cannot currently be displayed.
This image cannot currently be displayed.
The way we build does not meet the performance modeled.
ENERGY MODELING & BECXThis image cannot currently be displayed.
Not typically done


This image cannot currently be displayed.
Thermalbridging

This image cannot currently be displayed.
This image cannot currently be displayed.
ENERGY MODELING & BECX
ENERGY MODELING & BECX
Reference ASHRAE 1365 RP
This image cannot currently be displayed.
This image cannot currently be displayed.

ENERGY MODELING & BECXThis image cannot currently be displayed.
Reference ASHRAE 1365 RP
ENERGY MODELING & BECX
Energy models: Energy modeling only accounts for infiltration. Leakage area is only wall, not roof/slab. Does not account for stack effect.
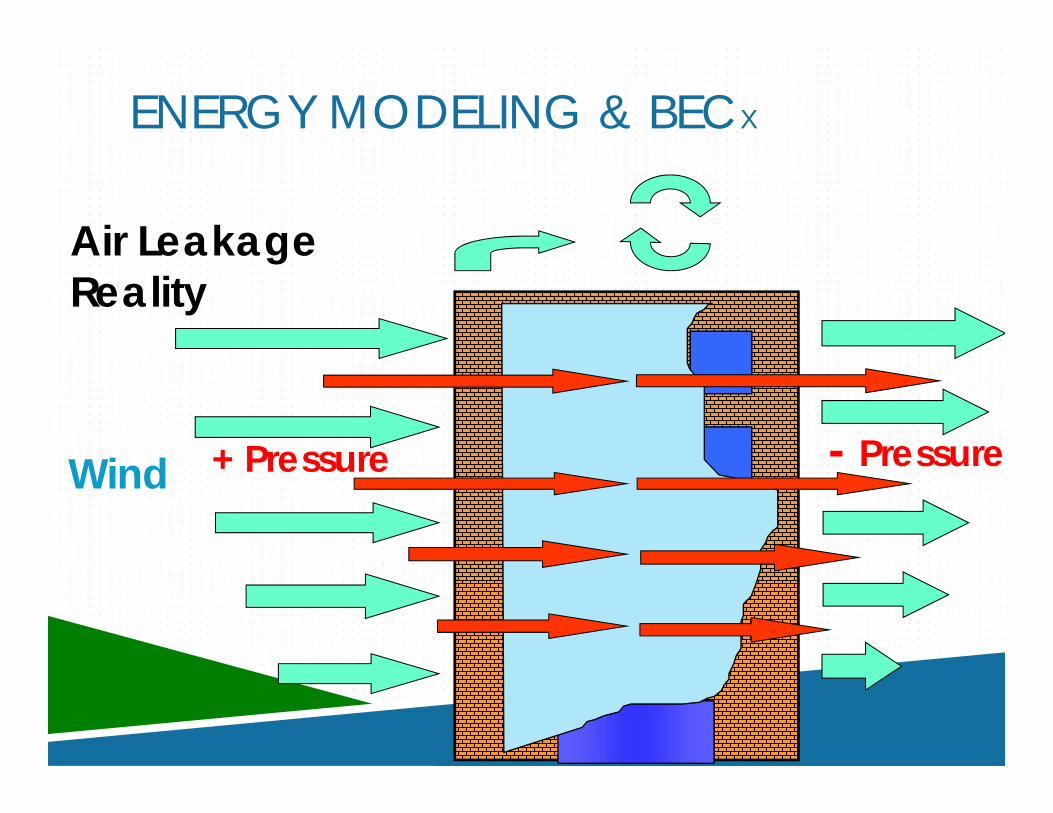
Air Leakage Reality
+ Pressure - Pressure
Air FlowENERGY MODELING & BECX
Wind
ENERGY MODELING & BECX
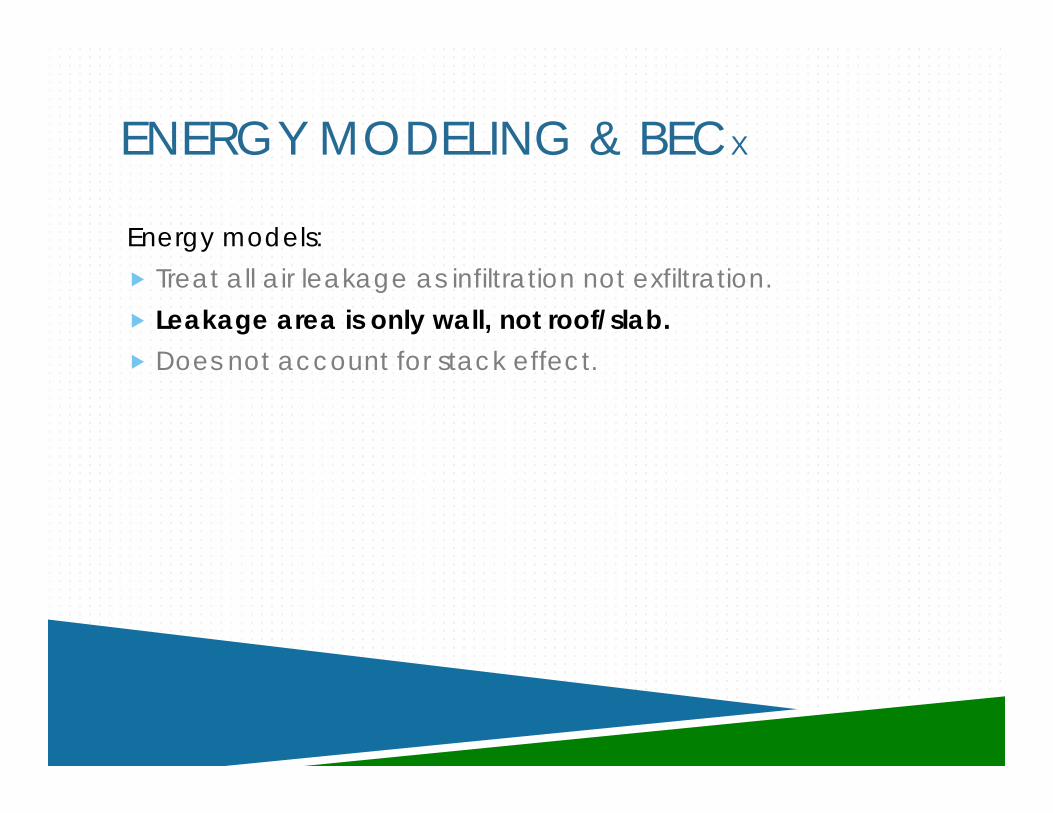
Energy models: Treat all air leakage as infiltration not exfiltration. Leakage area is only wall, not roof/slab. Does not account for stack effect.

Air Barrier Requirements
This image cannot currently be displayed.
ENERGY MODELING & BECX
Whole building air test results (ASTM E 779) are expressed as air flow through the wall, roof, and floor, not just the façade.
CFM/SF rates must be adjusted accordingly (sometimes doubles flow the flow rate).

ENERGY MODELING & BECX
Energy models: Treat all air leakage as infiltration not exfiltration. Leakage area is only wall, not roof/slab. Does not account for stack effect.
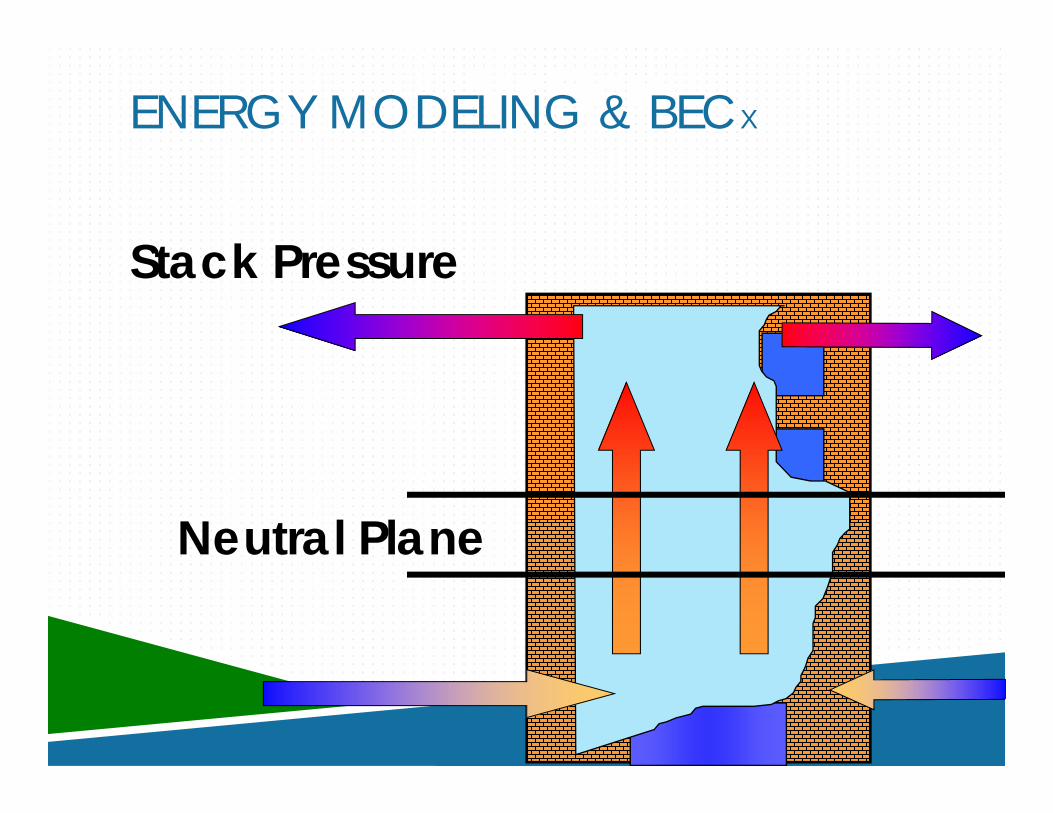
Stack Pressure
Air Flow
Neutral Plane
ENERGY MODELING & BECX

This image cannot currently be displayed.

OAK RIDGE NATIONAL LAB - STUDYThis image cannot currently be displayed.

OAK RIDGE NATIONAL LAB - STUDY
Finding relating to energy modeling and air leakage: Current modeling software, such as Energy Plus, doesn’t do a
good job at accounting for energy loses due to air leakage. Calculations are based on conductive losses that show smaller temperature
changes than the rapid temperature changes due to air leakage. There is no interactive term within simulation tools and the magnitude of this
term is currently unknown.
Current models appear to underestimate the energy loss due to air leakage.
Past studies focus on lower R-value walls (minimizes energy loss due to leakage compared to higher R-values).
EXISTING HIGH PERFORMANCE BUILDING RATING SYSTEM
LEED Silver Minimum.Required “LEED Charrette” in Schematic Design.WE c1, EA c3, EQ c3.1, EQ c4.1, EQ c4.2 required.Utilization of Energy Modeling.

TOMORROW’S HIGH PERFORMANCE BUILDING STANDARD A shift or renewed focus on owner value. Holistic approach to design and building high performance
buildings. Integrated design. Maximizing energy engineering/modeling during design . Establishing continuity and accountability through the entire
project into O&M. Flexibility within the HPBS. Realizing anticipated performance during actual operation. Cost appropriate and scale appropriate standards.

This image cannot currently be displayed.

TOMORROW’S HIGH PERFORMANCE BUILDING STANDARD A shift or renewed focus on owner value. Holistic approach to design and building high performance
buildings. Integrated design. Maximizing energy engineering/modeling during design. Establishing continuity and accountability through the entire
project into O&M. Flexibility within the HPBS. Realizing anticipated performance during actual operation. Cost appropriate and scale appropriate standards.

HPBS/LEED Analysis – On average, LEED buildings performed better than average than non-LEED buildings in the 10% to 15% range; however, some non LEED buildings performed better than the LEED buildings.
This image cannot currently be displayed.
OWNER VALUE

TOMORROW’S HIGH PERFORMANCE BUILDING STANDARD A shift or renewed focus on owner value. Holistic approach to design and building high performance
buildings. Integrated design. Maximizing energy engineering/modeling during design . Establishing continuity and accountability through the entire
project into O&M. Flexibility within the HPBS. Realizing anticipated performance during actual operation. Cost appropriate and scale appropriate standards.

MAXIMIZING ENERGY MODELING Design assist to the design team. Early integration, programming, shoe box models. Utilize past modeling projects as a database. Flexibility. Life Cycle Cost Analysis. Energy is a type of Cx for the design team – “If your kid is ugly
that’s your problem, I’m just the photographer.”This image cannot currently be displayed.
This image cannot currently be displayed.

MASSING ANALYSISMassing Option 1
Massing Option 2
Massing Option 3
Massing Option 4
Relative Annual Energy Consumption
107% 113% 100% 98%
Relative Annual Energy Cost
105% 110% 100% 102%
Relative EUI (kbtu/sqft/yr)
101% 105% 100% 94%
This image cannot currently be displayed. This image cannot currently be displayed.
This image cannot currently be displayed.
This image cannot currently be displayed.

TOMORROW’S HIGH PERFORMANCE BUILDING STANDARD A shift or renewed focus on owner value. Holistic approach to design and building high performance
buildings. Integrated design. Maximizing energy engineering/modeling during design. Establishing continuity and accountability through the entire
project into O&M. Flexibility within the HPBS. Realizing anticipated performance during actual operation. Cost appropriate and scale appropriate standards.

SMALL HPBS
When LEED doesn’t make sense on smaller or less complex projects.
Based on ASHRAE’s Advanced Energy Design Guides or another appropriate standard.
Prescriptive Paths. Flexible. Modeling not necessarily required. Scaled down version of BECx. Spend the LEED $$$ on Cx, BECx, EEMs, or other priorities. Work close with the agency and design team early to
develop the path and goals.
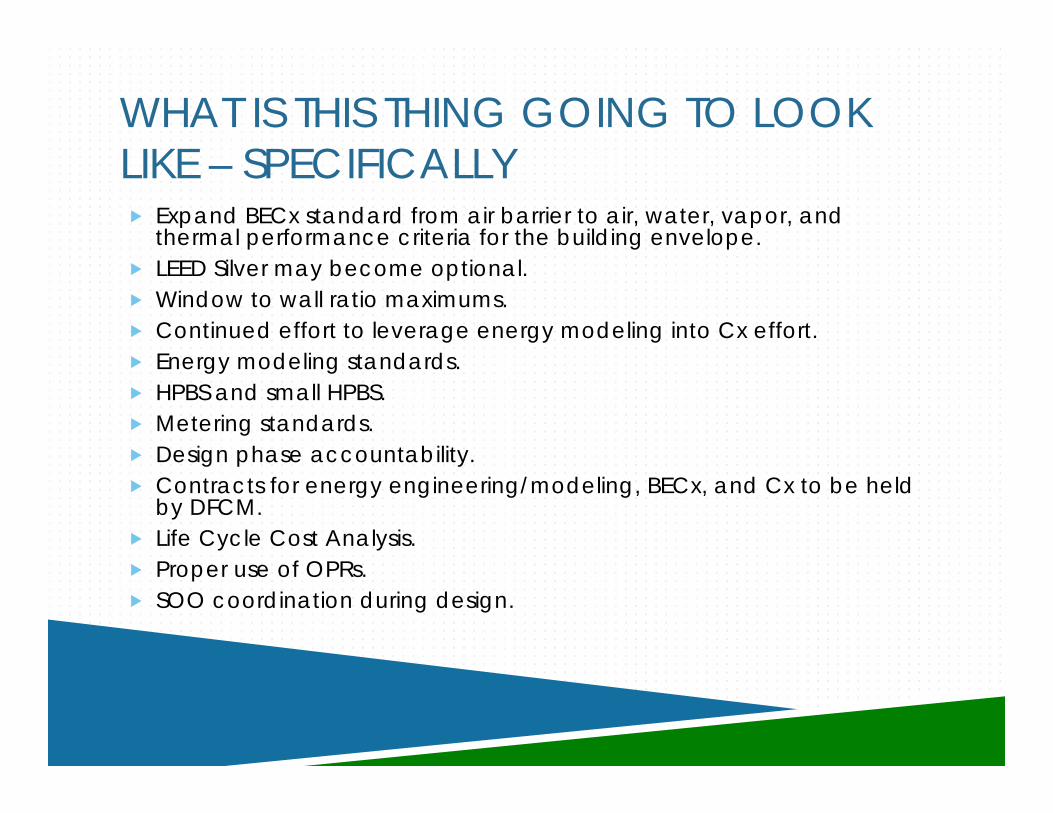
WHAT IS THIS THING GOING TO LOOK LIKE – SPECIFICALLY Expand BECx standard from air barrier to air, water, vapor, and
thermal performance criteria for the building envelope. LEED Silver may become optional. Window to wall ratio maximums. Continued effort to leverage energy modeling into Cx effort. Energy modeling standards. HPBS and small HPBS. Metering standards. Design phase accountability. Contracts for energy engineering/modeling, BECx, and Cx to be held
by DFCM. Life Cycle Cost Analysis. Proper use of OPRs. SOO coordination during design.

WHAT IS THIS THING GOING TO LOOK LIKE – SPECIFICALLY Expand BECx standard from air barrier to air, water, vapor, and thermal
performance criteria for the building envelope. LEED Silver may become optional. Window to wall ratio maximums. Continued effort to leverage energy modeling into Cx effort. Energy modeling standards. HPBS and small HPBS. Metering standards. Design phase accountability. Contracts for energy engineering/modeling, BECx, and Cx to be held
by DFCM. Life Cycle Cost Analysis. Proper use of OPRs. SOO coordination during design.

EXPANDING BECX STANDARDS
Current BECx standard is focused on air barriers. Expand BECx standard to air, water, vapor, and thermal
performance. Work with energy modeler to include BECx considerations
within modeling. Work with Cx Agent to include BECx considerations within
commissioning.

This image cannot currently be displayed.
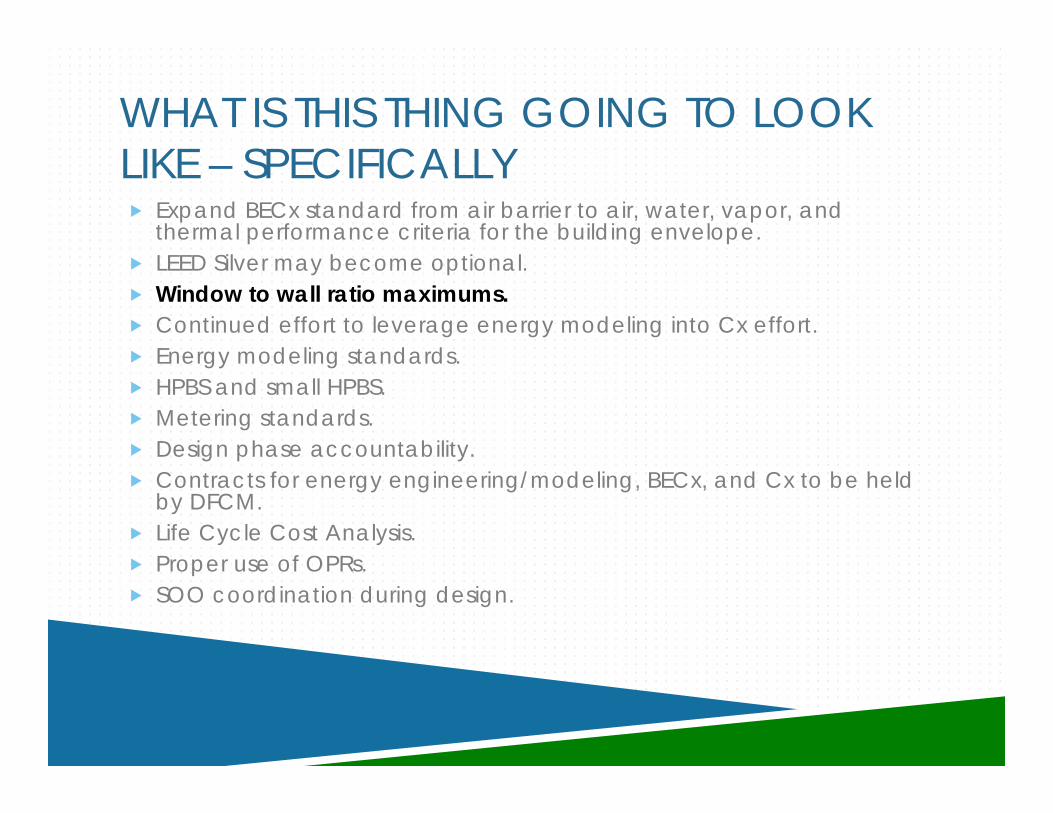
WHAT IS THIS THING GOING TO LOOK LIKE – SPECIFICALLY Expand BECx standard from air barrier to air, water, vapor, and
thermal performance criteria for the building envelope. LEED Silver may become optional. Window to wall ratio maximums. Continued effort to leverage energy modeling into Cx effort. Energy modeling standards. HPBS and small HPBS. Metering standards. Design phase accountability. Contracts for energy engineering/modeling, BECx, and Cx to be held
by DFCM. Life Cycle Cost Analysis. Proper use of OPRs. SOO coordination during design.

This image cannot currently be displayed.
urrently be displayed.
Window to Wall Ratio
jb1

Slide 214
jb1 John Maybe instead of having this slide I can quickly highlight some similar points from a UVU class room case studyjohnburningham, 4/22/2013
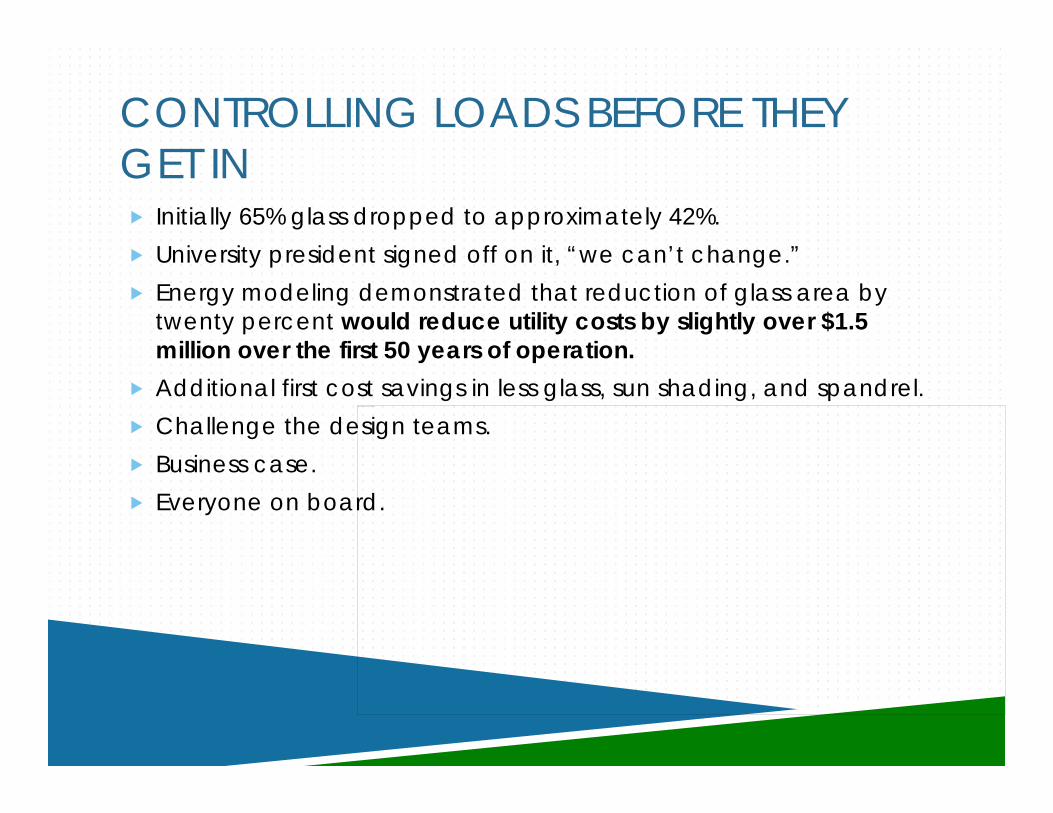
CONTROLLING LOADS BEFORE THEY GET IN Initially 65% glass dropped to approximately 42%. University president signed off on it, “we can’t change.” Energy modeling demonstrated that reduction of glass area by
twenty percent would reduce utility costs by slightly over $1.5 million over the first 50 years of operation.
Additional first cost savings in less glass, sun shading, and spandrel. Challenge the design teams. Business case. Everyone on board.
This image cannot currently be displayed.
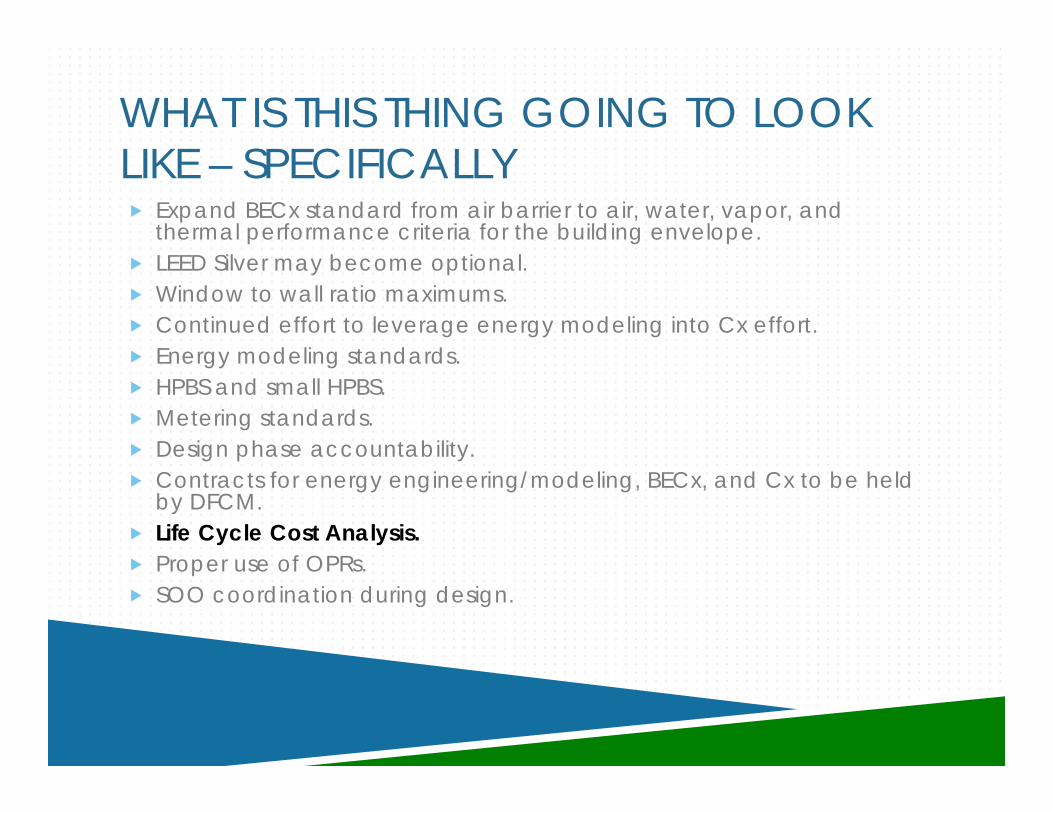
WHAT IS THIS THING GOING TO LOOK LIKE – SPECIFICALLY Expand BECx standard from air barrier to air, water, vapor, and
thermal performance criteria for the building envelope. LEED Silver may become optional. Window to wall ratio maximums. Continued effort to leverage energy modeling into Cx effort. Energy modeling standards. HPBS and small HPBS. Metering standards. Design phase accountability. Contracts for energy engineering/modeling, BECx, and Cx to be held
by DFCM. Life Cycle Cost Analysis. Proper use of OPRs. SOO coordination during design.
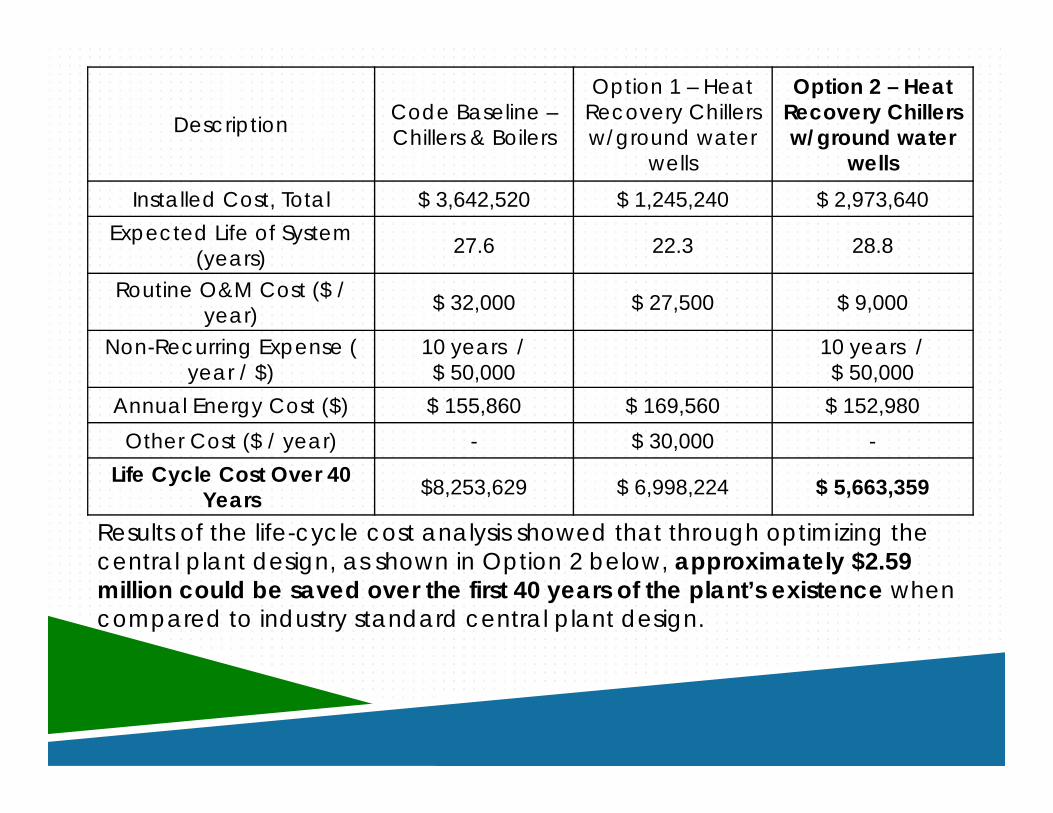
Description Code Baseline –Chillers & Boilers
Option 1 – Heat Recovery Chillers w/ground water
wells
Option 2 – Heat Recovery Chillers w/ground water
wellsInstalled Cost, Total $ 3,642,520 $ 1,245,240 $ 2,973,640
Expected Life of System (years) 27.6 22.3 28.8
Routine O&M Cost ($ / year) $ 32,000 $ 27,500 $ 9,000
Non-Recurring Expense ( year / $)
10 years / $ 50,000
10 years / $ 50,000
Annual Energy Cost ($) $ 155,860 $ 169,560 $ 152,980Other Cost ($ / year) - $ 30,000 -
Life Cycle Cost Over 40 Years $8,253,629 $ 6,998,224 $ 5,663,359
Results of the life-cycle cost analysis showed that through optimizing the central plant design, as shown in Option 2 below, approximately $2.59 million could be saved over the first 40 years of the plant’s existence when compared to industry standard central plant design.

GOALS Achieve desired performance for all buildings. Minimize Owner risk through this comprehensive approach. Provide best value for tax payers. Raise the design and construction bar via a whole building air
testing requirement and remediation if there is a failure. True whole building commissioning. Increase durability. Use industry-leading technology to achieve efficient and
economical buildings. Use a collaborative approach to take advantage of high
performance. Use anticipated leakage rates to minimize mechanical equipment size.
THANK YOULynn Hinrichs, RAMatthias Mueller, AIAJohn Burningham, Assoc AIA, LEED APJohn Runkle, P.E.
This image cannot currently be displayed.
This image cannot currently be displayed.
Architectural Testing Inc.
DFCM
This image cannot currently be displayed.
This image cannot currently be displayed.
This image cannot currently be displayed.