Cera Sanitaryware ltd (NSE code CERA) - Katalyst Wealth alpha recommendation
Upload
marshall-wilsonCategory
view
215download
0
Turnaround Schools in California: Who Are They
andWhat Strategies Do They
Use?Mette Huberman, AIR
CERA ConferenceDecember 2, 2011

Study Background
• Study part of California Comprehensive Center– One of 16 regional centers; AIR subcontractor to WestEd
• Federal and state focus on turnaround schools– No Child Left Behind (NCLB)– School Improvement Grants (SIG)
• SIG schools lowest 5% of schools; no definition of turnaround
• Four turnaround models– 1) Transformation; 2) Turnaround; 3) Restart; 4) Closure

Study Background (cont.)
• A need for definitions of both low performance and turnaround
• Different definitions and strategies identified in the literature
• Purpose of current study– Definition of low performance and
turnaround in California (not SIG schools)– Identification of strategies in sample of
schools

School Selection Methodology
• All CA schools, including charters• Seven year period
– Pre-turnaround, 3 years (2003-2005)– Turnaround, 3 years (2006-2009)– Sustainability, 1 year (2009-2010)
• Use of average ELA and math standardized California Standards Test mean scale scores
• Ten criteria for defining turnaround
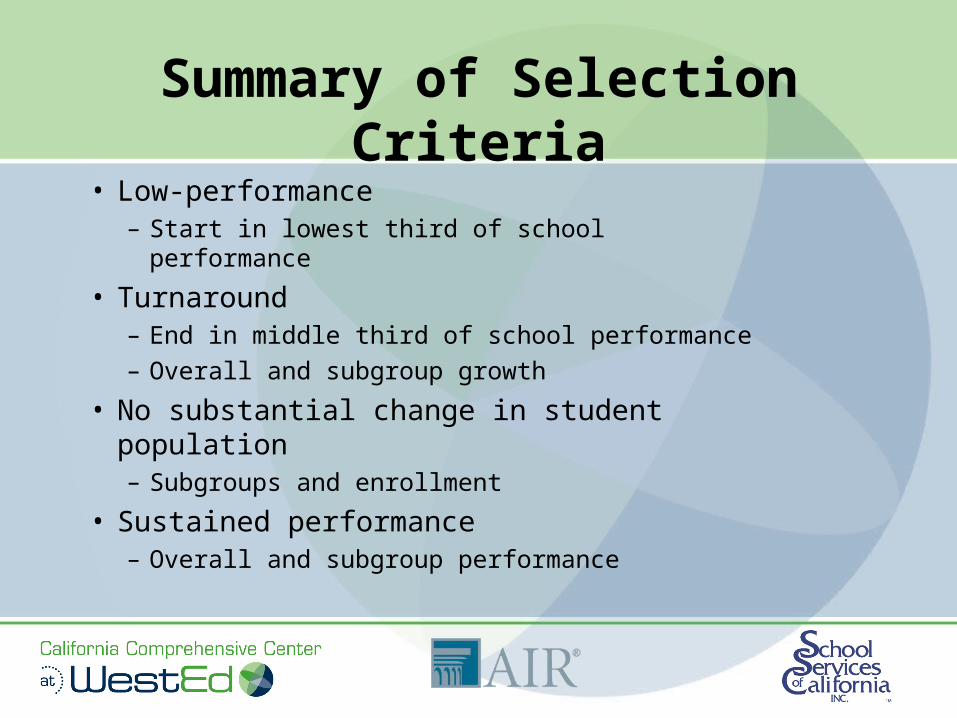
Summary of Selection Criteria
• Low-performance– Start in lowest third of school performance
• Turnaround– End in middle third of school performance– Overall and subgroup growth
• No substantial change in student population– Subgroups and enrollment
• Sustained performance– Overall and subgroup performance

Selection of School Sample
• Ordered the 44 schools from highest to lowest growth– 35 elementary schools– 4 middle schools– 5 high schools
• Selected 10 schools: 4 ES, 3 MS, 3 HS– Demographic diversity– Excluded one high school from analysis

School Demographics
Schools Districts Grade Span Enrollment Poverty ELs Elementary Schools Del Rey Elementary Sanger Unified K–6 269 94% 50% 122nd Street Elementary Los Angeles Unified K–5 674 86% 53% St. Hope PS7 Charter Sacramento City Unified K–8 378 63% 3% Silver Wing Elementary Chula Vista Elementary K–6 430 66% 56%
State Average 529 58% 28%Middle Schools
General Grant Middle Kings Canyon Joint Unified 6–8 548 91% 37% Mountain View Middle Chatom Union Elementary 6–8 222 75% 44% Prairie Vista Middle Hawthorne Elementary 6–8 1,028 92% 30%
State Average 825 56% 19%High Schools Kerman High Kerman Unified 9–12 1,201 71% 22% Sweetwater High Sweetwater Union High 9–12 2,456 84% 28%
State Average 1,394 50% 14%

School Performance
Data Collection Process
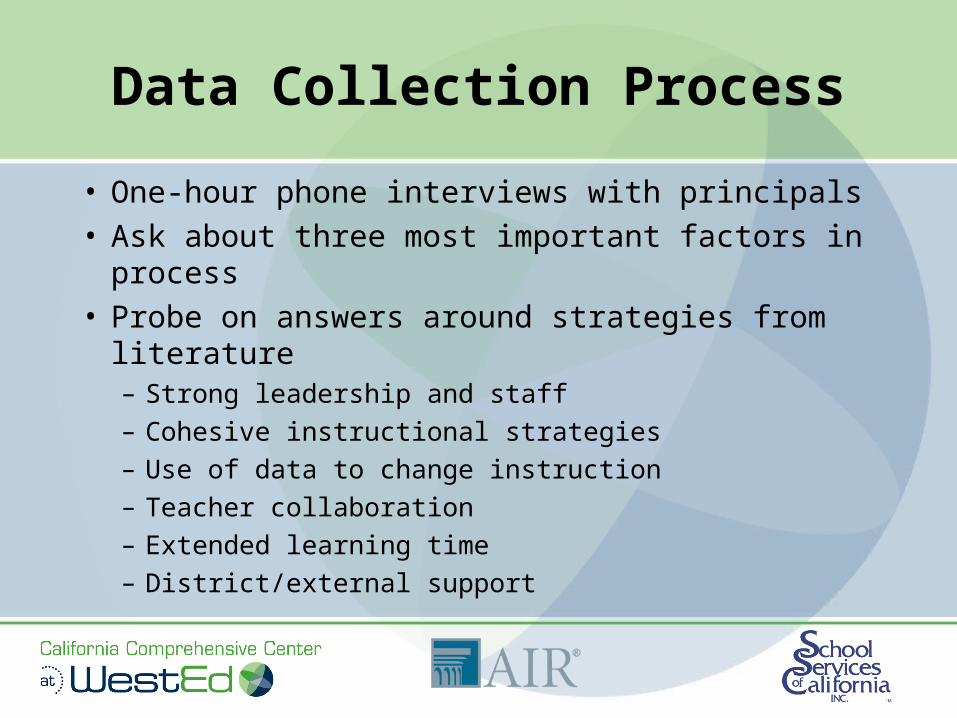
• One-hour phone interviews with principals• Ask about three most important factors in
process• Probe on answers around strategies from
literature– Strong leadership and staff– Cohesive instructional strategies– Use of data to change instruction– Teacher collaboration– Extended learning time– District/external support

Eight Strategies Across Schools
1. Instructional strategies focused on student subgroups– Shadowing of English learners (Mountain View MS)
2. An emphasis on teacher collaboration– District-wide Professional Learning Communities (Del
Rey ES)
3. Strong instructional leadership– In classrooms, doing walk-throughs, providing feedback
School Strategies (cont.)
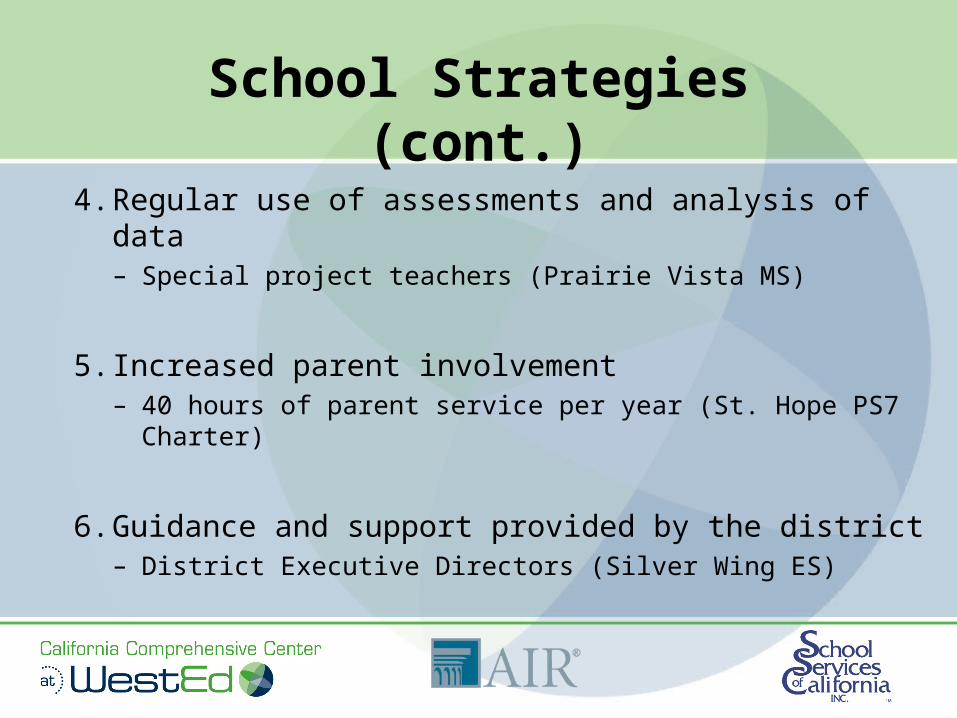
4. Regular use of assessments and analysis of data– Special project teachers (Prairie Vista MS)
5. Increased parent involvement– 40 hours of parent service per year (St. Hope PS7
Charter)
6. Guidance and support provided by the district– District Executive Directors (Silver Wing ES)

School Strategies (cont.)
7. Use of student engagement strategies– Gradual Release of Responsibility (GRR) (Silver
Wing ES)
8. Use of extended learning time– After school, Saturday, and support classes
(Sweetwater HS)

School Profile: 122nd St Elem, LAUSD
• Demographics: K-5; 674 students; 86% poverty; 53% ELs
• Performance: PI Year 2; 2010-11: CA Distinguished School and Title I Awards
• Strategies– Quick wins (school facilities and parent involvement)– Professional development– Coaching– Teacher collaboration
• Challenges– Layoffs; tutoring program cut; low morale
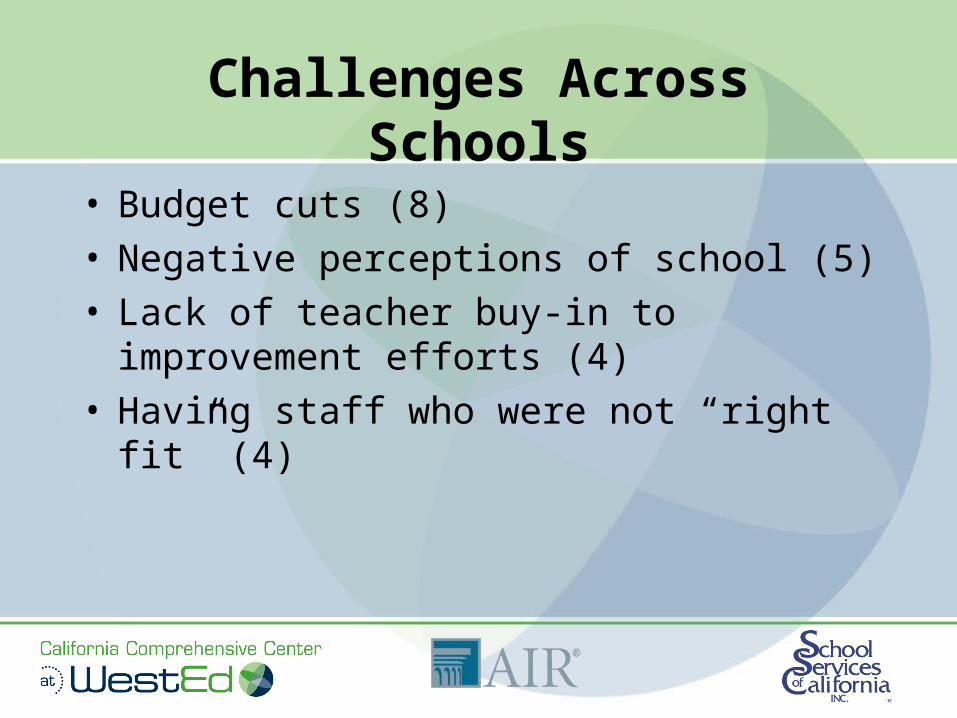
Challenges Across Schools
• Budget cuts (8)• Negative perceptions of school (5)• Lack of teacher buy-in to improvement
efforts (4)• Having staff who were not “right fit” (4)

Policy and Practice Implications
• Clearly define both low performance and turnaround• Too much emphasis on replacement of staff in
current SIG models• Focus on how to assist and improve existing staff
instead• Define role of district in turnaround process• Create structures for sharing best practices• Study turnaround schools that are able to sustain
performance versus schools that are not

Webinar
• Webinar on Schools Moving Up• December 8, 10:30 am – 12:00 pm• Strategies for School Turnaround:
School and District Level Perspectives
• Two research perspectives and reflections from practitioner
• http://www.schoolsmovingup.net/webinars/turnaround

Mette HubermanAmerican Institutes for
Questions or Comments?
California Collaborative on District Reform17