
Turn Your Marketing Into an Investment. Accountable Responsible Blame Excuses Denial Ownership.
17
Turn Your Marketing Into an Investment
-
Upload
georgina-simon -
Category
Documents
-
view
215 -
download
0
Transcript of Turn Your Marketing Into an Investment. Accountable Responsible Blame Excuses Denial Ownership.

Turn Your Marketing Into an Investment
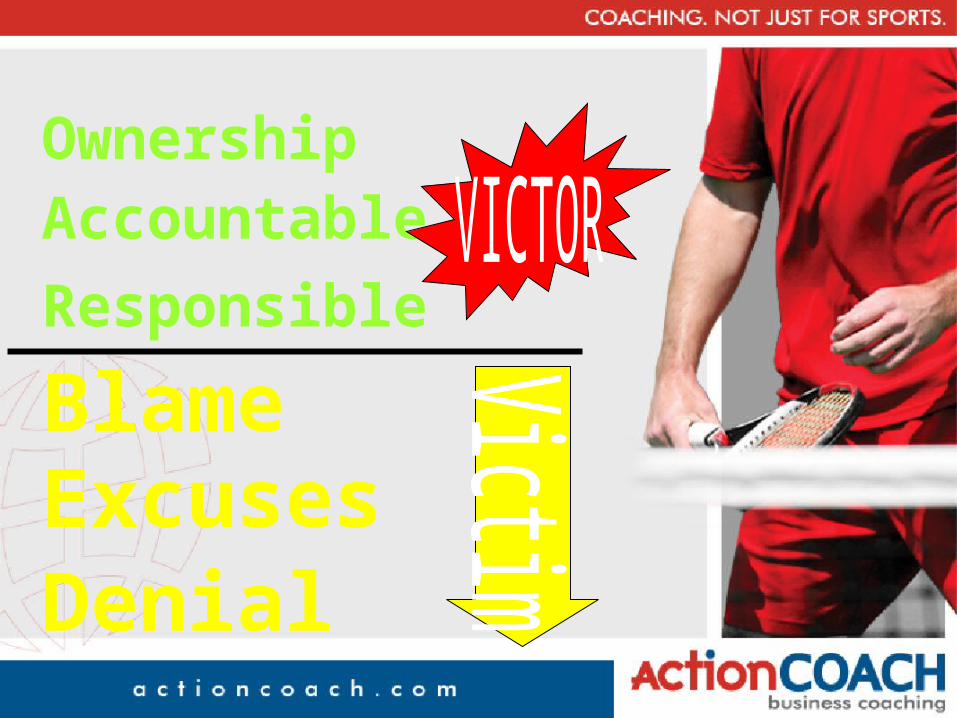
Accountable
Responsible
BlameExcusesDenial
Ownership

PARTICIPATE ...Is the Failure to
The ONLY
Give 100% andyou’ll get 100% ...
Failure ...

I KNOW
To Make Sure You Get the Most Out of Your
Learning…
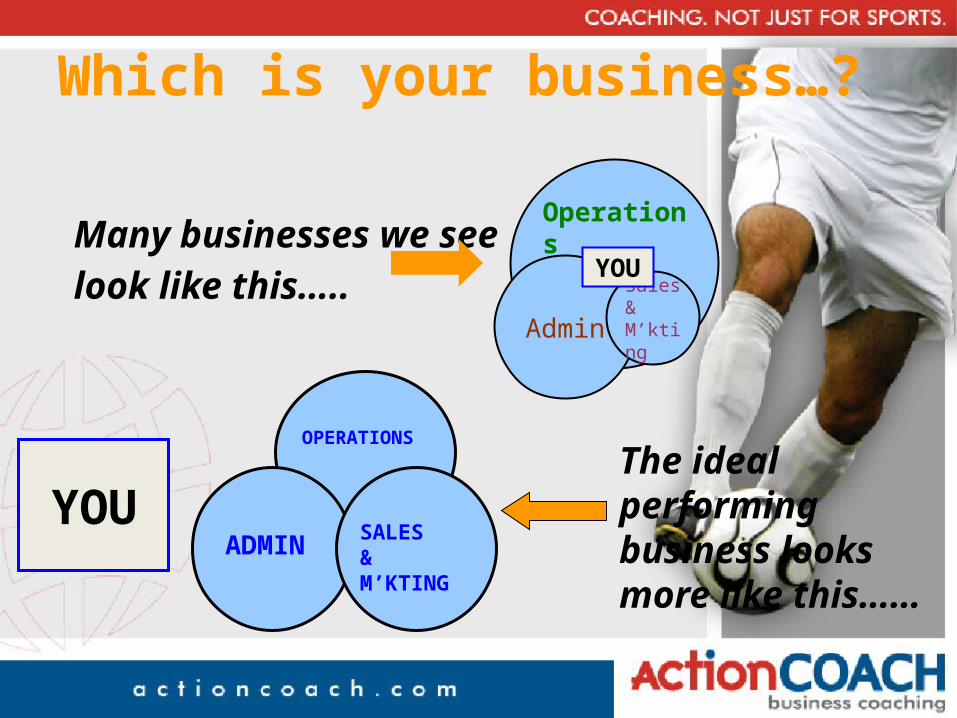
Operations
AdminSales & M’kting
YOUMany businesses we see look like this…..
OPERATIONS
ADMINSALES & M’KTING
YOUThe ideal performing business looks more like this……
Which is your business…?
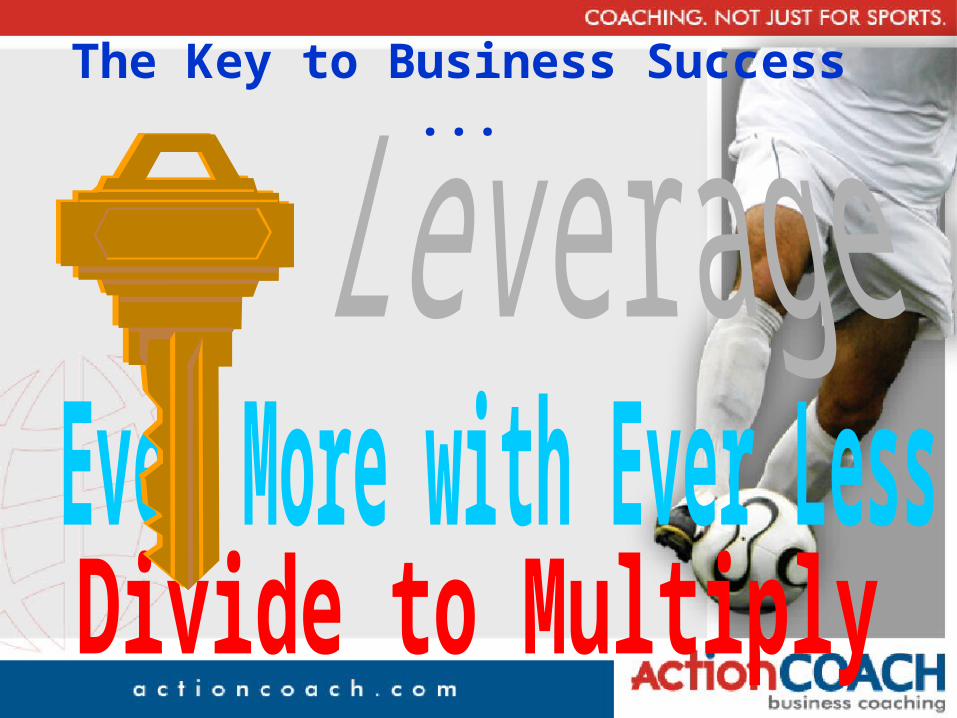
The Key to Business Success ...
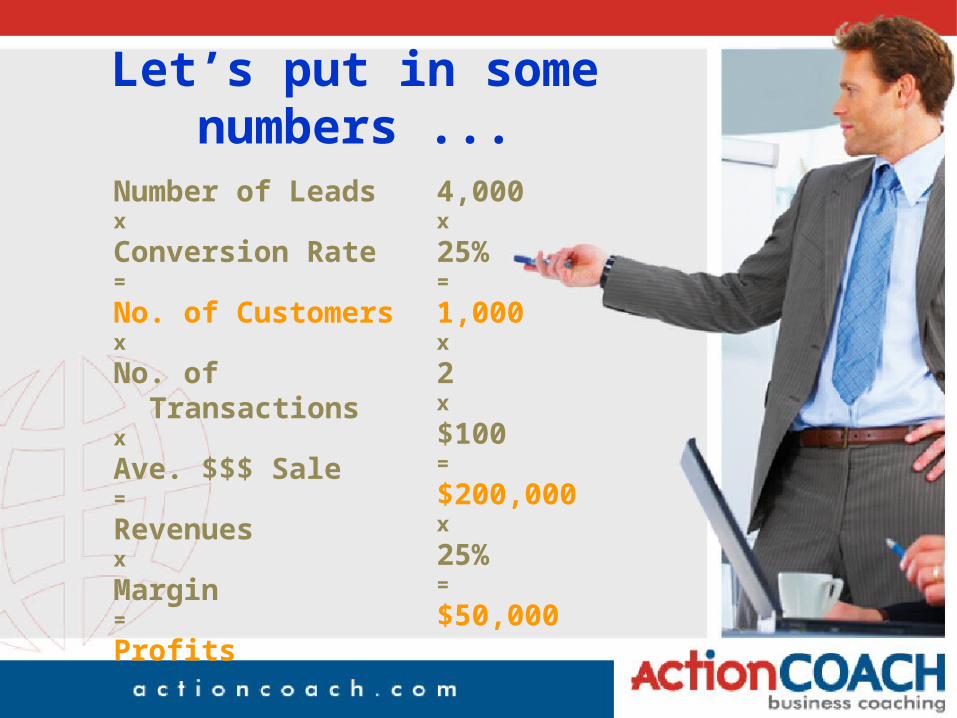
Number of Leadsx
Conversion Rate=
No. of Customersx
No. of Transactionsx
Ave. $$$ Sale=
Revenuesx
Margin =
Profits
4,000x
25%=
1,000x
2x
$100=
$200,000x
25% =
$50,000
Let’s put in some numbers ...
Number of Leadsx
Conversion Rate=
No. of Customersx
No. of Transactionsx
Ave. $$$ Sale=
Revenuesx
Margin =
Profits
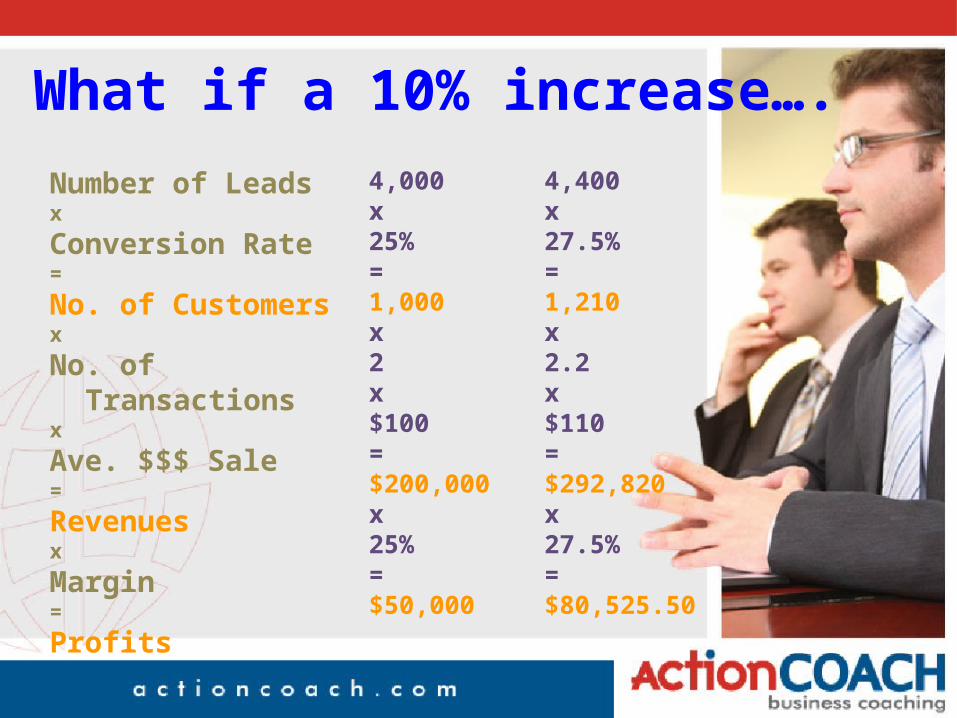
4,000x25%=1,000x2x$100=$200,000x25% =$50,000
4,400x27.5%=1,210x2.2x$110=$292,820x27.5% =$80,525.50
What if a 10% increase….
Number of Leadsx
Conversion Rate=
No. of Customersx
No. of Transactionsx
Ave. $$$ Sale=
Revenuesx
Margin =
Profits
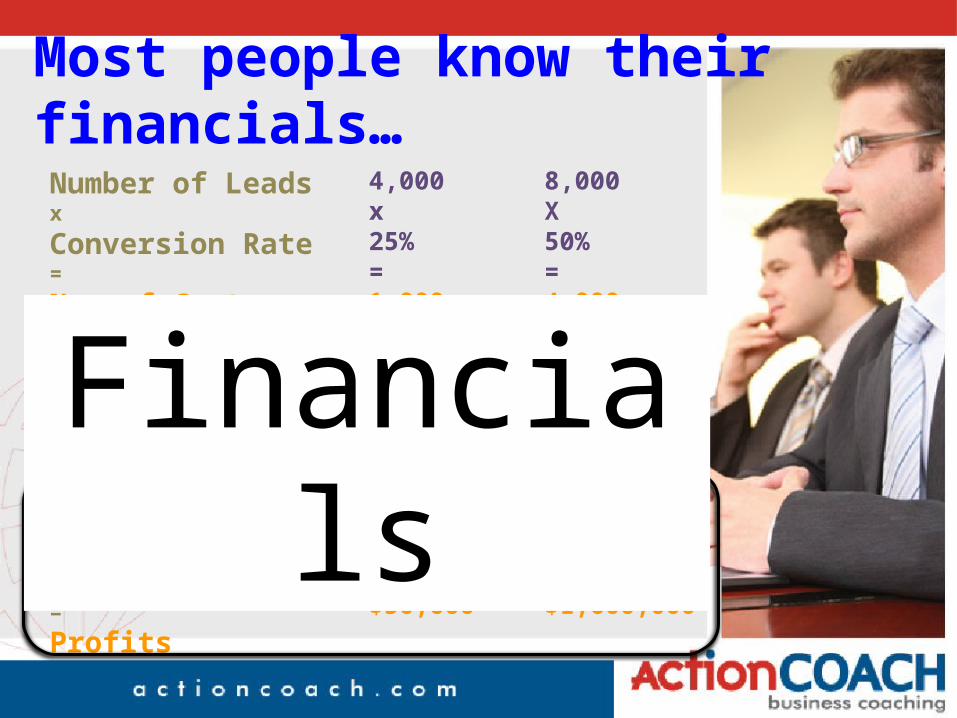
4,000x25%=1,000x2x$100=$200,000x25% =$50,000
8,000X50%=4,000X4x$200=$3,200,000X50% =$1,600,000
Most people know their financials…
Financials
Number of Leadsx
Conversion Rate=
No. of Customersx
No. of Transactionsx
Ave. $$$ Sale=
Revenuesx
Margin =
Profits
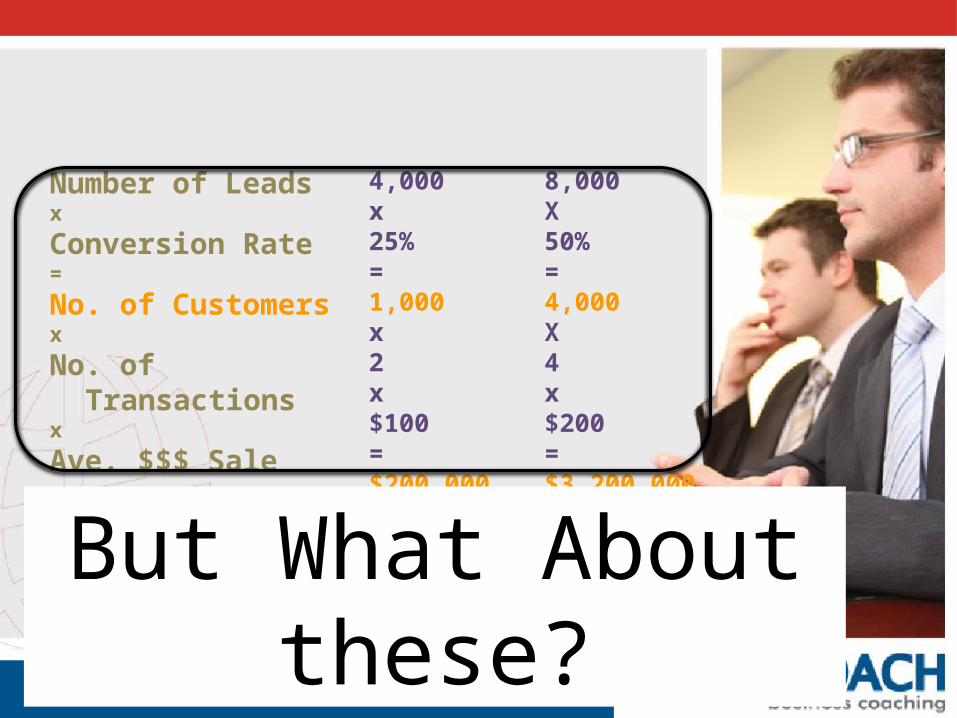
4,000x25%=1,000x2x$100=$200,000x25% =$50,000
8,000X50%=4,000X4x$200=$3,200,000X50% =$1,600,000
But What About these?
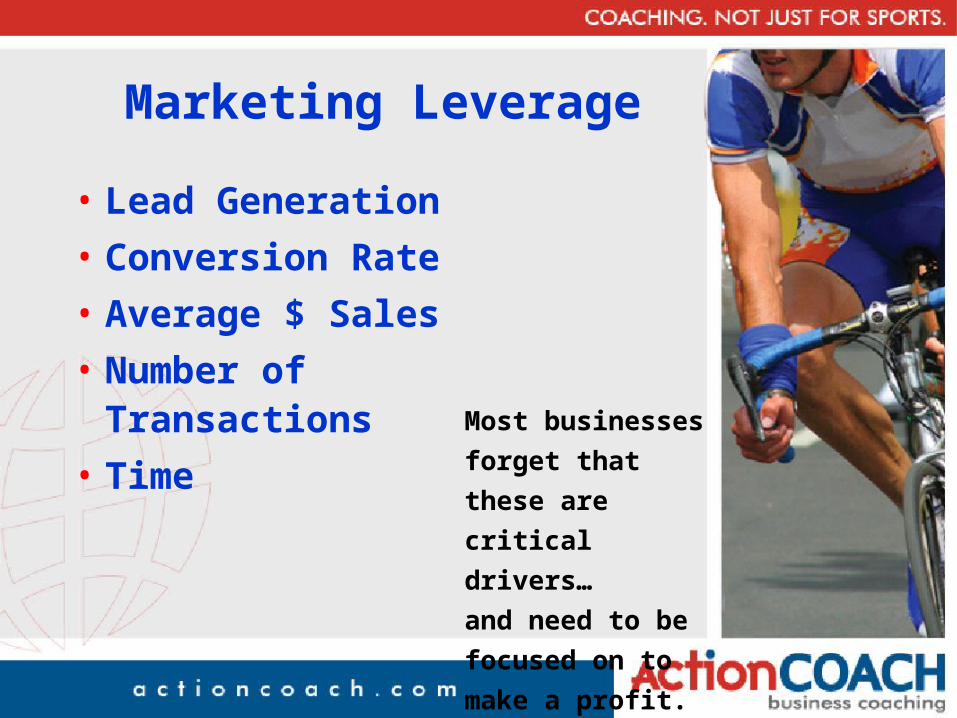
Marketing Leverage
• Lead Generation• Conversion Rate• Average $ Sales• Number of Transactions• Time Most businesses
forget that these are
critical drivers…
and need to be
focused on to make
a profit.
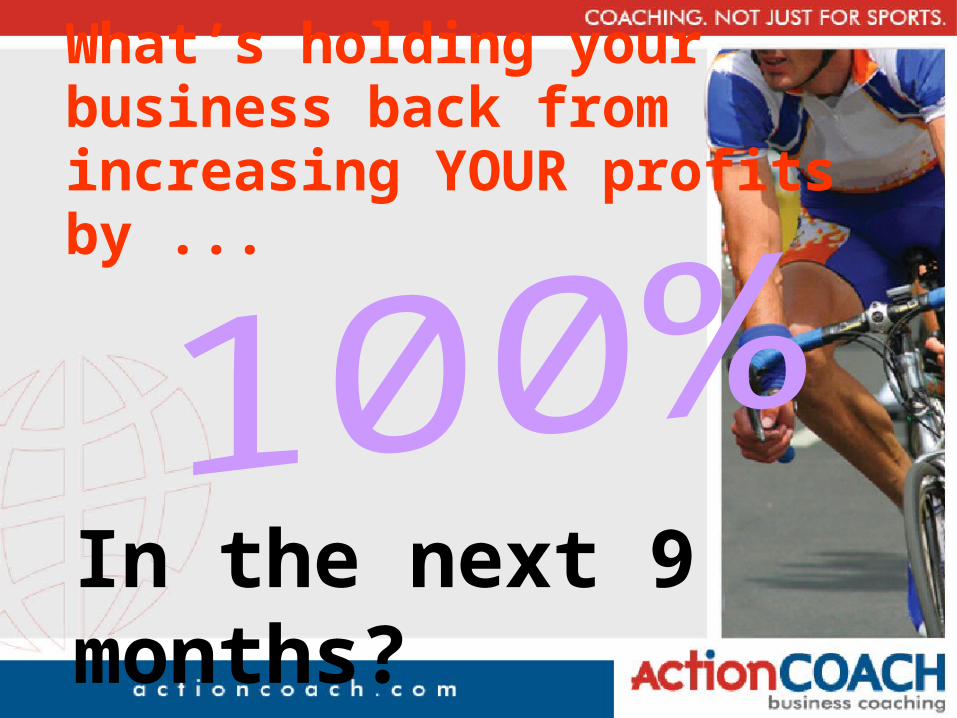
What’s holding your business back from increasing YOUR profits by ...
In the next 9 months?
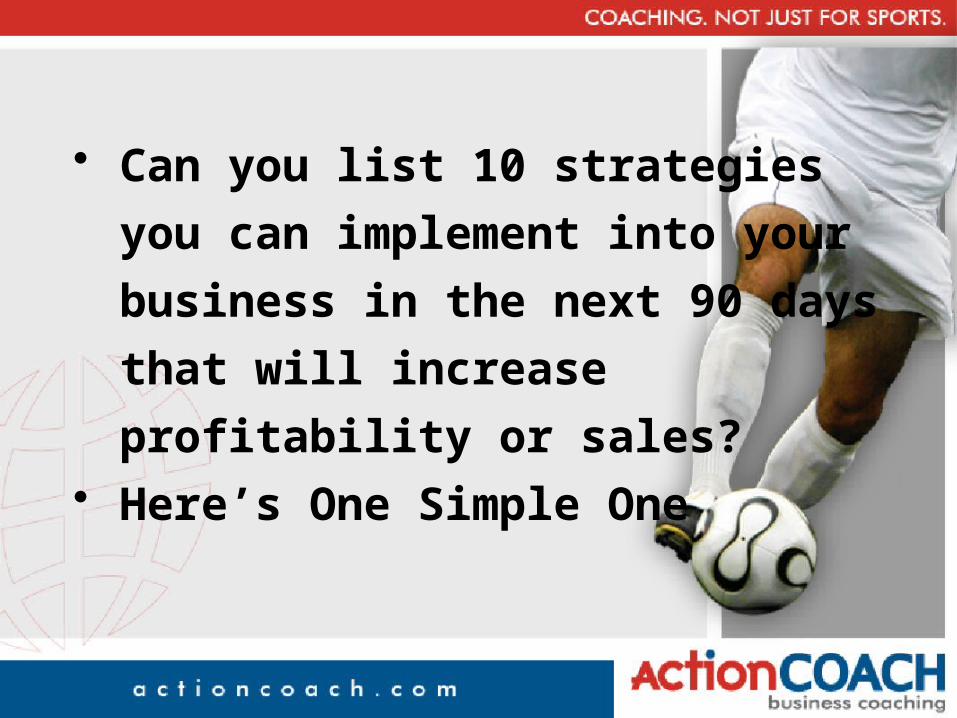
• Can you list 10 strategies you can
implement into your business in the
next 90 days that will increase
profitability or sales?• Here’s One Simple One
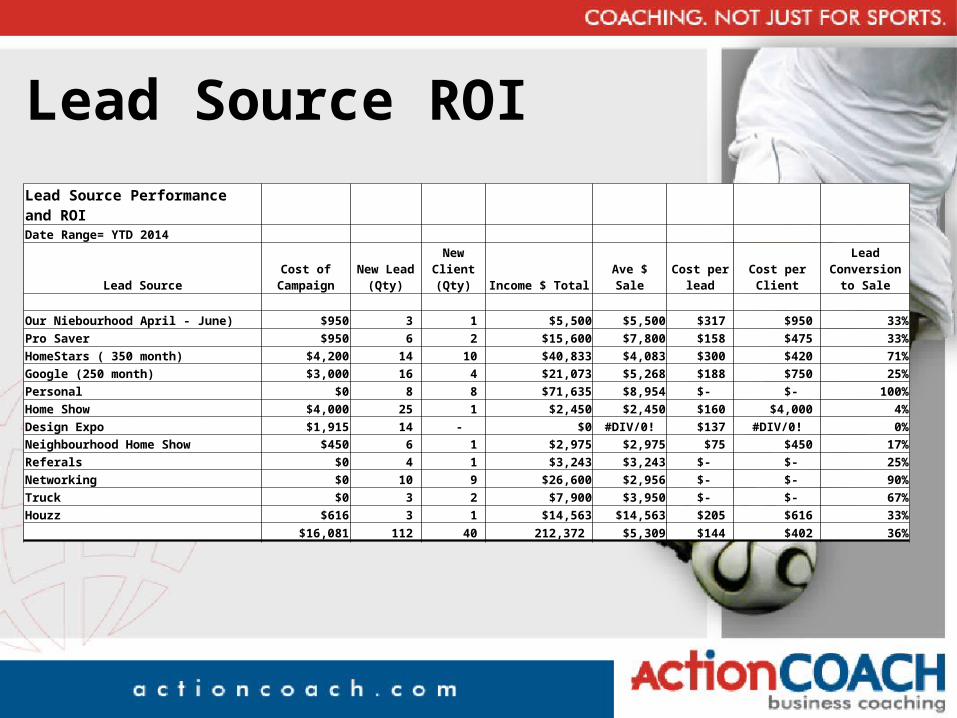
Lead Source ROI
Lead Source Performance and ROI Date Range= YTD 2014
Lead Source Cost of CampaignNew Lead
(Qty)New Client
(Qty) Income $ Total Ave $ Sale Cost per lead Cost per ClientLead Conversion
to Sale Our Niebourhood April - June) $950 3 1 $5,500 $5,500 $317 $950 33%Pro Saver $950 6 2 $15,600 $7,800 $158 $475 33%HomeStars ( 350 month) $4,200 14 10 $40,833 $4,083 $300 $420 71%Google (250 month) $3,000 16 4 $21,073 $5,268 $188 $750 25%Personal $0 8 8 $71,635 $8,954 $- $- 100%Home Show $4,000 25 1 $2,450 $2,450 $160 $4,000 4%Design Expo $1,915 14 - $0 #DIV/0! $137 #DIV/0! 0%Neighbourhood Home Show $450 6 1 $2,975 $2,975 $75 $450 17%Referals $0 4 1 $3,243 $3,243 $- $- 25%Networking $0 10 9 $26,600 $2,956 $- $- 90%Truck $0 3 2 $7,900 $3,950 $- $- 67%Houzz $616 3 1 $14,563 $14,563 $205 $616 33% $16,081 112 40 212,372 $5,309 $144 $402 36%
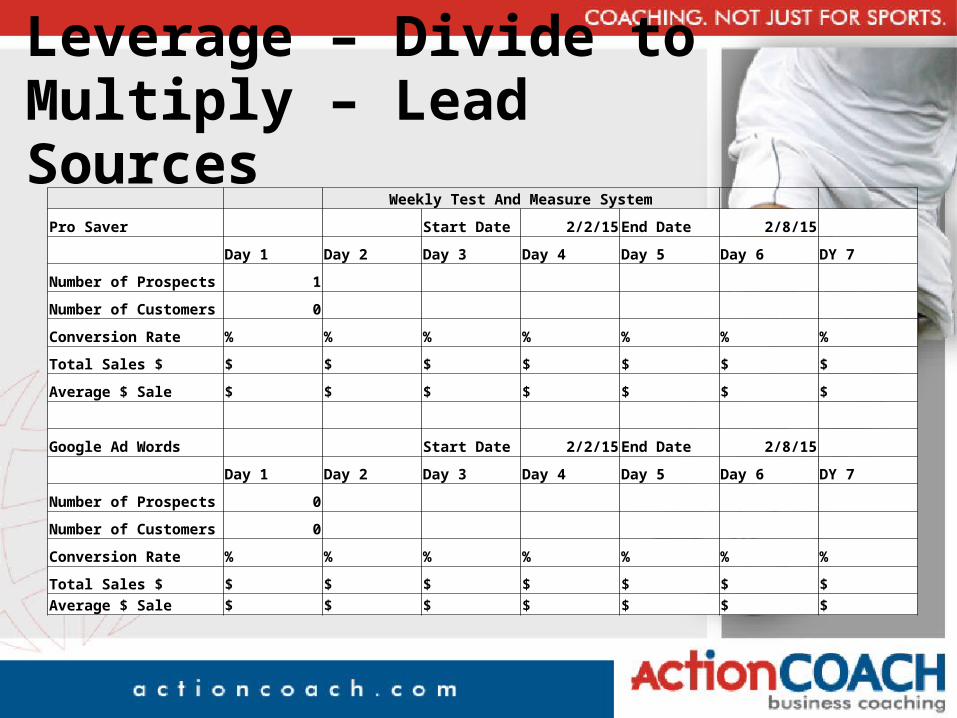
Leverage – Divide to Multiply – Lead Sources
Weekly Test And Measure System
Pro Saver Start Date 2/2/15 End Date 2/8/15
Day 1 Day 2 Day 3 Day 4 Day 5 Day 6 DY 7
Number of Prospects 1
Number of Customers 0
Conversion Rate % % % % % % %
Total Sales $ $ $ $ $ $ $ $
Average $ Sale $ $ $ $ $ $ $
Google Ad Words Start Date 2/2/15 End Date 2/8/15
Day 1 Day 2 Day 3 Day 4 Day 5 Day 6 DY 7
Number of Prospects 0
Number of Customers 0
Conversion Rate % % % % % % %
Total Sales $ $ $ $ $ $ $ $Average $ Sale $ $ $ $ $ $ $
HomeFUN…
• Create your Lead Source ROI Spreadsheet

Now it’s time to ...