Turkey Steel Exports Report 2017 · Turkey is the world’s eighth-largest steel exporter. In 2017,...
8
1 Steel Exports Report: Turkey March 2018 Background Turkey is the world’s eighth-largest steel exporter. In 2017, Turkey exported 16.2 million metric tons of steel, an 8 percent increase from 15 million metric tons in 2016. Turkey’s exports represented about 3 percent of all steel exported globally in 2016, based on available data. The volume of Turkey’s 2017 steel exports was 1.2 million metric tons less than the seventh-largest exporter, Italy, and roughly one-fourth the size of the largest exporter, China. In value terms, steel represented just 5.8 percent of the total amount of goods Turkey exported in 2017. Turkey exports steel to 200 countries and territories. The ten countries highlighted in the map below represent the top markets for Turkey’s exports of steel, receiving more than 400 thousand metric tons each and accounting for 52 percent of Turkey’s steel exports in 2017. Quick Facts: ● World’s eighth-largest steel exporter: 16.2 million metric tons ● 12% decline in steel exports since 2012 ● Exports as a share of production down from 45.3% in 2016 to 43.3% in 2017 ● Year-on-year export volume up 8%, value up 33% ● Top three markets: United States, Israel, Italy ● Largest producers: Erdemir Group, İçdaş, Habaş ● 18 trade remedies in effect in 5 countries involving steel mill imports from Turkey Turkey’s Exports of Steel Mill Products ‐ 2017 Data Source: Global Trade Atlas; Copyright © IHS Global, Ltd., 2018. All rights reserved.
Transcript of Turkey Steel Exports Report 2017 · Turkey is the world’s eighth-largest steel exporter. In 2017,...
1
Steel Exports Report: Turkey March 2018 Background
Turkey is the world’s eighth-largest steel exporter. In 2017, Turkey exported 16.2 million metric tons of steel, an 8 percent increase from 15 million metric tons in 2016. Turkey’s exports represented about 3 percent of all steel exported globally in 2016, based on available data. The volume of Turkey’s 2017 steel exports was 1.2 million metric tons less than the seventh-largest exporter, Italy, and roughly one-fourth the size of the largest exporter, China. In value terms, steel represented just 5.8 percent of the total amount of goods Turkey exported in 2017.
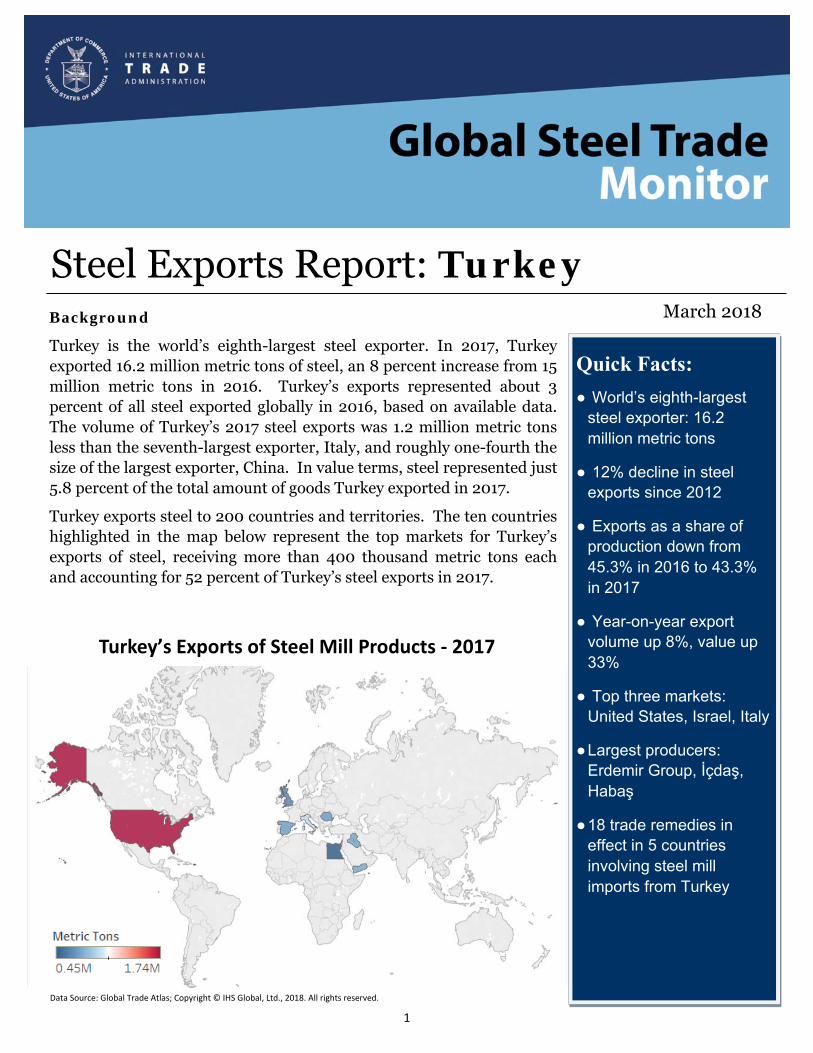
Turkey exports steel to 200 countries and territories. The ten countries highlighted in the map below represent the top markets for Turkey’s exports of steel, receiving more than 400 thousand metric tons each and accounting for 52 percent of Turkey’s steel exports in 2017.
Quick Facts:
● World’s eighth-largest steel exporter: 16.2 million metric tons
● 12% decline in steel exports since 2012
● Exports as a share of production down from 45.3% in 2016 to 43.3% in 2017
● Year-on-year export volume up 8%, value up 33%
● Top three markets: United States, Israel, Italy
● Largest producers: Erdemir Group, İçdaş, Habaş
● 18 trade remedies in effect in 5 countries involving steel mill imports from Turkey
Turkey’s Exports of Steel Mill Products ‐ 2017
Data Source: Global Trade Atlas; Copyright © IHS Global, Ltd., 2018. All rights reserved.
2
Steel Trade Balance
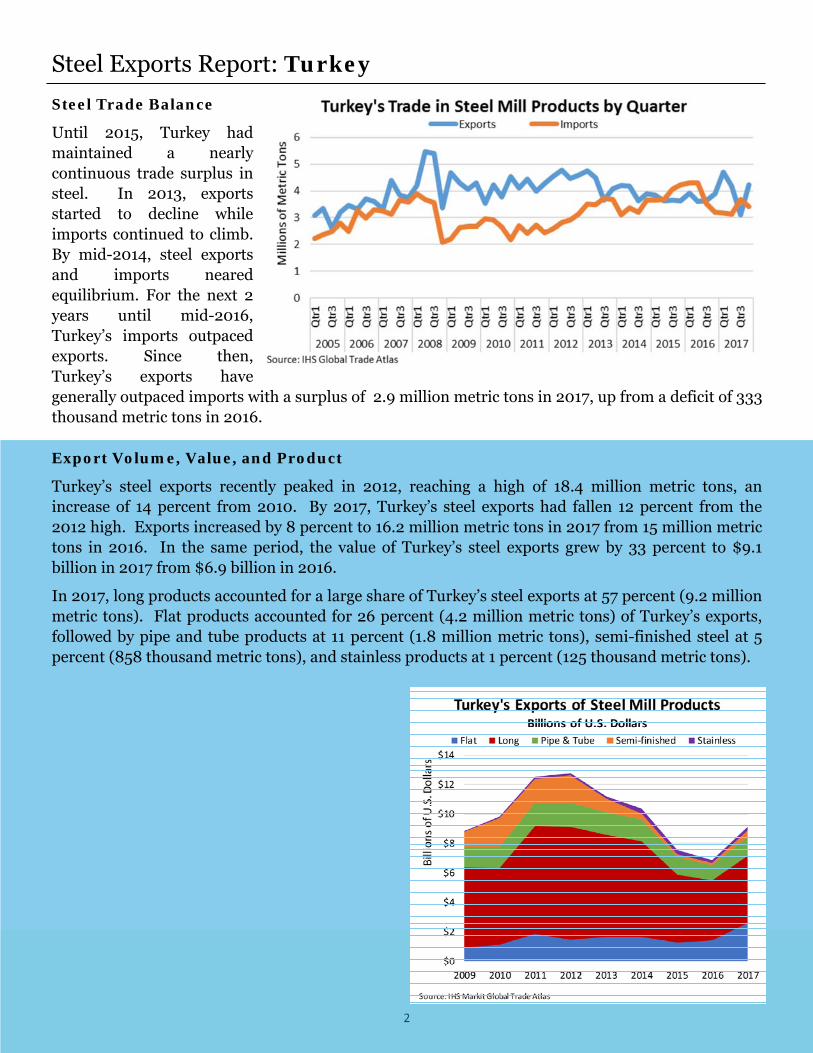
Until 2015, Turkey had maintained a nearly continuous trade surplus in steel. In 2013, exports started to decline while imports continued to climb. By mid-2014, steel exports and imports neared equilibrium. For the next 2 years until mid-2016, Turkey’s imports outpaced exports. Since then, Turkey’s exports have generally outpaced imports with a surplus of 2.9 million metric tons in 2017, up from a deficit of 333 thousand metric tons in 2016.
Steel Exports Report: Turkey
Export Volume, Value, and Product
Turkey’s steel exports recently peaked in 2012, reaching a high of 18.4 million metric tons, an increase of 14 percent from 2010. By 2017, Turkey’s steel exports had fallen 12 percent from the 2012 high. Exports increased by 8 percent to 16.2 million metric tons in 2017 from 15 million metric tons in 2016. In the same period, the value of Turkey’s steel exports grew by 33 percent to $9.1 billion in 2017 from $6.9 billion in 2016.
In 2017, long products accounted for a large share of Turkey’s steel exports at 57 percent (9.2 million metric tons). Flat products accounted for 26 percent (4.2 million metric tons) of Turkey’s exports, followed by pipe and tube products at 11 percent (1.8 million metric tons), semi-finished steel at 5 percent (858 thousand metric tons), and stainless products at 1 percent (125 thousand metric tons).
3
Steel Exports Report: Turkey
Exports by Top Market
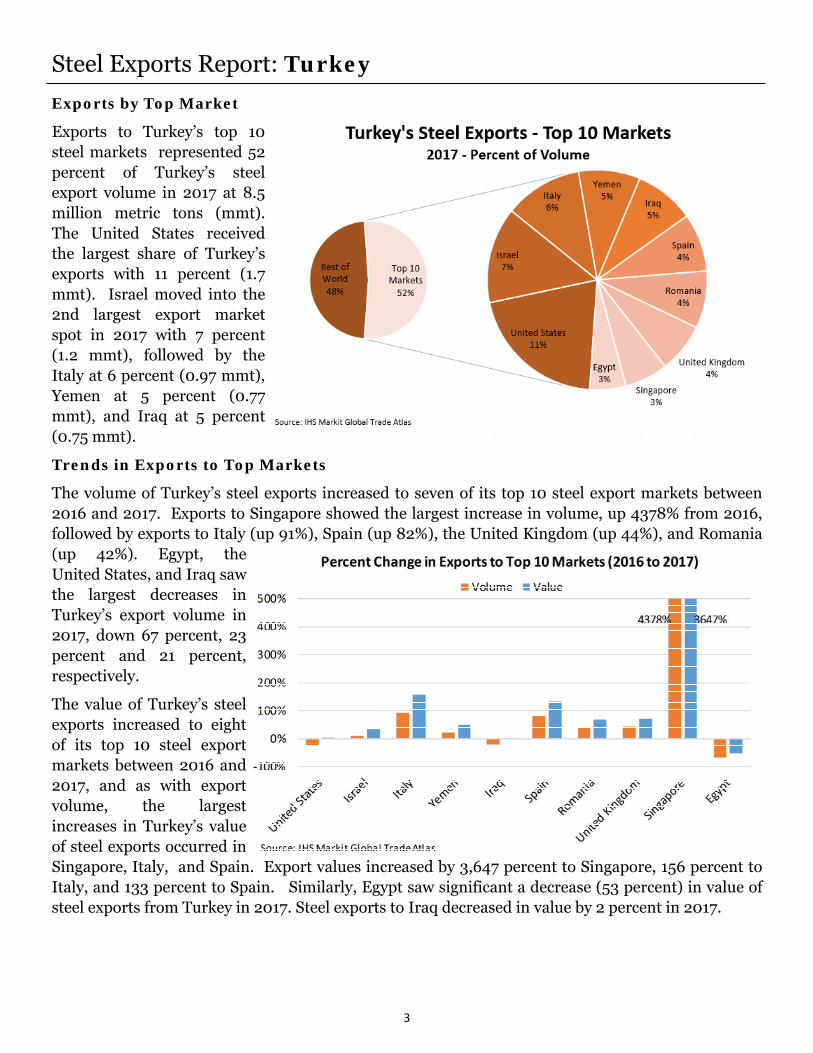
Exports to Turkey’s top 10 steel markets represented 52 percent of Turkey’s steel export volume in 2017 at 8.5 million metric tons (mmt). The United States received the largest share of Turkey’s exports with 11 percent (1.7 mmt). Israel moved into the 2nd largest export market spot in 2017 with 7 percent (1.2 mmt), followed by the Italy at 6 percent (0.97 mmt), Yemen at 5 percent (0.77 mmt), and Iraq at 5 percent (0.75 mmt).
Trends in Exports to Top Markets
The volume of Turkey’s steel exports increased to seven of its top 10 steel export markets between 2016 and 2017. Exports to Singapore showed the largest increase in volume, up 4378% from 2016, followed by exports to Italy (up 91%), Spain (up 82%), the United Kingdom (up 44%), and Romania (up 42%). Egypt, the United States, and Iraq saw the largest decreases in Turkey’s export volume in 2017, down 67 percent, 23 percent and 21 percent, respectively.
The value of Turkey’s steel exports increased to eight of its top 10 steel export markets between 2016 and 2017, and as with export volume, the largest increases in Turkey’s value of steel exports occurred in Singapore, Italy, and Spain. Export values increased by 3,647 percent to Singapore, 156 percent to Italy, and 133 percent to Spain. Similarly, Egypt saw significant a decrease (53 percent) in value of steel exports from Turkey in 2017. Steel exports to Iraq decreased in value by 2 percent in 2017.
4
Steel Exports Report: Turkey Top Markets by Steel Product Category
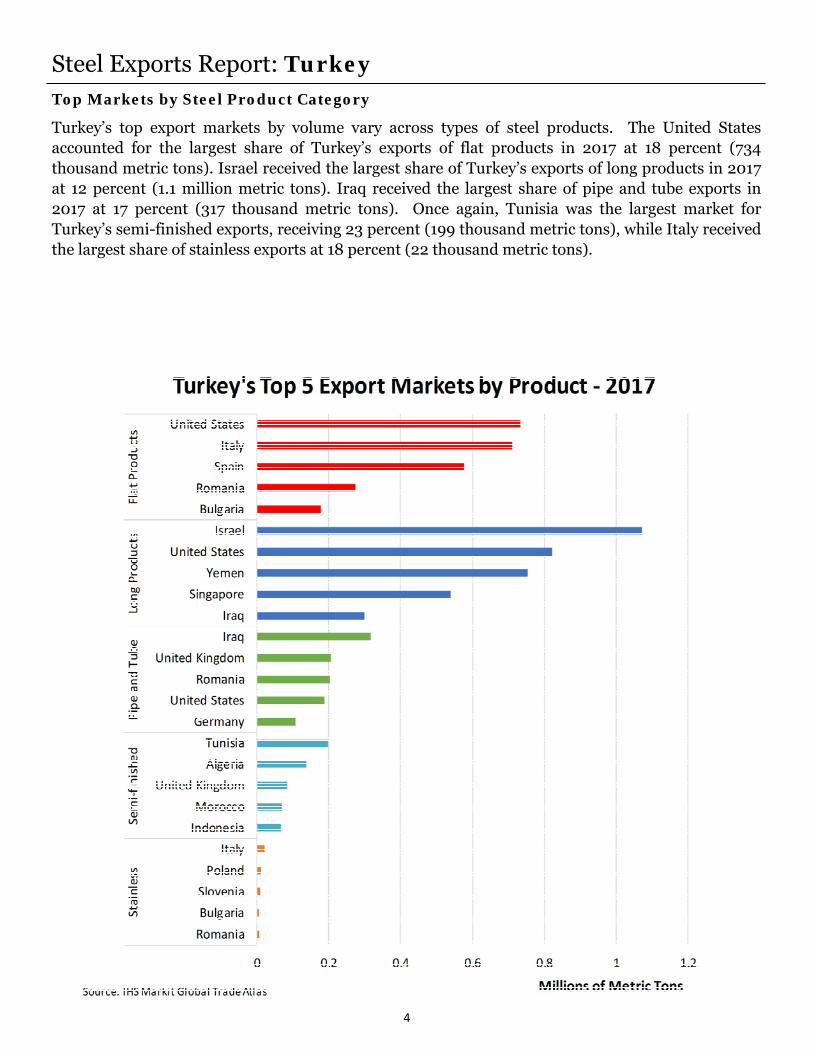
Turkey’s top export markets by volume vary across types of steel products. The United States accounted for the largest share of Turkey’s exports of flat products in 2017 at 18 percent (734 thousand metric tons). Israel received the largest share of Turkey’s exports of long products in 2017 at 12 percent (1.1 million metric tons). Iraq received the largest share of pipe and tube exports in 2017 at 17 percent (317 thousand metric tons). Once again, Tunisia was the largest market for Turkey’s semi-finished exports, receiving 23 percent (199 thousand metric tons), while Italy received the largest share of stainless exports at 18 percent (22 thousand metric tons).
5
Steel Exports Report: Turkey
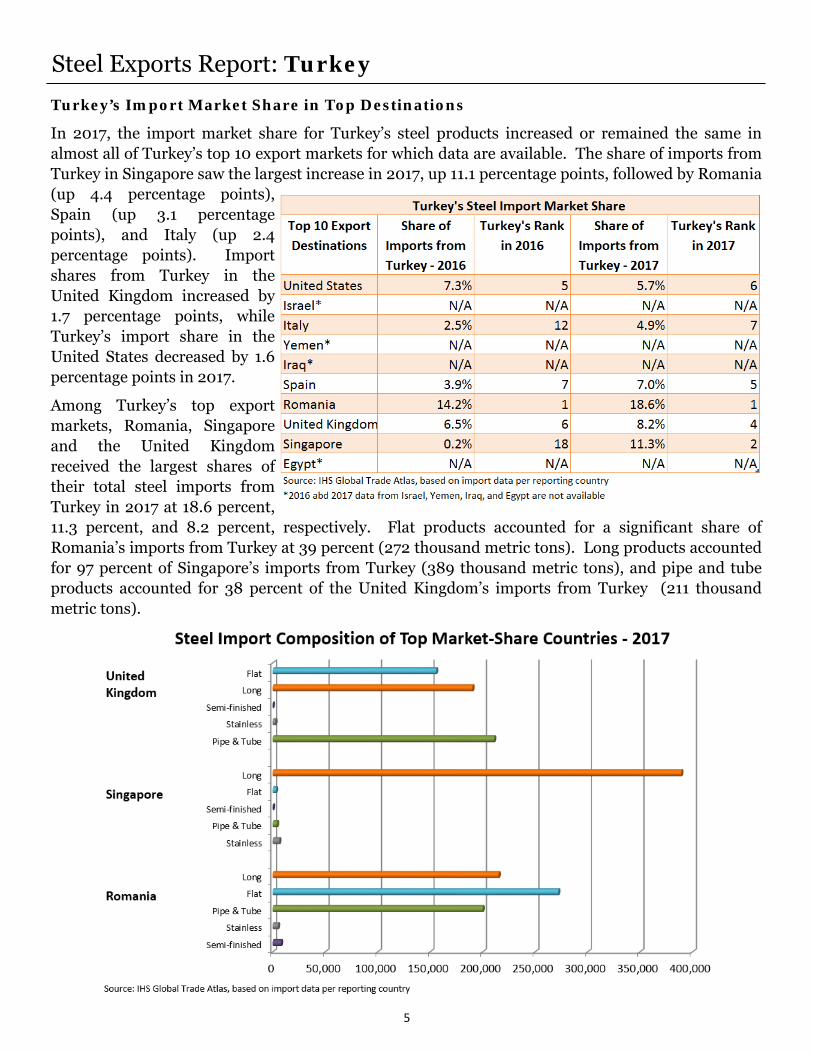
Turkey’s Import Market Share in Top Destinations
In 2017, the import market share for Turkey’s steel products increased or remained the same in almost all of Turkey’s top 10 export markets for which data are available. The share of imports from Turkey in Singapore saw the largest increase in 2017, up 11.1 percentage points, followed by Romania (up 4.4 percentage points), Spain (up 3.1 percentage points), and Italy (up 2.4 percentage points). Import shares from Turkey in the United Kingdom increased by 1.7 percentage points, while Turkey’s import share in the United States decreased by 1.6 percentage points in 2017.
Among Turkey’s top export markets, Romania, Singapore and the United Kingdom received the largest shares of their total steel imports from Turkey in 2017 at 18.6 percent, 11.3 percent, and 8.2 percent, respectively. Flat products accounted for a significant share of Romania’s imports from Turkey at 39 percent (272 thousand metric tons). Long products accounted for 97 percent of Singapore’s imports from Turkey (389 thousand metric tons), and pipe and tube products accounted for 38 percent of the United Kingdom’s imports from Turkey (211 thousand metric tons).
6
Steel Exports Report: Turkey
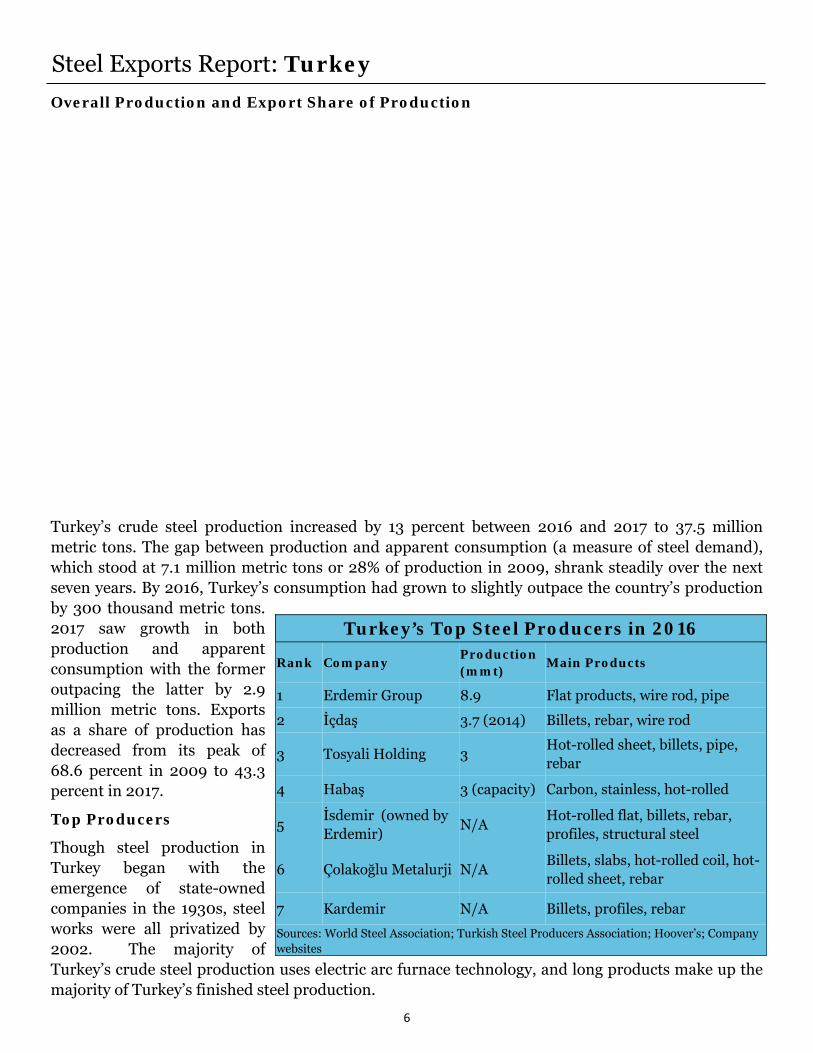
Overall Production and Export Share of Production
Turkey’s crude steel production increased by 13 percent between 2016 and 2017 to 37.5 million metric tons. The gap between production and apparent consumption (a measure of steel demand), which stood at 7.1 million metric tons or 28% of production in 2009, shrank steadily over the next seven years. By 2016, Turkey’s consumption had grown to slightly outpace the country’s production by 300 thousand metric tons. 2017 saw growth in both production and apparent consumption with the former outpacing the latter by 2.9 million metric tons. Exports as a share of production has decreased from its peak of 68.6 percent in 2009 to 43.3 percent in 2017.
Top Producers
Though steel production in Turkey began with the emergence of state-owned companies in the 1930s, steel works were all privatized by 2002. The majority of Turkey’s crude steel production uses electric arc furnace technology, and long products make up the majority of Turkey’s finished steel production.
Turkey’s Top Steel Producers in 2016
Rank Company Production (mmt)
Main Products
1 Erdemir Group 8.9 Flat products, wire rod, pipe
2 İçdaş 3.7 (2014) Billets, rebar, wire rod
3 Tosyali Holding 3 Hot-rolled sheet, billets, pipe, rebar
4 Habaş 3 (capacity) Carbon, stainless, hot-rolled
5 İsdemir (owned by Erdemir)
N/A Hot-rolled flat, billets, rebar, profiles, structural steel
6 Çolakoğlu Metalurji N/A Billets, slabs, hot-rolled coil, hot-rolled sheet, rebar
7 Kardemir N/A Billets, profiles, rebar
Sources: World Steel Association; Turkish Steel Producers Association; Hoover’s; Company websites
7
Steel Exports Report: Turkey
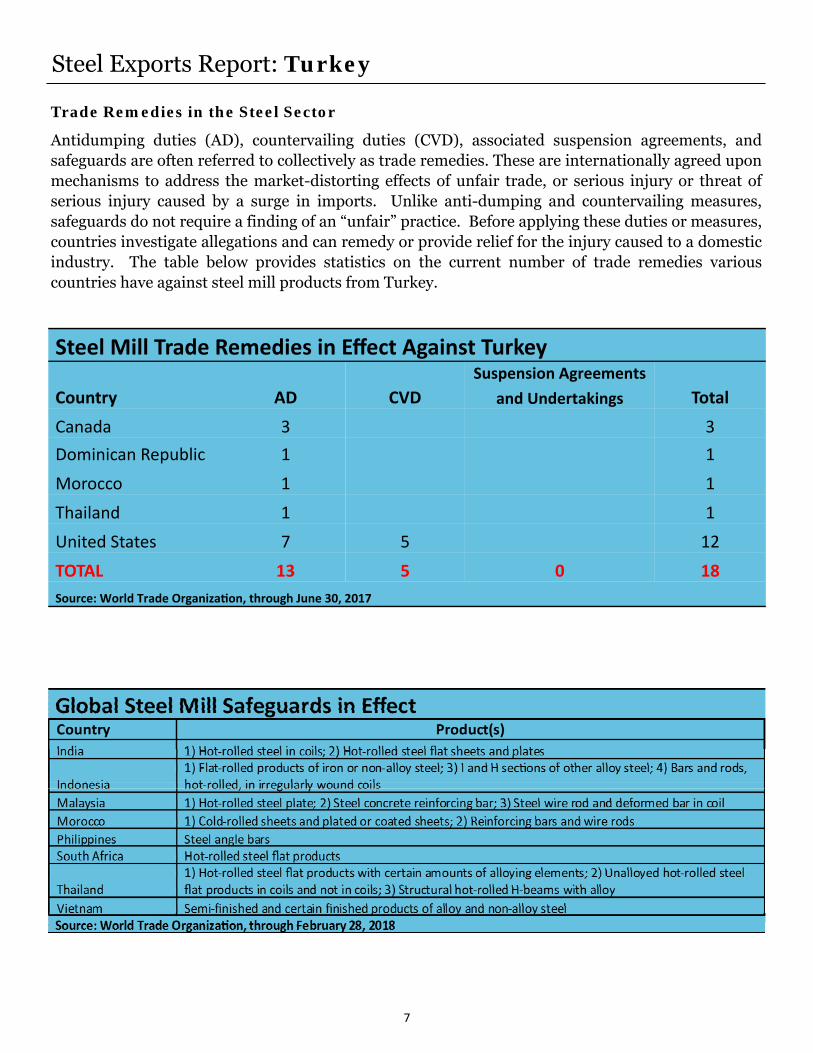
Trade Remedies in the Steel Sector
Antidumping duties (AD), countervailing duties (CVD), associated suspension agreements, and safeguards are often referred to collectively as trade remedies. These are internationally agreed upon mechanisms to address the market-distorting effects of unfair trade, or serious injury or threat of serious injury caused by a surge in imports. Unlike anti-dumping and countervailing measures, safeguards do not require a finding of an “unfair” practice. Before applying these duties or measures, countries investigate allegations and can remedy or provide relief for the injury caused to a domestic industry. The table below provides statistics on the current number of trade remedies various countries have against steel mill products from Turkey.
Steel Mill Trade Remedies in Effect Against Turkey
Country AD CVD
Suspension Agreements
and Undertakings Total
Canada 3 3
Dominican Republic 1 1
Morocco 1 1
United States 7 5 12
TOTAL 13 5 0 18
Source: World Trade Organiza on, through June 30, 2017
Thailand 1 1
8
Steel Exports Report: Glossary
Apparent Consumption: Domestic crude steel production plus steel imports minus steel exports. Shipment data are not available for all countries, therefore crude steel production is used as a proxy.
Export Market: Destination of a country’s exports.
Flat Products: Produced by rolling semi-finished steel through varying sets of rolls. Includes sheets, strips, and plates. Used most often in the automotive, tubing, appliance, and machinery manufacturing sectors.
Import Penetration: Ratio of imports to apparent consumption.
Import Source: Source of a country’s imports.
Long Products: Steel products that fall outside the flat products category. Includes bars, rails, rods, and beams. Used in many sectors but most commonly in construction.
Pipe and Tube Products: Either seamless or welded pipe and tube products. Used in many sectors but most commonly in construction and energy sectors.
Semi-finished Products: The initial, intermediate solid forms of molten steel, to be re-heated and further forged, rolled, shaped, or otherwise worked into finished steel products. Includes blooms, billets, slabs, ingots, and steel for castings.
Stainless Products: Steel products containing at minimum 10.5% chromium (Cr) offering better corrosion resistance than regular steel.
Steel Mill Products: Carbon, alloy, or stainless steel produced by either a basic oxygen furnace or an electric arc furnace. Includes semi-finished steel products and finished steel products. For trade data purposes, steel mill products are defined at the Harmonized System (HS) 6-digit level as: 720610 through 721650, 721699 through 730110, 730210, 730240 through 730290, and 730410 through 730690. The following discontinued HS codes have been included for purposes of reporting historical data (prior to 2007): 722520, 722693, 722694, 722910, 730410, 730421, 730610, 730620, and 730660.
Global Steel Trade Monitor: The monitor provides global import and export trends for the top countries trading in steel products. The current reports expand upon the early release information already provided by the Steel Import Monitoring and Analysis (SIMA) system that collects and publishes data on U.S. imports of steel mill products. Complementing the SIMA data, these reports provide objective and current global steel industry information about the top countries that play an essential role in the global steel trade. Information in these reports includes global exports and import trends, production and consumption data and, where available, information regarding trade remedy actions taken on steel products. The reports will be updated quarterly.
Steel Import Monitoring and Analysis (SIMA) System: The Department of Commerce uses a steel import licensing program to collect and publish aggregate data on near real-time steel mill imports into the United States. SIMA incorporates information collected from steel license applications with publicly released data from the U.S. Census Bureau. By design, this information provides stakeholders with valuable information on the steel trade with the United States. For more information about SIMA, please go to http://enforcement.trade.gov/steel/license/.


![UNITED STATES COURT OF INTERNATIONAL TRADE · 19-11-2019 · steel wire rod from the Republic of Turkey (“Turkey”). See Carbon and Alloy Steel Wire Rod From [Turkey], 83 Fed.](https://static.fdocuments.in/doc/165x107/5faa7c2a3121f47c174fb84d/united-states-court-of-international-trade-19-11-2019-steel-wire-rod-from-the.jpg)