Turkey Forest Products Annual Market Review- 2020
12
Turkey Forest Products Annual Market Review- 2020 General Directorate of Forestry Ankara, Turkey
Transcript of Turkey Forest Products Annual Market Review- 2020

Turkey Forest Products Annual Market Review- 2020
General Directorate of Forestry
Ankara, Turkey

Table of Contents
Abstract ...................................................................................................................................... 2 1. General Economic Trends Affecting the Forest and Forest Industry Sector ...................... 3 2. Recent Legislation and Policy Measures ............................................................................ 3
Impact of the COVID-19 outbreak and its impacts on forests and forest products markets and policy measures .................................................................................................. 3
Biotic and abiotic disturbances of forests, their impacts on forest products markets and trade and current and planned policy measures...................................................................... 5
Renewable energy policies and their impacts on forest products markets ...................... 5 3. Market drivers ..................................................................................................................... 6
Trade ................................................................................................................................ 6
Certification ..................................................................................................................... 6 4. Developments in forests and forest products markets sectors ............................................ 7
Wood Raw Materials ....................................................................................................... 7
Forest and Climate Change ............................................................................................. 9
Wood-based panels and Pulp and paper ............................................................................. 9 5. Tables ................................................................................................................................ 10
Forest products production and trade in 2019, 2020 and 2021. .................................... 10

Abstract
Unlike any other close years, 2019 and 2020 brought a new challenge called COVID-19 to the world. This outbreak proved that no one and nowhere is safe against this pandemic. People have died and faced with important health issues and it still continues. Though the virus cannot be seen, but it could be everywhere in the world. Most countries have had downfall economically because of impact of pandemic. Turkey have had various negative impact from the virus such as at the beginning of pandemic some institutions temporarily closed their doors and production temporarily stopped and some business places still closed. Tourism is almost done at the beginning and this had huge money lost and airways, taxis are also affected as an extension of tourism sector. However, these negative impacts of COVID did not hit the forestry activities which have still been working as it is before the pandemic. The main challenge which is wildfires kept the same and had several number of forest fires during the summer season. These fires have been prevented almost the same day or within a week without increasing the damage. Most of the fires were human induced and small scale. Therefore, forest sector was not highly affected from the virus but the fires. As a result of year 2020, COVID-19 and its impacts come first. Then recovery period and precaution actions have occupied our life to stay strong and healthy. Thankfully, it is now way better than 6- months ago. Routine actions and daily life activities come closer as it is. Forest in Turkey have been managed by Governmental institution named General Directorate of Forestry. Turkey has covered 28% forest of the country and managed and owned (99%) by government the main income from the forest is timber and harvested wood products and main challenge is forest fires especially the Mediterranean region. Several other non-wood products have been initiated to ensure sustainable production of non-wood products and to protect biodiversity in forest areas.

1. General Economic Trends Affecting the Forest and Forest Industry Sector
The Gross Domestic Product (GDP) grew by 4.5 percent in the first quarter of 2020. In the first quarter, the agricultural sector grew by 3 percent, the industrial sector by 6.2 percent and the services sector (including construction) by 3.2 percent. However, GDP contracted by 9.9 percent in the second quarter of 2020 due to the negative impact of the Covid-19 outbreak. In the second quarter, while the industrial sector contracted by 16.5 percent and the services sector (including construction) by 10.6 percent, the agricultural sector grew by 4 percent. Elevated inflation, a depreciating currency and a fragile external position all cloud the outlook. Focus Economics Consensus Forecast panellists project the economy to contract 3.3% in 2020. In 2021, GDP growth is seen at 4.4%, which is down 0.5 percentage points from last month. The International Monetary Fund (IMF) expects the unemployment trend to be heavily affected by the negative economic impact of the COVID-19 pandemic, the rate being currently estimated to increase to 17.2% in 2020 and decrease slightly to 15.6% in 2021. While the land of Turkey has covered by forest with 28%, income from the forest products has 0,003 % contribution to the government treasure. Turkey is classified as an emerging market economy. The country is one of the world's biggest producers of agricultural products; textiles; motor vehicles, ships and other transportation equipment; construction materials; consumer electronics and home appliances. To decrease in current account deficit and combat against high inflation are important priorities of the economic program. Measures being taken in this context such as limitation of credit-based spending and tight monetary policies have some pressure on the growth. Moreover, ongoing political instability and increasing tension in peripheral countries of Turkey and the explanations of FED (Federal Reserve) concerning the raise interest and normalization have been causing volatility in currency rates and borrowing cost and decrease consumer and investor’s confidence.
2. Recent Legislation and Policy Measures
Impact of the COVID-19 outbreak and its impacts on forests and forest products markets and policy measures
The emergence and rapid spread of the novel COVID-19 coronavirus from the end of 2019 and through 2020 has dramatically impacted lives, societies and economies across the world. Governments are responding to the crisis by developing an array of policies and recovery measures that cover several sectors and policy types. In addition to their economic impact, these will have potentially large environmental and social impacts in the short and long term. Indeed, some individual recovery measures may risk reversing some of the hard-won progress in the pre-crisis period on e.g. greenhouse gas (GHG) emission trends and clean air. Misalignment between recovery measures and long-term environmental and social goals can in turn lead to longer-term economic costs – both in terms of stranded assets, and increased costs associated with climate or other environmental impacts. The nature, focus and design of COVID-19 recovery packages will therefore affect the ability of individual countries simultaneously to meet a range of domestic economic, social and environmental goals, as well as their collective ability to achieve the aims of the Paris Agreement, the envisaged post-2020 framework for biodiversity and the 2030 Sustainable Development Goals (SDGs).

The nature and pace of economic recovery in different countries and in aggregate will have important implications for existing, updated and new NDCs under the Paris Agreement. Given the uncertainties around the timing of economic recovery and emissions pathways Turkey may face challenges during this period in formulating updated or new NDCs that accurately represent the strength of intended mitigation action and that are robust to this uncertainty(covid-19). The developments and growing demand for forest products are not sufficient to provide needed products amount for forest industry. Thus industrial plantation movement is crucial point for this need. The needed demands are provided with fast growing domestic and foreign species products that planted on industrial plantation areas. Despite of growing production, forest products prices continues based on Turkish Liras. In comparison of 2019 with 2020, 2020 prices for forest products are 15% more than previous year. Under the incentive which enable generating electricity from sustainable products had important developments during last 2 years. The forest product demands to 15 firms for generating electricity are provided in 2020 and 28 other factories have requested forest products for this incentive for 2021. The Turkish government took several actions to reduce spread of Covid -19 as follow Wash your hands frequently with soap and water for at least 20 seconds by scrubbing. Keep at least 3-4 steps away from people who show symptoms of colds. Cover your mouth and nose with disposable wipes during coughing and sneezing. If
there are no wipes, use the inside of the elbow. Avoid physical contacts such as handshaking and hugging. Do not touch your eyes, mouth and nose with your hands. Cancel or postpone your travels abroad. Spend the first 14 days at home on your return from abroad Wash your clothes at 60-900C with regular detergent. Clean frequently used surfaces such as door handles, fixtures and sinks with water and
detergent every day. If you have cold symptoms, avoid contact with people, especially the elders and those
with chronic diseases and do not go out without wearing a mask. Do not share your personal belongings such as towels. Drink plenty of fluids, maintain a balanced diet and pay attention to your sleep
patterns. If you have persistent fever, cough and shortness of breath, go to a health facility
wearing a mask. Besides these rules regulated by The Republic of Turkey - Ministry Of Health, Directorate General Of Public Health, additional prevention and spread reduction of virus actions have been gradually implemented such as curfew at weekends, wearing mask in common shared areas, on streets, on bus and outside of home are mandatory. Picnic and some social activities at parks and in forest are also prohibited, night clubs, beaches and cinema saloons are temporarily and timely closed.

Biotic and abiotic disturbances of forests, their impacts on forest products markets and trade and current and planned policy measures
In the 2019-2023 Strategic Plan; Mission "To protect forest and forest resources, to develop them with an understanding close to nature, to manage them in a way that is sustainable and provides multi-faceted benefits to the society" Its vision was expressed as "to be a pioneer institution in sustainable forest management practices", and the strategic goals and objectives listed below have been determined. In strategic plan:
• Strategic Purpose: Protecting Forest and Forest Resources Against Biotic and Abiotic Pests
• Target: Preventive measures in combating forest fires will be increased and response capacity will be strengthened.
• Objective: The health of forest ecosystems will be monitored, and forest existence and health will be protected by firstly applying natural or nature-appropriate preventive measures in combating diseases and pests. (GDF-2019 Corporate Financial Status and Prospects Report)
Renewable energy policies and their impacts on forest products markets
According to the economic developments in our country, following the developments in the markets and the sectors using forest products, determining the changes to be made in the production programs and the measures to be taken is important for the best evaluation of the products. In this context, it is aimed to monitor the changes in consumer demands, to review production programs accordingly, to make production according to demand and to spread standing tree for sales. In this context; By providing effective management in the production and marketing of forest products, systems to monitor production-consumption chain of forest products will be developed, and trainings will be organized for peasants and cooperative members and personnel working in production works. In GDF strategic plan; Strategic goal (g3): provide social benefits from the goods and services produced from the forests is aimed and following targets have been set to achieve:
• Quality and efficiency will be increased in wood-based forest products, and costs will be reduced and sustainable competition will be achieved in the domestic and foreign markets
• Ecotourism services will be expanded and non-wood forest product variety and production will be increased
• Taking into consideration the national conditions and international developments, standardization and certification system in forest products will be developed and certified forest area will be increased
• Forestry infrastructure will be strengthened; pilot applications will be carried out for the development of road standards in forests whose main function is production.

3. Market drivers
Trade
The consumed round wood amount is nearly 30 million m3, 4.5 million ha of that amount was imported in 2017 but today imported amount was decreased about 600.000 m3. the amount of demand by forest sector is usually taken care of domestic supplies.
Increase of round wood production is depend on supply and demand balance, if the demand is low then producing process is slow down. Especially after 2018, based on the demand of round wood is risen so the producing is increased. The most important point while increasing production is having sustainable forest policy. In 2020, financial fluctuation because of Covid-19 was expected but the forest producing sector has continued to work with full capacity during this pandemic.
Certification
OGM has taken FSC (Forest Steward Ship Council) certification for 6 million ha so 22% of Turkish Forest area are certified. The deal between Turkish government and PEFC is about to be last level so the certification process will initiate soon in 2021. The ongoing production in Turkish Government forests are processed by forest villagers and Ministry of Education provides education about work safety, production, standardization, emergency situation and tested them to be qualified for a capable foresters and this tests have been applied for 150.000 people so far. Certification studies, which were initiated as a pilot study in 2010 in Bolu Aladağ Sub-district Forest Directorate, were completed in 2011 and the dissemination process started. Forest management certificate (FSC) in 2.367.000 hectares of forest area covering 29 forest management directorates was received in 2010-September 2018 period, The work initiated on the acquisition of a forest management certificate (FSC) on an area of 1,916,909 hectares for 22 forest management directorates covering the entire Adana and Antalya Forest Regional Directorates is ongoing.
853
693 676763
827885
1,488 1,505
1,265
1,133
828
406
10
200
400
600
800
1,000
1,200
1,400
1,600
2014 2015 2016 2017 2018 2019
export (mil. $) Import (mil $)

4. Developments in forests and forest products markets sectors
Wood Raw Materials
The government of Turkey owns 99% of forests which cover about 28% of country with 22 740 297 ha area(forests stats 2019 General Directorate of Forestry is responsible for managing the forests of Turkey and trend graphic for forests in Turkey have been gradually increased since 2005 and are subject to increase to 30% of the country by 2030.
While the forest assets in the World decrease the area of forest in Turkey has been increased to 2.5 million ha more since 1973 to now. During this period, property of Turkey's forest was gone up approximately 2.5 times more. The policy of increase forest area in Turkey is accepted by Turkish Government beside Turkish government makes effort to plant on new areas each year.
As figure shows protection and extension of forest areas have gradually been increasing between 1973 – 2019. Turkey’s forests have shown an increasing trend over the last decades. In the direction of global and national demands, the handling of the economic, ecological, social and cultural functions of forests within an ecosystem integrity and management of forests according to sustainable forest management principles is the basic approach of today’s forestry approach.( FRA 2020 – Country Report, Turkey)
18.5
19.0
19.5
20.0
20.5
21.0
21.5
22.0
22.5
23.0
1973 1999 2005 2012 2015 2018
20.2
20.821.2
21.7
22.3
22.7
Forest Area (mil. ha.)

0
0.2
0.4
0.6
0.8
1
1.2
1.4
1.6
1.8
1973 1999 2005 2012 2015 2018
0.9
1.21.3
1.51.6 1.7
Growing Stock (mil. m3)
7,32
0
8,25
2
8,10
0
9,29
9
10,0
53 11,5
42
11,4
64
12,5
69
13,5
32
14,4
24
13,6
68
14,9
23 16,6
38
17,0
10
17,1
53 19,0
80
22,3
00
25,6
00
2003
2004
2005
2006
2007
2008
2009
2010
2011
2012
2013
2014
2015
2016
2017
2018
2019
2020
…
Industrial Roundwood Production (1000 m3)

Forest and Climate Change
Forests in Turkey removes 84.8 Mt of CO2 eq. from the atmosphere and with harvested wood product it goes up to 94.7 Mt of CO2 eq. which means the removed carbon dioxide from the atmosphere has been effectively increased since 1990. There are two main reasons why this increase occurs is because of the increment value and forests area have slightly been increased in last decades. For example, one of OGM’s strategic target is to increase its increment value from 73.3 m3 to 75 m3 until 2023 by restoration. Sustainable forest management improves stored carbon and increases forests areas.
Wood-based panels (particle board, fibreboard and MDF, OSB, plywood) and Pulp and paper
Production and Marketing of Wood-Based Forest Products As a result of forestry activities carried out in forest areas within the framework of forest management plans, forest products such as logs, wire posts, mine poles, industrial wood, paper wood, fiber-chip wood, poles, sticks and firewood are obtained and these products are used in construction, furniture, mining, fiber and chipboard, paper and other industries based on wood. In the 2010-2012 period, an annual average of 13 million 526 thousand m3 of industrial wood was produced, this figure reached an annual average of 15 million 560 thousand m3 in the 2013-2016 period. it shows a decreasing trend day by day. (GDF-2019 Corporate Financial Status and Prospects Report).
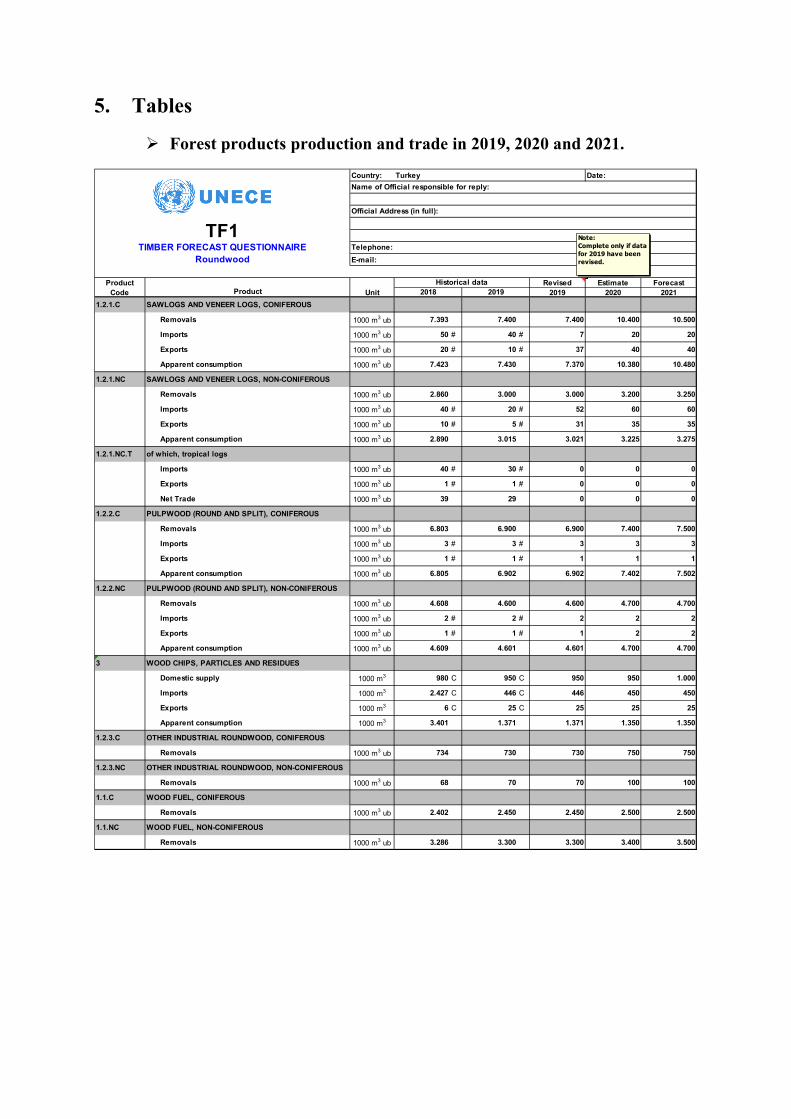
5. Tables
Forest products production and trade in 2019, 2020 and 2021.
Country: Turkey Date:
Fax:E-mail:
Product Revised Estimate ForecastCode Product Unit 2019 2020 2021
1.2.1.C SAWLOGS AND VENEER LOGS, CONIFEROUS
Removals 1000 m3 ub 7.393 7.400 7.400 10.400 10.500
Imports 1000 m3 ub 50 # 40 # 7 20 20
Exports 1000 m3 ub 20 # 10 # 37 40 40
Apparent consumption 1000 m3 ub 7.423 7.430 7.370 10.380 10.480
1.2.1.NC SAWLOGS AND VENEER LOGS, NON-CONIFEROUS
Removals 1000 m3 ub 2.860 3.000 3.000 3.200 3.250
Imports 1000 m3 ub 40 # 20 # 52 60 60
Exports 1000 m3 ub 10 # 5 # 31 35 35
Apparent consumption 1000 m3 ub 2.890 3.015 3.021 3.225 3.275
1.2.1.NC.T of which, tropical logs
Imports 1000 m3 ub 40 # 30 # 0 0 0
Exports 1000 m3 ub 1 # 1 # 0 0 0
Net Trade 1000 m3 ub 39 29 0 0 0
1.2.2.C PULPWOOD (ROUND AND SPLIT), CONIFEROUS
Removals 1000 m3 ub 6.803 6.900 6.900 7.400 7.500
Imports 1000 m3 ub 3 # 3 # 3 3 3
Exports 1000 m3 ub 1 # 1 # 1 1 1
Apparent consumption 1000 m3 ub 6.805 6.902 6.902 7.402 7.502
1.2.2.NC PULPWOOD (ROUND AND SPLIT), NON-CONIFEROUS
Removals 1000 m3 ub 4.608 4.600 4.600 4.700 4.700
Imports 1000 m3 ub 2 # 2 # 2 2 2
Exports 1000 m3 ub 1 # 1 # 1 2 2
Apparent consumption 1000 m3 ub 4.609 4.601 4.601 4.700 4.700
3 WOOD CHIPS, PARTICLES AND RESIDUES
Domestic supply 1000 m3 980 C 950 C 950 950 1.000
Imports 1000 m3 2.427 C 446 C 446 450 450
Exports 1000 m3 6 C 25 C 25 25 25
Apparent consumption 1000 m3 3.401 1.371 1.371 1.350 1.350
1.2.3.C OTHER INDUSTRIAL ROUNDWOOD, CONIFEROUS
Removals 1000 m3 ub 734 730 730 750 750
1.2.3.NC OTHER INDUSTRIAL ROUNDWOOD, NON-CONIFEROUS
Removals 1000 m3 ub 68 70 70 100 100
1.1.C WOOD FUEL, CONIFEROUS
Removals 1000 m3 ub 2.402 2.450 2.450 2.500 2.500
1.1.NC WOOD FUEL, NON-CONIFEROUS
Removals 1000 m3 ub 3.286 3.300 3.300 3.400 3.500
Name of Official responsible for reply:
Official Address (in full):
2018
TF1
2019
TIMBER FORECAST QUESTIONNAIRERoundwood
Historical data
Telephone:Note:Complete only if data for 2019 have been revised.

Country: Turkey Date:
Fax:E-mail:
Product Revised Estimate ForecastCode Product Unit 2019 2020 2021
6.C SAWNWOOD, CONIFEROUSProduction 1000 m3 5.915 5.950 5.950 8.320 8.400Imports 1000 m3 750 382 382 350 350Exports 1000 m3 38 100 100 110 110Apparent consumption 1000 m3 6.627 6.232 6.232 8.560 8.640
6.NC SAWNWOOD, NON-CONIFEROUSProduction 1000 m3 2.290 2.400 2.400 2.560 2.600Imports 1000 m3 69 60 60 60 60Exports 1000 m3 16 E 35 E 35 40 40Apparent consumption 1000 m3 2.343 2.425 2.425 2.580 2.620
6.NC.T of which, tropical sawnwoodProduction 1000 m3 5 5 5 0 0Imports 1000 m3 32 22 22 20 20Exports 1000 m3 1 2 2 0 0Apparent consumption 1000 m3 36 25 25 20 20
7 VENEER SHEETSProduction 1000 m3 74 C 74 C 74 70 70Imports 1000 m3 99 C 26 C 64 60 60Exports 1000 m3 31 C 4 C 34 30 30Apparent consumption 1000 m3 142 96 104 100 100
7.NC.T of which, tropical veneer sheetsProduction 1000 m3 5 R 5 R 5 0 0Imports 1000 m3 3 4 4 0 0Exports 1000 m3 7 1 1 0 0Apparent consumption 1000 m3 1 8 8 0 0
8.1 PLYWOODProduction 1000 m3 112 C 115 C 150 300 300
55 Imports 1000 m3 130 C 46 C 46 40 4045 Exports 1000 m3 21 C 44 C 44 50 50
Apparent consumption 1000 m3 221 117 152 290 2908.1.NC.T of which, tropical plywood
Production 1000 m3 5 5 4 0 0Imports 1000 m3 4 2 2 2 2Exports 1000 m3 1 0 E 0 0 0Apparent consumption 1000 m3 8 7 6 2 2
8.2 PARTICLE BOARD (including OSB)Production 1000 m3 4.430 4.450 4.450 4.300 4.350Imports 1000 m3 204 151 E 190 170 170Exports 1000 m3 873 823 E 883 850 850Apparent consumption 1000 m3 3.761 3.778 3.757 3.620 3.670
8.2.1 of which, OSBProduction 1000 m3 75 80 80 50 50Imports 1000 m3 145 138 138 130 130Exports 1000 m3 3 4 4 5 5Apparent consumption 1000 m3 217 214 214 175 175
8.3 FIBREBOARDProduction 1000 m3 4.970 C 4.900 C 4.943 5.000 5.100Imports 1000 m3 53 C 33 C 33 32 32Exports 1000 m3 340 C 374 C 374 375 375Apparent consumption 1000 m3 4.683 4.559 4.602 4.657 4.757
8.3.1 HardboardProduction 1000 m3 0 0 130 130 130Imports 1000 m3 38 22 22 20 20Exports 1000 m3 17 E 28 E 142 145 145Apparent consumption 1000 m3 21 -6 10 5 5
8.3.2 MDF/HDF (Medium density/high density)Production 1000 m3 4.910 4.800 4.700 4.750 4.850Imports 1000 m3 15 11 11 12 12Exports 1000 m3 181 E 233 E 119 120 120Apparent consumption 1000 m3 4.744 4.578 4.592 4.642 4.742
8.3.3 Other fibreboardProduction 1000 m3 60 100 113 120 120Imports 1000 m3 0 0 E 0 0 0Exports 1000 m3 142 113 113 110 110Apparent consumption 1000 m3 -82 -13 0 10 10
9 WOOD PULPProduction 1000 m.t. 70 C 70 C 70 70 80Imports 1000 m.t. 1.261 C 1.375 C 2.572 1.951 1.951Exports 1000 m.t. 12 C 43 C 134 115 115Apparent consumption 1000 m.t. 1.319 1.402 2.508 1.906 1.916
12 PAPER & PAPERBOARDProduction 1000 m.t. 2.800 C 2.800 C 2.800 2.800 2.800Imports 1000 m.t. 2.675 C 2.417 C 2.417 5.222 5.222Exports 1000 m.t. 960 C 882 C 882 1.557 1.557Apparent consumption 1000 m.t. 4.515 4.335 4.335 6.465 6.465
5.1 WOOD PELLETSProduction 1000 m.t. 20 E 20 E 20 25 25Imports 1000 m.t. 0 0 E 0 0 0Exports 1000 m.t. 15 14 14 15 15Apparent consumption 1000 m.t. 6 6 6 10 10
Forest products
Name of Official responsible for reply:
Official Address (in full):
2018 2019Historical data
TF2
TIMBER FORECAST QUESTIONNAIRE Telephone:Note:Complete only if data for 2019 have been revised.