Turbulent flow in a ribbed channel: Flow structures in the...
13
General rights Copyright and moral rights for the publications made accessible in the public portal are retained by the authors and/or other copyright owners and it is a condition of accessing publications that users recognise and abide by the legal requirements associated with these rights. • Users may download and print one copy of any publication from the public portal for the purpose of private study or research. • You may not further distribute the material or use it for any profit-making activity or commercial gain • You may freely distribute the URL identifying the publication in the public portal If you believe that this document breaches copyright please contact us providing details, and we will remove access to the work immediately and investigate your claim. Downloaded from orbit.dtu.dk on: May 23, 2018 Turbulent flow in a ribbed channel: Flow structures in the vicinity of a rib Wang, Lei; Salewski, Mirko; Sundén, Bengt Published in: Experimental Thermal and Fluid Science Link to article, DOI: 10.1016/j.expthermflusci.2009.10.005 Publication date: 2010 Link back to DTU Orbit Citation (APA): Wang, L., Salewski, M., & Sundén, B. (2010). Turbulent flow in a ribbed channel: Flow structures in the vicinity of a rib. Experimental Thermal and Fluid Science, 34(2), 165-176. DOI: 10.1016/j.expthermflusci.2009.10.005
-
Upload
vuongtuyen -
Category
Documents
-
view
214 -
download
1
Transcript of Turbulent flow in a ribbed channel: Flow structures in the...

General rights Copyright and moral rights for the publications made accessible in the public portal are retained by the authors and/or other copyright owners and it is a condition of accessing publications that users recognise and abide by the legal requirements associated with these rights.
• Users may download and print one copy of any publication from the public portal for the purpose of private study or research. • You may not further distribute the material or use it for any profit-making activity or commercial gain • You may freely distribute the URL identifying the publication in the public portal
If you believe that this document breaches copyright please contact us providing details, and we will remove access to the work immediately and investigate your claim.
Downloaded from orbit.dtu.dk on: May 23, 2018
Turbulent flow in a ribbed channel: Flow structures in the vicinity of a rib
Wang, Lei; Salewski, Mirko; Sundén, Bengt
Published in:Experimental Thermal and Fluid Science
Link to article, DOI:10.1016/j.expthermflusci.2009.10.005
Publication date:2010
Link back to DTU Orbit
Citation (APA):Wang, L., Salewski, M., & Sundén, B. (2010). Turbulent flow in a ribbed channel: Flow structures in the vicinity ofa rib. Experimental Thermal and Fluid Science, 34(2), 165-176. DOI: 10.1016/j.expthermflusci.2009.10.005

Turbulent flow in a ribbed channel: Flow structures in the vicinity of a rib
Lei Wanga, Mirko Salewskib, Bengt Sundena
aHeat Transfer Division, Lund University, Box 118, SE-22100Lund, SwedenbRisø National Laboratory for Sustainable Energy, Technical University of Denmark, DK-4000 Roskilde, Denmark
Abstract
PIV measurements are performed in a channel with periodic ribs on one wall. The emphasis of this study is to investigate the flowstructures in the vicinity of a rib in terms of mean velocities, Reynolds stresses, probability density functions (PDF), and two-pointcorrelations. The PDF distribution ofu′ is bimodal in the separated shear layer downstream of the rib. The maximum Reynoldsshear stresses occur at the leading edge of the rib. Based on quadrant analysis, it is found that ejection motions make a dominantcontribution to the Reynolds shear stress in this region. Moreover, topology-based visualization is applied to the separation bubbleupstream of the rib. Salient critical points and limit cycles are extracted, which gives clues to the physical processesoccurring inthe flow.
Keywords: Ribbed channel, PIV, Flow separation, Topology
1. Introduction
Channels roughened with periodic ribs are widely applied inenhancing heat transfer in various cooling passages, e.g. gasturbine blades. The flow past a rib is typically characterizedby flow separation and reattachment which essentially breakupthe viscous sub-layer and enhance the heat transfer. It is foundthat the heat transfer rates attain a maximum near the time-mean reattachment line [1]. Unlike the flow over a backward-facing step, the flow past a rib is more complicated since it hasseparation regions upstream and downstream of the obstacle,which constitutes an ’overwhelming perturbation’ to the flow[2]. Even though numerous studies have been carried out tostudy the thermal and flow characteristics in ribbed channels,the understanding of this phenomenon is not complete. In directnumerical simulations (DNS) of turbulent channel flow withsquare ribs on one wall, Leonardi et al. [3] showed that mainflow features, such as the size and strength of the recirculationzones, do not change significantly and reoccur along the chan-nel as the cavity width to roughness height ratio is greater than7. Using liquid crystals, Rau et al. [4] found a second maximumof heat transfer rate as the rib pitch ratio is greater than 10. Thedistance of this maximum from the rib corresponds to the exten-sion of the separation region upstream of the obstacle. Mullinand Martin [5] investigated the turbulent flow structure overa rib-roughened surface by laser Doppler velocimetry (LDV).The main finding was that a small recirculation bubble formsalong the leading edge of each rib and subsequently collapsesat irregular intervals. Wang et al. [6] carried out particleim-age velocimetry (PIV) measurements in a ribbed channel. Withaid of a Galilean decomposition scheme, they revealed distinctvortices embedded in the separated shear layer. Martinuzziand
Email address:[email protected] (Lei Wang)
Tropea [7] applied a crystal violet technique to study the flowfield on the front face of a rib in a channel. The flow is char-acterized by the appearance of a nearly equally spaced arrayof alternating saddle and node points. Based on this observa-tion, they conjectured a cellular structure as flow passes overan obstacle. Recently, Chou and Chao [8] performed flow visu-alizations to investigate the flow structures around rectangularobstacles. In their study, the U-vortices and a series of branch-ing points were well in line with the flow model proposed byMartinuzzi and Tropea [7]. Considering the large differencein the Reynolds number between [7] and [8], the agreement israther interesting.
Although there is difficulty in conceptually visualizing com-plex flow patterns, it can be facilitated by using critical-pointtheory. Critical points are points in the flow field where the ve-locity is zero and the streamline slope is indeterminate. Critical-point theory was initially developed to study the flow features inthe vicinity of separation points. Depending on whether stream-lines are attracted to or emanate from critical points, criticalpoints are classified into stable and unstable types. A detaileddescription of critical-point theory can be found in [9]. Inad-dition, another important topological feature is the so-called bi-furcation line towards which other trajectories converge asymp-totically. Bifurcation lines may be either open or closed. Aclosed bifurcation line is referred to as a limit cycle.
In the present study, PIV measurements are carried out ina channel with periodic ribs on one wall. The emphasis ofthis study is to investigate the flow patterns in the vicinityofa rib. Topology-based visualization is also applied to exam-ine the properties of the separation bubble upstream of the rib.The organization of this paper is as follows. Section 2 describesthe experimental setup and measurement technique. We presentand discuss results in Section 3 and draw conclusions in Sec-tion 4.
Preprint submitted to Experimental Thermal and Fluid Science October 30, 2009

Figure 1: Sketch of experimental setup.
Figure 2: Rib configuration on one wall.
Figure 3: Side view of mean streamlines in the mid-span plane.
2
(a) U/U0
(b) V/U0
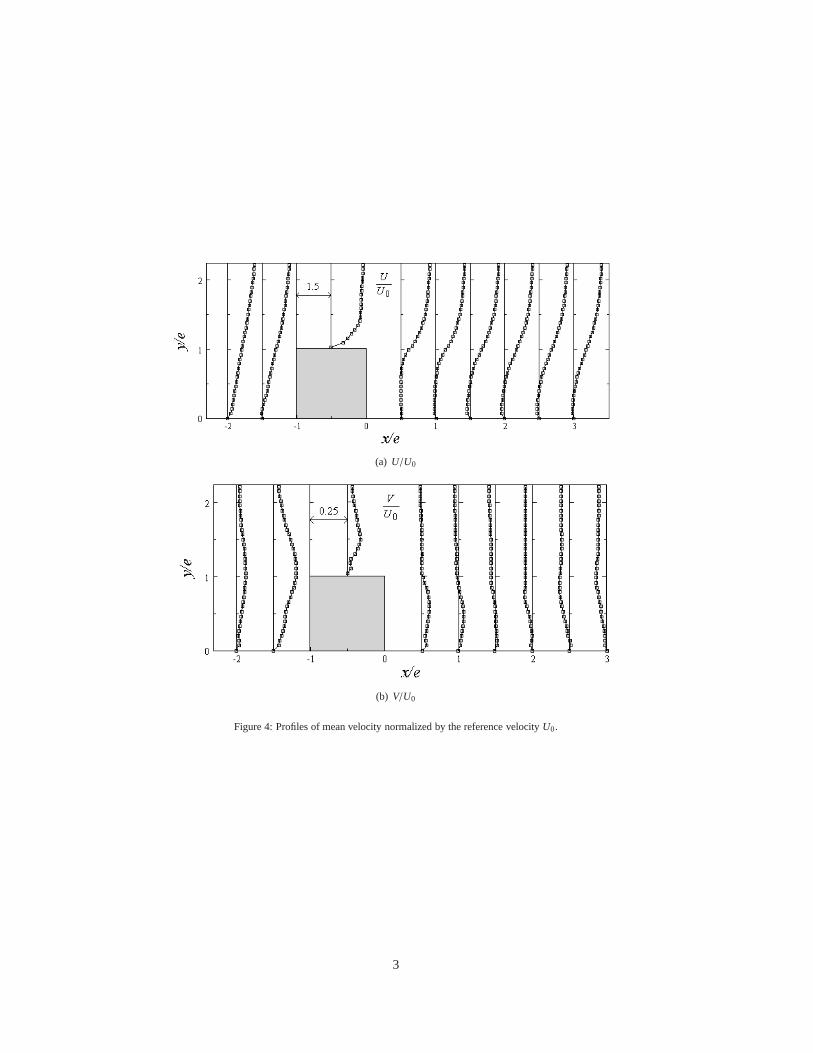
Figure 4: Profiles of mean velocity normalized by the reference velocityU0.
3

2. Experimental Procedures
The experimental setup is sketched in Fig. 1. Air with am-bient temperature is sucked into the channel by a fan. The testsection consists of a 1500 mm long channel with a cross sectionof 50 mm× 50 mm. The first half of the channel is smooth, andthe second half of the channel is roughened with ribs. Onlyone wall is fitted with periodic transverse ribs. The height ofthe ribs is 10 mm which obstructs the channel by 20% of itsheight. The rib pitch, defined as the distance from one leadingedge to the next leading edge, is 10 rib heights, as illustrated inFig. 2. The inter-rib spacing is set such that the reattachment isallowed to take place on the portion between consecutive ribs.The rib height is represented bye, the rib pitch byP, and thechannel height is denoted byH. The Cartesian coordinatesx, y,z are defined in such a way that thex-axis is in the streamwisedirection, they-axis is the wall-normal direction, andz-axis isthe spanwise direction. The measurements are made in the mid-span plane which is indicated in Fig. 2. The time-mean compo-nents of the velocity in thex- andy-directions are denoted byUandV, respectively, and the corresponding fluctuating compo-nents are denoted byu′ andv′. The Reynolds number is 22000based on the bulk-mean velocityU0 = 6.7 m/s and the channelheightH. In the present study, the flow around the seventh ribis investigated. This position is located atx/Dh = 28, wherex is the distance of the seventh rib from the inlet, andDh isthe hydraulic diameter of the channel. According to Leonardiet al. [3], the roughness elements are virtually isolated asthecavity width to roughness height ratio is greater than 7 (or thepitch ratio is greater than 8). Throughout this paper, referencequantities for length and velocity areeandU0, respectively.
A commercially available PIV system developed by DantecDynamics is used in the present investigation. An oil-basedaerosol is generated by a TSI 9306 six-jet atomizer. In ordertoget a homogeneous distribution of seeding particles, a plenumwith two grids is connected to the channel inlet. The meanparticle diameter is about 1µm and the concentration is regu-lated by the compressed air pressure and the number of Laskinnozzles. A Quantel Q-switched Nd:YAG laser provides pulsedilluminations with a wavelength of 532 nm. The duration ofeach pulse is 10 ns, and the maximum output energy is 120 mJ.The light-sheet thickness in the test section is kept at 0.8 mm.A digital camera containing a CCD chip with 1280× 1024 pix-els and a Nikon AF Micro 60f/2.8D lens with an optical filterare used to record the particle images. The size of the interro-gation window is 32× 32 pixels with 50% overlapping. Thisgives rise to the spatial resolution∆/e = 0.067 (∆ is the spac-ing between vectors). The time interval between laser pulsesis set such that the particles move at most 8 pixels between thepair of images. In the present study, the time interval is 10µswhich gives the optimum measurement of the velocity. Withineach window, the number of seeding particles is greater than5and the particle image size projected onto the CCD sensor isapproximately 3 pixels. FlowMap software is used for the dataprocessing. FFT-based cross-correlation in conjunction with atwo-dimensional Gaussian fit is applied to find the correlationpeak position. When the instantaneous velocity field is calcu-
Figure 5: Top view of mean streamlines just above the wall.S denotes thesaddle point.
lated, a peak-height validation and a moving-average validationare applied to the raw maps to detect and replace the ’outliers’by vectors estimated from surrounding values. To minimise thenoise, a top-hat filter with uniform weighting is then imple-mented. The averaging area of the filter is 3× 3 pixels. As-suming that the measured particle displacement is accurateto0.1 pixels, the error is less than 2% for the displacement of 8pixels. An ensemble of 1000 instantaneous velocity samplesisgenerated with an acquisition rate of 4 Hz. It is found that theturbulent shear stresses converge well as the number of samplesis greater than 700 (deviation is less than 3%). Another error af-fecting the Reynolds shear stress is the spatial resolutionof PIV.For grid-generated turbulence, Lavoie et al. [10] found that thethird-order structure function is more sensitive to PIV spatialresolution than the second-order one, but no ways for correct-ing the values were proposed. In the present experiment, theuncertainty for the shear stress is estimated to be about 10%,which takes into account of the number of samples and PIVspatial resolution.
3. Results
3.1. Overview of the flow
Prior to presenting detailed flow patterns in the vicinity oftherib, it is helpful to display some global flow features. Figure 3shows the mean streamlines past the rib in the mid-span plane,where the origin is placed at the leeward corner of the rib. Themost striking feature is the formation of a large recirculationbubble downstream of the rib. A secondary bubble is perceivedin the leeward corner as the reverse flow approaches the verticalsurface. Upstream of the rib, another separation bubble occursas a result of the strong adverse pressure gradient. Figure 4shows the mean velocity components at different streamwise
4

(a) urms/U0
(b) vrms/U0
Figure 6: Profiles of normalized rms values.
Figure 7: Contours of Reynolds shear stresses, the quantities are normalized byU20.
5

locations in the mid-span plane. In Fig. 4a, the reverse flowcoupled with the inflectional profiles is clearly demonstrated inthe region downstream of the rib. Above the top of the rib,there is an intense shear layer and local acceleration. In Fig. 4b,the maximum outward velocity components are found ahead ofthe rib. Downstream of the rib (x/e > 1), the negative valuesof 〈V〉 suggest that the fluid is entrained from the central partof the flow to the wall as the separated shear layer curves in-ward. Figure 5 plots the mean streamlines downstream of therib in the x − z plane just above the wall. It should be men-tioned that the exact wall-unit value of this plane is difficult toestimate because the laser sheet itself is 0.8 mm in thickness.In this figure, the spanwise reverse flow in conjunction witha curved reattachment line is clearly discerned. At the reat-tachment line, the shear layer bifurcates deflecting a fractionof fluid upstream and shedding remaining portion downstream.The reattachment point in the centerline exhibits the charac-teristics of a classical saddle point. Turbulence intensities inthe streamwise and wall-normal directions are shown in Fig.6.Downstream of the rib (x/e > 0), Fig. 6a shows that the posi-tion whereurms attains a maximum value is aroundy/e = 1.1.This position can be interpreted as the center of the shear layerbecause it coincides with the inflectional point in the verticaldistribution ofU, as shown in Fig. 4. A large value ofurms isfound at the rib top, which is well in line with the simulatedresults by Cui et al. [11]. In Fig. 6b, the largest value ofvrms isfound just ahead of the rib. Figure 7 displays the contours oftheReynolds shear stress. In this figure, only the quantities greaterthan 0.5〈−u′v′〉max are demonstrated in order to highlight theregion with large Reynolds shear stresses. It is clear that themaximum Reynolds shear stresses occur at the leading edge ofthe rib, which is in good agreement with Cui et al. [11]. Inthe separated shear layer, the general trend is that the Reynoldsshear stresses increase gradually with increasing distance fromthe rib.
3.2. Separated Shear FlowIn this section, consideration is given to the separated shear
layer downstream of the rib. The planey/e = 1.1 is takento represent the shear layer. The first results to be discussedis the velocity probability density function (PDF) measuredover a series of spatial positions in this plane behind the ribat 0 < x/e < 3. Fluctuating velocity components are usedto compute the PDF. The most remarkable features are the bi-modal nature foru′ and the sharp distribution forv′. Figure 8shows such a PDF distribution at a representative positionA(x/e = 1.1, y/e = 1.1). The bimodal feature indicates that theflow has two distinct modes corresponding to the peaks. Furtherinspection of the PDF distribution shows that the bimodal pat-tern exists in the whole separated shear layer betweeny/e= 0.8andy/e= 1.3 behind the rib. The bimodal feature indicates thatthe flow contains periodicity, which is likely caused by the flap-ping motions of the shear layer sweeping over the measurementdomain. The PDF distribution on the top of the rib at the planey/e= 1.1 is also inspected. It is found that the bimodal featurecontinues to exist over the rear portion at−0.5 < x/e< 0, but itdisappears over the front portion at−1 < x/e < −0.5. Further
Figure 8: PDF distribution at a representative pointA (x/e = 1.1, y/e = 1.1) inthe separated shear layer.
away from the top of the rib (y/e > 1.3), there are no apparentbimodal distributions detected.
Another fundamental test is to compute the two-point cor-relation coefficients, which give an indication of how coherentthe flow structure is over a certain distance. The correlationcoefficient is defined as (with no implied summation)
Ruiuj =〈u′i (xl)u′j(xk)〉
√
〈u′2i (xl)〉〈u′2j (xk)〉(1)
whereu′i (xl) andu′j(xk) are two instantaneous velocity fluctu-ations. In this paper, we only consider the autocorrelationco-efficient of theu′ andv′, denoted byRuu andRvv. Figures 9aand 9b show the contours ofRuu andRvv in the mid-span plane.The pointA (x/e = 1.1, y/e = 1.1) is selected as the referencelocation. In order to highlight the strongly correlated events, thequantities below the value 0.3 are disregarded. In Fig. 9a, theelongated contour ofRuu is nearly aligned in thex-direction,while the contour ofRvv is aligned in they-direction. They-alignment ofRvv was also noticed by previous studies in turbu-lent channel flow [12] and turbulent boundary layer flow oversmooth and rough surface [13]. Further inspection of Fig. 9shows that the spatial extent ofRuu is considerably greater thanthat of Rvv. This may be attributed to the large scale flappingmotion of the separated shear layer.
3.3. Flow at the leading edge of the rib
As stated above, the maximum Reynolds shear stress occursat the leading edge of the rib. One of the questions that re-mained unanswered is what kind of flow motions give rise tothe Reynolds shear stress occurring in this region. To answerthis question, we first investigate the probability densityfunc-tion distribution of the values. Figure 10 shows such a PDF
6

(a) Ruu
(b) Rvv
Figure 9: Contours of two-point correlation coefficients centered at pointA.
profile at a representative pointB (x/e= −1.5,y/e= 1.1). Thispoint is located within the contour of the largest Reynolds shearstresses shown in Fig. 7. In this figure, the−u′v′ is normalizedby its time-mean value〈−u′v′〉. The PDF profile shows a sharp,skewed distribution with a long tail on the positive side. Thismeans that the−u′v′ is most often a small value but it bursts oc-casionally. In other words, the−u′v′ is highly intermittent. Toinvestigate the behaviour of−u′v′ further, we perform a quad-rant analysis at pointB. Quadrant analysis has been used inflat plate boundary layer flows by several investigators (forin-stance, Willmarth and Lu [14]; Bogard and Tiederman [15])for predicting the types of turbulent motion and the scales con-tributing to these motions. The turbulent motions which makepositive contribution to the Reynolds stress are identifiedasejection(u′ < 0,v′ > 0) andsweep(u′ > 0,v′ < 0). The magni-tude of contributing turbulent motions can be represented by thevalue of−u′v′ which is equal to or greater than a given thresh-old, or,−u′v′ ≥ H×〈−u′v′〉. Figure 11 presents the frequency ofoccurence of ejection and sweep events as a function ofH. AsH = 1, the number of ejections is roughly equal to the numberof sweeps. With increasing value ofH, the number of sweepsdrops steeply. AsH > 5, it is found that the ejections are thedominant events in the mechanism maintaining the Reynoldsshear stress.
Figure 12 shows a typical PIV snapshot in which significantReynolds shear stresses are produced at the leading edge of therib. A pronounced feature is that the fluid is shed towards themain flow. The magnitude of the normal velocity is so large that
Figure 10: PDF of−u′v′ at a representative pointB (x/e = −1.5, y/e = 1.1) atthe leading edge of the rib.
7

Figure 11: Frequency of occurence of−u′v′ as a function of the thresholdH.
it is comparable to the reference velocityU0. When the rapidupward motion encounters the incident main stream from theleft, an inclined shear layer is observed. Despite the increasedturbulent stresses at the leading edge of the rib, the upwardmo-tion is of practical significance in the cooling techniques sincethe hot fluid near the surface is shed towards the main flow.
3.4. Topology of the upstream separation bubble
Topology-based visualization of two-dimensional vectorfields offers insight into the structure of flow [9]. In order tocapture the essential topological structure of the separation bub-ble upstream of the rib, two methods are applied in this sectionto improve the quality of the velocity data. First, we increasethe spatial resolution of PIV. Basically, the spacing betweenvectors in this section is 0.53 mm (∆/e = 0.053) and the in-vestigated domain is upstream of the rib which contains 79×29vectors. Figure 13 shows an instantaneous picture by PIV mea-surement. For the sake of convenience, the origin is placed atthe windward corner of the rib. Apart from a primary separa-tion bubble upstream of the rib, there is an additional separa-tion bubble on the top of the rib. At the leading edge of therib, a distinct upward shedding motion is also recognized. Fur-thermore, we use the proper orthogonal decomposition (POD)filter to smooth out random variations occurring in the flow. Incontrast to the top-hat filter, the POD filter is inhomogeneousin one or more directions, which gives optimal results in thewall-bounded flow [16]. In POD, the velocity is expanded as alinear superposition of the mutually orthogonal eigenfunctions,in which the most energetic components are extracted. In afirst approximation, the velocity can be represented by a low-order reconstruction which effectively removes the fine-scale,random variations from the total velocity field. In this study,the number of modes for reconstruction is 100 which contain
92.6% of the turbulent kinetic energy. For more details of POD,the reader is referred to Berkooz et al. [17]. Figure 14 givesthe POD-filtered velocity field based on the PIV snapshot inFig. 13. Generally speaking, the main flow structures in thevicinity of the rib remain unchanged but the separation bubbleon the top of the rib looks more regular. In the following, thePOD-filtered velocity data are used to compute the streamlines.
Figure 15 shows the close-up view of the mean streamlinesassociated with the separation bubble. It is clear that the stream-lines within the bubble spiral into a focus instead of rotatingabout a center. This implies that the mean flow is not exactlytwo-dimensional even at the mid-span plane. In order to quan-tify how much the flow in the symmetry plane deviates fromthe idealized two-dimensional flow, the value of∂W/∂z is cal-culated based on the continuity equation. Figure 15 presentsthe ∂W/∂z values which are normalized by 1000e/U0. Out-side the separation bubble, as expected, the flow is essentiallytwo-dimensional due to the vanishing value of∂W/∂z. How-ever, the large deviation of∂W/∂z from zero within the sep-aration bubble indicates the separation bubble is really three-dimensional. This result shows that the topology gives an indi-cation of whether the flow is two-dimensional or not.
Figure 16 demonstrates the instantaneous flow in the sepa-ration bubble, in which various critical points are illustrated.It should be noted that all the bubbles rotate in a clockwisesense. Figure 16a illustrates an attracting (or stable) focus to-wards which the neighboring streamlines converge in a spiralmanner. However, in Fig. 16b, the striking feature is a repelling(or unstable) focus from which all the neighboring streamlinesdepart in a spiral manner. Accompanying the unstable focus is abifurcation line (denoted byG) towards which other streamlinesconverge asymptotically. It should be mentioned that unstablefoci are much outnumbered by the stable ones in our experi-ment. In Fig. 16c and d, there are two different types of criticalpoints involved: two stable foci and in between a saddle point.Further examination of Fig. 16 shows that the vortices changein number during the experiment. In Fig. 16a and b, there isonly a single separation bubble, while in Fig. 16c and d, a pri-mary separation bubble together with a secondary vortex is ob-served. However, it should be noted that the two vortex flowpatterns are rarely observed in our experiments. Since a focuscannot take place in two-dimensional flows, Fig. 16 reveals thatthe separation bubble upstream of the rib is intrinsically three-dimensional.
In addition to the critical points, it is also found that thelimit cycles characterize the separation bubble. Figures 17a-e displays close-up views of various limit cycles. In general,the limit cycle is elliptic with a principal axis. It should benoted that the streamlines inside the limit cycle are not drawnin Figs. 17a-d. This is due to the weak convergence of stream-lines, i.e. it takes a large number of rotations to approach thelimit cycle. If the streamlines inside the limit cycle were dis-played otherwise, it would be hard to identify a closed orbit. InFig. 17e, the convergence is relatively fast and a distinct limitcycle is observed. Further inspection of Fig. 17 shows that thesize of the limit cycle varies from time to time, which suggeststhat the vortex tube undergoes axial stretching or compression.
8

Figure 12: A PIV snapshot which produces significant Reynolds shear stresses at the leading edge of the rib.
Figure 13: Instantaneous flow obtained by PIV.
Figure 14: POD-filtered velocity field.
9
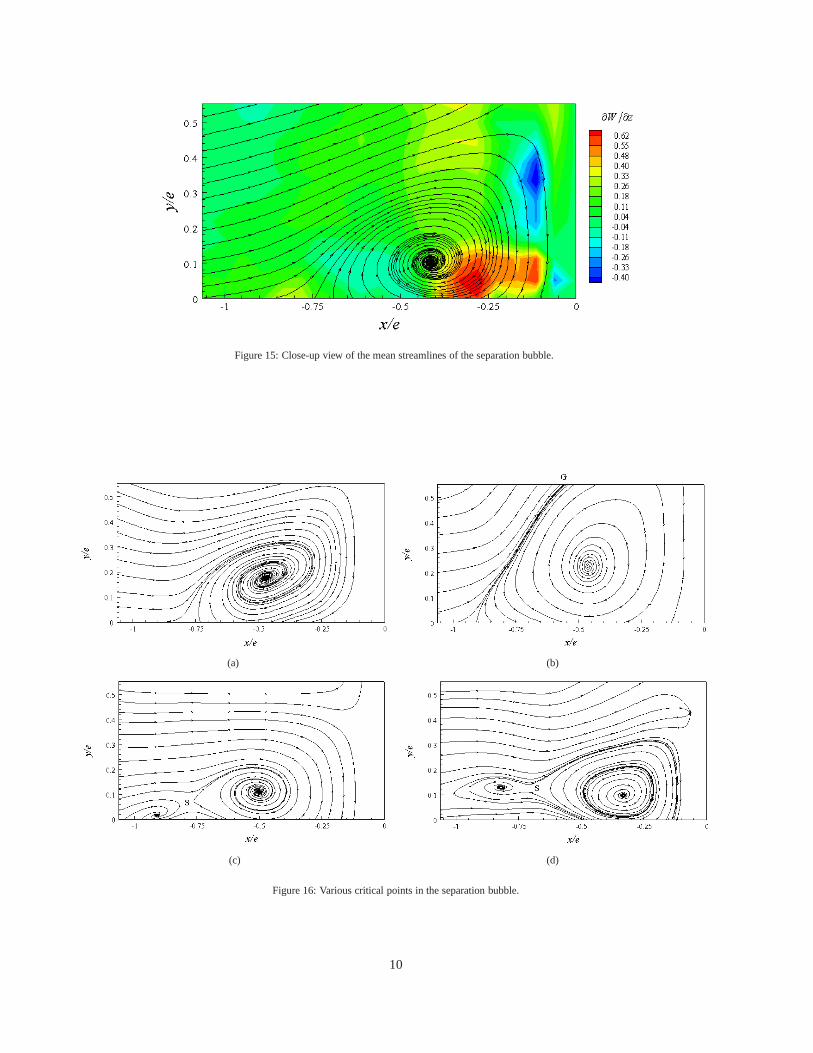
Figure 15: Close-up view of the mean streamlines of the separation bubble.
(a) (b)
(c) (d)
Figure 16: Various critical points in the separation bubble.
10

(a) (b)
(c) (d)
(e)
Figure 17: Limit cycles in the separation bubble.
11

Critical points and limit cycles shown in Figs. 16 and 17 cangive us more information on the properties of the separationbubble. It is known that the Burger’s single-cell vortex is acharacteristic of an attracting focus [18] and the Sullivan’s two-cell vortex is consistent with a limit cycle [19]. Here the two-cell vortex means that the flow does not simply spiral towardsthe central axis and out along it as the single-cell vortex does,but has a region of reverse flow near the central axis. Therefore,the appearance of various critical points and limit cycles in thisstudy signifies that the separation bubble changes essentially instructure during the course of time.
4. Conclusions
In this study, PIV measurements are performed in a channelwith periodic ribs on one wall. The ribs obstruct the channelby 20% of its height and are arranged 10 rib heights apart. TheReynolds number is 22000 based on the bulk-mean velocity andchannel height. The emphasis of this study is to investigatetheflow structures in the vicinity of a rib. An important featureisthe bimodal PDF distribution ofu′ in the separated shear layerdownstream of the rib. This is probably caused by the largescale flapping motion of the separated shear layer. The maxi-mum Reynolds shear stresses occur at the leading edge of therib. Based on the quadrant analysis, it is found that the ejectionmotions make a dominant contribution to the Reynolds shearstress in this region. Upstream of the rib, salient criticalpointsand limit cycles are extracted to sketch the topological struc-tures of the separation bubble. The knowledge of their proper-ties gives clues to the physical processes occurring in the flow.
Acknowledgments
The current research is financially supported by the SwedishResearch Council (VR) and the Swedish National EnergyAgency (STEM).
References
[1] R.L. Webb, Principles of Enhanced Heat Transfer, JohnWiley & Sons Inc., New York, 1994.[2] P. Bradshaw, F.Y.F. Wong, The reattachment and relaxationof a turbulent shear layer, J. Fluid Mech. 52 (1972) 113-135.[3] S. Leonardi, P. Orlandi, R.J. Smalley, L. Djenidi, R.A. An-tonia, Direct numerical simulation of turbulent channel withtransverse square bars on one wall, J. Fluid Mech. 491 (2003)229-238.[4] G. Rau, M. Cakan, D. Moeller, T. Arts, The effect of pe-riodic ribs on the local aerodynamic and heat transfer perfor-mance of a straight cooling channel, ASME J. Turbomachinery120 (1998) 368-375.[5] T. Mullin, S.R. Martin, Intermittent phenomena in the flowover a rib roughened surface, ASME J. Fluids Eng. 113 (1991)206-209.[6] L. Wang, J. Hejcik, B. Sundn, PIV measurements of sepa-rated flow in a square channel with streamwise periodic ribs on
one wall, ASME J. Fluids Eng. 129 (2007) 834-841.[7] R. Martinuzzi, C. Tropea, The flow around surface-mounted, prismatic obstacles placed in fully developed channelflow, ASME J. Fluids Eng. 115 (1993) 85-92.[8] J.H. Chou, S.Y. Chao, Branching of horseshoe vortexaround surface-mounted rectangular cylinders, Exp. Fluids 28(2000) 394-402.[9] A.E. Perry, M.S. Chong, A description of eddying motionsand flow patterns using critical-point concepts, Ann. Rev. FluidMech., 19 (1987), 125-155.[10] P. Lavoie, G. Avallone, F. De Gregorio, G.P. Romano, R.A.Antonia, Spatial resolution of PIV for the measurement of tur-bulence, Exp. Fluids 43 (2007) 39-51.[11] J. Cui, V.C. Patel, C.L. Lin, Large-eddy simulation of tur-bulent flow in a channel with rib roughness, Int. J. Heat FluidFlow 24 (2003) 372-388.[12] J. Kim, F. Hussain, Propagation velocity and space-timecorrelation of perturbations in turbulent channel flow, NASATM 103932 (1992).[13] P.Å. Krogstad, R.A. Antonia, Structure of turbulent bound-ary layer on smooth and rough walls, J. Fluid Mech. 277 (1994)1-21.[14] W.W. Willmarth, S.S. Lu, Structure of the Reynolds stressnear the wall, J. Fluid Mech. 55 (1972) 65-72.[15] D.G. Bogard, W.G. Tiederman, Characteristics of ejectionsin turbulent channel flow, J. Fluid Mech. 179 (1987) 1-19.[16] R.J. Adrian, K.T. Christensen, Z.C. Liu, Analysis and in-terpretation of instantaneous turbulent velocity fields, Exp. Flu-ids 29 (2000) 275-290.[17] G. Berkooz, P. Holmes, J.L. Lumley, The proper orthogo-nal decomposition in the analysis of turbulent flows, Ann. Rev.Fluid Mech. 25 (1993) 539-575.[18] J.M. Burgers, A mathematical model illustrating the theoryof turbulence, Adv. in Applied Mechanics 1 (1948) 171-199.[19] R.D. Sullivan, A two-cell solution of the Navier-Stokesequations, J. Aero. Sci. 26 (1959) 767-768.
12