Turbojet Engine Blade Damping - NASA · PDF fileNASA Contract Report 165406 Final Report...
186
NASA Contract Report 165406 Final Report Turbojet Engine Blade Damping A.V. Srinivasan D.G. Cutts S. Sridhar UNITED TECHNOLOGIES RESEARCH CENTER East Hartford, CT 06108 Contract NAS3-21708 July 1981 REPRODUCEDBY NATIONAL TECHNICAL INFORMATION SERVICE U,S. DEPARTMENT OF COMMERCE SPRINGFIELD, VA. 22161 National Aeronautics and Space Administration Lewis Research Center Cleveland, Ohio 44135 https://ntrs.nasa.gov/search.jsp?R=19810020592 2018-04-23T01:09:27+00:00Z
Transcript of Turbojet Engine Blade Damping - NASA · PDF fileNASA Contract Report 165406 Final Report...
NASA Contract Report 165406
Final Report
Turbojet EngineBlade Damping
A.V. SrinivasanD.G. CuttsS. Sridhar
UNITED TECHNOLOGIES RESEARCH CENTER
East Hartford, CT 06108
Contract NAS3-21708
July 1981
REPRODUCEDBY
NATIONAL TECHNICALINFORMATION SERVICE
U,S. DEPARTMENT OF COMMERCESPRINGFIELD, VA. 22161
National Aeronautics and
Space Administration
Lewis Research Center
Cleveland, Ohio 44135
https://ntrs.nasa.gov/search.jsp?R=19810020592 2018-04-23T01:09:27+00:00Z

U.S. DEPARTMENT OF COMMERCE
National Technical Information Service
N81 29130
TURBOJET ENGINE BLADE DAMPING
United Technologies Research Center
East Hartford, Connecticut
Jul 81

Turbojet Engine Blade Damping
TABLE OF CONTENTS
Page
FOREWORD ................................. i
iiLIST OF FIGURES .............................
LIST OF TABLES ............................. v
NOMENCLATURE .......................... • • • vi
ixSU_iARY ................................
i. INTRODUCTION ............................. 1
2. TECHNICAL APPROACH .......................... 3
2.1 Analytical Approaches ...................... 3
2.2 Experimental Procedures ..................... 6
3. MATERIAL DAMPING ........................... i0
3.1 Determination of Haterial Damping in a VibratingI0Blade ............................
3.2 Determination of Damping Constants J and n ........... 12
3.3 Material Damping Tests ..................... 17263.4 Numerical Results and Discussion .............
4. DAMPING DUE TO SLIPPING AT ROOT .................... 30
4.1 Forced Response of a Fan Blade with Slip at the Root ..... 30
4.2 Experimental Investigation of Damping at Blade Root ....... 35364.3 Discussion of Results .....................
5. DA_ING DUE TO RUBBING AT SHROUD INTERFACES ............. 38
5.1 Forced Response of a Fan Blade with Rubbing at
Shrouds ............................. _38
5.2 Experimental Investigation of Damping at Shrouds ........ 42
5.3 Discussion of Results ...................... 45
5.4 Characteristics of Sliding Friction ............... 47
J
j/
TABLE OF CONTENTS (Cont'd)
Page
506. DAMPING DUE TO PLATFORM-DAMPERS ....................
6.1 Forced Response of a Turbine Blade with a Platform
Damper .............................. 50
6.2 Platform Damping Tests ...................... 55576.3 Discussion of Results .....................
7. GENERAL CONCLUSIONS AND RECOMMENDATIONS60
638. REFERENCES ............................
APPENDIX A - COMPUTER PROGRAMS ....................... 67
APPENDIX B - TEST ASSEMBLIES, INSTRUMENTATION AND DATA REDUCTION ...... 86
APPENDIX C - DAMPING IN AN ASSEMBLY OF BLADES . • t • • • • • " • • • •
92
TABLES ................................... 96-106
FIGURES .................................. 107-168
/
FOREWORD
The development of the analytical and test programs presented herein
was sponsored by the National Aeronautics and Space Administration, Lewis
Research Center, under Contract NAS3-21708. The NASA Project Manager was
Mr. L. J. Kiraly.
Principal United Technologies Research Center (UTRC) participants in
the contract activity were Dr. A. V. Srinivasan, Mr. D. G. Cutts,
Dr. S. Sridhar and Mr° J. Zucker. Dr. Srinivasan was the Principal Inves-
tigator and Program Manager with primary overall responsibility for the
development and application of the analyses and coordinating the test phases
of the program. Dr. Sridhar provided the bulk of the support in the analy-
tical aspects of the program and was primarily responsible in formulating
the mathematical models and obtaining numerical solution through a series of
computer programs he developed. Mr. Cutts provided the bulk of the support
in the test programs and was primarily responsible for outlining the tests,
designing the fixtures and instrumentation, directing the tests and data
reduction. Mr. Cutts was assisted by Mr. John Zucker throughout the test
programs.
This report is the final documentation of (a) analytical modeling of
nonaerodynamic sources of damping in engine blades, and (b) testing per-
formed on blades and blade-like components to measure the levels of damping
available in these components.

123456a6b789
I0ii
12
13
14
15
161718
19
20
2122
23
24
25
LIST OFFIGURES
Title Page
Blades and Other Test Components Used in the Program . • .107
Twisted Plate Mounted on Centrifuge Arm .......... 108
Twisted Plate Installation for Centrifugal Test ..... 109
Turbine Blade/Platform Damper Vibration Test Set Up • • .ii0
Hysteresis Loop for Material Damping ........... iii
Typical Blade Element ............... _ . .iii
Stress Distribution Across Element Thickness ....... iii
Material Damping Constant Measurement Test Hardware . • .112
Assembly of Centrifugal Test Rig for the Twisted Plate .113
Twisted Plate Mounted in Bench Test Fixture ....... 114
NASTRAN Finite Element Model for the Twisted Plate .... 115
Block Diagram of the Driving and Recording Systems
Used to Obtain Vibration Decay Data for the Twisted
Plate on the Centrifuge ................. 116
Variation of Modal Damping (Loss Factor) with
Rotational Speed for Titanium Twisted Plate in
Partial Vacuum (5 torr) ................. 117
Decay Characteristics of Twisted Plate Vibrating in
Its First Three Modes at Zero Speed in Vacuum ...... 118
Decay Characteristics of Twisted Plate Vibrating in
Its First Mode at Speed in Vacuum (Two Samples) ...... 119
Decay Characteristics of Twisted Plate Vibrating in
Its Second and Third Modes at Speed in Vacuum (5 torr) .120
Instrumented Fan Blade Showing "Root" Strain Gage .... 121
Instrumented Fan Blade Showing A.S.M.T. Strain Gage .122
Test Set-Up For Fan Blade _terial Damping Investigation
at Elevated Temperatures ................. 123
Variation of Measured Modal Damping with Air Pressure
for Fan Blade ...................... 124
Variation of Measured First Mode Frequency Ratio with
Air Pressure for Fan Blade ................ 125
Material Damping in a Typical Fan Blade ......... 126
Variation of Loss Factor with Root Stress and Soak
Temperature ...................... 127
Stress Amplitude Decay Curves for a Fan Blade Vibrating
in Air In Its Second Bending Mode for Two Temperature
Conditions ........................ 128
Stress Amplitude Decay Curves for a Fan Blade
Vibrating in Air In Its First Torsion Mode for
Two Temperature Conditions ................ 129
Typical Composite _terial Test Piece .......... 130
ii
Figure
26
27
28
29
30a
30b
31
32
33
34
35
36
37
38
39a,b
40
41
42
43
44
45
46
47
48
49
50
LIST OF FIGURES (Cont'd)
Title Page
Composite Material Cantilevered Beam Vibration
Test Set Up ........................ 131
Composite Material Damping ................ 132
Spanwise Distributions of Outer Fiber Major Principal
Stresses for Twisted Plate ................ 133
Twisted Plate Forced Response in Partial Vacuum (i0 Torr). 134
Motions of Blade with Slip at Root ............ 135
Analytical Model of Blade with Slip at Root ....... 135
Test Fixture and Root Loading Device for Fan Blade
Root Damping Tests .................... 136
Fan Blade/Fixture Test Assembly for Root Damping
Investigation ................. ..... 137
Circuit and Switching Arrangement for Strain
Gage Load Bolts ..................... 138
Decays of Blade Response with an Applied Root
Loading of 576N ..................... 139
Decays of Blade Response with an Applied Root
Loading of 2879N ..................... 140
Damping at Fan Blade Root ................ 141
Variation of Root Vibratory Stress with Root Loading . . 142
Variation of Blade Response Frequency with Root
Normal Load for Various Excitation Levels ........ 143
Schematic of Shroud Rubbing ............... 144
Analytical Model for Shroud Rubbing ........... 144
Shroud Loading Device for Investigation of Fan Blade
Shroud Damping Mechanism ................ 145
Shroud Loading Mechanism ................. 146
Block Diagram of Basic Excitation and Recording Systems
Used to Obtain Strain and Acceleration Response Data
From Test Items Excited by the Electro-dynamic Shaker 147
Test Set-Up for Shroud Damping Investigation ....... 148
Fan Blade Response Characteristics from a 2g Level
Exploratory Sweep - Shrouds Loaded with I02N ....... 149
Fan Blade Response Characteristics from a 2g Level
Exploratory Sweep - Shrouds Loaded with 150N ....... 150
First Flap Mode Response to a Slow Frequency Sweep at
Constant Input Acceleration Levels ............ 151
Damping Due to Rubbing at Shroud for a Typical Fan
Blade - Variation of Response Decay with Initial Stress. 152
Damping Due to Rubbing at Shroud for a Typical Fan
Blade - Variation of Response Decay with Shroud Load and
Initial Stress ...................... 153
Shroud Damping Effects on Blade Response (First Flap
Mode _280 Hz) ....................... 154
iii
LIST OFFIGURES(Cont'd)
Figure Title
51
52
53
54
55a
55b
56
57a
57b
58a
58b
59
60
61
62
63
64
65
Blade Response in the Above-Shroud Torsion Mode ...... 155
Wear Areas on Shroud Load Platens ............. 156
Friction Test Assembly (Upper Arm Raised) ......... 157
Friction Test Assembly ................. 158
Typical Signals from Acceleration and Force Transducers . .159
Typical Measured Friction Force - Slip Loops ....... 159
Variation of Equivalent Friction Coefficient During
Sinusoidal Motion With Normal Load, Frequency and
Maximum Relative Velocity ................ 160
Schematic of Turbine Blade and Platform Damper ...... 161
Analytical Model for Platform Damping ........... 161
Damper Force vs Blade Displacement at Platform ...... 162
Blade and Damper Spring Displacements Over One
Cycle of Vibration .................... 162
Turbine Blade Test Piece Geometry ............. 163
Damper Stress Response Signals for Varying Input
Acceleration Levels .................... 164
Baseline Conditions for Turbine Blade ........... 164
Platform Damping Test Results (Large Damper) ....... 165
Platform Damping Test Results (Small Damper) ....... 166
Turbine Blade Platform Damping Characteristics
(Small Damper) ............. ......... 167
Influence of Damper Stiffness on Platform Damping ..... 168
iv
LIST OF TABLES
Tab le Title Page
I
II
III
IV
V
Vl
Vll
Vlll
IX
B-I
B-2
Titanium Cantilever Beam Test Results ........... 96
Summary of Twisted Plate Test Results ........... 97
Summary of Data for Fan Blade Material Damping Tests .... 98
Summary of Root Damping Test Data ............. 99
Summary of Shrouded Blade Response Test Data ........ i00
Summary of Friction Test Results .............. 101
Summary of Turbine Blade Response Test Results ....... 102
Summary of Turbine Blade Platform Damping Test Results
("Small Damper") ...................... 103
Summary of Turbine Blade Platform Damping Test Results
("Large Damper") ...................... 104
Test Components and Other Hardware Designed and Fabricated
for the Test Program .................... 105
Equipment Used in Test Program ............... 106
v
NOMENCLATURE
A
a
b
Ci
c
D
d
E
F
f
G
g
H
h
Io
I
i
J
K
L
area of beam cross-section; surface area of element
amplitude, nondimensional, of forced response
measure of slip amplitude for platform damper
constants, in Section 3.2
linear viscous damping coefficient
energy dissipated during one cycle of vibration
as a subscript denotes damper location for platform damper
modulus of elasticity of material
frictional force, nondimensional, at an interface
as a subscript, denotes friction
slip amplitude, nondimensional
acceleration due to gravity
as a subscript, denotes hysteresis
thickness of uniform cantilever beam
mass moment of inertia of fan blade about root
cross-sectional area moment of inertia of beam
as a subscript, denotes element number
damping constant, for material damping
modal stiffness; also used as cantilever beam frequency parameter
in Section 3.1
length of beam, and fan blade
as a subscript, denotes lower surface for material damping
calculations
vi
M
m
N
n
p
Q
q°
1
B
y,6,0
NOMENCLATURE (Cont'd)
moments; bending, frictional, and vibratory
modal mass
normal load at an interface
damping constant for material damping calculations; also used
as subscript to denotes mode number in Section 3.2
amplitude of external excitation
amplitude, nondimensional, of external excitation
ratio of response amplitude to external excitation amplitude,
"magnification factor"
constants in Section 3.2
effective radius to the rubbing surface for a dovetail root
time
strain energy stored during one cycle of vibration
forced response; also tip deflection ofblade
sine and cosine components of the amplitude magnification factor
stiffness ratio for shroud damping and mass ratio for root damping
phase angles
small dimensionless parameter; also used to denote strain in
Section 3.2
linear viscous damping constant, non-dimensional
correction factor for dovetail geometry
coefficient of dry friction
mass density
vii

NOMENCLATURE (Cont'd)
blade stress
time parameter, nondimensional, for platform damping
modeshape; also used as phase angle
circular frequency
viii
SUMMARY
The potentials of various sources of nonaerodynamicdamping in engineblading are evaluated through a combination of advanced analysis and testing.The sources studied include material hysteresis, dry friction at shroud androot-disk interfaces as well as at platform type external dampers. A limitedseries of tests were conducted to evaluate damping capacities of compositematerials (B/AL, B/AL/Ti) and thermal barrier coatings. Further, certainbasic experiments were performed on titanium specimens to establish thecharacteristics of sliding friction and tD determine material damping con-stants J and n.
The test componentsused in this program included part span shrouded fanblades, turbine blades, a twisted plate and uniform beams. Fixtures, loadingdevices, excitation and instrumentation systems were designed for use in eachseries of tests taking special care to highlight the mechanismunder studyand to minimize fixture participation. Measurementmethods adopted for use inthis program varied over a wide range requiring modifications to conventionalprocedures.
The series of tests indicated that contributions to damping frommaterial hysteresis is negligible for the titanium alloy used in this program.Further, the effect of root damping diminishes rapidly to negligible levelsat projected operating speeds of a typical advanced fan with a dovetail typeof root structure. A simulated thermal environment typical of a fan bladeapplication showedessentially no changes in material damping characteristics.Similarly, the series of tests in which a twisted titanium plate was spunindicated essentially no changes in material damping levels.
Dampingat shroud interfaces is most likely to be the only nonaerodynamicsource available at all speeds to limit vibration of shrouded fan blades. Thenature of this damping has been found to be a complicated mechanisminvolvingboth micro- andmacroslip conditions. The stress amplitude at slip resonancehas been found to be proportional to shroud load and excitation levels whereasoff resonance it is proportional to excitation levels only. The boundary con-ditions at the interfaces appear to change during vibration resulting in avery narrow region of contact.
The mechanismof damping due to external damperssuch as platform typedampers is, like shroud damping, inherently nonlinear. Depending upon theloading on the platform, the response characteristics change from a nearlysinusoidal signal to a stick-slip signal to a response emitting audible noise.Contributions to stress attenuation can comefrom dampingdue to rubbing aswell as due to a change in mode shape brought about by the extent of stiffnessof the damper. Test data showedchanges in modeshapes occurring as theprincipal test parameters (excitation level, normal load) varied.
ix

Thermal barrier coatings appear to have no influence on damping of
turbine blade vibrations. Tests on composite material specimens indicate the
problem of repeatability and suggest a broader program of tests involving a
larger number of specimens and tests.
A unique fixture design has been developed from which fundamental sliding
friction characteristics of rubbing surfaces can be measured. The laboratory
set-up is such that friction-displacement loops can be obtained from which
work done/cycle of motion as well as coefficient of friction can be measured.
For the titanium pieces with tungsten carbide surface treatment used in this
program, the coefficient of friction was found to be between .3 and .5 depend-
ing upon the normal load and independent of velocity.
Although all the tests were conducted on single blades and appropriate
mathematical models were developed to represent the several mechanisms of
damping, procedures to apply this data to predict damping levels in an assembly
of blades have been developed and discussed.
X
i. INTRODUCTION
Vibration induced fatigue failure of blades is of continuing concern to
the designer of aircraft engines. The emphasis on improved engine performance
under the necessary constraints of minimum weight and satisfactory life
requires that vibration levels be kept low. Further, certain important de-
sign considerations require a thorough understanding of the structural
dynamic characteristics of blades. These design considerations include (i)
blade life prediction methods which use vibration amplitudes in their calcu-
lations, (2) allowable frequency margins which need to be justified on the
basis of the intensity of resonant stresses computed at low integral orders,
and (3) accurate prediction of susceptibility to aeroelastic instabilities.
The analytical techniques used in flutter and resonant stress prediction rely
on accurate determination of modal characteristics of blades. These charac-
teristics include not only the natural frequencies and mode shapes but also
damping available in each mode. Contributions to damping in a vibrating
blade arise from aerodynamic sources as well as nonaerodynamic sources. The
latter include contributions from material damping, friction damping due to
rubbing at interrupted interfaces (shroud to shroud, root to disk), and fric-
tion damping due to an external device such as a turbine blade platform-type
damper.
Damping, in the context of this report, refers to energy dissipation
capacities of the component undergoing vibration. A measure of energy dissi-
pated per vibrational cycle is commonly used to report the extent of damping
present in a system. In this report, the extent of damping is reported as
the loss factor, which is defined as the ratio of energy lost per cycle of
vibration to maximum vibrational energy stored in the appropriate mode
divided by 27. Where such a measurement is inadequate or impractical, the
extent of damping present is measured indirectly and reported as attenuation
of strain in the vibrating components due to the influence of the damping
mechanism.
Material or hysteretic damping refers to energy dissipation due to many
complex mechanisms within a material, when a volume of the material is sub-
jected to cyclic stresses. Thus, material damping is always present in a
vibrating blade. Friction damping at an interface, however, depends on load-
ing, roughness of surfaces, level of external excitation, slip amplitude,
geometry of the contacting components, etc. For example, the root structure
of a jet engine blade is typically of a dovetail, pin or firtree design, the
extent of friction damping being different in each design. In the case of
shrouded blades, untwisting of the blades under centrifugal loading brings
neighboring blades into contact at shrouds, resulting in a complex "joint"
at the interface. Determination of the precise nature of boundary conditions
at such an interface continues to be an unresolved problem defying bothanalysis and measurement. The condition at the interface mayvary from afully stuck to a freely slipping condition, the extent of friction dampingdepending on the nature of slipping motion. External dampersare frequentlyused to reduce stress levels in turbine blades. The two commontypes ofdampersare the so-called blade-to-ground and blade-to-blade dampers. Duringengine operation, centrifugal forces bring the damper into contact with theblade platform, the extent of friction damping depending on the nature ofslipping motion at the contacting surface.
The primary objective of this combined analytical and experimental pro-gramwas to gain an understanding of the potentials of nonaerodynamic sourcesof damping in reducing vibration levels in jet engine blades. A criticalsurvey was conducted of the available literature dealing with vibration damp-ing, in general, and damping in jet engine blades, in particular. Thoughliterature on the subject of damping is extensive, relatively few studiesappear to be directly applicable to jet engine blades. The list of referencesgiven at the end of this report (Refs. i through 48) is not meant to be exhaus-tive and only those studies which are of direct relevance to this program areincluded in the list. Based on this survey, a series of analytical and experi-mental efforts were identified for detailed study.
In this program, single blades and blade-like componentswere analyzedand tested to obtain the contribution from each mechanismof damping. Thecomponents included a part-span-shrouded fan blade, a high pressure turbineblade, a blade-like titanium twisted plate, uniform cantilever beamsof ti-tanium, and strips of composite material. In addition, small titanium speci-menswere used in rub tests aimed at determining the nature of dry frictioncharacteristics at an interface.
No single analytical or experimental approach appeared feasible forevaluation of all sources of damping, due to the diversity of mechanismsin-volved. Analytical efforts encompassedthe mathematical modeling and analysisof each mechanism, leading to the solution of many independent problems.Experiments were conducted with the primary goal of highlighting the particu-lar mechanismunder study and every care was exercised to minimize contribu-tions from other sources. The environments that needed simulation includedcentrifugal loading and, to a limited extent, thermal condition. Special fix-tures were designedand fabricated for each series of tests. In the case ofthe twisted plate centrifugal tests were conducted in an evacuated centrifugaltest facility.
This report summarizes (i) the principal features of mathematical modelingof the several damping mechanisms, (2) the results obtained from a series oftests leading to the measurementof damping associated with each mechanism, (3)a comparison between results from analyses and corresponding tests, and (4)implications of the results of this study to blade design against resonanceand flutter.
2. TECHNICALAPPROACH
The fan blade and the turbine blade that were chosen for use in thisprogram are shown in Fig. 1 along with other test componentswhich were usedto obtain additional supporting data. The survey of literature (Refs. 1through 48) indicated that various analytical and experimental approacheswere available for the determination of damping in such components. Theseapproaches differed considerably in the level of sophistication, ease of appli-cation, and probable time needed to adapt and implement for the componentunder study. Since no single approach appeared uniquely suitable and advan-tageous, decisions to consider more than one approach were inevitably made.The final choices in each case dependedon later developments, trends observedin tests, and scheduled time and cost. Brief discussions of the technicalapproaches adopted during the program are provided below.
2.1 Analytical Approaches
The mechanismsfor which analytical approaches were sought can be broadlydivided into two classes;(1) damping caused by material hysteresis, and (2)damping caused by friction forces induced at rubbing surfaces.
2.1.1 Material Damping
Material or hysteretic damping is a material property which is measured
by the energy dissipated during cyclic strain in the material. Accurate measure-
ments show that cyclic stress-strain always has a hysteresis loop (Refs. 1 and
2). The analytical approaches for estimating material damping can be broadly
divided into (i) formulations which represent the energy loss per unit volume
per cycle of vibration in terms of stress amplitude and two material damping
constants (Refs. 1 and 2), (2) formulations which model the hysteresis loop
by a nonlinear stress-strain law for use in a forced response analysis (Refs.
5, 6, and 7), (3) formulations based on a nonexponential law of decay (Ref.
8), and (4) formulations which express the stress-strain law in terms of a
complex modulus; storage and loss modulus (Ref. i0). The first two formula-
tions appeared to be suitable for application in the present program and were
selected for detailed study.
Thus, in one approach, the hysteresis loop is modeled by a nonlinear
stress-strain law. This law is introduced into the equations of motion of a
vibrating component and a forced response solution is obtained for comparison
with experimental results. Apart from the inherent difficulties of nonlinear
analysis, such an approach is not readily applicable to components having com-
plex geometries. The alternate approach starts with a representation of the
energy dissipated at a point in the material in terms of two material dampingconstants and the vibratory stress amplitude at the point. Total energy dissi-pated is obtained by summingthe energy dissipated at all points in the com-ponent. The procedure calls for a knowledge of vibratory modal stress dis-tribution, which can be determined accurately even for componentssuch as jetengine blades, having complex geometries, In view of its generality, thelatter approach was adopted in this program. Subsequently, the approach usingthe nonlinear stress-strain law was used to develop a procedure for determiningthe two damping constants.
The ratio of total energy dissipated (D) to the maximumstrain energy,(U), during one cycle of vibration, is used as the measure of material dampingfor a component. Thus, the component"loss factor" q is defined as
1 Dn = 2_ I] (2.1)
2,1.2 Friction Damping
Depending on conditions at an interface between two contacting components,
energy dissipation due to friction may involve different mechanisms. The
analytical approaches for estimating friction damping can be broadly classi-
fied as follows: (i) macroslip approach (Refs. 13 through 17), and (2) micro-
slip approach (Refs. 23 through 25). In the macroslip approach the entire
interface is assumed to be either slipping or stuck. The friction mechanism
is either replaced by an equivalent linear viscous model or assumed to be
governed by some form of Coulomb's law of dry friction. The effect of fric-
tion damping is obtained by determining the forced response of the component.
The analysis involved is relatively straightforward and the justification for
widespread use of this approach is its effectiveness at predicting the actual
response. However, there gs some question as to the validity of the macroslip
approach when the interface has a large area, and is subjected to a nonuniform
load distribution. In the microslip approach a relatively detailed analysis
of the stress distribution at the interface is carried out, typically via a
finite-element procedure. The extent of local slip, not necessarily throughout
the interface, between pairs of contacting points is determined by applying
Coulomb's law of friction to the normal and tangential stresses. A detailed
knowledge of interface slip dynamics can be obtained from this approach.
However, the computational effort needed to modify, iteratively, the inter-
face stress distribution subsequent to local slipping can make the microslip
approach unacceptable in a practical application.
In the context of jet engine blades, the macroslip approach was found to
be suitable for modeling the friction mechanism and was therefore adopted in
this program. Friction damping in jet engine blades arises from slip at the
root, shroud rubbing, and rubbing due to a platform damper. Tile problem ineach case can be described, in a broad sense, as one of determining the effectof friction forces, at somelocation along the span, on the vibratory motionof the blade. The mathematical model in each case is derived by using a modalapproach. The governing equation of motion for a blade can be written as(Ref. 46)
(2.2)
where M, K represent the mass and stiffness matrices. The vector F includesexternal excitation as well as any friction damping forces. All other damp-ing forces, such as material damping, are included in the equivalent viscousdampingmatrix C. The free vibration solution of Eq. (2.2) provides naturalfrequencies, modeshapes, and modal masses. By defining a modal matrix
assuming that,
.... (2.3a)
(2.3b)
and using the orthogonality property of the mode shapes, Eq. (2.2) can be
transformed into
(2.4)
where modal damping has been assumed.
Assuming that external excitation is harmonic, the main interest is in the
case where the excitation frequency is near one of the blade natural fre-
quencies; that is, the near resonance condition. In fact, it is precisely
at this near resonance condition that damping plays a crucial role in limiting
the otherwise high blade stresses. Since the thrust of this program is
toward evaluating the influence of damping on blade responses, attention is
focused on a single chosen mode of blade vibration. Thus, the matrix Eq. (2.4),
can be reduced to
m_, + C_, + kx = P cos u)t + Fd, (2.5)
where m, c, and k are modal quantities associated with the modeunderconsideration. P is the excitation amplitude, _ is the excitation fre-quency, and Fd accounts for friction damping forces. Equation (2.5), withappropriate modifications and extensions, forms the basis of study for eachof the friction dampingmechanisms_considered. The precise form of Fd, ofcourse, depends on the particular source of friction damping (i.e., rootslipping, shroud rubbing, and friction due to platform damper).
An assumption which is implicit in the use of Eq. (2.5) is that thefriction damping does not drastically alter blade resonant frequency andmodeshape, so that attention can be focused on a single chosen modeofvibration. The validity of this assumption is questionable if the analyticalmodel is to cover the entire range of conditions at an interface, the twoextremes being the fully stuck (no slip) condition and the freely slipping(zero normal load) condition. However, if the vibratory environment is suchthat the condition at an interface remains close to one of the extremes, thenthe assumption madeabove is valid, and use of Eq. (2.5) is justified.
In this report, the measure of friction damping is given as the increaseof loss factor and/or attenuation of blade response over a "baseline" orreference condition. The loss factor is defined in Eq. (2.1) (i.e., propor-tional to the ratio of energy dissipated to maximumstrain energy, during onecycle of vibration). The baseline condition is simply a condition where thevibratory characteristics of the blade (tip amplitude, blade stress) are known.For example, the condition of no slip at the interface (i.e., no frictiondamping) can serve as a baseline condition.
The principal features of the computer programs developed during thecourse of this investigation are presented in Appendix A.
2.2 Experimental Procedures
The choice of the experimental procedure to measure the contribution ofa specific mechanismto the overall damping in a jet engine blade is governedby a numberof requirements derived from considerations of the design andoperational aspects. The requirements are:
a. the test item is generally small with a complex shape;
b. the test item is cantilevered but with the possibility of relative motion
at the root;
c. damping to be measured in a single mode;
d. somevery low damping levels to be expected;
e, enviromental considerations to include a centrifugal force field,
elevated temperatures;
f. rubbing friction effects at root and shroud to be studied;
g. air damping effects to be eliminated or accounted for.
This list is not exhaustive but represents the major considerations used
when planning the various aspects of the experimental procedures, i.e., (i)
fixture design, (2) method of excitation, (3) environmental simulation, and
(4) measurement method.
2.2.1 Fixture Design
In tests involving the measurement of damping, enormous care needs to be
exercised in fixture design so that fixture participation, both in resonant
response and damping, can be minimized. In the present program, special
fixtures were designed and fabricated with the goals of providing as realis-
tic an environment as possible and highlighting the particular damping
mechanism under study.
The basic fixture arrangement used for measuring material damping in
blade-like components was a massive root block set in a rigid (within the
test frequency range) vacuum chamber and mounted to a slip plate so that
vibration could be applied in the horizontal direction. This method was
chosen because it provided a convenient way of applying adequate excitation
force to the component in an evacuated environment and also for providing
means for loading the shrouds and dovetail bearing surfaces of the fan blade.
The block, vacuum chamber, slip plate, and shaker armature formed a massive
root restraint for the test component.
The component used in the centrifugal tests was a titanium twisted plate
having an integral massive root bayonet fitting which locked into the end
of the rotating arm; see Figs. 2 and 3. A special locknut arrangement was
devised to ensure that the loading in the bayonet fitting did not vary with
rotational speed.
The fixture for platform damping investigation was basically a heavy
clamp to hold the root of the turbine blade and a mechanical means provided
to allow a damper to rub on the platform of the blade; see Fig. 4. The
assembly was mounted on top of an electrodynamic shaker. An evacuated
environment was considered unnecessary because of the expected small blade
amplitude and high damping levels from the external damper.
2.2.2 Methods of Excitation
The external excitation on a blade or blade-like component can be provided
by a hammer impulse, an initial tip deflection, a sinusoidally varying tip
force from a noncontacting magnetic driver or a sinusoidally varying root
displacement. For each specific test, the method of excitation and the
design of the fixture had to be chosen on the basis of the force levels re-
quired, the ease of operation and control, and applicability to the measure-
ment method to be employed. In this program all excitation (except that used
in centrifugal tests), was sinusoidally varying root displacement provided
by an electrodynamic shaker. In the centrifugal tests, the twisted plate
was excited by a noncontacting electromagnetic driver located at the tip.
2.2.3 Environment Simulation
Since this program is concerned with evaluation of nonaerodynamic sources
of damping, every effort was made tO minimize, if not eliminate, air damping
effects. Test components were enclosed in a specially designed chamber con-
nected to a vacuum pump. A centrifugal test facility was used to apply cen-
trifugal loading to a twisted plate in an evacuated condition. In an operat-
ing engine, centrifugal forces lead to interfacial loading between contacting
components. Since all friction damping tests in this program were bench tests,
the interfacial loading was applied and controlled by specially designed
loading mechanisms. Tests conducted to study the effect of temperature on
damping of a fan blade called for the simulation of a typical operational
thermal environment. This was done by using blowdrier heater elements to
provide radiation heating.
2.2.4 Measurement Methods
Measurement methods fall into three general categories, (i) decay measure-
ment, (2) frequency response analysis, and (3) direct measurement. The
decay measurement involves the initial excitation of the test item and an
analysis of the subsequent response signature when the excitation force is
suddenly removed. The form of the transient is a decaying sinusoid for
response in a single mode. If the envelope of this response is considered,
the loss factor can be determined from a plot of log amplitude versus time
(log decrement - Refs. 33 and 34). A variant of this method is to average
over a large number of cycles of the quasi-transient behavior of a system
subjected to random excitation (random decrement) (see Ref. 34).
The difficulty in decay measurements using the log decrement method is in
producing a transient with a single frequency content. The problem is minimized
if an initial sinusoidal excitation of a single mode is employed and the modes
are well spaced (Ref. 7). More general transients, however, can be analyzed by
using fast Fourier transform techniques to obtain frequency response functions.
If this response (both magnitude and phase) is examined close to a modal frequency,
the modal damping can be obtained by a "Nyquist" curve fit around the resonance.The procedure for performing this has been automated in computing systems avail-able on the market (see Refs. 35-37, 38).
The frequency response method involves driving the test item through itsresonance either by a sinusoidal sweepor dwells at discrete frequencies.Responseamplification as well as phase angle between output motion and inputforce or motion are examined (Ref. 20). Onemeasure of loss factor for singledegree of freedom systems is the value of the inverse of transmissibility(Ref. 39). Another, of course, is by way of measuring the bandwidth athalf power points (Ref. 40).
The frequency phase method described in Ref. 41 enables the loss factorto be determined by measurementof the input frequency as well as the phasebetween response and exciting force. Thesemeasurementsare madeat a fre-quency slightly off resonance. The calculation is independent of the gainsetting of the equipment and hence the problem of maintaining constant inputlevel is obviated.
The direct measurementmethod (Refs. 42 and 43) requires the system to bedriven sinusoidally at constant amplitude at or near resonance and the energyinput is measured. Since measurementis madeat constant amplitude, theenergy dissipated per cycle is equal to the average energy input per cycle.The loss factor can be found from the ratio of this value and an independentlydetermined value of the maximumkinetic energy in a cycle. The estimate ofthe latter maybe madeanalytically.
The Co and Quad (see Refs. 44 and 45) method is similar to the modalanalysis (FFT) method in that it separates the response vector (in transferfunction form) into its real and imaginary parts and uses a Nyquist plot todetermine the modal damping. However, the input in this case is a sine sweepat constant level. Alternatively, the damping factor mayalso be obtainedfrom the frequencies of the maximumand minimumamplitudes of the quadraturecomponentabout a resonance (see Refs. 44 and 45)
Each of the above methods has its own advantages and disadvantages rela-tive to a particular application. Oneor more of the above methods were usedin making measurementsof damping in this program. In certain cases, certainmodifications were madeto these methods and will be described in the appro-priate sections of this report.
3. MATERIALDAMPING
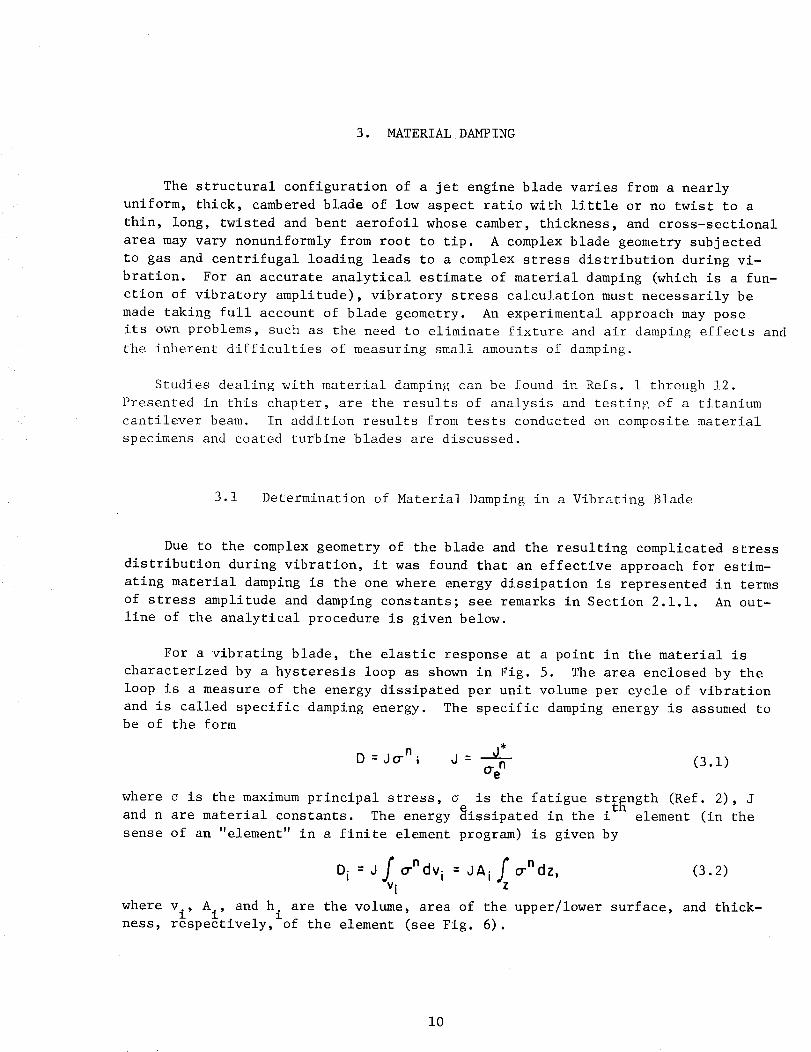
The structural configuration of a jet engine blade varies from a nearlyuniform, thick, camberedblade of low aspect ratio with little or no twist to athin, long, twisted and bent aerofoil whose camber, thickness, and cross-sectionalarea may vary nonuniformly from root to tip. A complex blade geometry subjectedto gas and centrifugal loading leads to a complex stress distribution during vi-bration. For an accurate analytical estimate of material damping (which is a fun-ction of vibratory amplitude), vibratory stress calculation must necessarily bemadetaking full account of blade geometry. An experimental approach mayposeits own problems, such as the need to eliminate fixture and air damping effects andthe inherent difficulties of measuring small amounts of damping.
Studies dealing with material damping can be found in Refs. 1 through 12.Presented in this chapter, are the results of analysis and testing of a titaniumcantilever beam. In addition results from tests conducted on composite materialspecimens and coated turbine blades are discussed.
3.1 Determination of Material Dampingin a Vibrating Blade
Due to the complex geometry of the blade and the resulting complicated stressdistribution during vibration, it was found that an effective approach for estim-ating material damping is the one where energy dissipation is represented in termsof stress amplitude and damping constants; see remarks in Section 2.1.1. An out-line of the analytical procedure is given below.
For a vibrating blade, the elastic response at a point in the material is
characterized by a hysteresis loop as shown in Fig. 5. The area enclosed by the
loop is a measure of the energy dissipated per unit volume per cycle of vibration
and is called specific damping energy.
be of the form
The specific damping energy is assumed to
d_D = jo'n_ J =
(y£ (3.1)
where o is the maximum principal stress, o is the fatigue strength (Ref. 2), Jand n are material constants. The energy _issipated in the i element (in the
sense of an "element" in a finite element program) is given by
D i =J_.o'ndvi = JAi_o-ndz, (3.2)l
where v., A., and h. are the volume, area of the upper/lower surface, and thick-1 1
ness, respectively,lof the element (see Fig. 6).
10
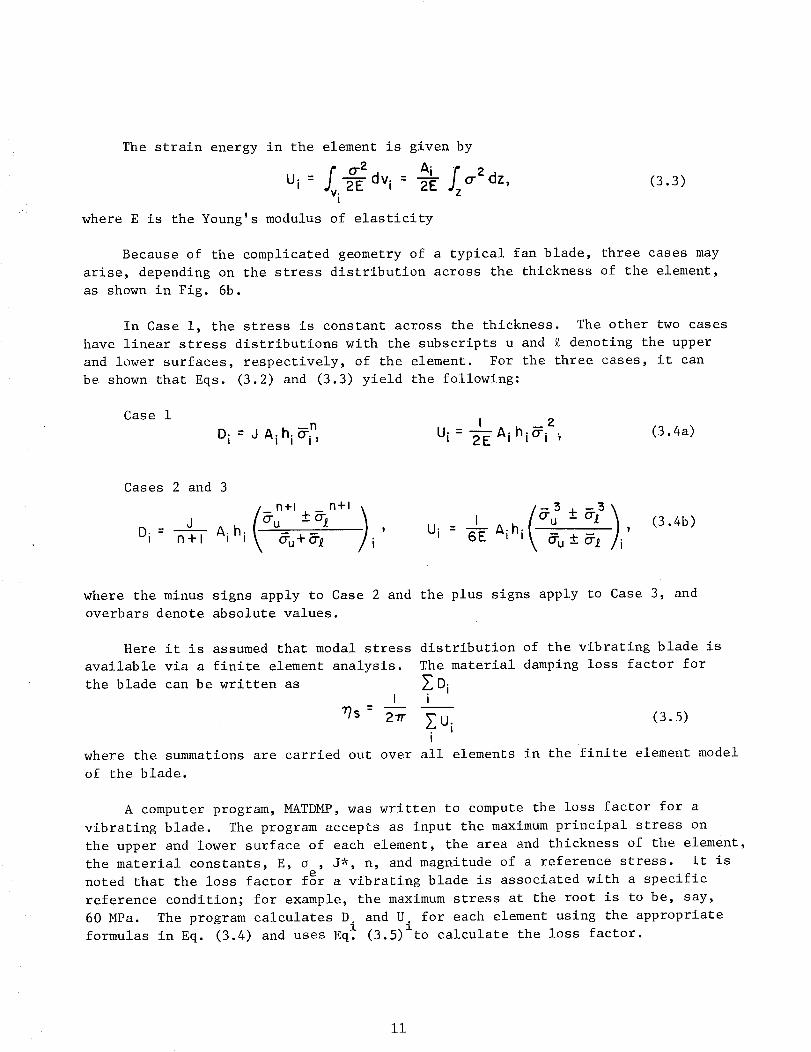
The strain energy in the element is given by
_v °'2 Ai _zO..2U i = .-_--_ dv i = _ dz,i
where E is the Young's modulus of elasticity
(3.3)
Because of the complicated geometry of a typical fan blade, three cases may
arise, depending on the stress distribution across the thickness of the element,
as shown in Fig. 6b.
In Case i, the stress is constant across the thickness. The other two cases
have linear stress distributions with the subscripts u and % denoting the upper
and lower surfaces, respectively, of the element. For the three cases, it can
be shown that Eqs. (3.2) and (3.3) yield the following:
Case 1--n I 2
Di = d Aihio-i, U i = -_Aihi_ i _ (3.4a)
Cases 2 and 3
/ 13+1 _ 13+1 \
J (O'u _+o_ 1 'Di : n+l Aihi \ _'u+_-_ i' -+U i : _ Aihi
\
(3.4b)
where the minus signs apply to Case 2 and the plus signs apply to Case 3, and
overbars denote absolute values.
available via a finite element analysis.
the blade can be written asI
_s : 2_
Here it is assumed that modal stress distribution of the vibrating blade is
The material damping loss factor for
ZU i (3.5)i
where the summations are carried out over all elements in the finite element model
of the blade.
A computer program, MATDMP, was written to compute the loss factor for a
vibrating blade. The program accepts as input the maximum principal stress on
the upper and lower surface of each element, the area and thickness of the element,
the material constants, E, o , J*, n, and magnitude of a reference stress. It is
noted that the loss factor f_r a vibrating blade is associated with a specific
reference condition; for example, the maximum stress at the root is to be, say,
60 MPa. The program calculates D and U° for each element using the appropriatei i
formulas in Eq. (3.4) and uses Eq. (3.5) to calculate the loss factor.
ii
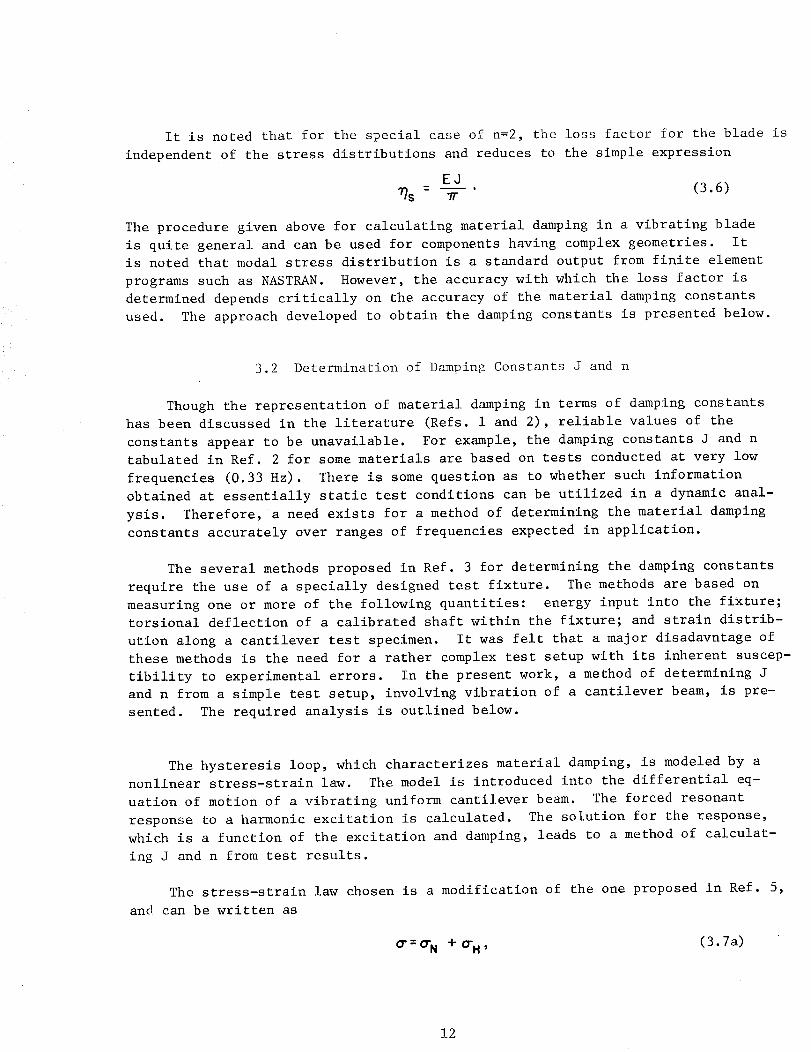
It is noted that for the special case of n=2, the loss factor for the blade isindependent of the stress distributions and reduces to the simple expression
EJ-- . (3.6)
The procedure given above for calculating material damping in a vibrating bladeis quite general and can be used for componentshaving complex geometries. Itis noted that modal stress distribution is a standard output from finite elementprograms such as NASTRAN.However, the accuracy with which the loss factor isdetermined depends critically on the accuracy of the material damping constantsused. The approach developed to obtain the damping constants is presented below.
3.2 Determination of DampingConstants J and n
Though the representation of material damping in terms of damping constantshas been discussed in the literature (Refs. i and 2), reliable values of theconstants appear to be unavailable. For example, the damping constants J and ntabulated in Ref. 2 for somematerials are based on tests conducted at very lowfrequencies (0.33 Hz). There is somequestion as to whether such informationobtained at essentially static test conditions can be utilized in a dynamic anal-ysis. Therefore, a need exists for a method of determining the material dampingconstants accurately over ranges of frequencies expected in application.
The several methods proposed in Ref. 3 for determining the damping constantsrequire the use of a specially designed test fixture. The methods are based onmeasuring one or more of the following quantities: energy input into the fixture;torsional deflection of a calibrated shaft within the fixture; and strain distrib-ution along a cantilever test specimen. It was felt that a major disadavntage ofthese methods is the need for a rather complex test setup with its inherent suscep-tibility to experimental errors. In the present work, a method of determining Jand n from a simple test setup, involving vibration of a cantilever beam, is pre-sented. The required analysis is outlined below.
The hysteresis loop, which characterizes material damping, is modeled by anonlinear stress-strain law. The model is introduced into the differential eq-uation of motion of a vibrating uniform cantilever beam. The forced resonantresponse to a harmonic excitation is calculated. The solution for the response,which is a function of the excitation and damping, leads to a method of calculat-ing J and n from test results.
The stress-strain law chosen is a modification of the one proposed in Ref. 5,and can be written as
_=_N +CrH' (3.7a)
12
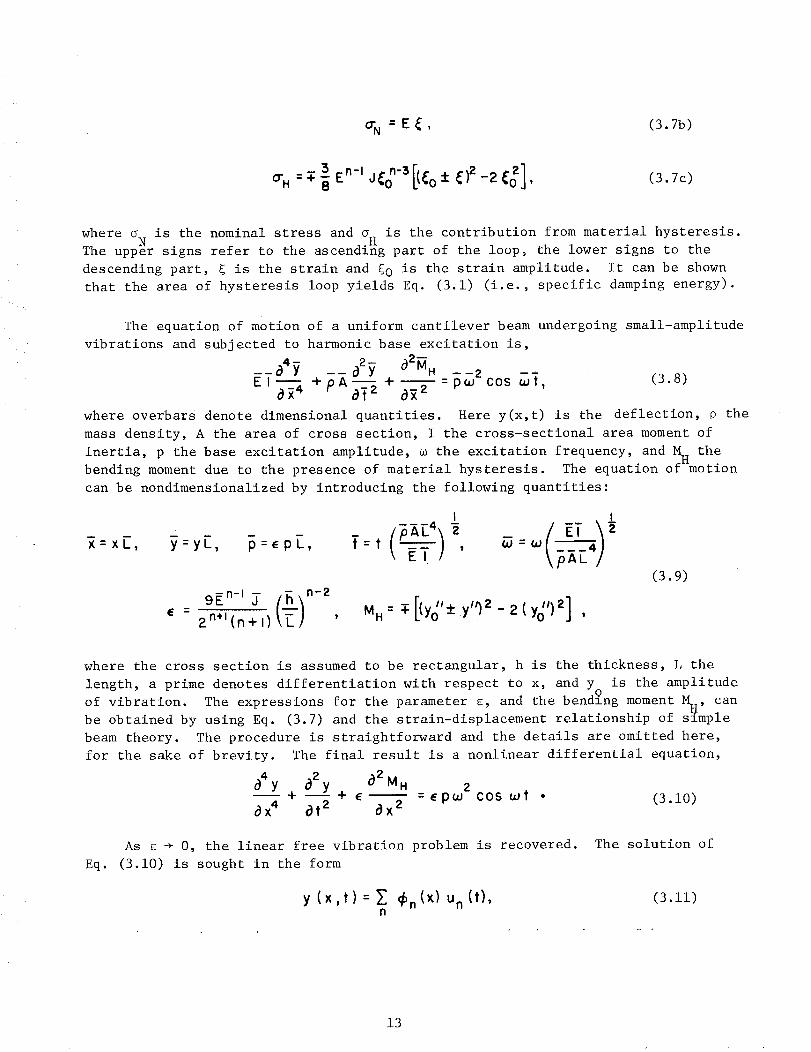
(rN = E _, (3.7b)
'[C 0+o-H = T-_ J _ )2_2 (3.7c)
where oN is the nominal stress and oH is the contribution from material hysteresis.The upper signs refer to the ascending part of the loop, the lower signs to the
descending part, _ is the strain and _O is the strain amplitude. It can be shown
that the area of hysteresis loop yields Eq. (3.1) (i.e._ specific damping energy).
The equation of motion of a uniform cantilever beam undergoing small-amplitude
vibrations and subjected to harmonic base excitation is,
___4y __ _2y 02MH --2 --E I -- + p A + - p w COS w t (3.8)
R4 _ b_ 2
where o_erbars denote dimensional quantities. Here y(x,t) is the deflection, p the
mass density, A the area of cross section, I the cross-sectional area moment of
inertia, p the base excitation amplitude, m the excitation frequency, and M the
bending moment due to the presence of material hysteresis. The equation ofHmotion
can be nondimensionalized by introducing the following quantities:
I I
R=x[, y=y[, p =E p[., t=t IT ' _ = _\}kC /
9En-I 7 (_) n-2E - n+lz (n+l)
M.:• [(yo'±y'O
(3.9)
-2(y(_)2] ,
where the cross section is assumed to be rectangular, h is the thickness, L the
length, a prime denotes differentiation with respect to x, and YO is the amplitude
of vibration. The expressions for the parameter E, and the bendlng moment MH, can
be obtained by using Eq. (3.7) and the strain-displacement relationship of simple
beam theory. The procedure is straightforward and the details are omitted here,
for the sake of brevity. The final result is a nonlinear differential equation,
_21 _2 Y MH 2O4Y + 1 + E _ = (pw cos wt • (3.10)_X 4 _t 2 _X
As e + 0, the linear free vibration problem is recovered. The solution of
Eq. (3.10) is sought in the form
y (x,t) = Z @n (X) Un (t), (3.11)n
13
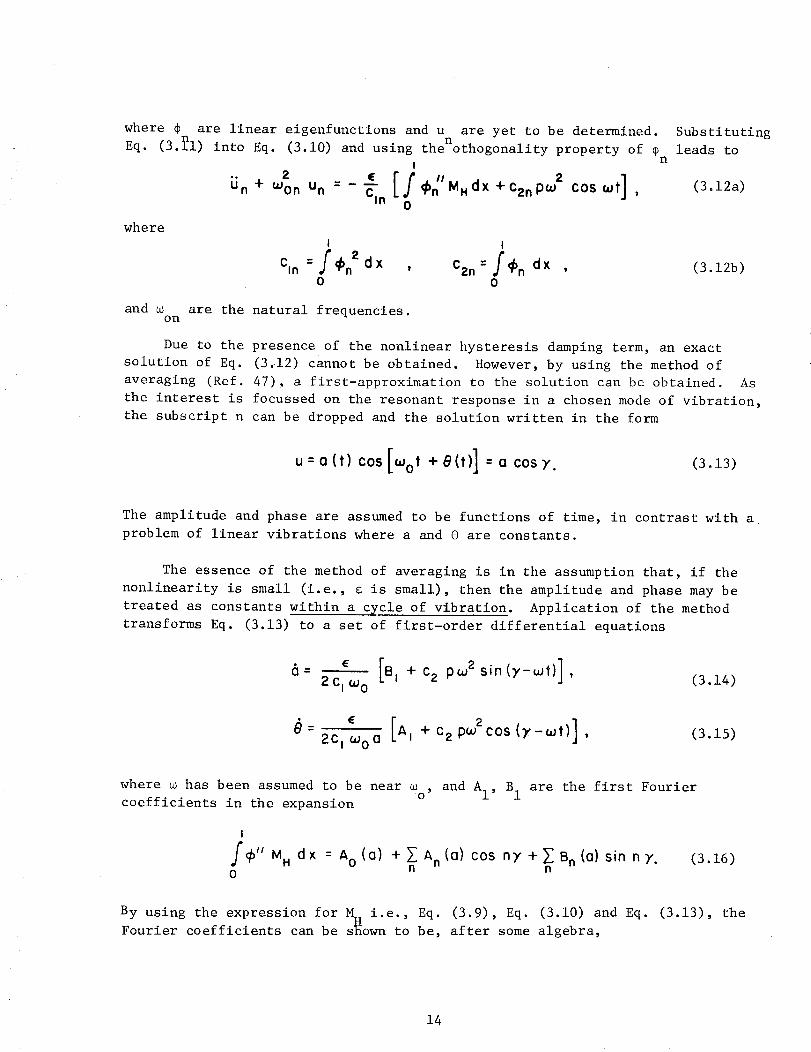
where _ are linear eigenfunctions and u are yet to be determined.nEq. (3._i) into Eq. (3.10) and using the othogonality property of
I n
2 , [: q_n,,MHdX +C2nP(,.2 ]LJn + WOn Un = -- COS _ut ,cln o
where
I I
Cln =:_n2dX , C2n=:_n dX ,0 0
Substituting
leads to
(3.12a)
(3.12b)
and m are the natural frequencies.on
Due to the presence of the nonlinear hysteresis damping term, an exact
solution of Eq. (3..12) cannot be obtained. However, by using the method of
averaging (Ref. 47), a first-approximation to the solution can be obtained. As
the interest is focussed on the resonant response in a chosen mode of vibration,
the subscript n can be dropped and the solution written in the form
u=o (t) cos + e(t)] =a cosy. (3.13)
The amplitude and phase are assumed to be functions of time, in contrast with a
problem of linear vibrations where a and 0 are constants.
The essence of the method of averaging is in the assumption that, if the
nonlinearity is small (i.e., e is small), then the amplitude and phase may be
treated as constants within a cycle of vibration. Application of the method
transforms Eq. (3.13) to a set of first-order differential equations
E [B+C2 p_2 ]- 2CI _0 l sin (y-wt) , (3.14)
" [ ]- 2c,(_o o A, +c 2pJcos(y-mt) , (3.15)
where _ has been assumed to be near _o' and AI, B 1 are the first Fouriercoefficients in the expansion
I
:_H MH dx = AO (a) + _ An(a) COS n7 +T.. Bn (a)sin nT.o n n
(3.16)
By using the expression for M i.e., Eq. (3.9), Eq. (3.10) and Eq. (3.13), the
Fourier coefficients can be s_own to be, after some algebra,
14
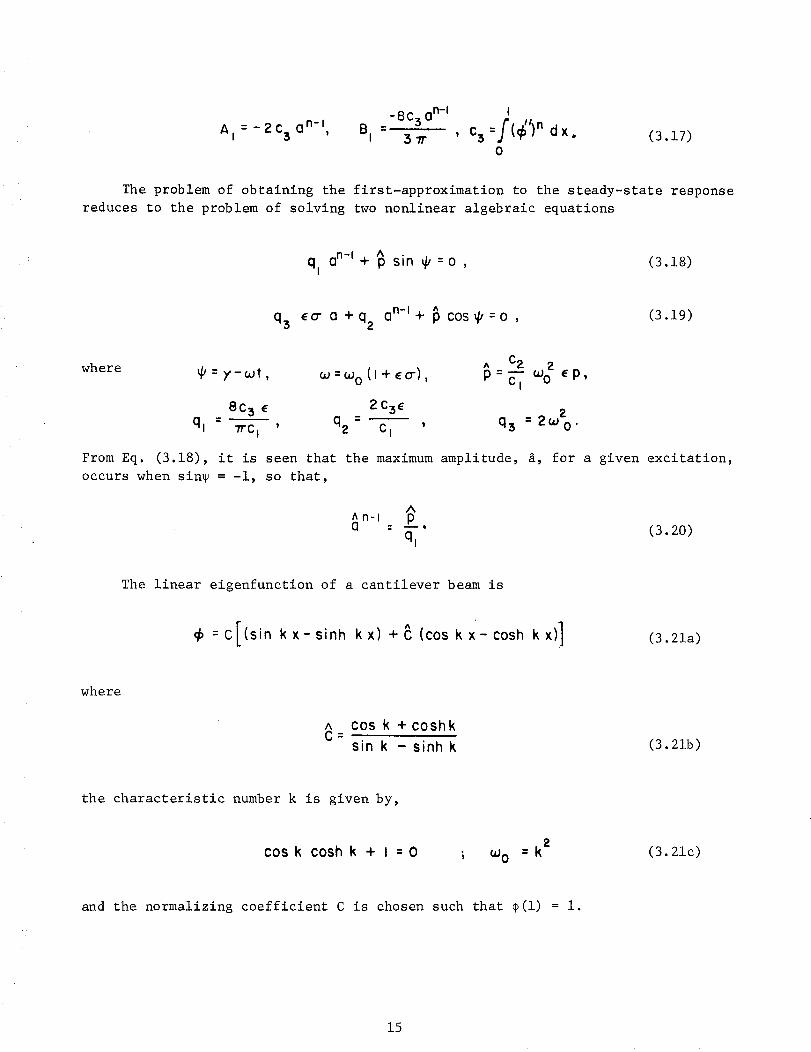
_8c 3 an-I I- :f .AI =-2C3 On-l' BI 3Tr , C3 ( n dx (3.17)
0
The problem of obtaining the first-approximation to the steady-state response
reduces to the problem of solving two nonlinear algebraic equations
q,an-'+'_sin_ =o , (3.18)
q3 _o" a +q2 an-'+ _ cos_=o , (3.19)
where= y-cOt, oJ =W 0 (I+ _0"),
8C 3 E 2 C3_
ql = "rrc I ' qz C I '
C2
,Oo,p,
q3 : 2w2 O"
From Eq. (3.i8), it is seen that the maximum amplitude, _, for a given excitation,
occurs when sin_ = -i, so that,
AAn-I pCl = _ •
ql(3.20)
The linear eigenfunction of a cantilever beam is
=C[(sin kx-sinh kx)+_ (cos kx-cosh kx)] (3.21a)
where
^ cos k +coshkC:
sin k - sinh k (3.21b)
the characteristic number k is given by,
cos k cosh k + I = 0 ; w 0 =k a (3.21c)
and the normalizing coefficient C is chosen such that _(I) = I.
15
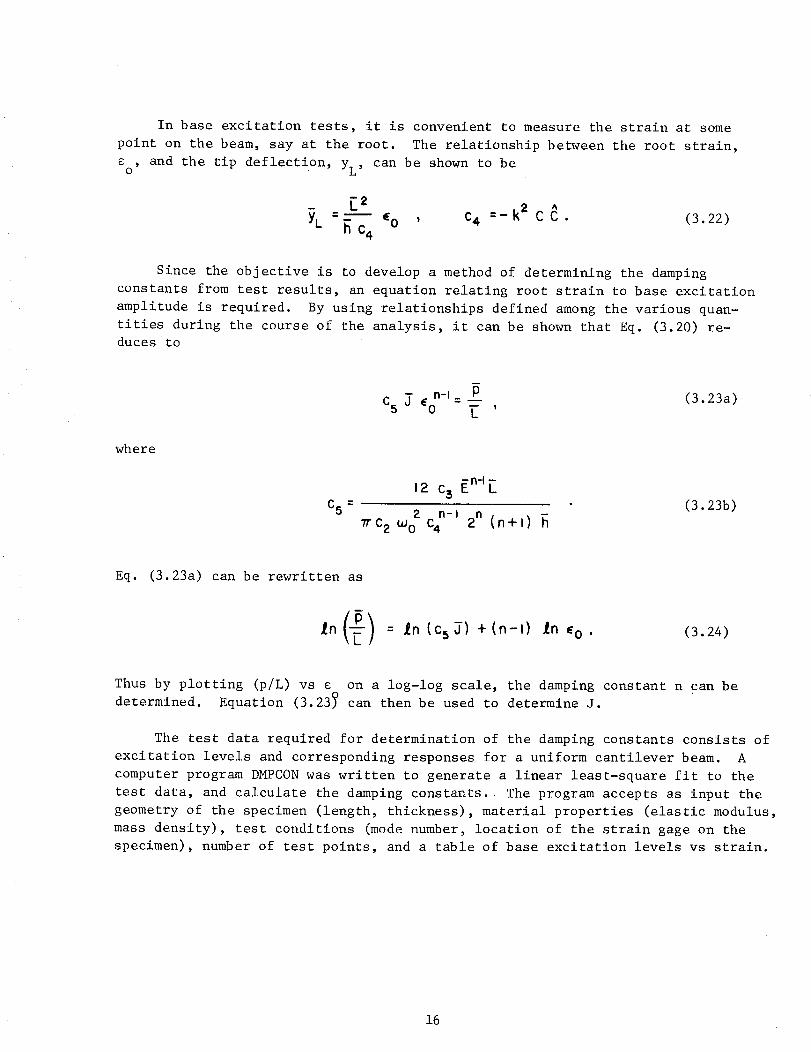
In base excitation tests, it is convenient to measure the strain at somepoint on the beam, say at the root. The relationship between the root strain,o' and the tip deflection, YL' can be shownto be
[___2 =_ k2
YL =_ C4 EO ' C4 C _. (3.22)
Since the objective is to develop a method of determining the damping
constants from test results, an equation relating root strain to base excitation
amplitude is required. By using relationships defined among the various quan-
tities during the course of the analysis, it can be shown that Eq. (3.20) re-ducesto
where
$ E n = _ (3.23a)C5 o L '
12 % En-lr_
C5: 2 n-I 2n (3.23b)",'rc2 wo c4 (n+l)
Eq. (3.23a) can be rewritten as
(3.24)
Thus by plotting (p/L) vs e on a log-log scale, the damping constant n can be
determined. Equation (3.23Y can then be used to determine J.
The test data required for determination of the damping constants consists of
excitation levels and corresponding responses for a uniform cantilever beam. A
computer program DMPCON was written to generate a linear least-square fit to the
test data, and calculate the damping constants. The program accepts as input the
geometry of the specimen (length, thickness), material properties (elastic modulus,
mass density), test conditions (mode number, location of the strain gage on the
specimen), number of test points, and a table of base excitation levels vs strain.
16
3.3 Material DampingTests
The series of tests that will be discussed in this section focussed on thedetermination of the characteristics of damping inherent in the titanium alloy(8-1-1). Thus, tests were performed (i) on a uniform cantilever beamto determinedamping constants J and n, (2) on a twisted plate on the bench as well as in acentrifugal force field to determine damping, (3) on a fan blade to determine itsmaterial damping characteristics. All tests were conducted under evacuated con-ditions to minimize, if not eliminate, air damping effects.
3.3.1 Uniform Cantilever Beam
The objective of this test was to determine the material damping constantsJ and n for a typical titanium alloy in bending and at typical blade responsefrequencies.
3.3.1.1 Test Approach
In Section 3.2, a relationship between the maximumbending strain and peakinput acceleration (sinusoidal forcing function) at the root of a uniform can-tilevered beamis derived in terms of the constants J and n. The log-log plotof the peak excitation amplitude versus the corresponding maximumroot strainhas been shownto be a straight line from which the constants can be determined.The approach chosen therefore was to tightly clamp a beamtest piece at one endand subject it to harmonic excitation measuring the strain at a point close tothe root for a range of peak excitation amplitudes and in each of its firstthree modes. The root strain was derived from the measuredstrain using thestandard beamfunctions (Ref. 48).
The test piece, as shownin Fig. 7a, was designed and built incorporatingthe following criteria someof which were in accordance with Ref. 39.
a) Titanium 8-1-1 alloy to be used,
b) Single cantilevered beamconfiguration,
e) The clamped length of the beam to be at least one tenth the beam length
and have a thickness of at least three times the beam thickness to min-
imize clamping effects,
d) The aspect ratio to be at least 6:1 to minimize Poisson's ratio effects,
e) The root radius to be equal to the beam thickness to minimize the stress
concentration factor,
f) The uniformity of thickness and width along the beam length to be better
than 1%,
g) The first three resonant frequencies to be in the range 60 to 1200 Hz,
17
h) The piece to be machined from bar stock with successively reduced cutsto minimize residual stresses,
i) Surfaces to be finely ground.
A special clamp (see Fig. 7b) was designed to enable the test piece to berigidly held in the vacuumchamberof the basic fixture assembly described inAppendix B. A torque of 27 m.N was found to be sufficient to clamp the testpiece, as no change in beamresponse (vibrating in first modein air) was ob-served as the torque was increased further. The input control accelerometerwas mounted directly on the clamp near the root of the beam.
3.3. i. 2 I_ns__tr_umentatio_n-
The instrumentation system used is basically the sameas that discussed indetail in Appendix B with the exception that the X-Y plotter was used only torecord steady state strain levels (unfiltered, rms) with no horizontal sweeptime base involved. The signal from the input control accelerometer (VSSType i01,SNI05) was amplified 20 dB prior to entering the servo control unit during exci-tation of the first beambending modeso that the required low acceleration levels(g<.l) could be applied. The response of the blade was obtained from a straingage (Micro-MeasurementsType EA-15-062AK-120)mounted 17.2 mmfrom the root. Thegage lead-in wires were routed and epoxied in such a way as to minimize any damp-ing or mass effects.
3.3.1.3 Test Results
A fixture check out confirmed that there were no fixture resonances nearthe blade modal frequencies of interest. There was, however, a high frequencycomponentnoted in the input acceleration signal. This was eliminated by theuse of a 50 Hz bandwidth tracking filter inserted in the excitation circuitbetween the signal conditioner and the servo control unit.
Owing to the very low dampingin the beam (_ _ .0002) the maximumresponseamplitude of the beamwas difficult to obtain. The signal generator instabilitygenerally exceeded the half power bandwidth of the response. However, by care-ful tuning procedures using a Lissajous figure displayed on an oscilloscope andrepeated attempts, a reliable Value for the peak response was obtained. Whenthe peak value of the response _Jasconsidered to have been obtained, the straingage level was read off the digital voltmeter and also recorded on the X-Yplotter. The excitation period was noted when th_ response ellipse axis onthe scope was veritical.
All tests were performed with the pressure inside the chamberreduced to15 torr. The final set of response data for each of the three beammodesisshownin Table I. These data were reduced using the expressions given inAppendix B and using the following equipment settings and other data:
18
Input accelerometer conditions setting 41.8 mv/g
Strain gage and lead in wire resistance 120.5
Gage factor 1.995
Strain gage translator setting 3.6
Assumedmodulus of elasticity 124 GPa
3.3.2 Twisted Plate - Bench and Spin Tests
Using the analysis of Section 3.1, the loss factor for a bladelike structure
having a complex shape may be computed from the maximum principal stresses in
a given mode. As a first step in applying this method to an actual fan blade, a
uniform, twisted plate was chosen. The test objectives were to measure the forced
response of the plate and to determine its loss factors both on the bench and
with the plate subjected to a centrifugal force field.
3.3.2.1 Test Approach
The analysis of Section 3.1 requires the determination of the principal
stresses thorughout the component. However, if the responses are modal then the
stress at one point can be used to scale the modal stress distributiom. Therefore
the test method chosen was to harmonically excite the plate which was held rig-
idly at its root in a massive block and measure the strain response using miniature
strain gages at its root for various levels of forcing. The loss factors were
estimated from root strain transient response curves resulting from abrupt cut
off of the harmonic excitation, i.e., in an essentially single mode response.
The application of an overall steady force field was obtained by mounting the
plate on the end of a centrifuge arm and spinning it. For this series of tests,
the harmonic excitation was provided by means of an electromagnetic driver located
at the tip of the plate.
The test specimen was a titanium alloy 8-1-1 plate of aspect ratio, 3.
The dimensions were 15.24 x 5.08 x .25 cm with the plate linearly twisted to
give a twist of 30.5 ° (actual) relative to the root. Similar design and fabric-
ation guidelines to those used for the uniform beam were used in this case (see
Section 3.3.1). However, the root attachment of the centrifuge arm required a
special design. The final design shown in Fig. 3, incorporated the following
features:
i. A root mass that was large compared with that of the plate.
2. A minimum of mating surface area at the connection between the root and
centrifuge arm.
19
. Preloaded mating surfaces using a special locknut arrangement (torque
to 680 Nm) such that the load remained constant over the range of test
speeds.
4. Integral plate and root bayonet fitting.
A steel shim, 0.i mm thick, was glued near the tip of the plate to permit
magnetic excitation, see Fig. 2. The magnetic driver was attached to the arm by
means of a steel tube surrounding the test piece. The test assembly in the cen-
trifuge is shown in Fig. 8. The plate tip radius was 72.59 cm.
For bench tests, the plate was mounted in the fixture/vacuum chamber as
shown in Fig. 9 and described in Appendix B, using a clamp adapter. This clamp
was mounted on the massive steel root-block and held the bayonet fitting of the
plate by means of four large bolts. The root chord of the plate was positioned
vertically.
The plate was instrumented with two longitudinal strain gages (Micromeasure-
ments Type EA-06-062AK-120) mounted 0.64 cm from the root and edges of the plate
as shown in Fig. 2. These positions corresponded with the root edge elements used
in the finite element structural analysis model shown in Fig. i0. The length of
wire on the actual plate was minimal with the wire routed along the radius and
then up through a hole in the root. The wire was epoxied in place.
3.3.2.2 Instrumentation
The instrumentation system used in the centrifugal tests is shown in a block
diagram in Fig. ii. The plate was excited by means of a small electromsgmetic
driver located near the tip of the plate (see Fig. 2). Power for the driver was
provided via slip rings by an MB Electronics power amplifier and the frequency
was controlled by a B&K sweep oscillator. A Fluke counter provided an accurate
readout of the input signal period. The pSate strain gages were wired through
slip rings to a pair of strain gage translators. These provided a calibrated
signal to a narrow band pass filter and amplifier. The signal with high and low
frequency noise removed was recorded on a B&K level recorder operating in the
peak mode. Decays were obtained on this recorder and loss factors determined
using the method described in Appendix B. The recording system used for the
bench testing is essentially the same as the system described in Appendix B
except that the narrow band filter was not required since the noise level was
considerably lower. The excitation system used is described in Appendix B with
the amplifier in the input circuit to enable the very low (< 0.02g) acceleration
levels to be applied. The input control accelerometer (VSS type i01, S/N 105)
was mounted directly onto the thickened root (bayonet fitting) of the plate test
piece as shown in Fig. 8. For both tests, all output voltage rms readings were
taken from a digital voltmeter and that level was noted on the charts.
20
3.3.2.3 Testin__ and Results
Prior to testing in the centrifuge, the armwas carefully balanced usingfinely adjustable counter balance weights. Testing consisted of exciting theplate at each of its first three natural modes, namely first bending, secondbending and first torsion modes, in air (at 0 rpm only) and in partial vacuum(5 torr) at rotational speeds up to 1508 rpm. The procedure used was to bringthe plate to resonance, as indicated by a steady maximumresponse, and abruptlycut-off the excitation, thus obtaining a record of decaying signals from straingages mounted near the root. The magnethad to be repositioned to obtain maximumresponse in each mode. The system used was found to be susceptible to noisefrom the slip rings and interference from neighboring rigs. However, by repeat-ing the tests at each test point a numberof times, reasonably consistent resultswere obtained. In all, data were recorded from a total of 120 tests in a par-tially evacuated environment of 5 torr. A summaryof the results obtained fromthese tests is given in Table II, and actual test data are plotted in Fig. 12.Sampledecay curves are given for tests performed at zero speed in Fig. 13 andat i000 rpm in Figs. 14 and 15.
Bench testing of the plate consisted of exciting the plate in air and inpartial vacuumin each of its first three modeswith a base excitation, notingthe peak response of the plate and then obtaining a decay curve after an abruptcut-off of the excitation. The input levels needed to obtain adequate strainlevels in the first modewere very low (< .02g) and required a signal amplifierin the input circuit. Evenwith this technique, the range for which values couldbe obtained was very limited. The secondmodewas difficult to tune because of apossible fixture interaction, but above a certain input level, consistent resultswere obtained. These results are summarizedin Table II. Owing to small asymmetryof the plate, the first torsion modewas also excited but in this case the responseto various inputs could not be realistically comparedwith analysis and so onlythe loss factor data are given. The values for loss factor in each of the modesfrom bench test are also plotted in Fig. 12 and provide a good comparison withvalues obtained from the centrifuge test.
3.3.3 Typical Fan Blade in Ambient and Thermal Environments
Using the analysis of Section 3.1, the loss factor for a component vibrating
in a given resonant mode may be computed from the maximum principal stress dis-
tribution. In order to verify the theory, a part span shrouded titanium fan blade
was subjected to vibration testing. The test objectives were to measure the ma-
terial damping in the blade for its first three resonant modes and also to assess
the effects of elevated temperature on the damping characteristics of the blade.
21
3.3.3. i Test A_so___ach_
The analysis of Section 3.1 requires the determination of the principalstresses throughout the component. However, if the responses are modal, thenthe stress at a reference point on the blade can be used to scale the modalstress distribution. Therefore the test method chosenwas to harmonically ex-cite the fan blade which was welded at its root to a massive block and measurethe strain response for various levels of forcing using miniature foil straingages mounted at high axial stress locations near the root and the A.S.M.T.position. The loss factors for the first flap modewere estimated from freq-uency sweepresponse plots using the half power method. For the two higher modesthe loss factors were estimated from strain transient curves resulting from abruptcut-off of the harmonic excitation (i.e., in an essentially single moderesponse).The basic damping data were obtained with the blade vibrating in evacuated con-ditions. However, for the tests in a thermal environment, evacuated conditionswere considered unnecessary since the measurementsof any changes in dampingcharacteristics due to temperature would provide the desired information. Thetests were therefore performed in air with temperatures on the blade of the orderof 150°C.
The test specimen was an advanced part span shrouded titanium (Ti) fan bladewith dovetailed root configuration. The sameblade was used throughout the programto obtain measurementsof damping at root as well as at shroud interfaces.
For this test series, the blade was welded into a massive titanium block atits root by machining the dovetail off and replacing it with weldment (see Figs.16 and 17). The root was oriented in the block such that the applied excitationvector was normal to the tip chord. The system was mounted in the fixture/vacuumchambervibration set up described in Appendix B.
The test arrangement for the thermal testing is shownin Fig. 18. It wasbasically the sameas that used for the "cold" blade except that the airtightalumimumlid was replaced by a fiberglass cover and two 1 kWblowdrier heaterelements were installed to provide radiation heating. The heaters were freelysuspended from a separate bracket arrangement such that they were approximately215 cm from the blade profile. Three thermocouples were used, one inside thedovetail of the blade, one near the shroud, and one close to the tip. A VARIACvoltage controller was used in all the tests and a prolonged soak (three hours)assured a stabilizing of the temperature profile from root to tip. The two TCson the blade touched the blade surface before the tests started so that the temp-eratures recorded were actual metal temperatures, but were movedaway during vi-bration.
3.3.3.2 Instrumentation
The blade was instrumented with two high temperature strain gages (BLH
22
Electronics, Type FSM12-135-_6). The lead wires were orignially attached usingM BONDGI00 high temperature cementwhich proved to be too brittle and was re-placed with RTV106. The choice of gage location was directed by the need forhigh axial strains in all three modesand a NASTRANdynamic analysis was used todetermine the optimum locations. These locations, as shownin Fig. 16 and 17,were near the root at the leading edge and above the shroud near the maximumthickness position.
The instrumentation system used in the tests was the basic system describedin Appendix B. An amplifier was required in the input circuit to enable the low(< 0.1g) acceleration levels to be applied. The input control accelerometer wasmountedoutside the fixture at the root location (see Fig. 18). For the tests,all output voltage RMSreadings were taken from the digital voltmeter and theselevels were noted on the data charts.
3.3.3.3 Testing and Results
Testing at ambient temperature consisted of exciting the blade at each of itsfirst three natural modesof vibration under evacuated conditions downto i0 torrand recording the strain response. Decay tests in the first mode (first flap)were not feasible owing to difficulties experienced in achieving a total arrestof input motion upon abrupt cut-off of the excitation. This difficulty was causedby the inertial forces of the vibrating blade being sufficiently large to inducevibratory motion in the shaker armature after the input was cut-off. Thus a mod-ified procedure using a frequency sweepover the resonance and determination ofthe bandwidth at the "half power point" at various degrees of pressurization andevacuation was utilized. The pressure was gradually reduced until the dampinglimit imposedby the available minimumsweeprate (0.0136 octave/minute) was rea-ched. This dampingvalue was calculated to be _ = 0.0022. The loss factor formaterial damping, being muchsmaller, was obtained by extrapolation of the datapoints to zero pressure. The values obtained for the first modeloss factor andfrequency are shownplotted against the pressure ratio in Figs. 19 and 20 respec-tively. The loss factor value obtained by extrapolation can be seen to be between0.003 and 0.00085 for a range of "root" stresses of 56 to ii0 MPa. These results,together with the data for the two higher modesare tabulated in Table III. Itshould be noted that the loss factors for modes 2 and 3 were obtained from theaverage slope between points 1 and 4 dB down from the maximumvalue on the decaycurves. Figure 21 shows a comparison of the test results (loss factor) with thetheoretical values for the first three modes.
In the thermal environment, the loss factors in the first modewere highenough, because of air damping, to be derived directly from the slow frequencysweepresponse data. Results for the first modeare shownin Fig. 22. Twoinput levels, namely 0.075 g and 0.15 g, were applied and loss factore weredetermined using the "half power method." As can be seen, the temperatures
23
dropped during the test as a result of air being pumpedaround inside thechamberby the blades and being cooled by the surfaces of the chamber. "Hot"and "cold" peak decay curves for the second and third modesare shownsuperim-posed for comparison in Fig. 23 and 24.
3.3.4 Composite Material Damping
In addition to the several mechanisms of damping discussed so far, two
additional mechanisms, viz. (i) composite materials and (2) coatings typically
used in turbine blading, were examined to determine the potential, if any, of
damping available. The effort related to composite materials is discussed below.
Potentials of damping in composite material were evaluated by tests conducted
on two materials: Boron/Aluminum (50% by volume of Boron filaments in a 6061
Aluminum matrix); and Boron/Aluminum/Titanium (0.076 mm thick titanium cladding
on two sides amounting to approximately 6% by volume titanium). The specimens
were flat strips (see Fig. 25) of nominal size of 20.32 x 2.54 x 0.25 cm. Two
of each specimens were tested as cantilever beams (see Fig. 26) and data were
obtained in their first two modes. All tests were conducted in a vacuum chamber,
exciting the beams at their resonances and recording the decay of vibrations
upon abrupt cutoff of input excitation. The strain signals from a gage mounted
0.64 cm from the root were filtered before being recorded on a level recorder.
Before the final sets of data were recorded to obtain an estimate of
damping, it was found necessary to conduct tests to (i) determine the clamping
torque above which the fixture participation could be considered to be minimum
and (2) establish the level of maximum strain below which the material behavior
is linear. Based on this series of tests, a clamping torque of 60 Nm was found
to be adequate and about 500 micro strain at the root of the cantilevered spec-
imen was found to be the desired limit. During these initial tests the material
characteristics of the specimens appeared to undergo continuous change and this
necessitated subjecting one B/A1 test piece and one B/AI/T test piece to pro-
longed testing over a wide range of input levels. In doing so, it was suspected
that these two beams were overstressed and thus were not used to obtain the final
results. The results presented in Fig. 27 were obtained for bending strains
within the linear range.
Using the carefully measured values of resonant frequencies and from a knowl-
edge of the beam characteristic numbers, the modulus of elasticity for B/A1 and
B/AI/Ti specimens were calculated to be 199 GPa and 166 GPa, respectively.
Figures 27a and 27b show the measured loss factors as a function of maximum root
strain. Factors obtained from characteristic beam functions (Ref. 48) were used
to estimate the root strain from the measured strain. For both the specimens,
the loss factor in mode 2 was found to be smaller than that in mode i. The
variation of damping with strain level is small indicating that the value of
n is the relationship D = Jo n is close to 2. Even with limited maximum strain
24
levels, repeatability, particularly in the first mode, was found to be difficultas is evident from a comparison of results for mode1 obtained before and aftermeasuring mode2.
3.3.5 Tests on Turbine Blades With Thermal Barrier Coatings
The objective of this series of tests was to evaluate the damping potential,
if any, of some typical coatings currently in use on turbine blades. In general,
these coatings are used for thermal protection and to inhibit corrosion. The
coatings are applied to the blade airfoil and upper surface of the platform.
3.3.5. i T_e>t A__j_r0ac_h
The approach was to measure the loss factors of blades (before and after
applying a coating) using response decay techniques. Two turbine blades, sim-
ilar to that used for the platform damping tests (Section 6) were prepared and
tested. The following treatments were used in preparing the blades for these
tests.
Treatment # i - Two blades
Strip (20% HN03) and vapor blast
Treatment # 2 - Blade #i
Diffusion Aluminide coat (pack cementation process) to a thickness of
76 microns.
Diffusion heat treat at I079°C/4 hrs/Argon
Treatment # 3 - Blade #2
Sputter coat with NiCoCrAIY to a thickness of 126 microns.
Diffusion heat at I079°C/4 hrs/Argon
Treatment # 4 - Both Blades
Overcoat (plasma spray) with Y203-Zr02 to a thickness of 250 microns
using a 76 microns thick bond coat of NiCr/AI composite.
Before each test, the blades were instrumented with a strain gage (MM Type
EA-06-062AK-120) at the root of the shank._
Each blade was tested in the same fixture as was used in the platform damping
tests (see Fig. 4), but in these tests, additional care was taken to make the
fixture participation an absolute minimum and torquing procedures were standardized.
Even with this additional effort, the fixture participation and root effects were
25
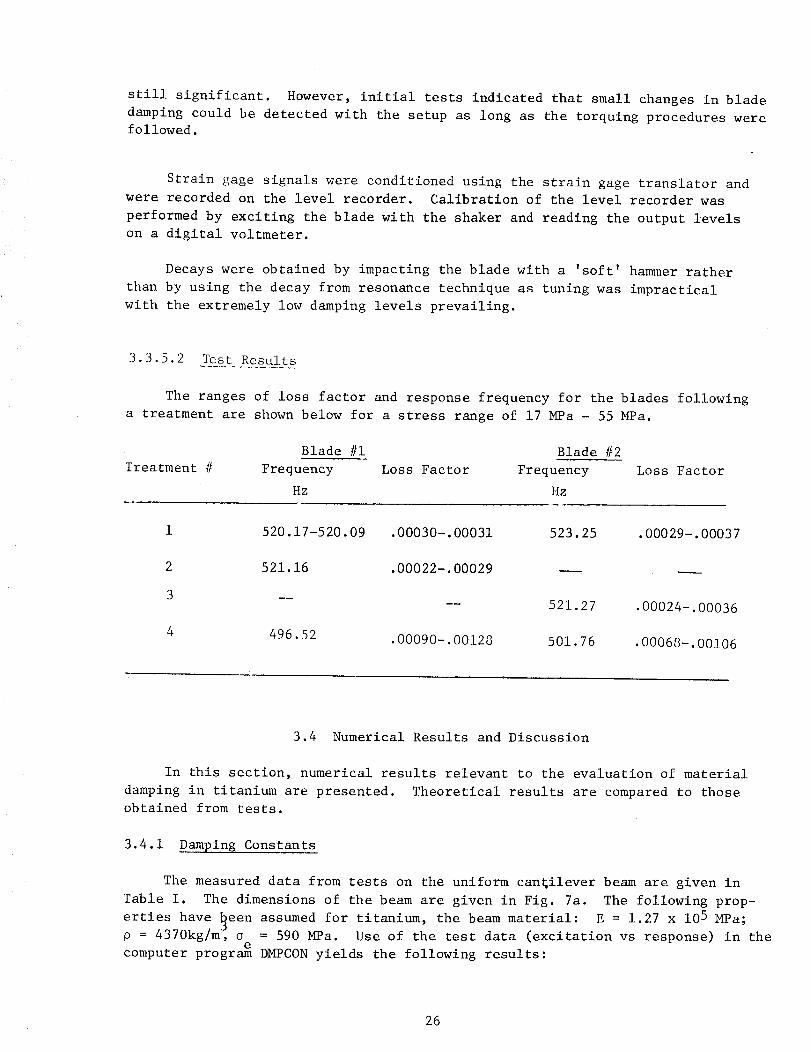
still significant. However, initial tests indicated that small changes in bladedamping could be detected with the setup as long as the torquing procedures werefollowed.
Strain gage signals were conditioned using the strain gage translator andwere recorded on the level recorder. Calibration of the level recorder wasperformed by exciting the blade with the shaker and reading the output levelson a digital voltmeter.
Decays were obtained by impacting the blade with a 'soft' hammerratherthan by using the decay from resonance technique as tuning was impracticalwith the extremely low damping levels prevailing.
The ranges of loss factor and response frequency for the blades followinga treatment are shownbelow for a stress range of 17 MPa- 55 MPa.
Blade #i Blade #2
Treatment # Frequency Loss Factor Frequency Loss Factor
Hz Hz
1 520.17-520.09 .00030-.00031 523.25 .00029-.00037
2 521.16 .00022-.00029 --
3 __-- 521.27 .00024-.00036
4 496.52 .00090-.00128 501.76 .00068-.00106
3.4 Numerical Results and Discussion
In this section, numerical results relevant to the evaluation of material
damping in titanium are presented. Theoretical results are compared to those
obtained from tests.
3.4.1 Damping Constants
The measured data from tests on the uniform cantilever beam are given in
Table I. The dimensions of the beam are given in Fig. 7a. The following prop-
erties have keen assumed for titanium, the beam material: E = 1.27 x 10⁵ MPa;
p = 4370kg/m_ o = 590 MPa. Use of the test data (excitation vs response) in thee
computer program DMPCON yields the following results:
26
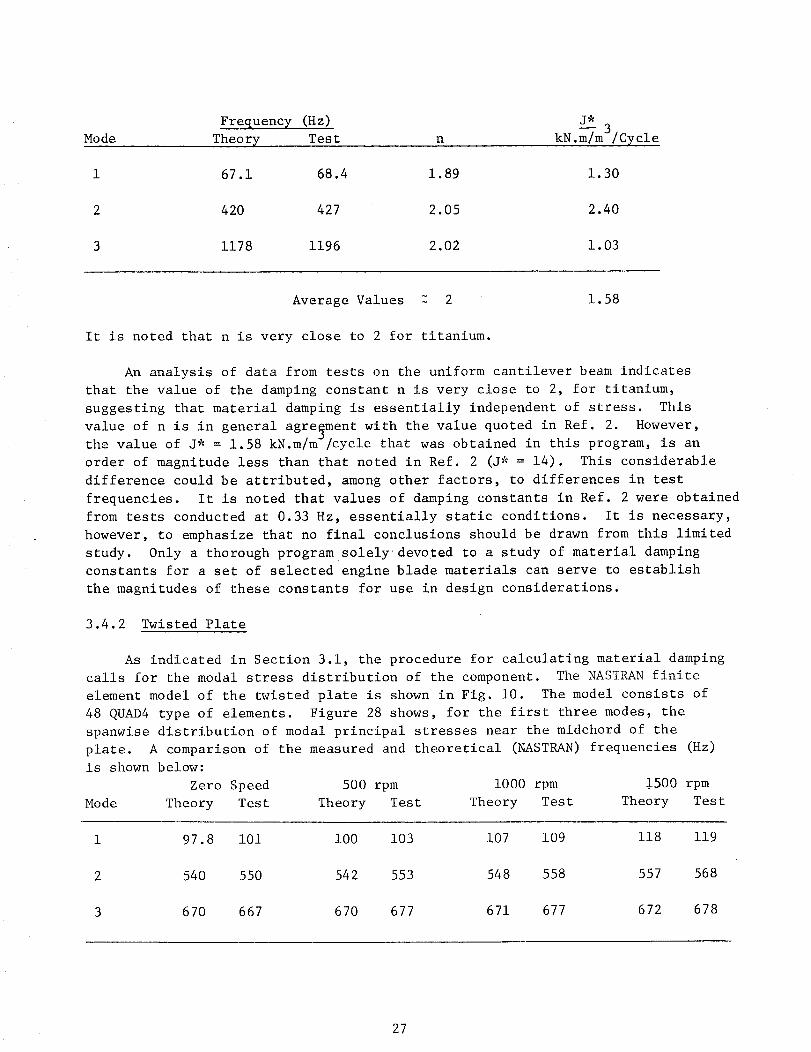
Frequency (Hz) J* 3
Mode Theory Test n kN.m/m /Cycle
1 67.1 68.4 1.89 1.30
2 420 427 2.05 2.40
3 1178 1196 2.02 1.03
Average Values 2 2 1.58
It is noted that n is very close to 2 for titanium.
An analysis of data from tests on the uniform cantilever beam indicates
that the value of the damping constant n is very close to 2, for titanium,
suggesting that material damping is essentially independent of stress. This
value of n is in general agreement with the value quoted in Ref. 2. However,the value of J* = 1.58 kN.m/m /cycle that was obtained in this program, is an
order of magnitude less than that noted in Ref. 2 (J* = 14). This considerable
difference could be attributed, among other factors, to differences in test
frequencies. It is noted that values of damping constants in Ref. 2 were obtained
from tests conducted at 0.33 Hz, essentially static conditions. It is necessary,
however, to emphasize that no final conclusions should be drawn from this limited
study. Only a thorough program solely devoted to a study of material damping
constants for a set of selected engine blade materials can serve to establish
the magnitudes of these constants for use in design considerations.
3.4.2 Twisted Plate
As indicated in Section 3.1, the procedure for calculating material damping
calls for the modal stress distribution of the component. The NASTRAN finite
element model of the twisted plate is shown in Fig. i0. The model consists of
48 QUAD4 type of elements. Figure 28 shows, for the first three modes, the
spanwise distribution of modal principal stresses near the midchord of the
plate. A comparison of the measured and theoretical (NASTRAN) frequencies (Hz)
is shown below:
Zero Speed 500 rpm i000 rpm $500 rpm
Mode Theory Test Theory Test Theory Test Theory Test
1 97.8 i01 i00 103 107 109 118 119
2 540 550 542 553 548 558 557 568
3 670 667 670 677 671 677 672 678
27
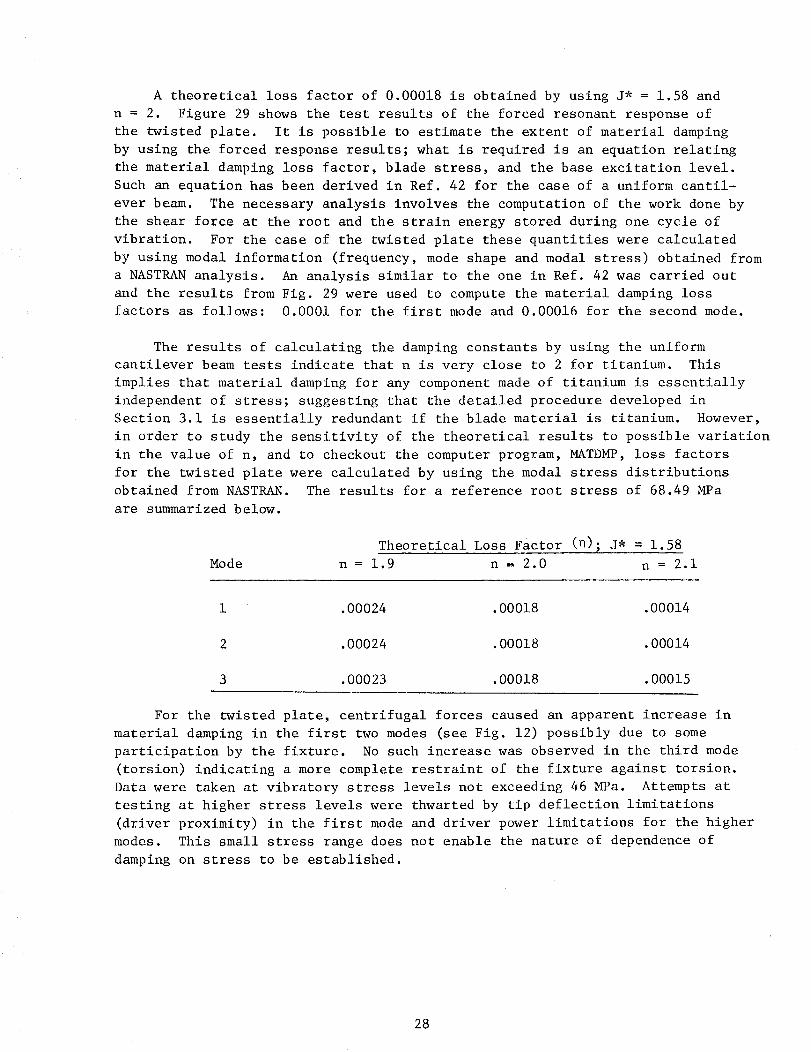
A theoretical loss factor of 0.00018 is obtained by using J* = 1.58 andn = 2. Figure 29 shows the test results of the forced resonant response ofthe twisted plate. It is possible to estimate the extent of material dampingby using the forced response results; what is required is an equation relatingthe material damping loss factor, blade stress, and the base excitation level.Such an equation has been derived in Ref. 42 for the case of a uniform cantil-ever beam. The necessary analysis involves the computation of the work done bythe shear force at the root and the strain energy stored during one cycle ofvibration. For the case of the twisted plate these quantities were calculatedby using modal information (frequency, modeshape and modal stress) obtained froma NASTRANanalysis. An analysis similar to the one in Ref. 42 was carried outand the results from Fig. 29 were used to compute the material damping lossfactors as follows: 0.0001 for the first modeand 0.00016 for the second mode.
The results of calculating the damping constants by using the uniformcantilever beamtests indicate that n is very close to 2 for titanium. Thisimplies that material damping for any componentmadeof titanium is essentiallyindependent of stress; suggesting that the detailed procedure developed inSection 3.1 is essentially redundant if the blade material is titanium. However,in order to study the sensitivity of the theoretical results to possible variationin the value of n, and to checkout the computer program, MATDMP,loss factorsfor the twisted plate were calculated by using the modal stress distributionsobtained from NASTRAN.The results for a reference root stress of 68.49 MPaare summarizedbelow.
Theoretical Loss Factor (n); j, = 1.58
Mode n = 1.9 n = 2.0 n = 2.1
1 .00024 .00018 .00014
2 .00024 .00018 .00014
3 .00023 .00018 .00015
For the twisted plate, centrifugal forces caused an apparent increase in
material damping in the first two modes (see Fig. 12) possibly due to some
participation by the fixture. No such increase was observed in the third mode
(torsion) indicating a more complete restraint of the fixture against torsion.
Data were taken at vibratory stress levels not exceeding 46 MPa. Attempts at
testing at higher stress levels were thwarted by tip deflection limitations
(driver proximity) in the first mode and driver power limitations for the higher
modes. This small stress range does not enable the nature of dependence of
damping on stress to be established.
28
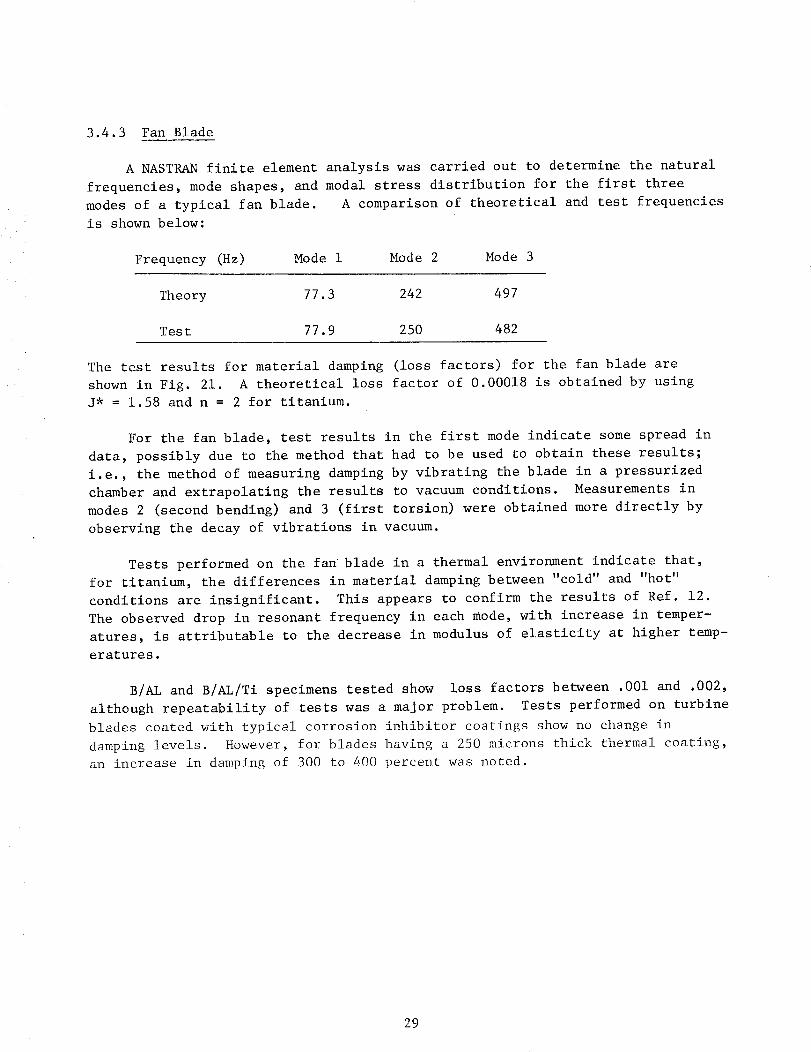
3.4.3 Fan Blade
A NASTRAN finite element analysis was carried out to determine the natural
frequencies, mode shapes, and modal stress distribution for the first three
modes of a typical fan blade. A comparison of theoretical and test frequencies
is shown below:
Frequency (Hz) Mode 1 Mode 2 Mode 3
Theory 77.3 242 497
Test 77.9 250 482
The test results for material damping (loss factors) for the fan blade are
shown in Fig. 21. A theoretical loss factor of 0.00018 is obtained by using
J* = 1.58 and n = 2 for titanium.
For the fan blade, test results in the first mode indicate some spread in
data, possibly due to the method that had to be used to obtain these results;
i.e., the method of measuring damping by vibrating the blade in a pressurized
chamber and extrapolating the results to vacuum conditions. Measurements in
modes 2 (second bending) and 3 (first torsion) were obtained more directly by
observing the decay of vibrations in vacuum.
Tests performed on the fan blade in a thermal environment indicate that,
for titanium, the differences in material damping between "cold" and "hot"
conditions are insignificant. This appears to confirm the results of Ref. 12.
The observed drop in resonant frequency in each mode, with increase in temper-
atures, is attributable to the decrease in modulus of elasticity at higher temp-
eratures.
B/AL and B/AL/Ti specimens tested show loss factors between .001 and .002,
although repeatability of tests was a major problem. Tests performed on turbine
blades coated with typical corrosion inhibitor coatings show no change in
damping levels. However, for blades having a 250 microns thick thermal coating,
an increase in damping of 300 to 400 percent was noted.
29
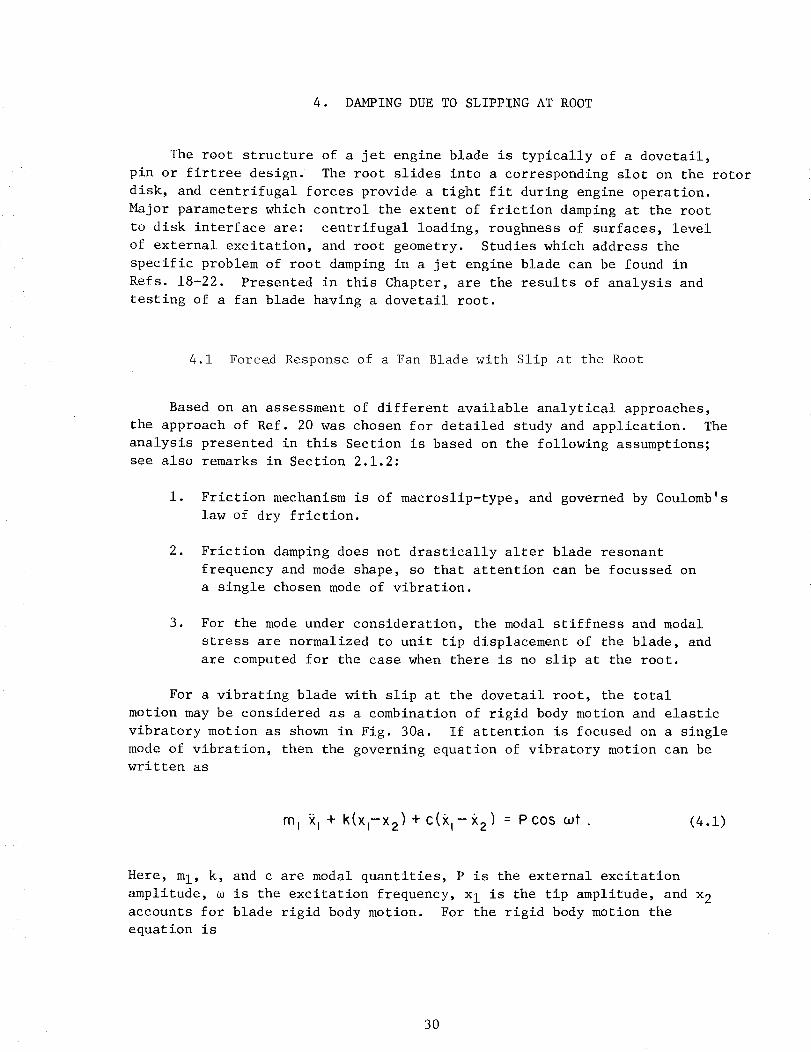
4. DAMPINGDUETOSLIPPINGAT ROOT
The root structure of a jet engine blade is typically of a dovetail,pin or firtree design. The root slides into a corresponding slot on the rotordisk, and centrifugal forces provide a tight fit during engine operation.Major parameters which control the extent of friction damping at the rootto disk interface are: centrifugal loading, roughness of surfaces, levelof external excitation, and root geometry. Studies which address thespecific problem of root damping in a jet engine blade can be found inRefs. 18-22. Presented in this Chapter, are the results of analysis andtesting of a fan blade having a dovetail root.
4.1 Forced Responseof a Fan Blade with Slip at the Root
Based on an assessment of different available analytical approaches,the approach of Ref. 20 was chosen for detailed study and application. Theanalysis presented in this Section is based on the following assumptions;see also remarks in Section 2.1.2:
i. Friction mechanismis of macroslip-type, and governed by Coulomb'slaw of dry friction.
. Friction damping does not drastically alter blade resonant
frequency and mode shape, so that attention can be focussed on
a single chosen mode of vibration.
. For the mode under consideration, the modal stiffness and modal
stress are normalized to unit tip displacement of the blade, and
are computed for the case when there is no slip at the root.
For a vibrating blade with slip at the dovetail root, the total
motion may be considered as a combination of rigid body motion and elastic
vibratory motion as shown in Fig. 30a. If attention is focused on a single
mode of vibration, then the governing equation of vibratory motion can be
written as
mi Y'I + k(xi-x2) + c(_'l- t'2) = P cos _ot . (4.1)
Here, ml, k, and c are modal quantities, P is the external excitation
amplitude, _ is the excitation frequency, x I is the tip amplitude, and x 2
accounts for blade rigid body motion. For the rigid body motion the
equation is
30
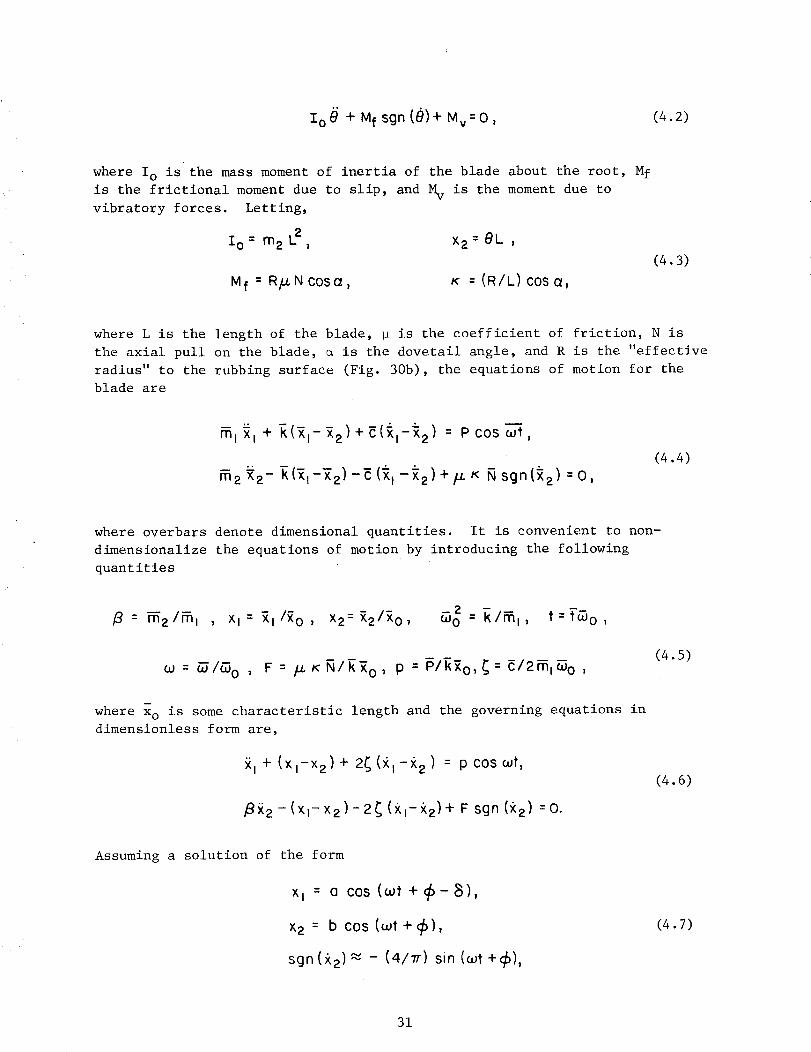
Ioe + Mf sgn C8)+ Mv=O , (4.2)
where Io is the mass moment of inertia of the blade about the root, Mf
is the frictional moment due to slip, and Mv is the moment due to
vibratory forces. Letting,
I0 = m 2 L2 , X2 = eL ,
Mf = R/J- N COS (Z , K = (R/L) C0S a,
(4.3)
where L is the length of the blade, D is the coefficient of friction, N is
the axial pull on the blade, _ is the dovetail angle, and R is the "effective
radius" to the rubbing surface (Fig. 30b), the equations of motion for the
blade are
m I x I + E(-_I-_2)+_(Xl-X 2) : PCOS_--'t,
m2 _2- -k(x,-'x2)-_ (x,-x 2) +_ K _ sgn(_2) = 0,
(4.4)
where overbars denote dimensional quantities. It is convenient to non-
dimensionalize the equations of motion by introducing the following
quantities
= _21_I , Xl= Ril_o, x2=Y,21Y,o, -e t = }'(_o ,(_o = k/ml,
= _/_0 ' F = _KN/R_ O , p = P/k_o,_= c/2ml_o ,
where Xo is some characteristic length and the governing equations in
dimensionless form are,
Xl+ (×l-X2) + 2_ (xl-x2) = P cos _t,
i_x 2 - (XI-X 2 ) - 2_ (XI-)(2) + F sgn (x2) =0.
(4.5)
(4.6)
Assuming a solution of the form
×,= a cos(_t+_-(_),
x2 = b cos (uJt+_),
sgn (9,2)_ - (4/-rr)sin (o_t+_),
(4.7)
31
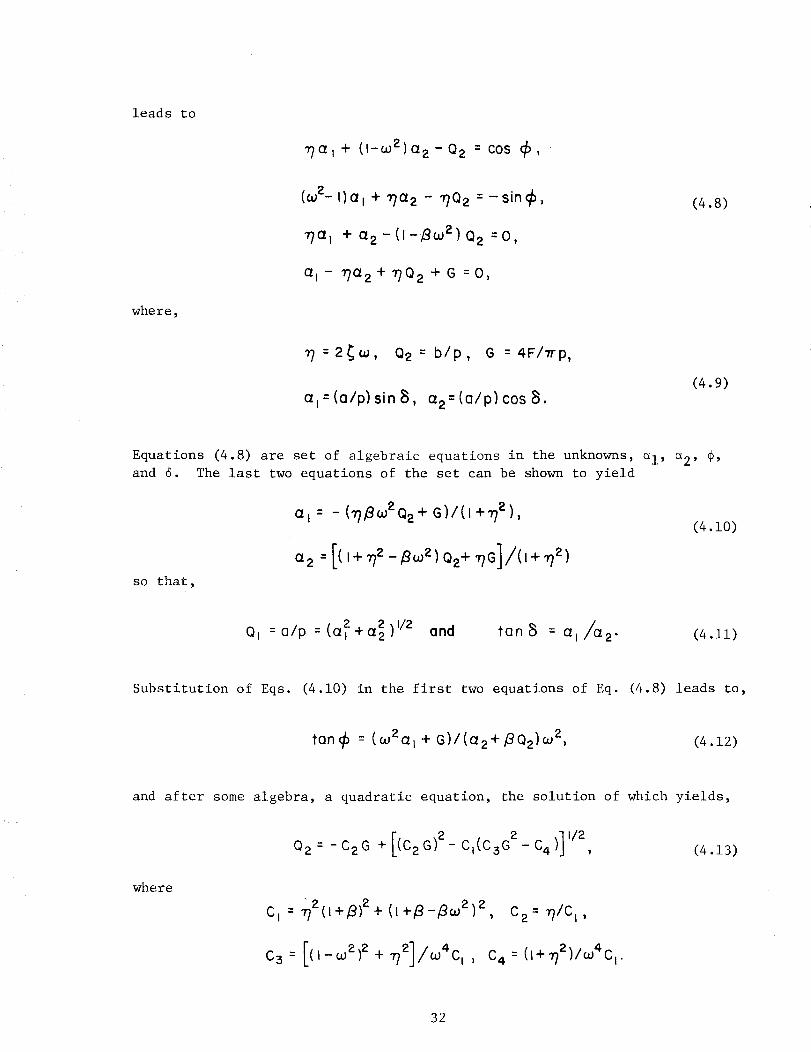
leads to
z/cz_ + (I-w2)e2-Q2 = cos _,
where,
(c_L l)ctl+ 'r/a2- _'/Q2= -sin(_,
_a_ +a2-(I-l_2)Q2 =0,
c_I - _Tct 2 + "r/Q 2 + G = O,
(4.8)
"9 =2_uJ, Q2 = b/p, G = 4F/'n'p,
a l=(e/p) sinB, ce2=(o/p) cosS.
(4.9)
Equations (4.8) are set of algebraic equations in the unknowns,
and 6. The last two equations of the set can be shown to yield
a I= - ('r//_2Q2 + G)I(I +'r/2),
so that,
_i' _2' @'
(4.i0)
Q, =a/p =((:z_+cz_)'/z and tan_; = C_,/CZ 2. (4.11)
Substitution of Eqs. (4.10) in the first two equations of Eq. (4.8) leads to,
tan(:# : (0_2_, + G)/(Ct2+,SQ2)_ 2, (4.12)
and after some algebra, a quadratic equation, the solution of which yields,
where
o2 -C_G+[(c2Gf C,(C_G_ C_)]'/2,= - - (4.13)
c, : _/z(l+/_)z+ (I+B-BoJ2) 2, cz: _//c,,
c,: [l,-_') ' +_']/_"c,. c,: (,+n_)/_'c,.
32
It is noted that QI is a measure of the blade response and Q2 a measure
of the slip amplitude at the root. From Eq. (4.12), the condition for slip
to occur (i.e., Q2 > 0) is
(C3G 2- C4) <0 ; (4.14)
When there is no slip at the root, the solution is given by
Q2 = O,
Qi = [(1_c02)2+ 1,72]'/2
(4.15)
The analysis and solution developed above is applicable to the case
of direct excitation of the blade. If the excitation is applied at the
base of the blade, as was done for tests performed in this program, the
analysis follows along similar lines to the one given above. The
necessary modifications to the analysis and solution are as follows:
p = _/_ o, C4= I, (4.16)
Ct.2=[77(I+/_)G/CI]+Q2,.
(4 .i7)
where p is the displacement amplitude of the base excitation.
The influence of friction at the root can be expressed as a loss
factor, defined as
I D (4.18)"r/f - 2-rr U
where D is the energy dissipated per cycle of vibration and U is the peak
strain energy in the blade. The two energies are given by
D = 4FK Nx2 ,I 2
u = _-Ry,
(4.19)
33
so that, in terms of dimensionless quantities
2"qf : GQ2/QI, (4.20)
and total loss factor for the blade is,
_b: _90 +'Of, (4.21)
where qo accounts for damping from sources other than friction, such as,
material hysteresis and air damping.
The major interest is in obtaining the maximum blade response at
resonance. One approach is to calculate the response for different values
of the nondimensional frequency, m and pick out the maximum amplitude.
However, for the damping levels expected in the problem being studied,
maximum response occurs when the excitation frequency is near the natural
frequency (i.e., _ _ i) so that a good approximation to the maximum response
is obtained by simply getting _ = i in the solution.
The blade tip deflection can be related to the blade stress by
specifying a baseline or reference condition where the blade vibration
characteristics are fully known. If the baseline tip deflection of the
blade is chosen as the characteristic length Xo used for nondimensionaliza-
tion in Eq. (4.5), then it can be shown that
Or = QOrO, (4.22)
where q° is the blade stress in the baseline condition and o is the blade
stress at any other condition. In the present study, the condition of no
slip at the root is chosen as the baseline condition so that the baseline
balde stress is the same as the modal blade stress.
A computer program, ROTDMP was written to compute blade loss factor
and blade stress (near the root) as a function of blade axial load. The
program calculates the resonant response by using Eqs. (4.10) through (4.13),
the loss factor by Eqs. (4.18) through (4.21), and the blade stress by
Eq. (4.22). The input to the program includes: frequency in Hz; blade
axial load, N; coefficient of friction p; dovetail correction factor K;
mass ratio 6; modal stiffness k; baseline (modal) stress oo and non-friction
damping loss factor qo"
34
4.2 Experimental Investigation of Dampingat Blade Root
The objectives of this series of tests were to estimate the potentialsof damping available in a root structure of dovetail design and to comparethe results with the trends established by analysis.
4.2.1 Experimental Approach
Section 4.1 describes the analysis of the forced response of a single
fan blade with slipping in a dovetail configured root. Since the major
effect of the centrifugal loading of a typical blade is to increase the
reactive forces on the mating surfaces of the dovetail, the approach taken
in this investigation was to test a single dovetailed blade and simulate,
as closely as possible, the root loading by means of a special fixture.
Sinusoidal excitation was applied at the blade root and the blade response
was monitored via strain gages mounted at high stress points. Since the
major interest was in obtaining the maximum blade response at resonance,
the tests were run at steady state at a resonant frequency and transient
decays were obtained by abruptly cutting off the excitation. The level of
damping was estimated from the slope of the resulting decay curve.
The test piece used was another specimen of the titanium fan blade used
in the material damping tests. The blade was mounted in the fixture,
described in the next section, using two titanium alloy (8-1-1) clamps with
mating surfaces having geometry and dimensions exactly the same as those
of the blade root slot in an actual disc. Blade strain response was measured
by two strain gages, one mounted near the leading edge at the root and the
other at the above-shroud-maximum-thickness position. These were the same
locations used in the material and shroud damping investigations.
The basic fixture, slip plate and shaker arrangement, as described
in APPENDIX B, was used. A new steel root block was designed to provide
a dovetail slot for the blade root and a means of applying an axial load
to the blade root. The arrangement is shown in Fig. 31.
The rubbing surfaces were provided by two titanium clamping blocks
bolted to the steel fixture block. The width dimension of the dovetail
cutout is maintained by a loading block separating the two clamping blocks.
The loading block is a sliding fit between them. Strain gaged loading screws
acting on the block provided a measure of the load along the axis of the
blade. The load is transferred to the blade root via a small diameter
roller bearing located on the centerline of the loading block. The assembly
was then bolted into the vacuum chamber (see Fig. 32), which in turn was
mounted on the slip plate driven by the electrodynamic shaker.
35
The load bolts were designed to provide adequate axial stiffness atthe root, yet be sensitive enough to be able to apply accurate loads asmonitored by meansof strain gage output. The steel bolt "working" sectionwas 2.54 cm long and 0.32 cm in diameter. Twostrain-gages were used oneach bolt and arranged to minimize bending effects. As a result ofcalibration tests, .695 microstrain per Newtonwas determined.
4.2.2 Instrumentation
The same type of strain gages as previously used in the material
damping tests were used on this blade. The instrumentation system used
was the same as that discussed in APPENDIX B except that the X-Y recorder
was not required. All strain gage responses were recorded as unfiltered
and filtered signals. The Krohnhite filter was set at i00 Hz in the low
pass mode to obtain the filtered results.
The two strain gaged loading bolts were connected through a 3 pole
switch to a portable balance bridge and strain indicator unit as shown
in Fig. 33.
4.2.3 Test Results
All tests were performed with the pressure in the chamber reduced to
15 torr.
After several preliminary tests and developing the technique of
adjusting the load bolts, the first mode responses were obtained with root
loading varied from 576 to 2879 Newtons and with excitation levels of
0.2, 0.5 and 1.0 g applied. The results of the final test series are
tabulated in Table IV. Typical decay curves are shown in Fig. 34 for the
minimum root load applied and in Fig. 35 for the maximum root load. The
loss factors were calculated from the average slope between points 1 and
4 dB down from maximum on the decay curves. Figures 36, 37 and 38 show
how the loss factor, root stress and response frequency vary with axial load
at root and input excitation level.
4.3 Discussion of Results
In this section, a comparison of the numerical results from analysis
and testing of a fan blade with a dovetail root is presented. Values of
the parameters used in computation are as follows:
36
Blade Length, L ................... 0.28 m (ii in)Massmomentof inertia about root, I o ........ (0.066 slugs-in2/12)Dovetail angle, _ .................. 45 deg.Dovetail effective radius, R ............ 8.26 mm(0.325 in)Dovetail correction factor, K ........... 0.0209Coefficient of friction, H ............. 0.3, 0.35Non-friction damping loss factor, qo ........ 0.0005Frequency, (Test) .................. 74 HzModal mass, mI ................... (2.734E-3 slugs/12)Modal stiffness, k ................. 11.21 kN/m (64 ib/in)Modal stress near root, oo ............. 298 _a (4.35E+4 psi)Mass ratio, 8 .................. 2
The modal information is for the first mode, and normalized to unit tipdeflection of the blade.
The theoretical and test results of blade loss factor as a functionof blade axial load are shownin Fig. 36 from which the following observationscan be made.
(i) Loss factors decrease rapidly with increase in axial load.(2) For low axial loads, higher levels of excitation lead to higher
levels of friction damping. With increased axial loads, thisdependence on excitation is reduced.
(3) Loss factors begin to level off at moderate axial loads, asymptoti-cally approaching the non-friction damping loss factors; i.e.,the blade tends to reach the condition of essentially no slip atthe root.
(4) At high axial loads, relative macroslip at the root interface isunlikely to be present and friction damping, if any, maybegoverned by microslip or local slip.
Figure 37 shows the theoretical and test results of blade stressnear the root as a function of blade axial load. It is seen from the figurethat, for a given axial load, the theoretical blade response (hence bladestress) is independent of the excitation level. This is in agreementwiththe results published in Ref. 20. However, test results from the presentprogram indicate that, for a given axial load, blade stress is dependenton the excitation level. This discrepancy between theoretical and testresults is possibly due to the idealized nature of the analytical model.As the analytical model considers only macroslip motion, an increase inexcitation level leads to an increase in slip amplitude at the interface.The resulting increase in friction damping tends to maintain a constant bladestress. The dependenceof stress on excitation level, as indicated by testresults, implies that during tests the slip motion at the interface mayhave been predominantly of the microslip type.
37
5. DAMPINGDUETORUBBINGAT SHROUDINTERFACES
In the case of part-span shrouded blades, untwisting of the blades undercentrifugal pull brings neighboring blades into contact at the shrouds. Deter-mination of the precise nature of conditions at such an interface continuesto be an unresolved problem defying both analysis and measurement. Majorparameters which control the nature and extent of friction damping at theshroud to shroud interface are: centrifugal loading, roughness of surfaces,level of external excitation, shroud location on the blade, blade geometry,and shroud geometry. Studies which address the specific problem of shrouddamping can be found in Refs. 25-29. Presented in this chapter are the re-sults of analysis and testing of a part-span shrouded fan blade with rubbingat its shroud face_.
5.1 Forced Responseof a Fan BladeWith Rubbing at the Shrouds
Uncertainties in the precise nature of vibratory kinematics and kineticsat the shroud faces during rubbing, demandedthat different analyticalapproaches be explored to determine their suitability. The microslip approachwas abandonedin favor of the macroslip approach, after a NASTRANfinite ele-ment analysis confirmed the need for an iterative-type solution to obtainaccurate quantitative results; see remarks in Section 2.1.2, and also Ref. 25.Apart from somequestions as to its utility in a practical application such aniterative-type solution was beyond the scope of the present program in termsof time and cost schedule. In the macroslip approach, initial efforts con-sisted of modeling the rather high inplane stiffness of the shroud as a springin series with the friction forces at the shroud faces. Sucha modelingprocedure leads to the following result: for a given excitation level, thereis a rapid decrease in blade stress with increase in shroud normal load. How-ever, test results indicated precisely the opposite trend, i.e., an increaseof blade stress with increase in shroud normal load, for a given excitation;thus revealing the inadequacy of the initial analytical model. The difficultyis one of proper modeling of the physics of a vibrating blade having rubbingat the shrouds. Details of the model that was finally adopted and the assoc-iated analysis are given below.
Schematics of a part span shrouded fan blade, and shroud rubbing surfacesare shownin Fig. 39a and Fig. 39b. The following assumptions are made; seealso remarks in Section 2.1.2,
i. Friction damping is of macroslip-type, and governed by Coulomb'slaw of dry friction.
38

. Friction damping does not drastically alter blade resonant frequency
and mode shape, so that attention can be focused on a single chosen
mode of vibration.
o For the mode under consideration, the modal stiffness and modal
stress are normalized to unit tip displacement of the blade, and
are computed for the case when there is no friction at the interface.
4. Shrouds are infinitely rigid and shroud load is uniformly distribu-
ted over the rubbing surfaces.
5. Slipping motion is resisted by the static stiffness of the blade
below the shrouds.
Under the assumptions made, the equations of motion can be written as
(see Fig. 40)
-"mxl + k (x_- _2) + _x, = P cos _]
/_ k 52 + 2/u.N sgn (x 2)-k(x,-x 2) =0,
(5.1)
where overbars denote dimensional quantities, m, k, and c are modal quantities,
xI is the blade tip deflection, x 2 denotes the slip at the shroud, P is the
excitation amplitude, _ is the excitation frequency, p is the coefficient of
friction, and N is the normal load. The quantity Bk is the static stiffness
of the blade below the shrouds and resists the slipping motion. Thus, the
parameter B accounts for changes in the stiffness of the system during slip-
ping motion. It is convenient to nondimensionalize the equations of motion
by introducing the following quantities:
xi = xi Ix. , x2= -x2 Ix. , _ = k/ml , _ = _/_o ,
_j = 5/2_o, F = 2FN/_o, p = P/kio,
t=T_o,
(5.2)
where xo is some characteristic length.
are
The equations in dimensionless form
Y'I + (xl-x2) + 2r=Y'I=P COSCut
/9x2+ F sgn(#, 2) -(xl-x 2) :0
(5.3)
39
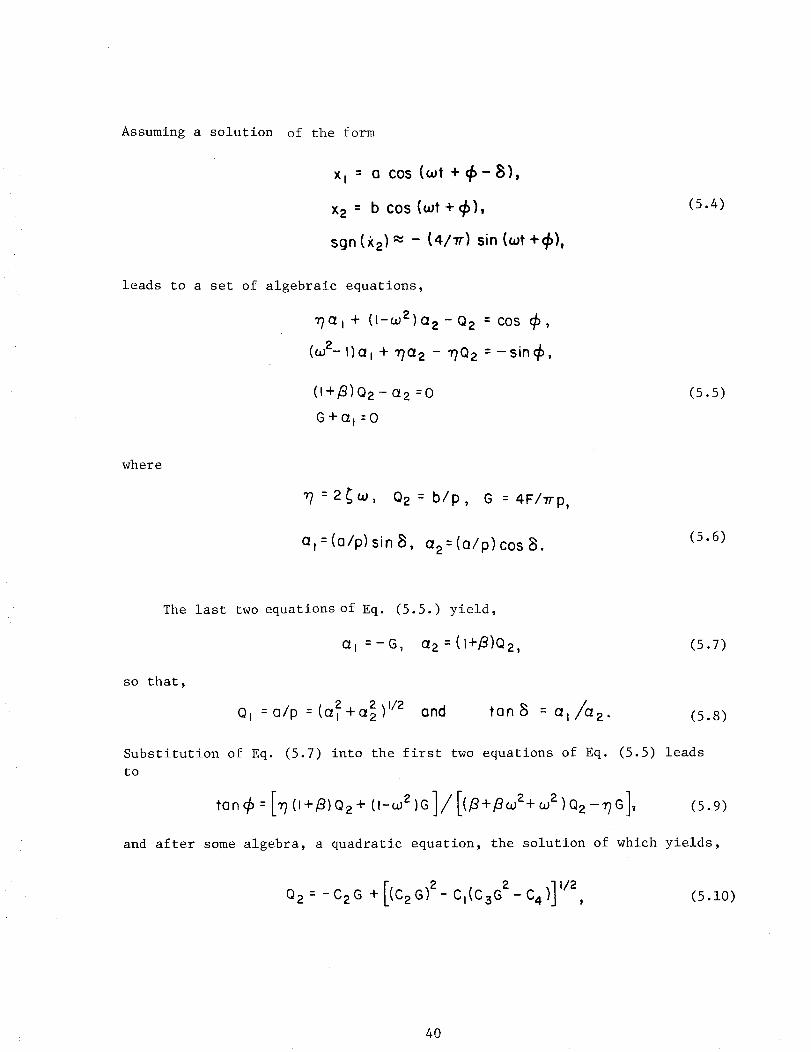
Assuming a solution of the form
x, : o cos (_t + @-B),
x 2 = b cos ((_t + (_),
sgn (Y,2} _ - (4/'rr} sin ((_t +_),
leads to a set of algebraic equations,
_a, + (I-_2)a2- Q2 = cos (_,
(°J2-I)Cll + '_Q2 - _Q2 :-sJn(_,
(I +/_) Q2 - (22 =0
G +(_ I =0
where
"g = 2_joJ, Q2 = b/p, G = 4F/'rrp,
e,:(o/p) sinS, e2:(a/p)cosB.
(5.4)
(5.5)
(5.6)
The last two equations of Eq. (5.5.) yield,
e I =-G, Q2 = (I+_)Q2,
so that,
O_ :alp :(a z+a 2 _/22 ) and tan _ = a I/a 2.
two equations of Eq.
(5.7)
(5.8)
leadsSubstitution of Eq. (5.7) into the first (5.5)
to
tan_):['9(,+/_)Q2+ (,-w2)G]/[(B+B_z+oJ2)Q2-_TG ], (5.9)
and after some algebra, a quadratic equation, the solution of which yields,
O 2 C2G +[(C2G) 2 CI(C3G 2 C4)] l/2= - - - , (5.10)
40
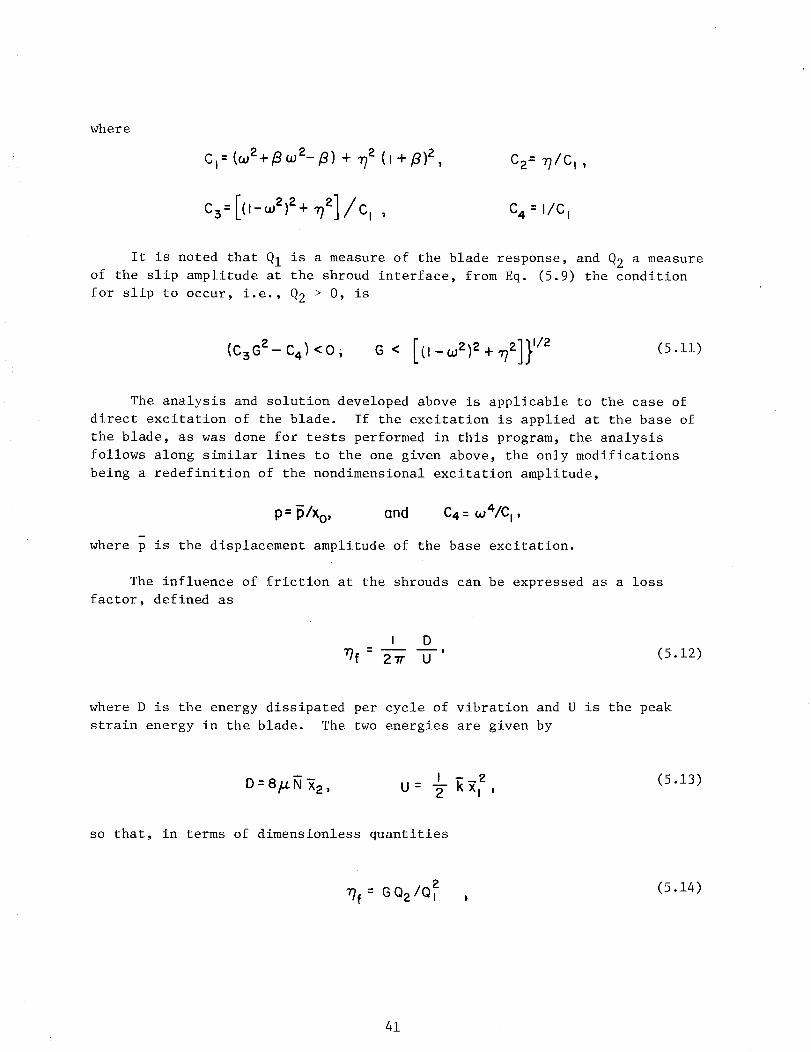
where
c,=(_2+/_(_2_/_)+ .,72(i+,8) 2,
c3:[(,-w2)2+_72]/c,,
It is noted that Q1 is a measure of the blade response, and Q2 a measure
of the slip amplitude at the shroud interface, from Eq. (5.9) the condition
for slip to occur, i.e., Q2 > 0, is
(C3 G2- C4) <0 ; G < [(I-c02)2+772]}1/2(5.1i)
The analysis and solution developed above is applicable to the case of
direct excitation of the blade. If the excitation is applied at the base of
the blade, as was done for tests performed in this program, the analysis
follows along similar lines to the one given above, the only modifications
being a redefinition of the nondimensional excitation amplitude,
p= plx o, and C4 = w4/Ct,
l
where p is the displacement amplitude of the base excitation.
The influence of friction at the shrouds can be expressed as a loss
factor, defined as
I D
_f = 2"n" U (5.12)
where D is the energy dissipated per cycle of vibration and U is the peak
strain energy in the blade. The two energies are given by
D = 8_N "_2,I _2
U: TRx I ,(5.13)
so that, in terms of dimensionless quantities
"/Tf = G Q2/QI 2(5.14)
41
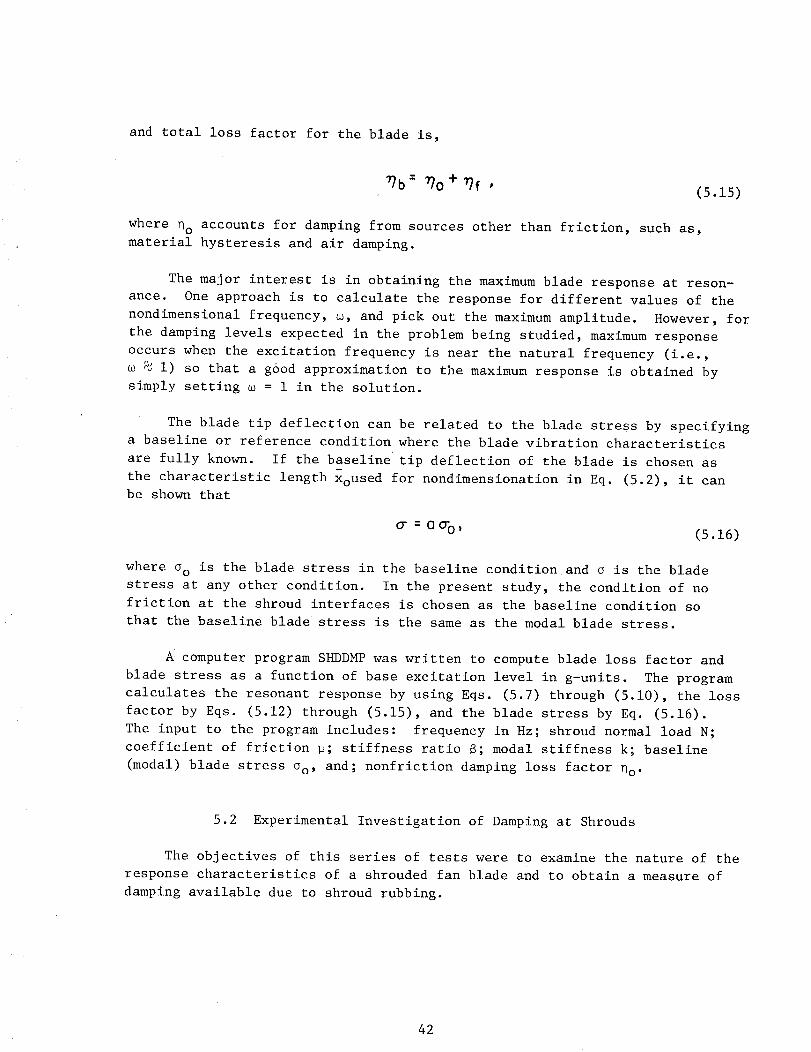
and total loss factor for the blade is,
= 'r/O+ .(5.15)
where _o accounts for damping from sources other than friction, such as,
material hysteresis and air damping.
The major interest is in obtaining the maximum blade response at reson-
ance. One approach is to calculate the response for different values of the
nondimensional frequency, w, and pick out the maximum amplitude. However, for
the damping levels expected in the problem being studied, maximum response
occurs when the excitation frequency is near the natural frequency (i.e.,
_ i) so that a good approximation to the maximum response is obtained by
simply setting _ = i in the solution.
The blade tip deflection can be related to the blade stress by specifying
a baseline or reference condition where the blade vibration characteristics
are fully known. If the baseline tip deflection of the blade is chosen as
the characteristic length Xoused for nondimensionation in Eq. (5.2), it can
be shown that
cr = 0o-0,(5.16)
where ao is the blade stress in the baseline condition and o is the blade
stress at any other condition. In the present study, the condition of no
friction at the shroud interfaces is chosen as the baseline condition so
that the baseline blade stress is the same as the modal blade stress.
computer program SHDDMP was written to compute blade loss factor and
blade stress as a function of base excitation level in g-units. The program
calculates the resonant response by using Eqs. (5.7) through (5.10), the loss
factor by Eqs. (5.12) through (5.15), and the blade stress by Eq. (5.16).
The input to the program includes: frequency in Hz; shroud normal load N;
coefficient of friction _; stiffness ratio B; modal stiffness k; baseline
(modal) blade stress °o, and; nonfriction damping loss factor _o"
5.2 Experimental Investigation of Damping at Shrouds
The objectives of this series of tests were to examine the nature of the
response characteristics of a shrouded fan blade and to obtain a measure of
damping available due to shroud rubbing.
42
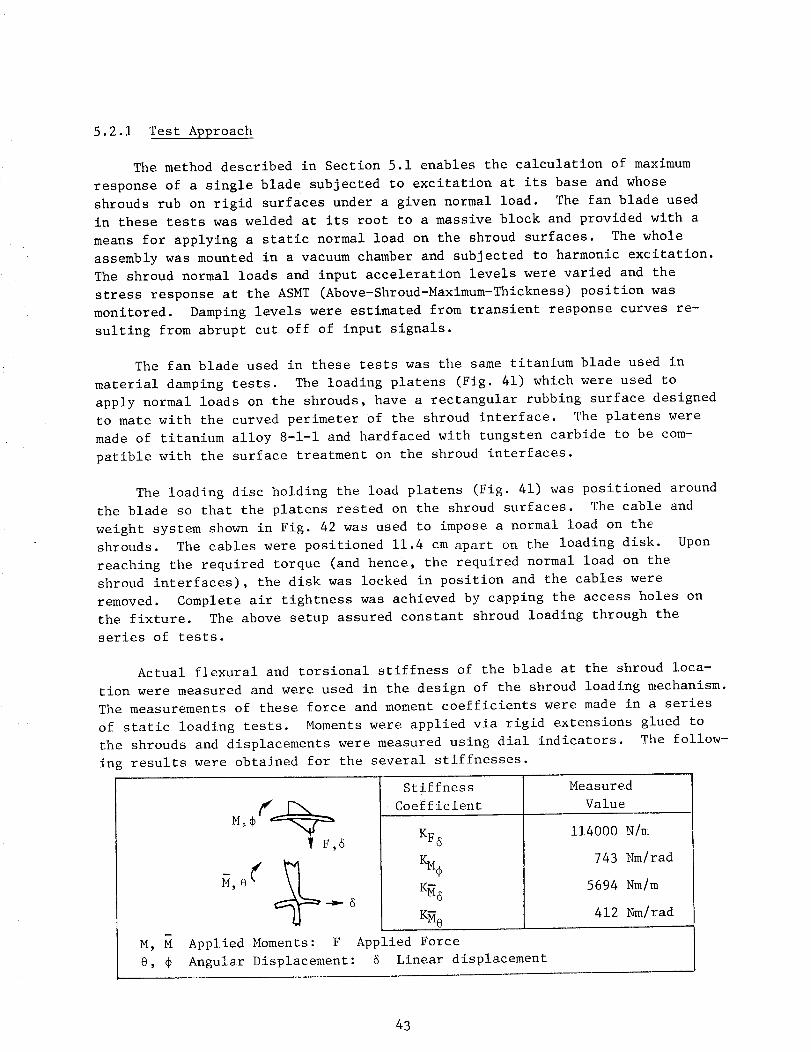
5.2.1 Test Approach
The method described in Section 5.1 enables the calculation of maximum
response of a single blade subjected to excitation at its base and whose
shrouds rub on rigid surfaces under a given normal load. The fan blade used
in these tests was welded at its root to a massive block and provided with a
means for applying a static normal load on the shroud surfaces. The whole
assembly was mounted in a vacuum chamber and subjected to harmonic excitation.
The shroud normal loads and input acceleration levels were varied and the
stress response at the ASMT (Above-Shroud-Maximum-Thickness) position was
monitored. Damping levels were estimated from transient response curves re-
sulting from abrupt cut off of input signals.
The fan blade used in these tests was the same titanium blade used in
material damping tests. The loading platens (Fig. 41) which were used to
apply normal loads on the shrouds, have a rectangular rubbing surface designed
to mate with the curved perimeter of the shroud interface. The platens were
made of titanium alloy 8-1-1 and hardfaced with tungsten carbide to be com-
patible with the surface treatment on the shroud interfaces.
The loading disc holding the load platens (Fig. 41) was positioned around
the blade so that the platens rested on the shroud surfaces. The cable and
weight system shown in Fig. 42 was used to impose a normal load on the
shrouds. The cables were positioned 11.4 cm apart on the loading disk. Upon
reaching the required torque (and hence, the required normal load on the
shroud interfaces), the disk was locked in position and the cables were
removed. Complete air tightness was achieved by capping the access holes on
the fixture. The above setup assured constant shroud loading through the
series of tests.
Actual flexural and torsional stiffness of the blade at the shroud loca-
tion were measured and were used in the design of the shroud loading mechanism.
The measurements of these force and moment coefficients were made in a series
of static loading tests. Moments were applied via rigid extensions glued to
the shrouds and displacements were measured using dial indicators. The follow-
ing results were obtained for the several stiffnesses.
T F,6
Applied Moments :
Angular Displacement :
Stiffness
Coefficient
KF_
KM+
Measured
Value
114000 N/nl
743 Nm/rad
5694 Nm/m
412 Nm/rad
F Applied Force
Linear displacement
43
5.2°2 Instrumentation
The instrumentation system used was the basic system shown in Fig. 43,
and described in Appendix B. All data recording was done on the level
recorder with steady state strain gage millivolt readings taken directly
from the digital voltmeter. The response of the blade was obtained from a
single high temperature strain gage (BLH Electronics Type FSM-12-35-36,
3.18 mm) mounted in the above-shroud-maximum-thickness position (see Fig. 17).
To monitor the shroud motion, two miniature accelerometers (Endevco 2250 and
Vibrametrics MI000) were mounted on a small nonmetallic block _lich was then
epoxied to the shroud (see Fig. 44). The accelerometers monitored the out of
plane (axial) motion and the in plane motion parallel to the rubbing surfaces.
Filtering of the accelerometer signals was required at times to assess the
magnitude of the fundamental component. This was done using the Krolmhite
variable filter in the low pass mode. A preliminary survey of the blade re-
sponse was conducted over a wide frequency range, measurements for which were
made via a miniature accelerometer mounted at the blade tip.
5.2.3 Test Results
Several preliminary frequency sweeps were performed to locate the major
modal responses. The response plot for tip flapwise acceleration of one such
sweep is shown in Fig. 45. This was performed at a relatively low applied
torque (5.2 Nm) and so the boundary conditions at the shroud interface repre-
sented neither a fully locked nor a freely slipping condition. In fact, during
tests at this low normal load on the shrouds, a rattling type of motion was
observed at the shroud location. This resulted in a number of peaks occurring
as a result of the inherently nonlinear nature of the constraint forces at the
shroud interfaces. However, within the range of frequencies swept, the ob-
served modes included three predominantly above-shroud modes. Because of the
low shroud load, these modes occurred at 260 Hz (bending), 475 Hz (second
bending) and 880 Hz (torsion). Decay tests were performed from which the
damping levels in each of these modes were measured. Upon increasing the
applied torque, it was noted that the number of nonlinear responses diminished.
Also, the three above-shroud modes manifested themselves (see Fig. 46) at
278 Hz (bending), iii0 Hz (torsion) and 1440 Hz (second bending). It was
also noted that the response included some participation from the "free" blade
bending mode at 93 Hz.
Subsequent testing was focused only on the above-shroud bending and the
above-shroud torsion modes. These tests were performed with a reduced pres-
sure of 16 torr inside the chamber. Two methods of obtaining the responses to
various input levels were used. The first was to employ a slow frequency
sweep at constant input level for a given shroud load. The frequency range
was just large enough to at least include the half power points. The sweep
44
rate was chosen to be low enough not to distort the response curve at theexisting modal damping levels. A characteristic of these curves was aflat peak over a significant bandwidth around the resonance, as showninFig. 47. The second methodwas to tune the frequency to obtain the maxi-mumresponse for a given mode. After the maximumstrain value had beenrecorded (Digital Voltmeter reading - mv rms) the input was abruptly cut offand the decay curve recorded on the peak level recorder. It was noted thatthis latter method produced higher (generally less than 1 dB) maximumbladeresponses than the sweepmethod. The steady state results were used for com-parison with analysis and are tabulated in Table V. Shroud acceleration dataobtained for certain test points are given in Table V. The loss factor foreach test point was determined from the decay curves and was obtained fromthe meanslope between the 1 dB and 4 dB points downfrom the maximumvalueas described in Appendix B. A sampling of the decay curves obtained for mode1 is shown in Figs. 48 and 49. Figure 48 showshow the decay pattern changesas the input level is increased for a given shroud load and Fig. 49 shows themanner in which the decaying signal changeswith shroud load and input level.Figures 50 and 51 give the ASMTstress as a function of shroud normal loadfor modes 1 and 2.
After testing, the platens were removedand their rubbing surfaces exam-ined. As can be seen in Fig. 52, the majority of wear took place at the outercorners of the surfaces. This occurred even though initially the surfaceswere true and tight against the entire length. It is likely that initiallysomeof the new hardfacing mayhave quickly worn off allowing the load to moveoutward and concentrate on a small area since the loading device was not ableto automatically adjust to the new contact condition. The distance betweenthese contact points was 5.08 cm. However, the fact that the shroud loadacted on a very narrow region enabled its value to be determined from theapplied torque.
5.3 Discussion of Results
In this section, a comparison of the numerical results from analysis andtesting of a part-span-shrouded fan blade with rubbing at the shroud faces ispresented. Values of parameters used in computation are as follows:
Coefficient of friction, _................. 0.3, 0.35
Nonfriction damping loss factor, _o ............ 0.0005
Frequency (Test) ...................... 280 Hz
Static stiffness of blade below shrouds .......... 113.8 kN/m(650 ib/in.)
45
Modal stiffness, k .................... 79.15 kN/m(425 ib/in.)
Modal stress, ASMT(Above-Shroud-Max.-Thickness) ..... 1003 MPa(1.464 x 10⁶ psi)
Stiffness ratio, B .................... 1.44
It may be recalled that the analysis focuses attention on a singlechosen modeof vibration of the blade with rubbing at the shroud faces.The identification of this mode, for obtaining modal parameters, is madedifficult by the complex kinematics and kinetics at the shroud rubbing sur-faces. Several NASTRANruns were madeto study the effect of differentboundary conditions on frequencies and modeshapes of the fan blade. Theruns included the cases of shrouds unrestrained, shrouds fully restrainedat the shroud faces, and shrouds freely slipping at the shroud faces. Also,vibration tests provided insight into the dynamics of shrouds during vibra-tion; for example, the modeshape, and the out-of-plane motion of the shroudsobserved suggested that the second bending modeof the blade with shroudsunrestrained is the appropriate modeof vibration to model. Therefore,values of modal stiffness and modal stress from this modewere used in theanalysis.
The following observations are madeupon a close examination of Figs. 45through 52:
(i) The modesof interest correspond to those in which the motion isessentially above the shroud (see Figs. 45 and 46).
(2) The stress amplitude at slip resonance (see flat top in Fig. 47) isproportional to shroud load (N) and excitation level (g). Off resonance,however, the stress amplitude is proportional to excitation level only. Anincrease in shroud load at a given g level, increases the frequency and re-sponse amplitude at which macroslipping would begin. For a given shroudload, an increased g level hastens the slipping action and leads to a widerbandwidth of frequencies in which damping can be effective. At a given fre-quency and g level, an increase in shroud load leads to an increase in stresslevel.
(3) Reference to Figs. 48 and 49 suggests that slipping increases withg levels as indicated by the progressively steeper slopes at the start of thedecay. However, the decay curves superpose at lower stress levels indicatingdamping levels which are essentially independent of initial conditions.
46
(4) Reference to Fig. 50 suggests that, for a given shroud normal load,the blade stress approaches a constant asymptotic value with increase in exci-tation level; i.e., distinct macroslip conditions. The analysis predicts anabrupt transition, at low g levels, from a region of no friction damping tothe macroslip region. The test results indicate a smoother transition atabout i g for 150 N, about 2 g for 300 N, and about 3 g for 400 N; the smooth-ness of the transition indicating a region of partial microslip conditions.
Analysis suggests that blade stresses are sensitive to the coefficient offriction; higher the coefficient of friction, higher the stresses at whichtransition to macroslip occurs. The ability of the analytical model to pre-dict blade stress appears to improve with reduction in shroud normal loadand/or increase in excitation level, i.e., conditions representing macroslipmotion.
Measurementsmade in the above-shroud-torsion mode indicate damping levelssubstantially lower than those in the above-shroud-bending mode. The vibra-tory motion in the torsion modecauses a slipping motion (rotational) that isdifferent from that caused in a bending mode (translational). In the testsperformed, the rubbing action at the interfaces in the torsion modemay havebeen microscopic as no trend to reach a constant stress level could be observedas g levels increased up to 4 g (compare Figs. 50 and 51).
It would appear that in these tests, dry friction damping was more effec-tive in the bending modethan in the torsion mode. This is most likely dueto the restraint against torsional motion in the present setup being differentfrom that offered by neighboring blades in an assembly.
The wear pattern shownin Fig. 52 suggests that the shroud contact duringvibration occurs over a very narrow region and even this minimal contact issufficient to cause changes in modeshapes as well as to provide adequatedamping.
5.4 Characteristics of Sliding Friction
Observations madein the shroud damping tests indicate that slip occurredbetween the mating surfaces of the shrouds. Accelerometers located on theshroud monitored the shroud motion.
The analysis of Section 5.1 employs the normal coulombdamping modelfor dry friction damping at the shrouds with an estimated equivalent coeffi-cient of friction of 0.3 to 0.35. The purpose of this series of tests was toexamine the friction force-slip relationship due to the surface contact inter-action of two test pieces representative of the shrouds of a typical fan blade.From this investigation, the value of equivalent sliding friction coefficientwas to be derived.
47
5.4.1 Test Approach
The approach chosen for this investigation was to provide sinusoidal
relative motion between two test pieces which were held together with a
constant normal force and to measure the resulting frictional forces directly.
The range of normal loads, frequencies, and relative velocities to be im-
posed were to be consistent with those pertaining to the shroud damping in-
vestigation (see Section 5.2.3).
The test pieces chosen were a pair of load platen pieces as used in the
shroud damping investigation. These were rectangular prisms (22.35 x 32.00
x 6.35 mm) made from titanium (Ti) 8.1.1 alloy with the rubbing face (6.35
x 22.35 mm) flame sprayed with tungsten carbide (see Fig. 52). One piece
was gripped with its rubbing surface horizontal in a special clamp mounted
on a slip plate attached to an electrodynamic shaker such that motion could
be applied parallel to the long side of the rubbing surface (see Fig. 53).
The other piece (shown in Fig. 54 as stationary upper test piece) was mounted
at the end of a pivoted area attached to the shaker support frame (see Figs.
53 and 54). The upper test piece was supported longitudinally by two strain
gaged bolts (previously used in the root damping investigation) and the nor-
mal load was applied via roller bearings along the top surface of the test
piece. Lateral stabilization was achieved by locating the tips of the load
bolts in shallow identations in the fore and aft faces of the test piece. The
strain gaged bolts were preloaded to 575 N. The sensitivity of the load
measuring arrangement was 347 microstrain/kN. The input motion of the lower
test piece was monitored by an accelerometer mounted on the clamp. The normal
load was applied by putting the required weights on the loading platform
as shown in Fig. 53.
Testing consisted of setting the required frequency and input accelera-
tion and recording the frictional force-slip loop on an oscilloscope for a
range of normal loads.
5.4.2 Instrumentation
The excitation control system used is described in Appendix B along with a
50 Hz bandwidth tracking filter to condition the control accelerometer signal.
The strain gages on one of the load bolts were connected to a bridge amplifier
with internal calibration capability. The filtered input acceleration control
signal was connected by the horizontal axis of an oscilloscope and the output
of the bridge amplifier was connected to the vertical axis of the oscilloscope.
The horizontal axis was calibrated by putting in a known acceleration and the
vertical axis was calibrated using the bridge amplifier integral calibrator.
48
5.4.3 Testing and Results
The nominal condition for testing was defined as a displacement of
0.127 mm DA at a frequency of 280 Hz with normal loads ranging from about
250 to 700 N. Three loads were used, based on the weights available and the
dead load of the upper arm; these were 271, 492, and 672 N. The displacement
was varied from 0.056 to 0.132 mm DA and frequencies of 80, 140, 280 and
420 Hz were input.
Initially, the time varying signals from the two accelerometers and
strain gages were examined on the scope. A composite picture of a typical
set of traces for one condition is given in Fig. 55. The magnitude of the
noise in the quiescent system can be seen in the uppermost trace. As can be
seen, the upper test piece acceleration has a high frequency component. This
high frequency may be due to the surface rubbing or possibly to impacting of
loose roller bearings in the upper arm. The component usually accompanied
the results using the lowest normal load. Using a 250 Hz low pass filter,
this component was removed and the magnitude of the fundamental can be seen
compared with that of the input signal. A friction force-slip loop is shown
superimposed for comparison. The results for all tests performed are given
in Table VI.
The equivalent friction coefficient was determined from the measured
area of the recorded (photograph of oscilloscope picture) loop and a knowledge
of the input frequency and displacement. The resulting values for friction
coefficient are plotted against normal load, input frequency, and relative
maximum velocity in Fig. 56.
49
6. DAMPINGDUETOPLATFORM-DAMPERS
Platform-type dampersare frequently used in gas turbine blade designto dissipate energy through friction generated at the interface between thedamperand blade platform. The type of damperconsidered in this program isthe so-called blade-to-ground damper (Fig. 4). During engine operation, cen-trifugal forces bring one end of the damper into contact with the blade plat-form, the other end being attached to a relatively static componentsuch as acover plate. Major parameters which control the extent of friction damping atthe damper to platform interface are: contact load, roughness of surfaces,level of external excitation, location of platform on the blade, and stiffnessof the damper. Studies which address the specific problems of damping at ablade platform can be found in Refs. 30-32. Presented in this chapter are theresults of analysis and testing of a turbine blade subjected to friction damp-ing at its platform.
6.1 Forced Responseof a Turbine Blade with a Platform Damper
Generic models which can be used to analyze blade-to-ground type of plat-form damperscan be found in Ref. 16 and 17. The analytical approach used inthis Section closely follows that of Ref. 30, the generic model being essential-ly the sameas the one in Ref. 17. The following assumptions are made; see re-marks in Section 2.1.2:
i. Friction damping is of macroslip-type, and governed by Coulomb'slaw of dry friction;
. Friction damping does not drastically alter blade resonant frequency
and mode shape, so that attention can be focussed on a single
chosen mode of vibration;
. For the mode under consideration, the modal stiffness, and modal
stress are normalized to unit tip displacement of the blade, and
are computed for the case when the damper is not in contact with
the blade platform.
A schematic sketch of a turbine blade with a platform damper is sho_m
in Fig. 57a , and the associated analytical model in Fig. 57b. The equation
of motion can be written as
x + + c# = coseT - Fd' (6 .i) "
50
where overbars denote dimensional quantities, m, k, and c are modal quantities,P is the excitation amplitude, _ is the excitation frequency, x is the bladetip displacement, Sd is the modal displacement at the platform, and Fd is theforcedue to the damper.
Denoting the blade displacement at the platform by qd, the damper springdisplacement by qd' and introducing
Aqd:_dX' qd = _dY '
it can be shown that
-f+ y--m-'_m , O<_T<TFd = _dkd -Ym. _ r<_t<Ir
COS r = I-(2ym/Ym), Ym-- N/ dkd '
(6.2)
(6.3)
(6.4)
where subscript m denotes peak value, N is the damper normal load, and _ is
the coefficient of friction.
The damper force is a discontinuous function of time, and is shown in
Fig. 58a as a function of the blade displacement at the platform. Figure 58b
shows the blade displacement at the platform and the damper sprin_ displacement
over one cycle of vibration. It is noted that the slip amplitude at the damper
to platform interface is (_=m-Ym)"
It is convenient to nondimensionalize Eqs. (6.1)-(6.4)by introducing
x=X/Xo, a=xm/_o, Y=Y/_o, b=_rn/_o, _oZ=k/_, _u=_/_ o ,
t = t_o , E = _kd/k , _ =c/2m_ o, P=P/kxo
(6.5)
where _o is some characteristic length.
x+x+2_k = p COS _t-Ey,
The result is
(6.6)
x+b-a, O<cot< ry=--b , r < cot <-rr
y(t) = - y(t+_), cos r = I-(2b/a), b = FN/_dkdXo .=
From the equations developed above, two limiting cases can be identified as
follows: damper free (no contact with the platform),
stuck (no slip at the platform), T = _, b = a.
(6.7)
T = 0, b = 0, and damper
51
Due to the nonlinear (discontinuous) nature of the function, y, the
solution of Eq. (6.6) is obtained by using the method of averaging, a perturba-
tion method (Ref. 47). The essence of the method is the assumption that, if
the nonlinearity is small (i.e., e is small), then the amplitude and phase of
the response may be treated as constants within a cycle of vibration. A solu-
tion is sought in the form
x =Q(t)cos[t +e(0] =ocos r, (6.8)
where the amplitude and phase are assumed to be functions of time. Application
of the method of averaging transforms Eq. (6.6) to a set of first-order differ-
ential equations,
6= (I/2_)[- 2_a- E a sin2r- _p sin (y-wt)],
(6.9)
0: (I/2_e)[ar-(a/2) sin 2r- _p cos(r-wt)],
where the case of near resonance, i.e., w_l, has been assumed.
Equations (6.9) yield the steady-state response as a set of nonlinear
algebraic equations,
-2_e +R(E,e,r)= psin_ ,
-28a+S(_,a,r)=P cos_,(6.10)
where
_ =y-wt, 8=w-I,(6.11)
R = - (Ea/_) sinZT, S = (Ea/Z_) (Zr- sin 2T). (6.12)
Though Eqs. (6.10) are nonlinear equations, due to their special structure, it
is possible to calculate the maximum response by some algebraic manipulations;
see Ref. 17. Some of the steps are outlined below.
Squaring and adding Eqs. (6.10) yields a quadratic equation for 6, the
solution of which is
Since 6 is a frequency parameter, the maximum response occurs when _ has
a double root; that is,
p2 _ (R_2_Q)2 = 0.
(6.13)
(6.14)
52
By using the definitions for T and R given by Eqs. (6.4) and (6.11), respec-tively, it can be shownthat Eq. (6.14) leads to a quadratic equation for themaximumamplitude. The final results are
+
[ ]corn= I +(e/4-rr)(2r m- sinrm)_ rm COSt I-(2G/Qm) , '
where Qm is the maximum respose and _m is the frequency at which the maximum
occurs, and
Qrn = O/p, G = b/p, "r/o = 2 Ej .
Further, it is seen from Eq. (6.15) that Qm is a function of no , e, and G
which in turn is a function of the normal load on the platform; see Eq. (6.7).
The optimum value of the damper normal load can be determined by minimizing
Eq. (6.15) with respect to G; that is
dQm
dG -0,
which leads to
G*= 7r/ [2(E+Tr_o)] ,(6.17)
where G* is the optimum value. The associated optimum response and frequency
can be shown to be
* = w*= I+ (6 18)Om 2G* , • .
The analysis and solution developed above is applicable to the case of
direct excitation of the blade. If the excitation is applied at the base of
the blade, as was done for tests performed in this program, the analysis follows
along similar lines to the one given above, the only modification being a re-
definition of the nondimensional excitation amplitude,
p = D/_O ,
where p is the displacement amplitude of the base excitation.
The influence of friction at the platform can be expressed as a loss
factor, defined asl D
_f - 2_ U ' (6.19)
where D is the energy dissipated per cycle of vibration and U is the peak
strain energy in the blade. The two energies are given by
53
so that in terms of dimensionless quantities
"r/f : (4_/"rr)G (Qrn-G)/Q2m , (6.21)
and total loss factor for the Blade is,
"r/b= 770+ _f , (6.22)
where qo accounts for damping from sources other than friction, such as,
material hysteresis and air damping.
The blade tip deflection can be related to the blade stress by specifying
a baseline or reference condition where the blade characteristics are fully
known. If the baseline tip deflection of the blade can be chosen as the
characteristic length 2 0 used for nondimensionalization in Eq. (6.5), then it
can be shown that
Or = O OrO' (6.23)
where oo is the blade stress in the baseline condition and ois the blade stress
at any other condition. In the present study, the damper free condition (no
contact between damper and platform) is chosen as the baseline condition.
It was found, from tests in the damper free condition, that the blade
shank stress is a nonlinear function of the base excitation level; see Fig. 61.
In other words, damping due to sources other than platform friction, qo, is
a function of the excitation level. It can be shown that,
TO : POrm/Oro ' (6.24)
where om is the modal stress.
A computer program PLTDMP was written to compute blade loss factor, resonant
frequency and blade shank stress as a function of the normal load on the platform.
The program calculates the baseline damping loss factor by using Eq. (6.24),
resonant response by Eq. (6.15), resonant frequency by Eq. (6.16), loss factor
by Eqs. (6.19) through (6.22), and blade shank stress by Eq. (6.23). The program
terminates if the resonant frequency changes from the baseline frequency by a
specified amount. The input to the program includes: frequency in Hz; base
excitation level in g-units; coefficient of friction D;damper stiffness kd;
modal displacement at the platform _d; modal stiffness k; modal stress Om; base-
line stress _o and; allowable frequency shift, expressed as a fraction of the
baseline frequency.
54
6.2 Platform DampingTests
The analysis of Section 6.1 was developed for application to blade-to-groundtype platform dampers. The forced response of a bladelike structure havingsuch a damper is determined in terms of the modal quantities of the structure,the normal load applied through the damper, the stiffness of the damperand thefrictional characteristics of the rubbing interface. In order to verify theanalysis, a turbine blade with a suitable platform configuration was chosenfor the test program and a meanswas devised to provide damping at the platform.
The test objective was to obtain the frequency response of the blade forvarious levels of input excitation and damper load. The effect of damperstiff-ness was also to be determined.
6.2.1 Test Approach
In an operating engine, centrifugal forces acting on the damper provide
the contact load between the damper and the blade platform. In this test ser-
ies, the contact load was applied and controlled by a lever and weight mechan-
ism as shown in Fig. 4. The blade was rigidly clamped in a steel fixture and
excitation was provided at the root by a powerful electrodynamic shaker. This
method was chosen so that sufficiently high input force was available to over-
come the large damping forces expected and to obtain realistically high stresses
in the shank of the blade. The modal response of the blade was measured using
strain gages located at the blade root on the shank and at the airfoil root on
the centerline through the shank.
The test method chosen was to apply a selected damper load and excite
the blade sinusoidaly at a given input level in the vicinity of the blade's
first mode frequency. The frequency was then tuned to produce the maximum
blade response.
Since the level of damping produced by the platform damper far exceeds the
contributions from other sources, the tests were performed in air. The test
piece was a second stage high pressure turbine blade having a three teeth fir
tree root configuration and a platform located at approximately 27.7 percent
blade span as measured from the shank root. The platform had a generous trail-
ing edge overhang which was convenient for accommodating the damper. The blade
material was a nickel chromium high temperature alloy. The basic blade geometry
is given in Fig. 59.
The damper was a rectangular prism _ntegral with, and cantilevered from
a T416 stainless steel loading arm. The free end was arranged to rub on the
underside of the platform, with the load vector normal to the platform and
damper end face surfaces. Two dampers were made, both with a length of i0.i mm
and thickness of 3.2 mm. Their depth measurements were 7.6 mm and 4.2 mm
giving nominal stiffnesses at the free ends of 10.3 and 48.6 MN/m respectively.
However, a static test of the smaller damper indicated a stiffness, in the
55

fixture, of 5.5 MN/m. This figure was used in the analysis. The area ofthe rubbing surface was madethe samefor both dampers, i.e. 2 mmx 2 mm.The damperand loading arms were heat treated to HRC41 to match the hardnessof the blade. The basic fixturing requirements were that the blade be heldrigidly at its root with negligible root damping and that it provide a meansof applying a damper load up to 900Non the blade platform with no free motionin the clamping mechanism. The fixture used is shownin Fig. 4 and comprisesa two piece clamp bolted to an adapter base plate mounted on the shaker. Theclamp has steps machined in its upper and lower pieces, which contact thepeaks of the two outer lobes of the blade root fir tree. Four 3/8 inch bolts,each torqued to 48 Nm, allowed the blade to be tightly gripped between the twoclamp blocks. The loading arm of the dampermechanismwas pivoted on a pinmounted in the lower clamp block. The pivot was designed to be self adjustingand no free play was possible. The mechanical advantage of the loading mech-anism was 4:1 with the lever loaded horizontally at the top using a cable pul-ley and hanging weight system. A counter balance was attached to the baseplate to prevent lateral loading of the shaker armature.
6.2.2 Instrumentation
The blade was instrumented with two strain gages (Micro Measurements type
EA-06-062AK-120), one mounted at the shank root and the other at the airfoil
root as shown in Fig. 59. Both gages were on the center line of the shank.
Another strain gage of the same type, was mounted diagonally on the side of
the large damper.
The instrumentation system used in this test series was the basic system
described in Appendix B. For the final tests, the output from the blade strain
gages was read directly from the digital volt meter and tabulated together with
the input g level and frequency readings.
6.2.3 Testing and Results
Prior to vibration testing, the stiffness of the small damper was esti-
mated with the loading arm mounted on the fixture by statically loading the
damper tip and measuring the tip displacement using a dial indicator. The
measured stiffness was 5.5 MN/m.
During early exploratory vibration testing, the strain gage on the large
damper was monitored. An example of the traces obtained is shown in Fig. 60.
It may be noted that at a constant normal load of 89N on the platform, the
damper strain gage response changes from nearly sinusoidal to one with a much
more complex wave form as the excitation level is increased from 2.4 g pk. At
15 MPa shank stress, the signal clearly shows the periodic loss of contact with
56
the platform. At this point acoustical noise was emitted from the blade. At4.6 g pk input level, the signal distortion is more pronounced and the noiselevel is increased.
An initial test was performed to examine the blade alone response char-acteristics and to assess the extent of the root damping. The blade responseto input g levels from 0.06 to 0.9 are tabulated in Table VII and shownplottedin Fig. 61.
Final testing consisted of setting the platform damper load and input accel-eration level and exciting the blade in the vicinity of its fundamental (firstflap) mode. It was found that there was a threshold of both frequency and inputlevel below which the blade showedno significant response. Once the thresholdhad been crossed then the blade vibration would continue even with reduction ininput level back into the threshold region. Thus, this region could not beclearly defined but every effort was madeto obtain these threshold results ina consistent manner. For the highest levels of platform load (>50 N) the reson-ant response frequency varied significantly from that of the fundamental modeOf the lightly loaded blade. This required an increase in the range of frequen-cies to include any other resonant modesin the response. The response resultsfor the small and large dampersare given in Tables VIII and IX respectively.Plots showingthe variation of blade stresses with input level for the range ofplatform normal loads are given in Figs. 62 and 63. It should be noted in Figs.62 and 63 that the faired curves used to connect the test points are to aid inidentification of the various load cases and do not represent theoretical results.On Fig. 64 the shank stress is shownplotted against the applied platform normalload for input values of 0.5g, 0.7g, and 1.0g. Test and theoretical values aresho_ for comparison.
6.3 Discussion of Results
In this section, a comparison of the numerical results from analysis andtesting of a turbine blade with a blade-to-ground platform damper are presented.Values of the parameters used in computation are as follows:
Coefficient of friction .........Frequency, (Test) ............Damperstiffness, kd ..........Modal stiffness, k ...........Modal displacement at platform, _d •Modal shank stress, om .........Baseline conditions ...........
0.15, 0.3515 Hz5472 kN/m (31250 ib/in)245 kN/m (1400 Ib/in)0.122293 MPa(3.348E+5 psi)see Fig. 61
57
The modal information is for the first modeand normalized to unit tipdisplacement of the blade.
Figure 64 shows the theoretical and test results of blade shank stressas a function of normal load for three base excitation levels and two valuesof friction coefficient. For the theoretical results shown, the change inresonant frequency is less than one percent of the baseline frequency. FromFig. 64 the following observations can be made.
(i) The theoretical results for the case of _= 0.15 are in generalagreementwith the test results.
(2) Higher excitation levels and/or lower values of friction coefficientimply lower rates of stress attenuation,
(3) For the relatively high stiffness of the damperused in the presentprogram, the rate of stress attenuation is essentially linear.
The influence of damper stiffness on the response characteristics isshownin Fig. 65, where the blade shank stress is plotted as a function ofnormal load, for a given excitation level and for four values of damper stiff-nesses. For all the results shownin Fig. 65, the change in resonant frequencyis less than one percent of the baseline frequency. It can be seen that forsmaller values damperstiffness, there is an optimum normal load where the stressis a minimum. For normal loads higher than the optimum, there is a gradual in-crease in shank stress.
Devices such as the platform damperbelong to a class of inherently nonlin-ear damping mechanismssimilar to those of shroud damping. As in the case ofshroud damping, the vibration characteristics depend on the nature and extentof contact between the damperand the blade platform, as well as the excitationlevel imposed on the system. The traces shownin Fig. 60 are a clear indicationof the changes taking place at the contact region; a nearly sinusoidal responsechanging to one which emitted audible noise.
Examination of Figs. 62 and 63 suggest that until a certain combination ofg levels and normal loads are attained, the blade response would be practicallynot measureable. Uponreaching those levels, the response of the blade woulddepend on the magnitude of the normal load. If the latter is "high", the re-sponse modemay correspond to a "stuck damper" condition as is evident fromslightly higher frequencies measured. If the g levels continued to increase,then a condition in which the damperbreaks contact maybe reached. Under theseconditions the blade "plunges" into a lower moderesulting in the jumps in stressas shownin Figs. 62 and 63.
58

A careful examination of Figs. 62 and 63 also reveals that the airfoilstresses which begin being lower than that measuredon the shank graduallybecomehigher for "larger" loads and at higher g levels. This is a clearindication of a change in modeshape which points to the need to include morethan a single modein the mathematical model.
59
7. GENERALCONCLUSIONSANDRECOMMENDATIONS
The series of analytical and experimental programs discussed in thisreport have generated data which forms the basis for understanding the po-tential of nonaerodynamicdamping in limiting blade vibration levels. Thisinvestigation begins to address the designer's need to be able to set speedmargins of rotors on the basis of predicted damping levels at low orderresonances. As the exciting forces acting on rotors vibrating at a resonantspeed are counteracted entirely by damping forces, only an accurate estimateof avialable damping can influence the decision in regard to the range ofacceptable speeds of the machine. Similarly rotor speeds at which bladeflutter is likely cannot be accurately predicted without a knowledge of thecontributions fromall sources of damping.
All test data and analyses in this report are generated for single bladesand an attempt has been madeto outline procedures to extend the results forapplication to an assembly of blades. Undoubtedly future programs must beaimed at verifying these procedures and develop a more firm data base thatwill serve as a guideline to the designer.
Throughout the present program, the tests underscored the importance offixture design. Enormouscare had to be exercised to make sure that the fix-tures designed and fabricated were rugged enough to withstand the vibrationlevels and to contribute the barest minimumto damping being measured. Theseare tough requirements and cannot always be fully met. Evenwith the care thatwas exercised in this program, it was clear that the root restraint for thetwisted plate was found to be less than adequate in the bending modes.
Measurementsof damping of aerofoil type componentsmust always be madein vacuumas the contributions from air can lead to order of magnitude incre-ments in measureddamping. While this requirement sounds simple to implement,considerable difficulties in measurementcan arise for componentswith extremelylow levels of damping. In fact, material dampingmeasurementsfor the fanblade tested in the program required the use of a pressurized chamber. Datataken at gradually decreasing pressure levels had to be extrapolated to esti-mate damping under complete vacuumconditions.
Material damping evaluation was madeby testing a beam, a twisted plateand an advanced fan all madeof a titanium alloy. Material damping constants(J and n) were determined from test data which indicated a value close to n = 2.
60
The latter is in general agreementwith earlier reports but the value ofJ found in this program is different from published results by nearly an orderof magnitude. The initial conclusions are that this difference maybe attri-buted to the differences in frequencies of vibration between the tests con-ducted in this program (50 to nearly 600 Hz) and essentially static condi-tions used in earlier reports. Theseare, of course, preliminary conclusions.Only a thorough program solely devoted to a study of damping constants for aset of selected engine blade materials can serve to establish the magnitudesof these constants for use in design considerations.
Testing in a limited thermal environment showedthat the differences indamping between "cold" and "hot" conditions are insignificant. Similar con-clusions are drawn for the differences in damping between zero speed and atspeed. The latter reached nearly 1500 rpm and any changes in damping observedis attributed to possible fixture participation.
The general conclusion (that can be drawn from all the studies on materialdamping conducted in this program) is that damping due to hysteresis in tita-nium is very low; the loss factor being of the order of 2 x 10⁻⁴ to 5 x 10⁻⁴ .If n = 2, the samevalues apply for a whole assembly. This suggests thatdamping due entirely to this source should not be accounted for in designagainst flutter and resonant vibration.
Insofar as damping available at dovetail type root structure is concerned,the data shows that rapid reduction in damping loads occur with increasingnormal load on the root. Thus, in actual practice, for an advanced fan underoperating conditions the centrifugal pull acting on blades is so high thatlittle or no relative motion at the root-disc interaface is likely. Thus,contributions from this source of damping at operating speeds is projectedto be very minimal. Unless design changes incorporating retention techniqueswhich permit relative motions at the root location can be examined and intro-duced, damping from this source should be viewed to be of little importancefor design considerations.
Dampingat shrouds and at blade platforms due to rubbing represent byfar, the most complex mechanismto model analytically in view of the in-herently nonlinear nature of these mechanisms. Testing to measurecontri-butions from these mechanismspresents its own problems in view of the con-tinuously changing boundary conditions at the interfaces as the loading andfrequency on the device are varied.
Dampingat shroud interfacesappears to be the most likely availablesource of damping for shrouded titanium blades. The level of damping avail-able from the rubbing action is difficult to estimate. However, calculationsmadeusing the analytical model developed in this program indicate that the
61
principal governing parametezs are the excitation (g) levels to which theblades are subjected and the normal loads acting at the interfaces. Calcu-lations show that a loss factor of about .003 can be achieved under a normalload of 500 N and a 5 g loading resulting in a vibratory stress of 190 MPa.These numbers are valid for a single blade and no extensions to an assemblycan be madewithout a knowledge of a modal analysis of a fan assembly vibrat-ing in a given nodal diameter pattern.
Experience in regard to platform damping suggests that the importantparameters are the damperstiffness and normal load on the damper. Stressreductions of nearly 50 percent can be attained with this mechanism. Stressattenuation in turbine blades can occur either due to dampingand/or due toa change of modeshape. The latter arises due to restraint provided by theplatform damper.
Under certain combinations of excitation levels and normal load,changes in blade modeshapes were observed in this program. Thus, futureprograms in this area must be aimed at including several modesin the mathe-matical model.
Tests conducted on composite material specimens undoubtedly show thedamping capacities inherent in composites but the principal difficulty intesting composites lies in obtaining repeatability and consistency. Only alarge number of tests can serve to establish reliable information takinginto consideration scatter levels.
The program on coating effects was limited to the study of increase indamping, if any, that can be obtained by the use of thermal barrier coatings.Test data indicated that the differences in damping before and after thecoating was applied to a turbine blade could be significant but the overalldamping levels were still very low.
Although all the tests were conducted on single blades and appropriatemathematical models were developed to represent the several mechanismsofdamping, procedures to apply this data to predict damping levels in an assem-bly of blades have been developed and discussed.
62
8. REFERENCES
+
+
°
.
.
,
,
.
.
I0.
ii.
12.
13.
14.
Lazan, B. J.: Damping of Materials and Members in Structural Mechanics.
Pergamon Press, N.Y., 1968.
Goodman, L. E.: Material Damping and Slip Damping. Shock and Vibration
Handbook, Ed. Harris, C. M. and Crede, C. E. Second Edition, McGraw-Hill
Book Co., N.Y., 1976, Chptr. 36.
Bert, C. W.: Material Damping: An Introductory Review of Mathematical
Models, Measures and Experimental Techniques, Jour. Sound and Vibration,
29(2), pp. 129-153, 1973.
Crandall, S. H.: The Role of Damping in Vibration Theory, Jour. Sound
and Vibration, ii(i), pp. 3-18, 1970.
Pisarenko, G. S.: Vibrations of Elastic Systems Taking Into Account of
Energy Dissipation in the Material. Wright-Patterson Air Force Base,
WADD TR60-580, 1962.
Arnoldi, R. A.: Internal Friction Damping of Mechanical Vibrations, Ph.D.
Thesis 1953. Polytechnic Institute of Brooklyn.
Baker, W. E., Woolam, W. E. and Young, D.: Air and Internal Dumping of
Thin Cantilever Beams, Int. Jour. Mechanical Sci., Vol. 9, pp. 743-766,
1967.
Dawson, T. H.: Continuum Description of Hysteresis Damping of Vibrations,
Int. Jour. Solids and Structures, Vol. 14, pp. 457-464, 1978.
Myklestad, N. O.: The Concept of Complex Damping, ASME Jour. Applied
Mechanics, pp. 284-286, Sept. 1952.
Snowdon, J. C.: Transverse Vibration of Beams with Internal Damping.
Journal of the Acoustical Society of America, Vol. 35, No. 12, ]963.
Mead, D. J. and Mallick, A. K.: Material Damping Under Random Excitation,
Jour. Sound and Vibration, 45(4), pp. 487-494, 1976.
Clark, J. W. and Hagel, W. C.: Influence of Static Stress and Temperature
on Internal Damping, Trans. American Society of Metals, Vol. 52,
pp. 95-115, 1960.
Den Hartog, J. P.: Forced Vibrations with Combined Coulomb and Viscous
Friction, Trans. ASME, APM-53-9, pp. 107-115, 1931.
Ruzicka, J. E.: Resonance Characteristics of Unidirectional Viscous
and Coulomb-Damped Vibration Isolation Systems, ASME Jour. Engineering
for Industry, pp. 729-740, Nov. 1967.
63
8. REFERENCES(Cont'd)
15.
16.
17.
18.
19.
20.
21.
22.
23.
24.
25.
26.
27.
Schlesinger, A.: Vibration Isolation in the Presence of CoulombFriction,Jour. Soundand Vibration, 63(2), pp. 213-224, 1979.
Levithan, E. S.: Forced Oscillation of a Spring-Mass System HavingCombinedCoulomband Viscous Damping, Jour. Acoustical Society ofAmerica, Vol. 32, No. I0 pp. 1265-1269, 1960.
Caughey, T. L.: Sinusoidal Excitation of a Systemwith Bilinear Hysteresis,ASMEJ. of Applied Mech., Vol. 27, pp. 640-643, Dec. 1960.
Hanson, M. P.: A Vibration Damperfor Axial-Flow CompressorBlading,Proc. S.E.S.A., Vol. 14, No. i, pp. 155-162, 1955.
Hanson, M. P., Meyer, A. J. and Manson, S. S.: A Method of EvaluatingLoose-Blade Mounting as a Meansof Suppressing Turbine and CompressorBlade Vibration, Proc. S.E.S.A., Vol. i0, No. 2, pp. 103-116, 1953.
Jones, D. I. G. and Muszynska, A.: Vibrations bf a CompressorBlade withSlip at Root. The Shock and Vibration Bulletin, No. 48, pp. 53-61,Sept. 1979.
Jones, D. L. G. and Muszynska, A.: Design of Turbine Blades for EffectiveSlip Dampingat High Rotational Speeds. Paper presented at the Shockand Vibration Symposium,Washington, D.C., October 1978.
Bezhenov, A. I.: "Influence of SomeFactors on GTETurbine BladeVibrational Energy Dissipation". Izvestia VUZ, Aviatsionnaya Tekhnika,Vol. 20, No. 3, pp. 117-121, 1977.
Hartley, R., Sturgess, C. E_ N and Rowe, G. W.: Friction in Finite-Element Analyses of Metalforming Processes, Int. Jour. Mechanical Sci.,Vol. 21, pp. 301-311, 1979.
Goodman,L. E., and Klumpp, J. H.: Analysis of Slip DampingwithReference to Turbine-Blade Vibration, ASMEJour. Applied Mechanics,pp. 421-429, Sept. 1956.
Bielawa, R. L.: An Analytical Study of the Energy Dissipation ofTurbomachinery Bladed-Disk Assemblies Due to Inter-Shroud SegmentRubbing, ASMEPaper No. 77-DET-73, Sept. 1977.
Srinivasa_, A. V., Lionberger, S. R. and Brown, K. W.: DynamicAnalysisof An Assembly of ShroudedBlades Using ComponentModes, ASMEJour.Mechanical Design, Vol. i00, No. 3, pp. 520-527, 1978.
Earles, S. W. E. and Williams, E. J.: A Linearized Analysis forFrictionally DampedSystems, Jour. Soundand Vibration, 24(4),pp. 445-458, 1972.
64
8. REFERENCES(Cont'd)
28. Williams, E. J. and Earles, S. W. E.: Optimization of the ResponseofFrictionally DampedBeamType Structures with Reference to Gas TurbineCompressorBlading, ASMEJour. Engineering for Industry, pp. 471-476,May 1974.
29. Rimkunas, D. A. and Frye, H.M.: Investigation of Fan Blade ShroudMechanical Damping,Wright-Patterson Air Force Base, Aero PropulsionLab. Report # FR-II065, 1979.
30. Griffin, J. H.: "Friction Dampingof Resonant Stresses in Gas TurbineEngine Airfoils". ASMEPaper #79-GT-I09, March 1979.
31. Allen, R. E. and Sidenstick, J. W.: 'Turbine Blade Technology-Present andFuture", ASMEPaper #80-C2 Aero-10, August 1980.
32. Dickerson, E. O.: Turbine Blade Structural DynamicAnalysis, AIAAPaper No. 80-0782.
33. Plunkett, R.: Measurementof Damping, Structural DampingASME,1959.
34. Plunkett, R.: Problems in DampingMeasurementand Analysis, CourseNotes, Vibration DampingShort Course, Univ. of Dayton ResearchInstitute, Dayton, Ohio, Oct. 1978.
35. Ramsey,K. A.: Effective Measurementsfor Structural Dynamics Testing,Soundand Vibration, Nov. - Dec. 1975.
36. Drake, M. L.: Fast Fourier Transform Methods, Course Notes - VibrationDampingShort Course, University of Dayton Research Institute, Dayton,Ohio, Oct. 1978.
37. Halvorsen, W. O. and Brown, D. L.: Impulse Technique for StructuralFrequency ResponseTesting. Soundand Vibration, Nov. 1977.
38. Klosterman, A., and Zimmerman,R.: Modal Survey Activity Via FrequencyResponseFunctions. S.A.E. Paper 751063.
39. Granick, N. and Stern, J.: Material Dampingof Aluminumby a Resonant-Dwell Technique, NASATN D-2893.
40. Parin, M. L.: Material Property Measurementsand Data Reduction, ResonantBeamMeasurementTechniques, Course Notes - Vibration DampingShortCourse. Univ. of Dayton Research Institute, Dayton, Ohio, Oct. 1978.
41. Smith, G. M. and Berns, H. D.: Frequency PhaseMethod for MeasuringMaterial Damping. Materials Research and Standards, May 1964.
42. Gibson_ R, F. and Plunkett, R.: A Forced Vibration Technique forMeasurementof Material Damping, Paper presented at the SESASpringMeeting, Dallas, Texas, May 1977.
65
8. REFERENCES(Cont'd)
43.
44.
45.
46.
Gibson, R. F.: DynamicMechanical Behavior of Fiber-Reinforced Composites:Measurementand Analysis, J. CompositeMaterials, Vol. I0, Oct. 1976.
Stahle, C. V. Jr.: Phase Separation Technique for Ground VibrationTesting, Aerospace Engineering, July 1962.
Keller, A. C.: Vector ComponentTechniques: A ModernWayto MeasureModes. Soundand Vibration, Marc. 1969.
Meirovitch, L.: Analytical Methods in Vibrations, MacMillon Co.,NewYork, Chapter 4, 1967.
Nayfeh, A. H.: Perturbation Methods, Wiley Interscience, Chapter 5, 1973.
Young, D. and Felgar, R. P.: Tables of Characteristic FunctionsRepresenting Normal Modesof Vibration of a Beam. The University ofTexas Publication, No. 4913, July i, 1949.
66
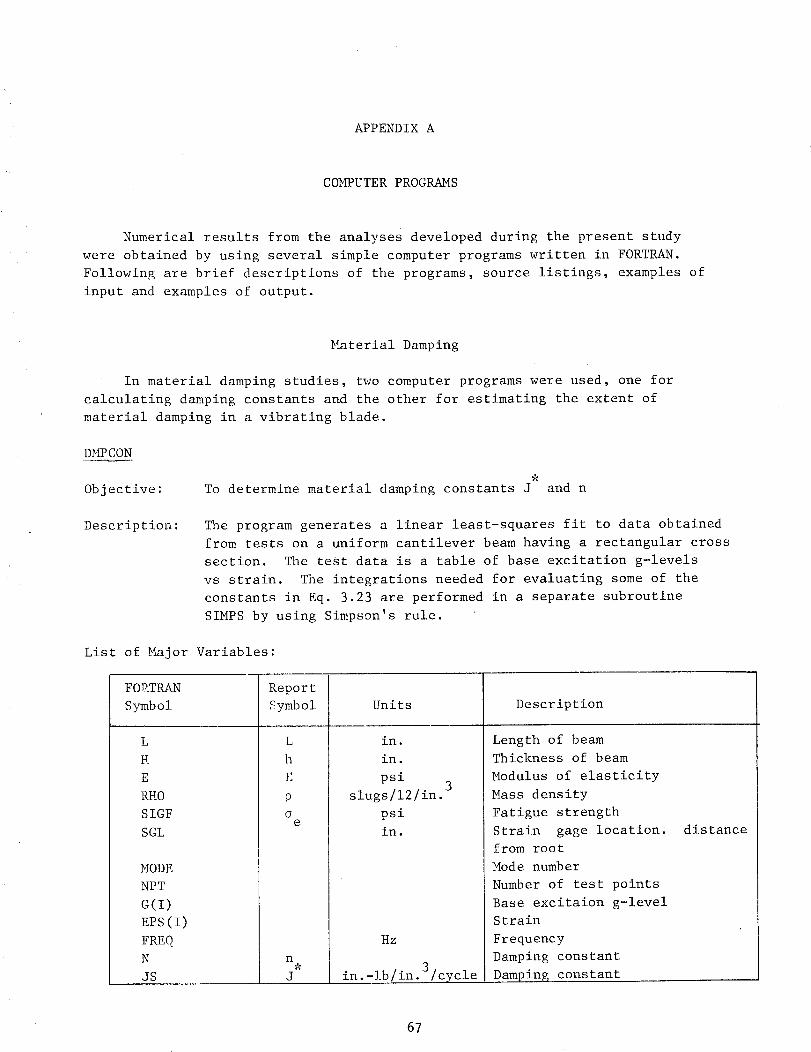
APPENDIX A
COMPUTER PROGRAMS
Numerical results from the analyses developed during the present study
were obtained by using several simple computer programs written in FORTRAN.
FollowinE are brief descriptions of the programs, source listings, examples of
input and examples of output.
Material Damping
In material damping studies, two computer programs were used, one for
calculating damping constants and the other for estimating the extent of
material damping in a vibrating blade.
DMPCON
Objective: To determine material damping constants J and n
Description : The program generates a linear least-squares fit to data obtained
from tests on a uniform cantilever beam having a rectangular cross
section. The test data is a table of base excitation g-levels
vs strain. The integrations needed for evaluating some of the
constants in Eq. 3.23 are performed in a separate subroutine
SIMPS by using Simpson's rule.
List of Major Variables:
FORTRAN
Symbol
L
H
E
RHO
SIGF
SGL
MODE
NPT
G(I)
EPS(I)
FREQ
N
JS
Report
Symbol
L
h
E
P
Ue
n
J
Units
in.
in.
psi3
slugs/12/in.
psi
in.
Hz
in. -!b / in. 3 / cycle
Description
Length of beam
Thickness of beam
Modulus of elasticity
Mass density
Fatigue strength
Strain gage location_
from root
Mode number
Number of test points
Base excitaion g-level
Strain
Frequency
Damping constant
Damping constant
distance
67
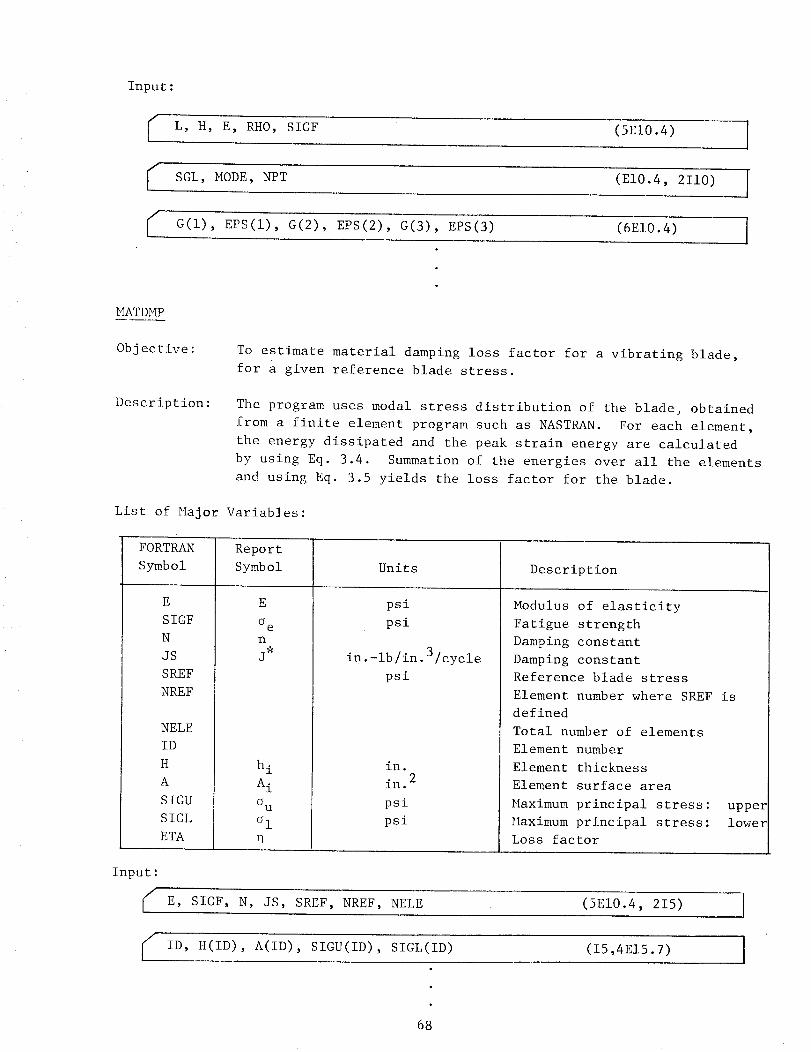
Input:
L, H, E, RHO,SIGF(5EI0.4) I
SGL,MODE,NPT (El0.4, 2Ii0) ]
G(1), EPS(1), G(2), EPS(2), G(3), EPS(3) (6EI0.4) ]
MATDMP
Objective : To estimate material damping loss factor for a vibrating blade,for a given reference blade stress.
Description: The program uses modal stress distribution of the blade_ obtainedfrom a finite element program such as NASTRAN.For each element,the energy dissipated and the peak strain energy are calculatedby using Eq. 3.4. Summationof the energies over all the elementsand using Eq. 3.5 yields the loss factor for the blade.
List of Major Variables:
FORTRANSymbol
ESIGFNJSSREFNREF
NELEIDHASIGUSIGLETA
ReportSymbol
E
°enj*
Units
psi
psi
in.-ib/in.3/cycle
psi
h i
A i
_u
o I
in.
in. 2
psi
psi
Description
Modulus of elasticity
Fatigue strength
Damping constant
Damping constant
Reference blade stress
Element number where SREF is
defined
Total number of elements
Element number
Element thickness
Element surface area
Maximum principal stress:
Maximum principal stress:
Loss factor
upper
lowez
Input:
S E, SIGF, N, JS, SREF, NREF, NELE (5EI0.4, 215)
ID, H(ID), A(ID), SIGU(ID), SIGL(ID) (I5,4E15.7)
68
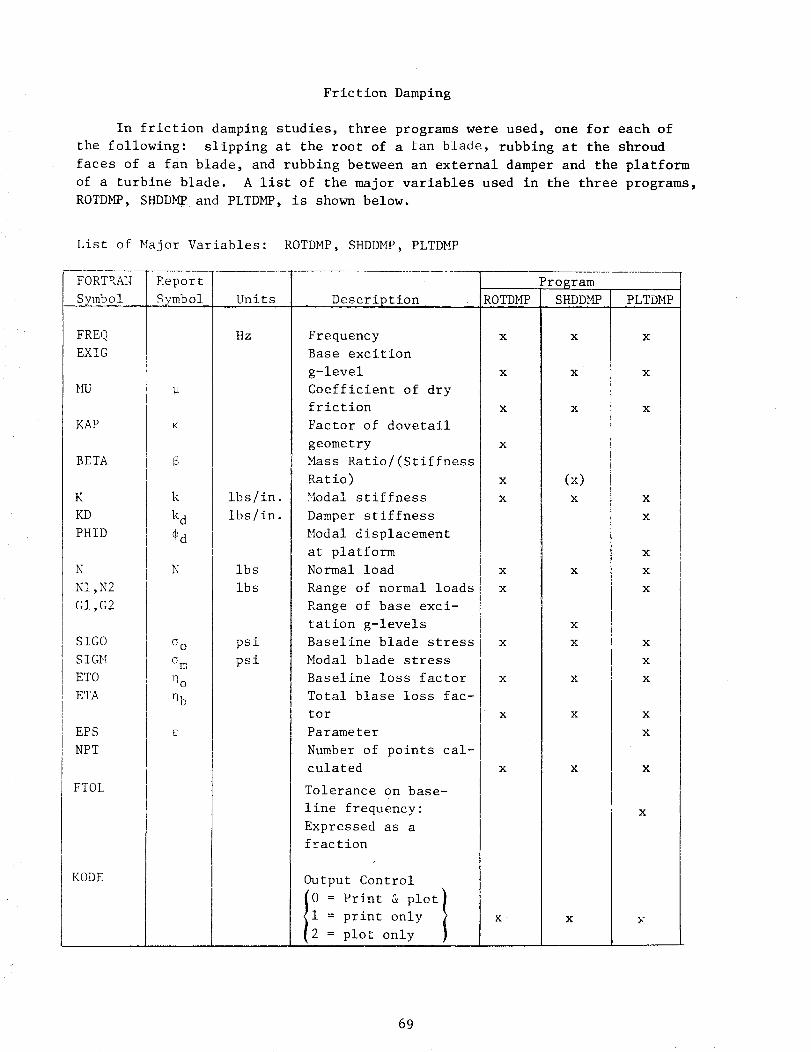
Friction Damping
In friction damping studies, three programs were used, one for each of
the following: slipping at the root of a _an blade, rubbing at the shroud
faces of a fan blade, and rubbing between an external damper and the platform
of a turbine blade. A list of the major variables used in the three programs,
ROTDMP, SHDDMP and PLTDMP, is shown below.
List of Major Variables: ROTDMP, SHDDMP, PLTDMP
FORTRAN
Symbol
FREQ
EXIG
MU
BETA
K
KD
PHID
N
NI,N2
GI,G2
SIGO
SIGM
ETO
ETA
EPS
NPE
FTOL
KODE
Report
Symbol
K
B
k
kd
_d
N
O o
O n
qo
nb
Units
Hz
ibs/in.
ibs/in.
ibs
ibs
psi
psi
Description
Frequency
Base excition
g-level
Coefficient of dry
friction
Factor of dovetail
geometry
Mass Ratio/(Stiffness
Ratio)
_lodal stiffness
Damper stiffness
Modal displacement
at platform
Normal load
Range of normal loads
Range of base exci-
tation g-levels
Baseline blade stress
Modal blade stress
Baseline loss factor
Total blase loss fac-
tor
Parameter
Number of points cal-
culated
Tolerance on base-
line frequency:
Expressed as a
fraction
Output Control
I! = Print & pl°tlprint only
plot only
Program
ROTDMP SHDDMP
X X
X X
X X
X
x (x)X X
X X
X
X
X X
X X
X X
X X
K _ X
PLTDMP
X
X
X
X
X
X
X
X
X
X
X
X
X
X
X
69
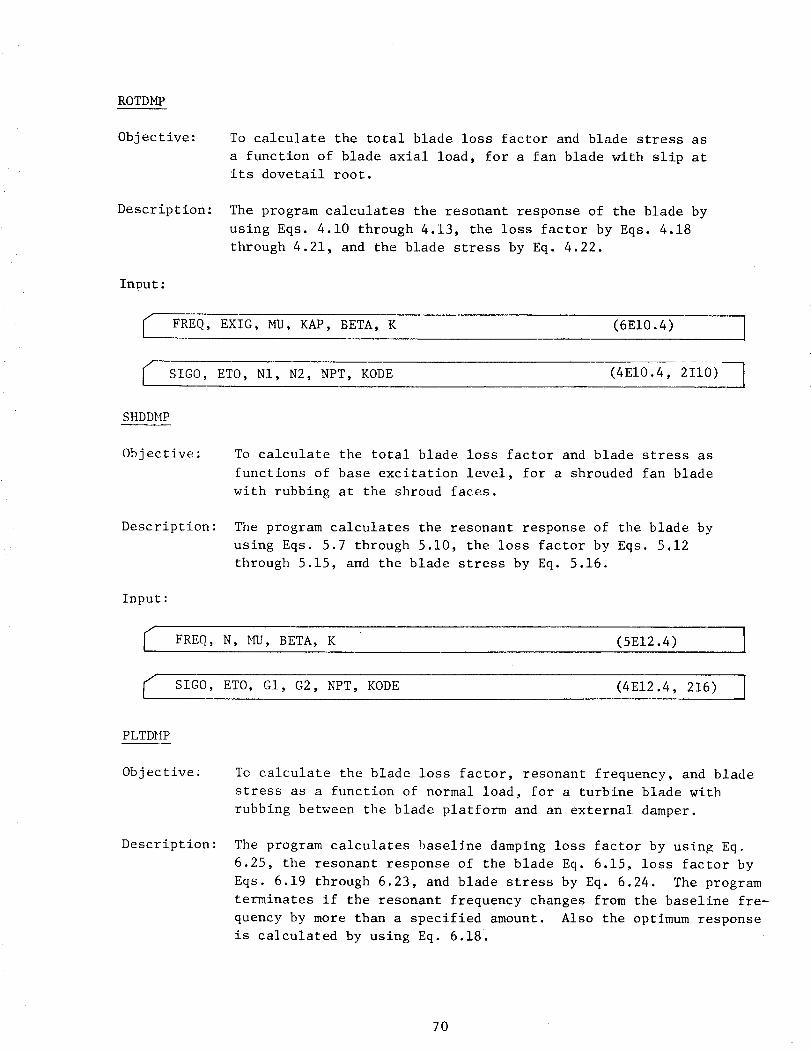
ROTDMP
Obj ec tive: To calculate the total blade loss factor and blade stress as
a function of blade axial load, for a fan blade with slip at
its dovetail root.
Description: The program calculates the resonant response of the blade by
using Eqs. 4.10 through 4.13, the loss factor by Eqs. 4.18
through 4.21, and the blade stress by Eq. 4.22.
InDut:
FREQ, EXIG, MU, KAP, BETA, K (6EI0.4)
SIGO, ETO, NI, N2, NPT, KODE (4EI0.4, 2Ii0)--_
SHDDMP
Objective: To calculate the total blade loss factor and blade stress as
functions of base excitation level, for a shrouded fan blade
with rubbing at the shroud faces.
Description: The program calculates the resonant response of the blade by
using Eqs. 5.7 through 5.10, the loss factor by Eqs. 5.12
through 5.15, a_d the blade stress by Eq. 5.16.
Input:
FREQ, N, _, BETA, K (5E12.4)
SIGO, ETO, GI, G2, NPT, KODE (4E12.4, 216)
PLTDHP
Objective :
Description:
To calculate the blade loss factor, resonant frequency, and blade
stress as a function of normal load, for a turbine blade with
rubbing between the blade platform and an external damper.
The program calculates baseline damping loss factor by using Eq.
6.25, the resonant response of the blade Eq. 6.15, loss factor by
Eqs. 6.19 through 6.23, and blade stress by Eq. 6.24. The program
terminates if the resonant frequency changes from the baseline fre-
quency by more than a specified amount. Also the optimum response
is calculated by using Eq. 6.18 _.
70

Input :
c" FREQ, EXIG, _j, KD, PHID, K (6EI0.4)
SIGM, SIGO, FTOL, NI, N2, NPT, KODE(5EI0.4, 215)
71
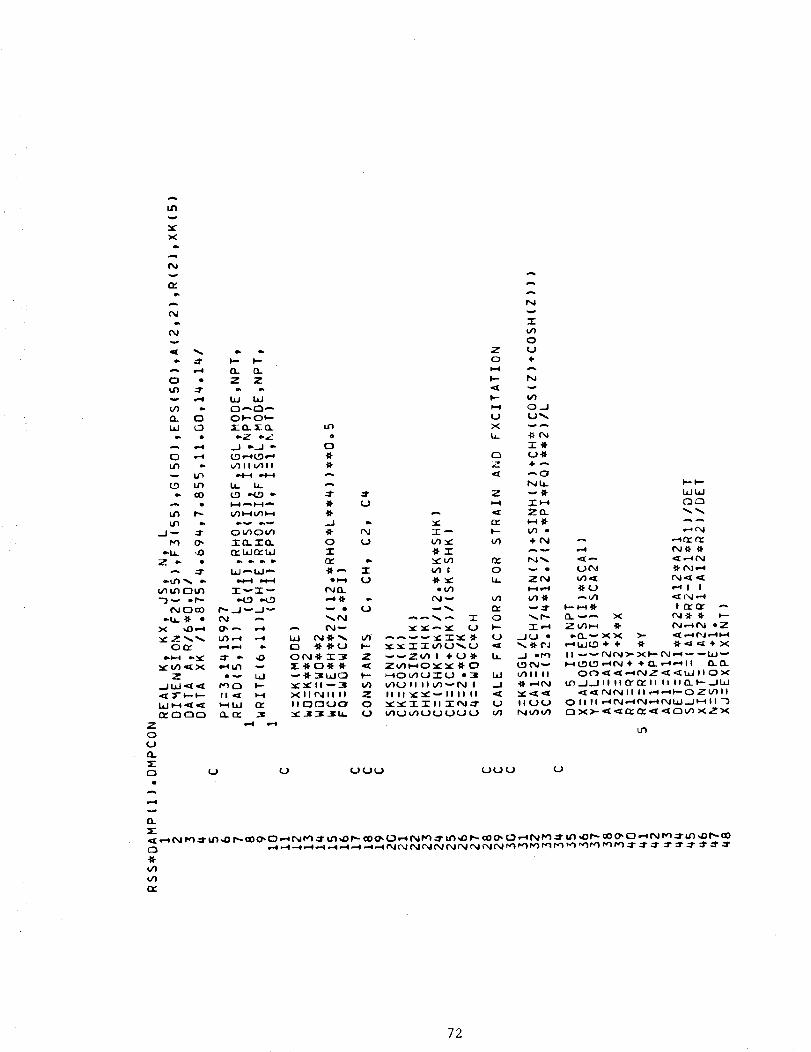
u_
X
(M
A N
(M "":3:
0 o Z Z _-- N
e. • ..;7 e._.? • LL -I_ C_
•-.4 .--I o...J ,- Q -r-I;-
I_ _. _/I II MII _I" Z "I","',
_ h h _ NI.I.
I_ 0 _ I _ "T'O. 0 Q._ V) ",_ _ ÷N
_ I_J_L_I,'-" _ ,_" 1" ¢/I I 0 _ •
I'%lC_ oO r'm _.Jw -J _ w • _,_ ---._ (_ _,:l"
•.l--i ,-_: _I" -- ,D ON-_-T3_ Z _ZVI I _(J_" LL -.I ol,,_
Z o_ m.m w# ]LmJO H _--40V%U'I'Lb oSI W t/_ll II
_l: :E J--- I--- II_l: H XIINlill Z II II _::_wll II II _{ "_" _: '_bJ l,-i ._ _ HLLI r_ I I QOU(:3_ 0 _: "_ "1" -r I I "r N --1" U IIUUr_OOO _I.rw _ _" .I _ _I tm. U V)UV}UUUUU _ N_/)_
Z "=4O
U
0 U U UUU UUU U
(L
I--l-"
Whl
...4 N_
-II-U _-'_I I
n _ X N_'_" I--
Z u9 I-4 _ N,.-4 N oZ
m..rl_ X X _ _O( ,..-_?,J .-4 I-.4
II "" _" N N _" X i--"N "i -- -- W w
I--IL9 (_9,-4N 4. ÷ t'_ .-.4 ,,.._ I I ___..
U"_,.J._J II |I _'t'_ II II I I __ l'-'-.-..ILkJ.,_ N_ II il _-4 .-_I-- O _ _C) I I
O II II ,,.4N_.4('_._INI._ =,Jl.-_ I I -_r_ X ;,,,,-,,_ ,,,_ O_ t"_ ,,m_,,,_ 0 ,_ x Z X
LPI
72
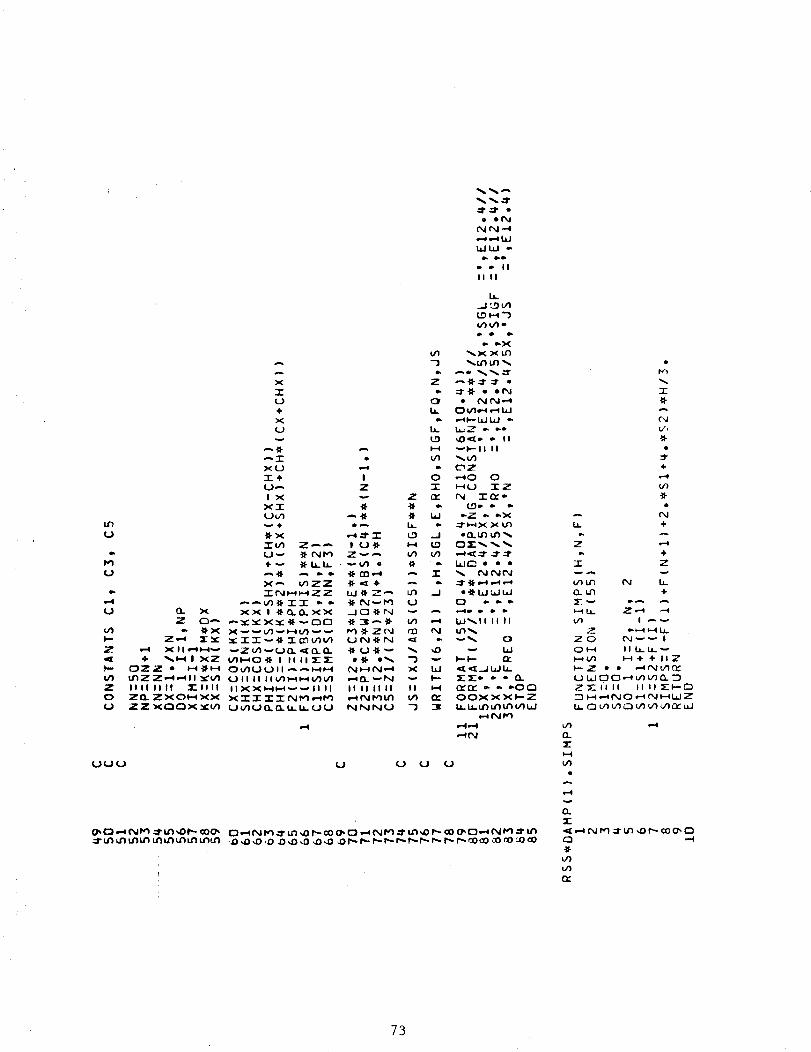
ur)
u
i.
u
e.
,.,=4u
v1I--
z
0--vl
Zo(.I
_-_- •
NN"4
•-4 e-4 W
m_ e_m_
a, e IIII II
UUU U U U U
e
I
Vi
÷
vI
_ N
Z _
-r Z
O.m ÷
Z_- It II II II _-_--E_
c_ ,-4
O.
_r
I--4
O.
r_ -4
u_
73
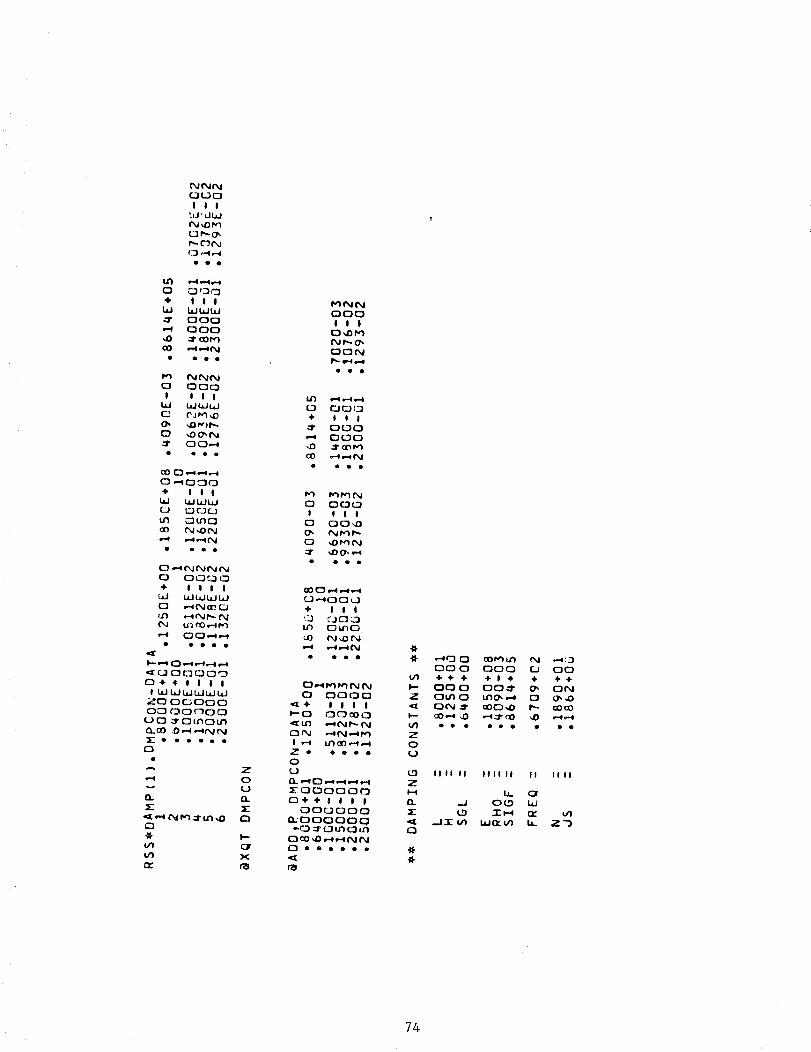
Z
0
_KZ
l.--
X
000
I I I
• • •
0 00(_
+ I I I
000
'-4 000
cO .-q..-'_N
0 000
l I I !
0 00_
0 _O m,_N
• • • •
÷ Ill0 000
0_0
• ego
0 0000
_+ IIII_0 00_0
Zo eooo
_0_
_000000
O÷+llll_0_000
_'000000
Oeeeeee
I--
Z
t--
Z
0
Z
13.
n
O0 qO 000 (._ O04"4.+ ÷ I • + 4.4-
OU_O t_l_ ,-_ _ O_D
IIII II IIIIII II IIII
74
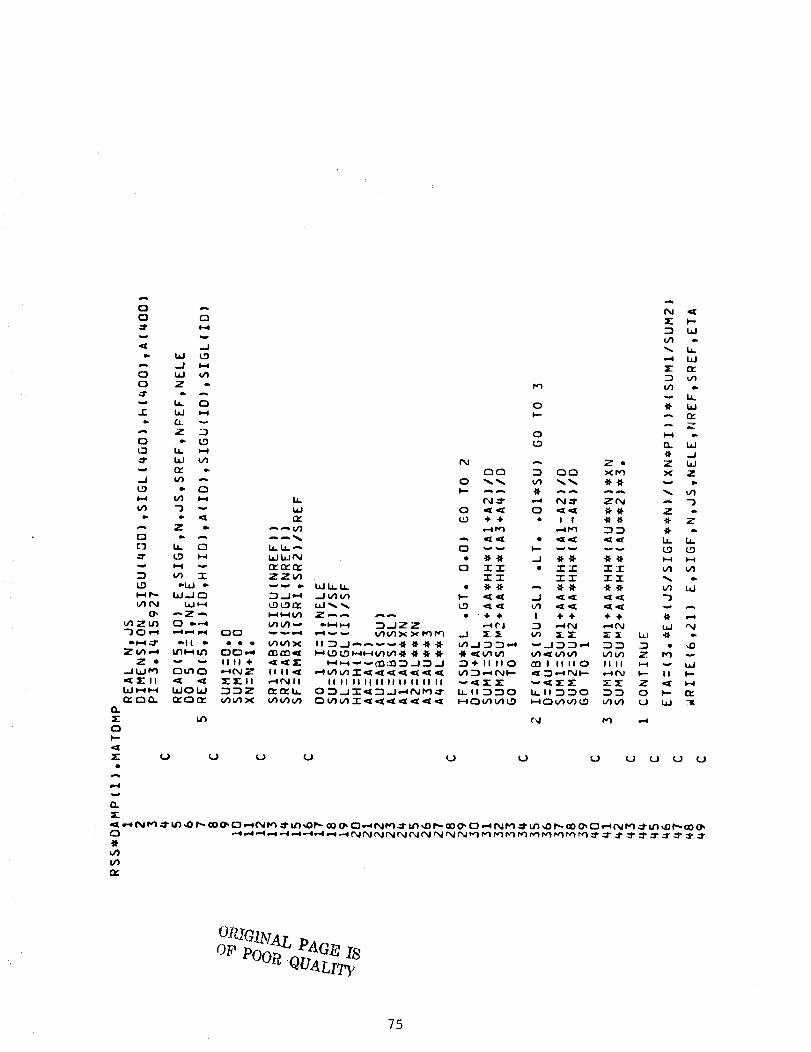
0
0
0
0
r¢.
gI..,7
...Lt_
t_
_N
Z qJ_ ,.,,e
Z •
..J _J m
_I: '_- I IW I-_ I.,.4
O.
0I--
3-
O.
ow
.J
.J _,4W
Z -.
W
•" 0
¢11 8..4 b.
-_ _ _j
l.i. 0 i, IL.=,.
LO _-_ bJ Ldi_
¢,_ "r" ZZ¢/)
I_I....l Q _ .=./,..4
•"-Z ,.',. I.-_ I-¢ I,¢)
aLP% ¢"*, .--s(_J._ II II .,_
_ _- _" |I _=_t'_ I I
I._0 bJ _Z _" (_ l.J..
IP)
blt, I.L..
II II II II II li I! II II II
0
0
_ Ze
O0 _ O0 _
• '+ @ I +÷ ÷÷
_+IIIIO _IIIIIO fill
_I1_0 _I1_0 _
ZI==1I--Z
0U
Z: I,-,-
•,=4 I_:IE 0::
_ Z
m _
Z ILl
A ")
•_" Z
•% _,.
t_ UJ
ol. ,.
l| _
"_ _tCJALl?,y
75
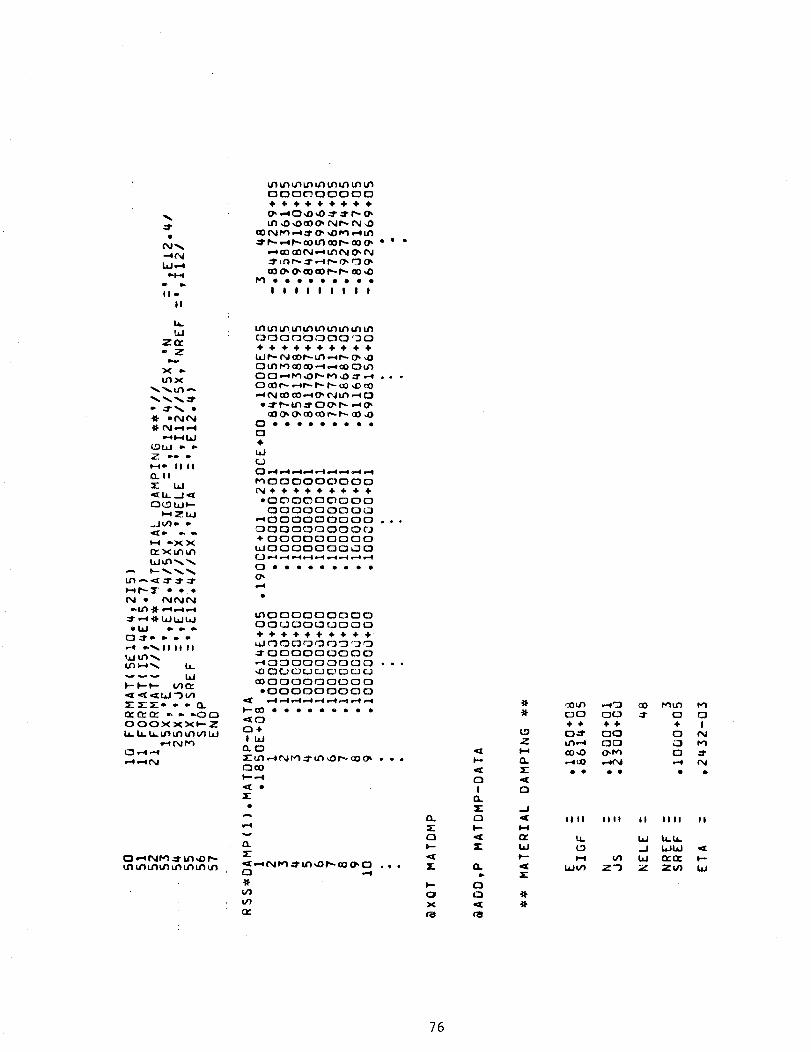
_Nw_N_N
lllllllll
Or_O O0 0 _L')O'_O
÷ ÷ ÷ .I.÷ ,I-,I.4. ÷ _.
0 tel_ oO 00 ,-e,.*oO 0 _
000 I_..-_r,-I_ p- oo go _0
o0 0_ _ o0 o0 I',,,..I"_ o0 _
4,.
O ,,_ _._ _,.__,._ ,_,__._ ,,,,-.m,_._ ,,-._1
r'_ O O (::)C3 C) O E) C) E_N÷÷41,.÷÷ ÷÷ ÷_
O0000000C_
,-_O000000C)C) . • •
_000000000
4- OC_E_O0 C){:300
6_JO0000 O0 _30
0 • • • • • i • • •
e,.,4
0000000000
÷ ÷ ÷ ÷ .I,÷ • ÷ ÷ ÷-
..TrO(:DO00 O0 00
,_:_0 _j c_ 0 r_l r_ n EJ r,j
00000000000
mOO0000000
_0
O÷
IW
nO
000
3-
n .-4
n_
O.
s-
O
I.-
3-
X
0
IO.
s-
O
O.
0
0
r_
Z
O.
sr
0
--I
W
I.-
O0 O0 _I" 0 0
4,4. ÷÷ 4. IO-_I" O0 0 N
,-mc_ ,,-oN ,-4 N
IIII
14.
H
l,,o.Jt/)
IIII
Z"_
II lilt
W llt.
Iz.J Q::n,.
ZV_
I!
e:I[
I--
W
76
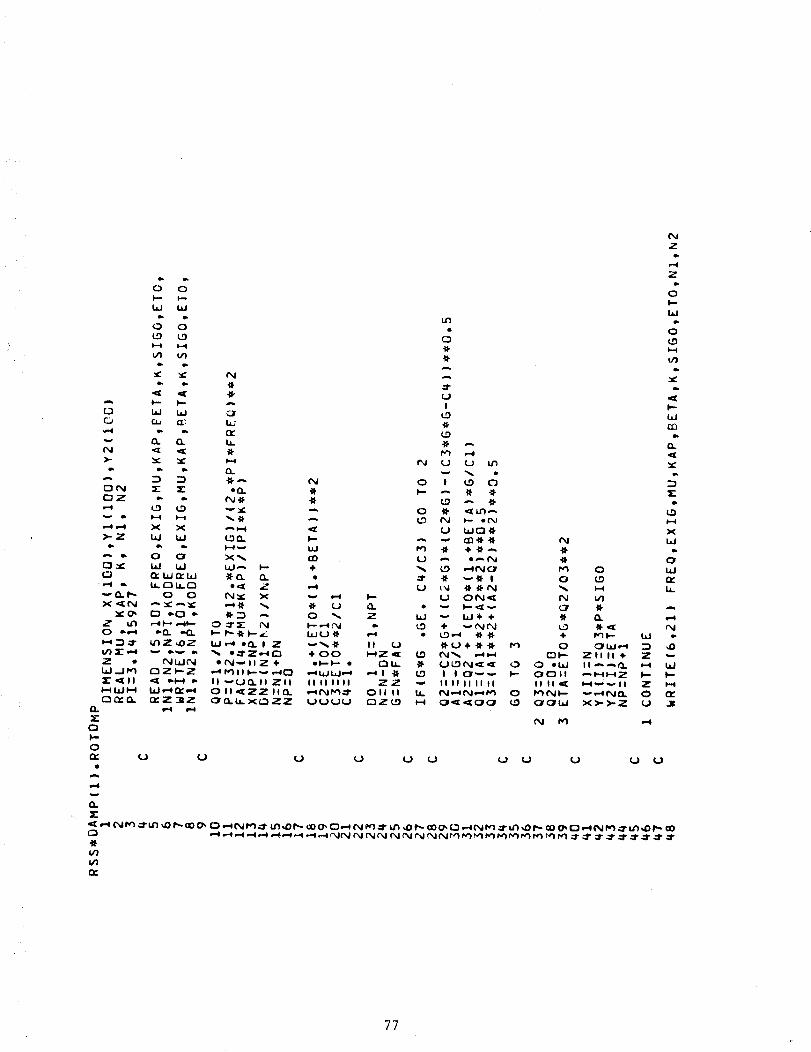
77
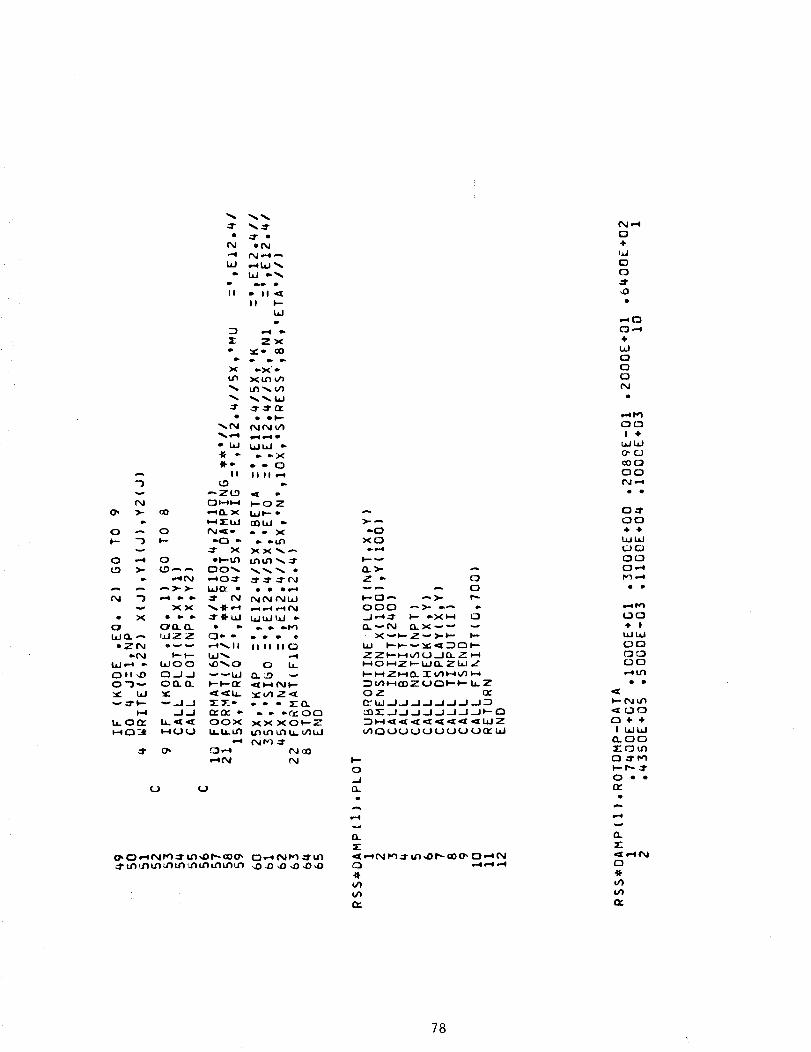
U
I,,-
0,-Ia.
e,.4
,,_ ..-_N I_')..,1- u"} .,0 r,.- _0 i_ E).-,_ N
V)
r_
N ,,.-I
04-
C3
_r
4_
o
..-,{:3
O.-,
4.
c)
c3
N
C_O
I ÷
uJl_J
0. C.3
e00
OO
N ..",• o
OC3
÷ .I.
bJ l.,J
r._cJ
_ {..'}
O,"_h,_l,,.4
÷ I
I_L,j
C) O
•-s u')
4,.•
I..-N u'_
t_ ÷ .0.
I I._.IL_J
not3
O • •
0.
,_C.-sN
u')
78
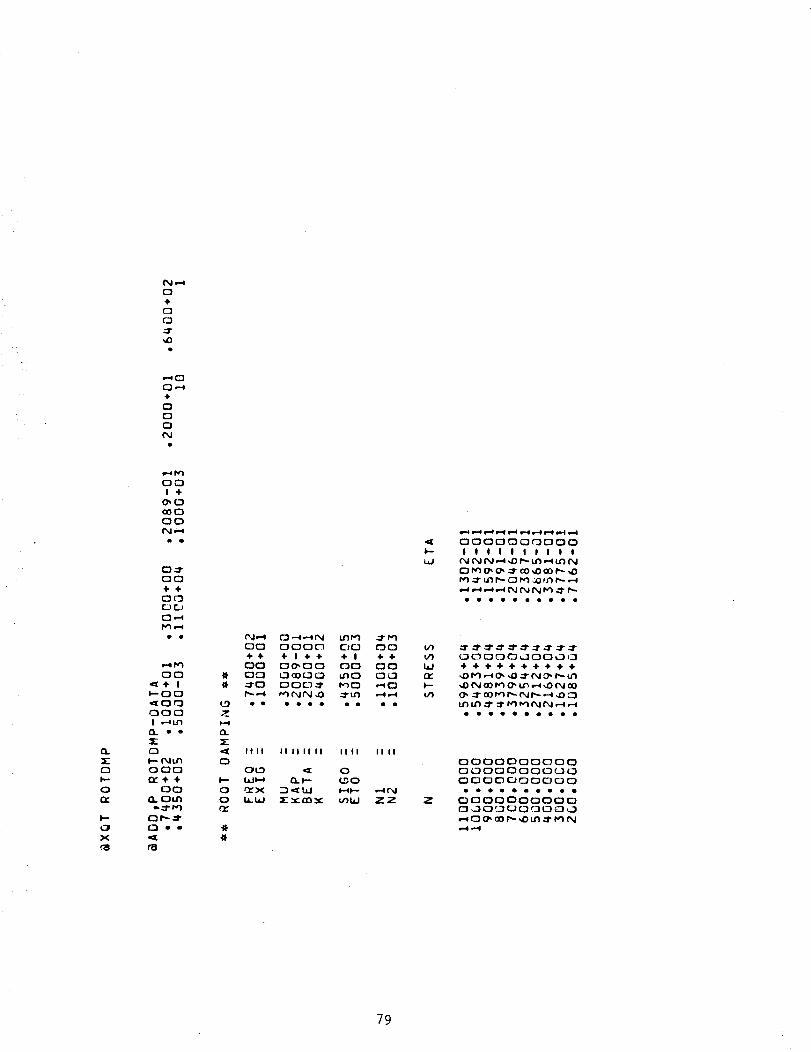
('_,Ii-@
0
÷
0
0
,.-40
O,--0
÷
0
0
0
n
0
0
rr
_.-
X
Ca
,..4_
O0
I +O_D
cOOO0_j (,.-q
O0
4. +O0CJ(._
0,4
I'.,')_-.0
O0
,c_+ I
0-'-00
',_00
000
I ,--0L_
I---(%1_
000
0(÷m
oo
noul
o • •
O0 O00t_ C)r._) t'JO
4-4. ÷ I 4. ÷ 4. I 4- 4-
O0 00_00 t_'JO O0
O0 00000 _lO 0(._
._0 00 (-_-.I" i"_0 ,..40
• • • • • • • • • •
IIII IIIIIIII IIII IIII
0
OO _ 0
_ _ _0
0 _X _ _ _
0 _ _ _ ZZ
l--
_J
t_
ILl
n-
I--
Z
0000000000
I I I I I I I I I I
ooooooo_oo
00000_000_
_+÷÷÷+÷÷_÷
0000000000
0000000000
0000000000
jooJojjJjoO00000f_O0O
79
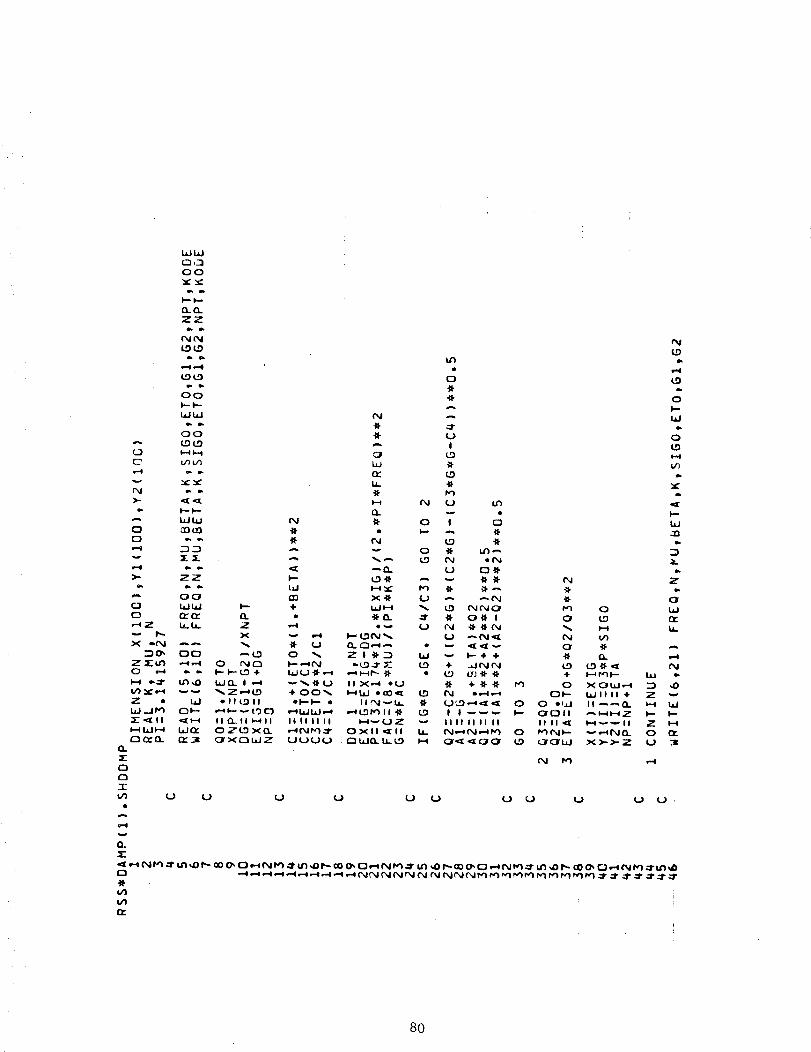
LOLO
OO
&&csO.ZZ
,i,. eh
N(_i
ih ibO0I-.- I,'--
LA/'. 'eb e.
O0"" LOLD
N ,h e.
" I-- I--i.L./l.i..I
,,=-@ o. e-
)" ::_Zo. e_ ih
"" O0
IAI LAJ
,-IZ I.A.l.A.
=DO_ O0
Z _" L¢_ ,,.-,,-¢C) ....4 I,.o.
O0.-.
_ ,,_ I I ,tit 1--4
¢"_ I_ ¢'_ n," 2tl
:5"0
0
212
O.
Q.
Z
X
O NOI--I--(..O4.
LO0_ I ,.-m
"_.Z .'-_LD
oli(911
II O. II I-lll
O ZL_ XO_
OIr X Q LO Z
LC}
0
N
,::r
LO .I_
0_
0_ IN .I_ O I O
.R (%J I._ .I_
l_ i-a_ _ -_- -,,'t._ -_
•-4 e_ C.b N @_N %
O _ Z I _ l.,J .--, t--+ +I-- .-*N --L_._I" _- {.0 + _.INNI_l¢.b _ .-, ._-_l'_ _- • _4) ¢.T_.M- -I_ +
'...-'_.,I_(,} II X,-S eU _ + _- _- I'_ O
+ OO_ I--OLi.Ie_0c_ ¢D N 0.-4.-4 CDI--
el--I-- e li_I.,L ,._ OL.'.'_-e,cl{,,:E 0 0 oIAJ
e.-mLa..IL_.e-_,'-I(..0/_ll")$ _ I I -----,-- II _O11
II II II II I-I--UZ _ II II II II II II II ,_
_',l N t'_ ..,=IP OXII ,,_ II h N,,'_ N _.-I I_ 0 r,_ N I,.-
N
O
@
O.
I.-0r,'ll..-
X O L_I.-S
WIIII+
II --_01.
_ I.--I i--i ZI,-I _ I I
"=" ,"_ N CLX)->" Z
LO
I-,I
LDe_
0I"LAJ
0LD
e.
I.--I.AJ
:32.
C)LAJn,.I,i.
...,,,,-4
NIAJ e,
ZD ,.0
Z "-*
I--_ l.I
I-- I-=
Z
0 _"
"I
,-4
80
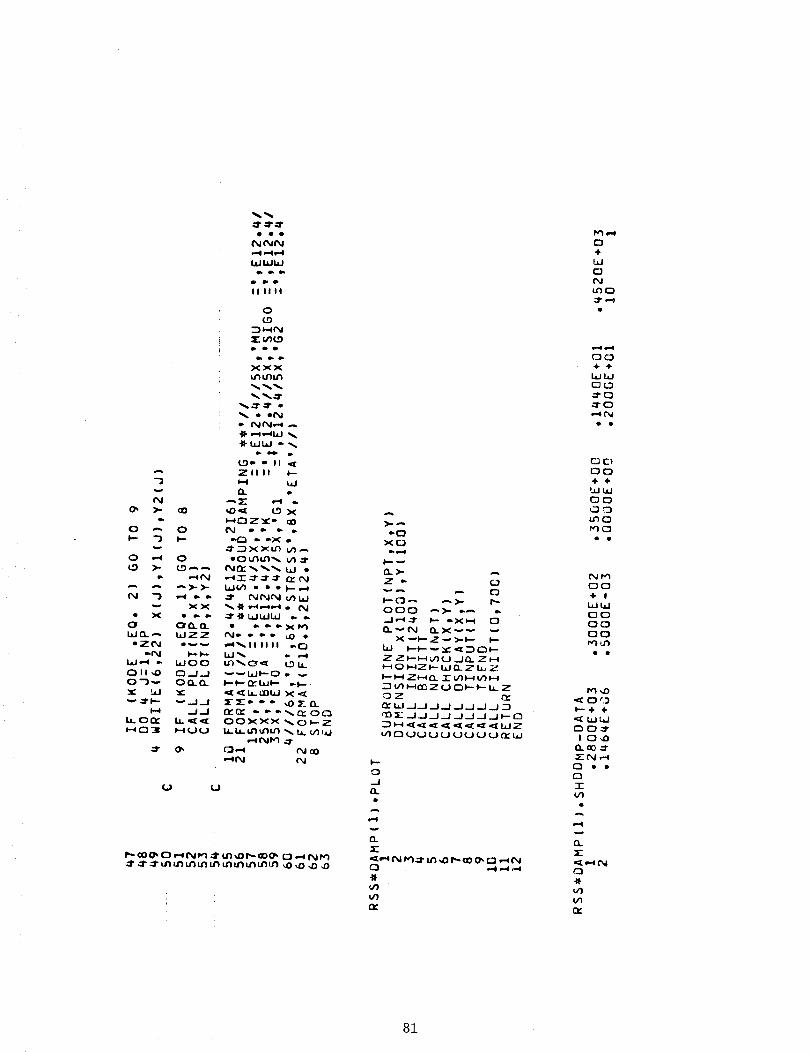
w
o.
O .-. O
0 ,-4 0
LO >- LO.--_
XX
• X • _ m,.
OCi. n
b.;CL -_ bJZZ
• Z t'y o_w
bJ ,.-m -. b-;O0
0"3--. OCuQ.
m--0 ._#j
b_on," b. ,_C,_
0--mn_ ;.-g1.3U
),.,...._,
XO
EL>'-
@'- C3 -_
OOO
_.vN
3
nx_
X wlmZ_ >'_"- I"
Z Z I'--_'_U')¢J __J_ Z H
_'-'0 I-_Z I--bJ 0_ Z I.uZ
0¢ bJ _.;_.I.J ._I _J _J _ .J _
q0_" .-J.-;_J _I _.;_ .J _J 0--n
_._%CC_(-9_..H._(._ U ¢.JU i.) n."bJ
0
..,..I
O.
O_
0
4.
N
OO÷ ÷
WW
OO
O C)OO
O0
P"l C_
Nm
_0
÷ IWti, l
OO
OO
OO
_--÷ ÷
._ hlbd
_'-N ,-.0
O • •
nr
n
sr
O
u_
Vl
0_
81
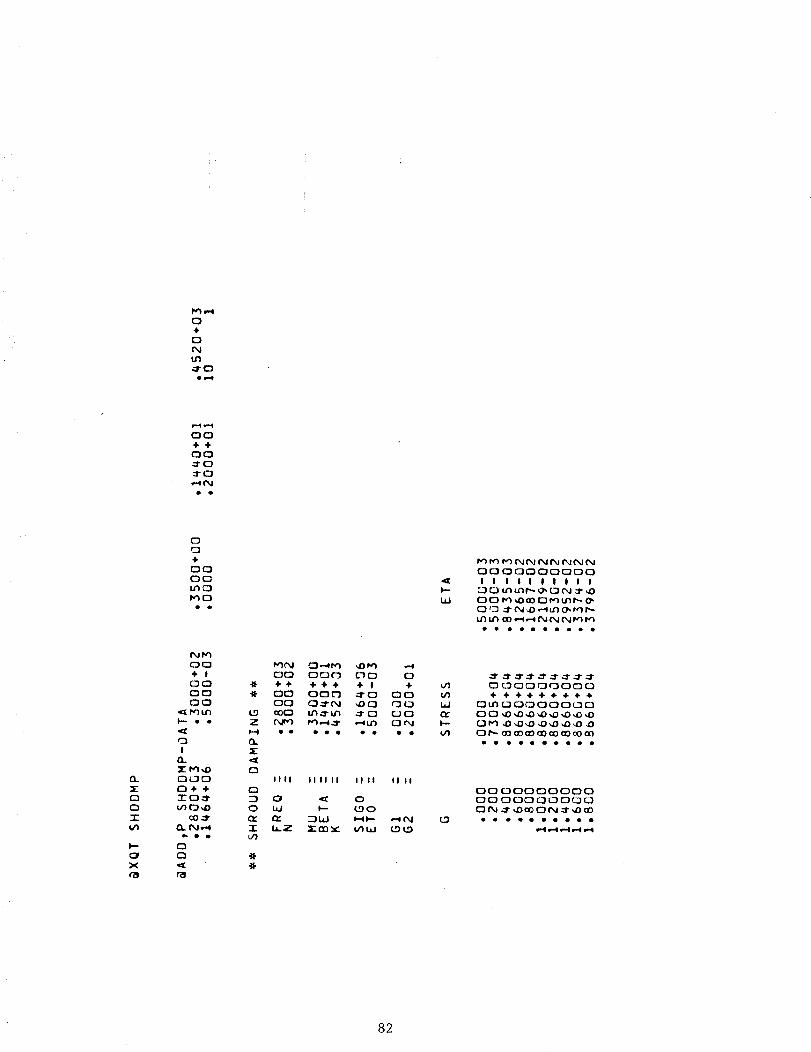
r,')e,.4
O
÷
O
N
e.-4
OO
+'4-
OO
..I"O
3"O
,..4(_J
O
÷
OO
OO .(
l--
ILl
OO OOOOOO(DO
i ! I i i J | I ! !
t.F)U') 00 ,--$,-e(_jN (_jr41r,_
• • • • • • • • • •
0L
:E
O
O
I
l--
X
N l_"%
OO
÷ IOO
OO
OO
!
Q.
OOO
O÷÷
"f"O :_r
_,n O ,4)
00..I"
n N,..4
O
Oi
_(
Z
0
Q::D(:3Q:
"l-uq
tv'Ic_l O..-$ r,_ ,.0_-) ,-4
OO OOO C-)O O
÷÷ ÷÷÷ ÷ I +
r,'_.-__ .-4U') O_ _--
• e • • 4e • • • •
IIII IIIIII IIII IIII
,e_ 0hi I'-- LDO
I,m.Z _- nn Y _/) laJ f,.D _)1_9
OOOOOOOOO÷ ÷ +÷ +÷÷÷ ÷
OU_ OOOOOOOO
O I_.-00 a0 (x__0 a0 (:000 00
• • • • • • • • • •
OOOOOOOOOO
OOOOOOOOOO
82
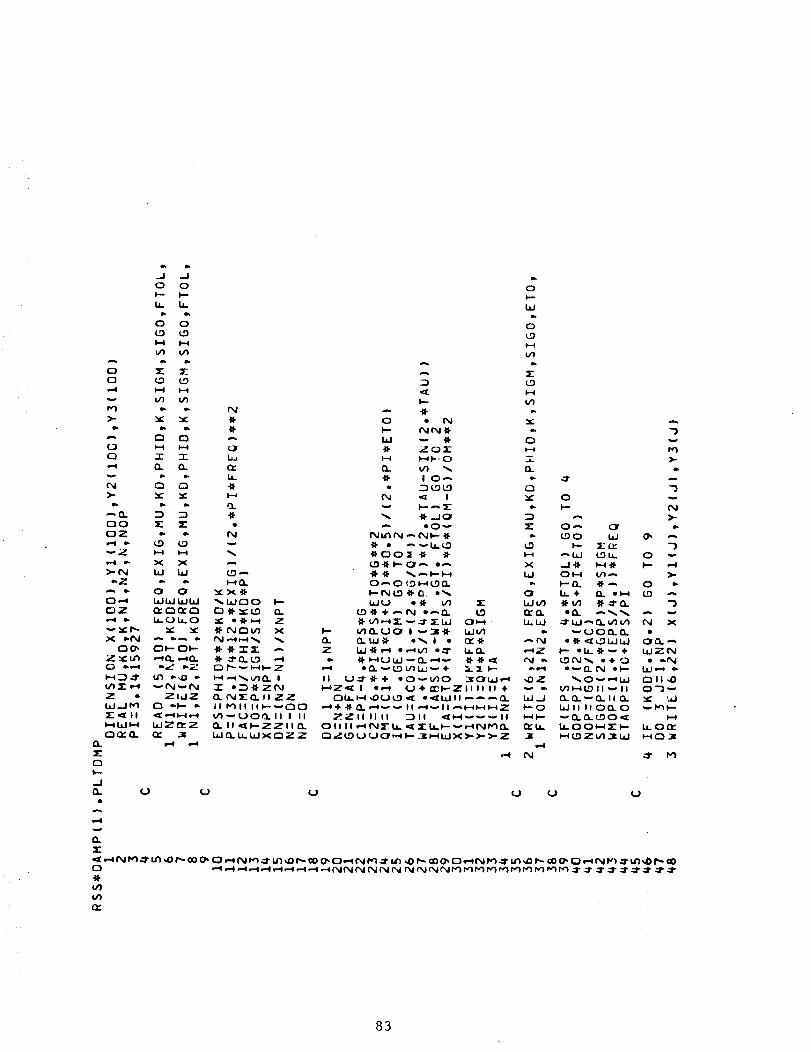
e_ 4,._J -.I
O OI-- f..-
h he= el
O O
LD (.9
I-4
U3 V_
mE _-
t.9 LD
H
_I (/3
e= eh
_e X(=. e_
Cn Q
I-4 1"4
I I
Q. Q.e. e_
C_ Q
Y
mE 3-
e_ eh
LD (.9I--4 _I
X X
taa ','
O O
L,.ILAJ_JW
_G3_Q
" CJ" O
_e ,,e
ED_" Of--
U3 _,D ==
w C_w ¢_J
ZI=JZ
G3 e.l.--
,,_*,-4I--4,..4
I.=JZ P," ZE_: -i
U (J (J _ (j
:=...o.
"3
N
)-I.
"3O "--
I-- ,-4
O ="
"3w
N X
_0.--.
','ZN
• e-(%l
ED II _0
0"3"-'
HOS=
83
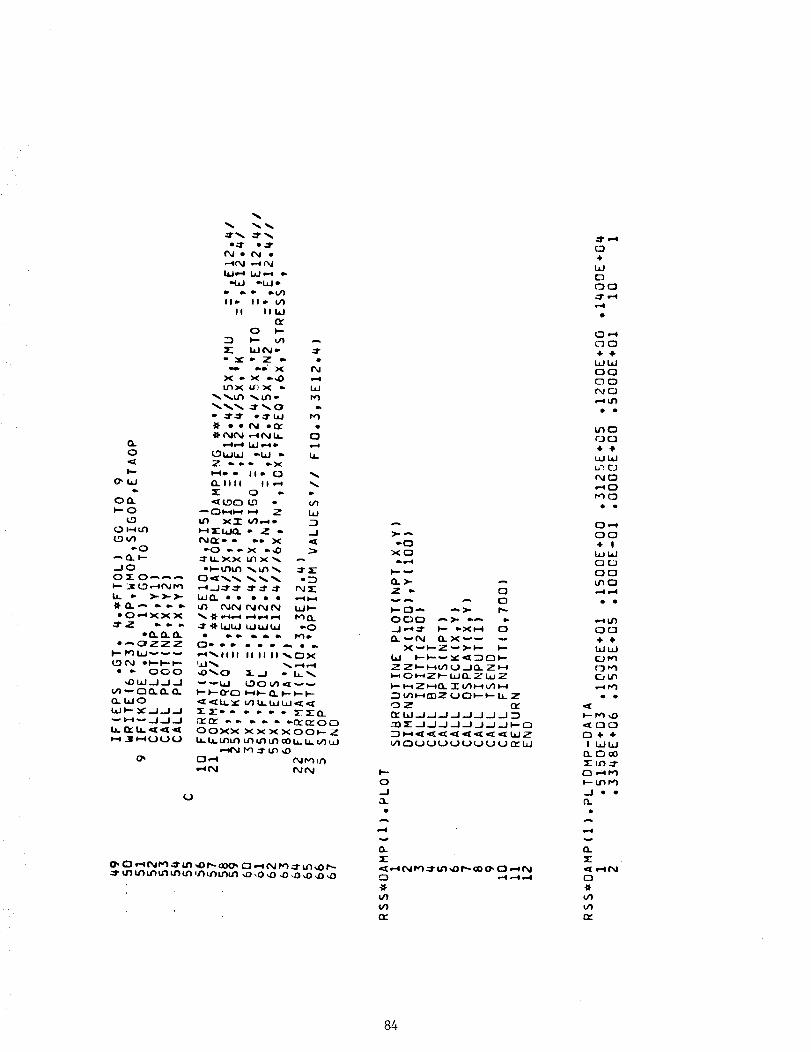
_ ,_ I.I.."_ 1.0 I,i_ LIJ b.l _I: ,_
OOXX XXXXOO$--Z
b. b_.U_u_ u'%ur) u3 oo i_.b_ t_ bJ
0,-'4 t%lr'_'Il.rl
WN NN
0
_NM_N@@OWN
04.
W0
OO
0.-4
OO
O0
NO
O0
wJ_
NO
_0
0',-4
O0
÷ !
O0
OO
o_n
• •
<_00
04.4.
@_jhJ
(3. 0 o0
O_
0
84
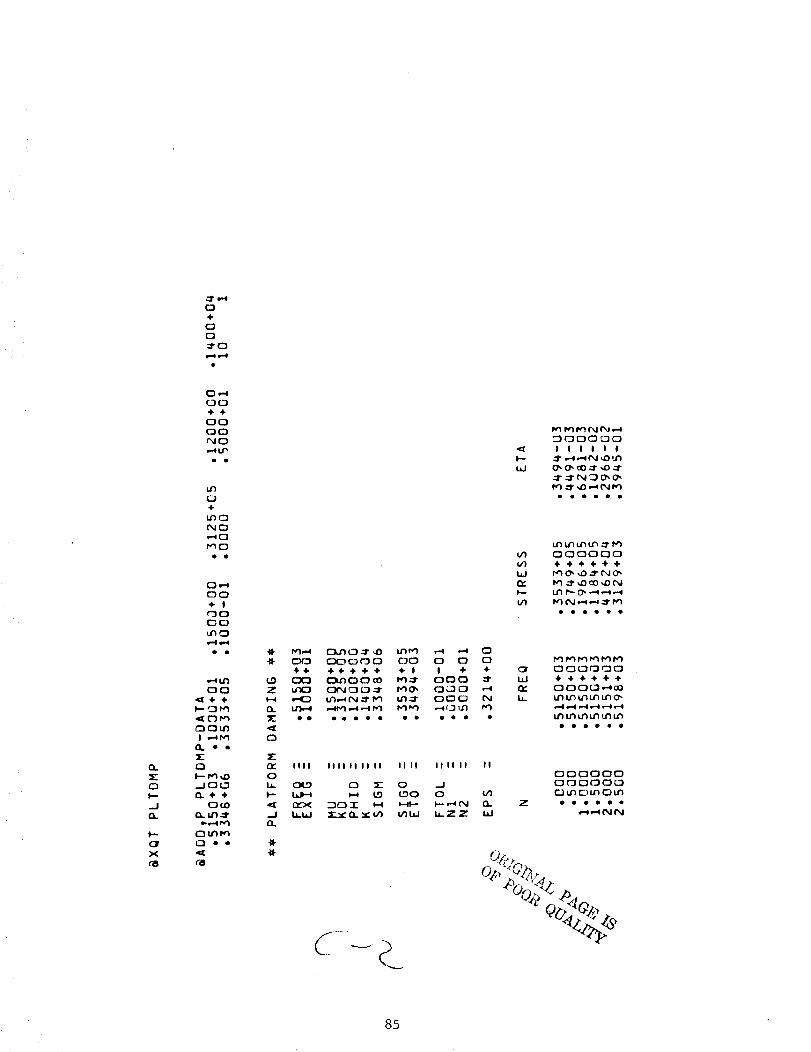
O+
OO
q,-4q,--I
0.=EOI--
10.
X
O0•41-4-
OO
OO
NO
0÷
u'_O
NO
,-'_O
f'_O
OO
÷ I
("}O
E]r..}
ur_o
,.-qu'1
OO
,{z÷÷
OOU'_
I ,..4 I_1
_E{3
..IO(.30.4.+
Oo0
Q. ILl _ro.,-4 i'_
Q • l
r_
ZH
O.T.
£3
_E0_Ob.I--
JO.
4.4. ÷÷÷ ÷ ÷ ÷ ! | ÷ ÷
(::W'_IO O _:I" I'_I(7, O_O ,-.I•.-IO l_r_,-._N ..-I"I_ U'I_ OO(:_ N
III! IIII II II II II II II II II II
O 3E: O JH L_ LO (::_ (:3 VI
I.Ll_J :E.'_" 0. Y _1 _W b_ZZ I.m.I
_OOOOO
IIIIII
Iitlii
O00000
It1111
O OOOOOO
OOOO_
Z
OOOOOO
r.Jl.r_OunC3u'l
•
85
APPENDIX B
TEST ASSEMBLIES, INSTRUMENTATION AND DATA REDUCTION
B.I Test Assemblies
The test program discussed in this report required the design and
fabrication of a number of test components and fixtures. Table B-I presents
a complete listing of the major components of the test assembly used in each
test series. Design office assembly drawings and parts lists are referenced
by number for each assembly. Fabrication engineering orders, other than
those associated with a particular parts list, are also referenced.
Whenever possible, fixtures were used for more than one test series
with minor modification. The basic test arrangement used for most of the
testing comprised a massive root block, onto which the test piece was either
clamped or welded, bolted into an aluminum plate vacuum chamber and mounted
on a slip plate so that vibration could be applied horizontally by a Ling
Dynamic Systems electrodynamic shaker. The slip plate moved on a film of
oil spread between the plate and the flat horizontal surface of a granite
block. For the material damping tests on a fan blade, the root block was
made of titanium alloy 8-1-1 with the blade welded into it (see Figs. i,
16-18). A fixture checkout was performed with this test assembly and with the
blade restrained at its tip. Frequency response sweeps were performed from 60
to i000 Hz at input acceleration levels of up to 3 g. These sweeps showed a
large axial resonance of the fixture at 550 Hz. However, by locating the in-
put control accelerometer on the root block as shown in Fig. 18, this mode
could be controlled to give a flat response at both the input location and
directly adjacent to the blade root from 60 to i000 Hz. This frequency range
was adequate for the free blade vibration tests.
For the shroud damping investigation, a shroud loading disk arrangement,
(see Fig. 41), was placed around the blade and bolted in position to lugs on
the fixture side and base plates. Since the torsion mode of the blade with
shrouds restrained was found to be at about ii00 Hz, additional fixture check-
out runs were performed up to 2000 Hz. Again, with the control accelerometer
on the outside of the root block, a flat input level could be maintained at the
blade root up to 1600 Hz.
For the root damping tests, a steel root block was inserted in place of
the titanium block and provision was made to clamp the fan blade at its dove-
tail with a variable axial load (see Figs. 31 and 32). Response frequencies
of less than 500 Hz were to be investigated and hence no further fixture checks
were required.
86
The twisted plate, uniform cantilevered beamand composite beamspecimenswere attached to the steel block individually by special clamps. Becauseofthe cantilevered design of these clamps, the input control accelerometer wasmounted directly on each clamp to ensure correctness of input level.
The fixturing for the remaining test series is discussed in the body ofthe report in the sections referenced in Table B-I.
Supporting mechanical equipment to provide the environmental conditionsand applied loads are included in the list of test equipment given in Table B-2.
B.2 Instrumentation
The electronic equipment used for excitation control and for responsesignal conditioning and recording during the test program are included inthe list of test equipment given in Table B-2.
The basic control system for all shaker excited tests is showninFig. 43. The servo level and frequency control was provided by a B & K Auto-matic Vibration Exciter Controller which was connected into the shaker andmatched power amplifier circuit. Test piece input acceleration levels weresensed by a VSSType i01 accelerometer. The accelerometer signal was condi-tioned by a charge amplifier located in the LDSVibration Meter. The output,normalized to i0 mv/g, was passed through a 50 Hz bandwidth tracking filterprovided by the SDDynamicAnalyzer. This ensured that the fundamental com-ponent of the input signal had the desired level. For inputting very low glevels (< 0.i), a Krohnhite amplifier was interposed between the trackingfilter and the controller to enable the input signal to be amplified to alevel acceptable to the controller. The filtered control signal was also amp-lified, as required, and connected into the horizontal axis of the oscillo-scope in order to obtain Lissajous figures. Logarithmic frequency sweepingwas provided by the controller with rates down to 0.0136 octave/minute. AFluke counter provided an accurate readout of the input signal period.
The basic data collection, conditioning and recording system is alsoshownin Fig. 43. Signals from the single strain gage (per channel) mountedon the test piece were conditioned by a strain gage translator. This moduleprovided the potentiometric bridge balance resistor, bridge excitation voltageand amplification of the normalized strain gage signals to the required sig-nal level for recording. By setting the correct K-factor on the input diala normalized signal was obtained equal to 12.5 mv rms per i000 psi (6.895 MPa)peak stress. The factor is given by:
87
--
0.009065 x Ex(RG+ RB + RL) 2
GFx RGx RB
where RG = Strain gage resistance, ohms
RB = Balance resistance (=500 ohms)
RL = Lead wire resistance (ohms)
E = Youngs Modulus of specimen material (GPa)
GF = Gage Factor
The calibrated strain signal level was read directly on a digital voltmeter.
This was possible since most testing required resonance dwell techniques. From
the translator, the signal was fed through a Krohnhite variable filter/amplifier
and then to a B & K level recorder operating in the peak detection logarithmic
level mode for permanent chart recording. Alternate recording systems were
provided by the oscilloscope and the log converter/X-Y plotter. Calibration
of the recorders was performed by recording a signal of known millivolt level,
as determined by the voltmeter, and using the 20 and 40 dB amplification switches
on the Krohnhite amplifier to cover the range required.
Signal conditioning for the response accelerometers was provided either
by the second channel charge amplifier on the vibration meter or by integral
electronics and a separate conditioning unit depending on the type of acceler-
ometer used. Acceleration levels were read off the vibration meter and recorded
on the level recorder.
B.3 Data Reduction
Two types of data plotting were used in the test program, namely, response
peak logarithmic level decay with time at constant frequency and response
peak logarithmic level variation with time for time varying input frequency
(logarithmic sweep about a resonance). From these presentations it was required
to determine the modal loss factor and frequency data.
Loss Factor From Decay Curves
Assuming an equivalent linear viscous damping in a system, the exponential
envelope of the peaks of a decaying response is given by
X =Xo e-_t/rn(B.1)
where x is the amplitude at time t, xo is the initial or reference amplitude,
n is the loss factor, and Tn is the period of vibration. The level recorder
gives the change in amplitude in terms of decibels referenced to x o. Denoting
the record level at time t by Lx,
88
Lx = 20 IOg_o(xlxo)
= -20rr (lOglo e) -r/tit n = -27.3_t/'r n(B.2)
and
dLx
dt - - 27'3"r//'rn (B.3)
Equation (B.3) can be rewritten as
dLx dLx d£
d-'t-= d--t'-"d"-t-= S.P = -27.3_/r n (B.4)
where S is the instantaneous slope (dB/mm) of a curve on the chart, % is the
length (mm) on the chart and P is the paper speed (mm/sec) of the recorder.
The loss factor can be calculated by using Eq. (B.4) as
: Sp rn 1 2"?..3 (B.5)
In practice, the decays were not true straight lines, i.e., n varied with
strain level and initial transients caused some distortion at the start of the
decay. An average loss factor was then determined from the slope between
amplitude levels of i and 4 dB down from the initial peak level. Thus, the
critical region for damping, i.e., the peak to half power level, was spanned.
Loss Factor From Frequency Response Plots
The frequency sweep is of the form
atf(t) = fo e
(B.6)
where fo
f(t)
is the initial or reference frequency
is the frequency at time t, and
is a constant for a given sweep rate.
89
Then
Let At be the time taken for an octave change in frequency,
f(t aEi=2= e
f(t)
From which (B.7)
a = _nZ/_
Hence, given the sweep rate (octaves/second), chart paper speed P (mm/sec) and
a reference frequency fo' the frequency during the sweep can be determinedfrom
aA£/Pf(t) = foe (B.8)
where A% is the measured length (mm) on the chart between fo and f(t).
The loss factor is given by
Af(B.9)
where Af is the half power bandwidth about the resonant frequency, fn. If
hf is swept in time At and assuming the response curve is symmetrical about
the peak, then
a At/2At = 2(f n e -fn)
= 2 fn(eaAt/2-1) (B.IO)
- fnaAt for small aAt
An estimate of loss factor is therefore given by using (B.9)
77= a At (B.ii)
Now the measured chart length A%, corresponding to the change in time At is
given by
90

A£ = p.At (B.12)
where P is the chart paper speed.
Therefore, the loss factor can be determined using equations (B.II) and(B.12) as
= _ (B.13)
In practice, the slowest sweeprate available was chosen, namely 2.2598 x 10⁻⁴octaves/sec, giving a value for e of 0.00015664. The loss factors weredetermined by measuring the distance between points 3 dB downfrom the maxi-mumresponse and taking the resonant frequency as the frequency midwaybetweenthese points.
91
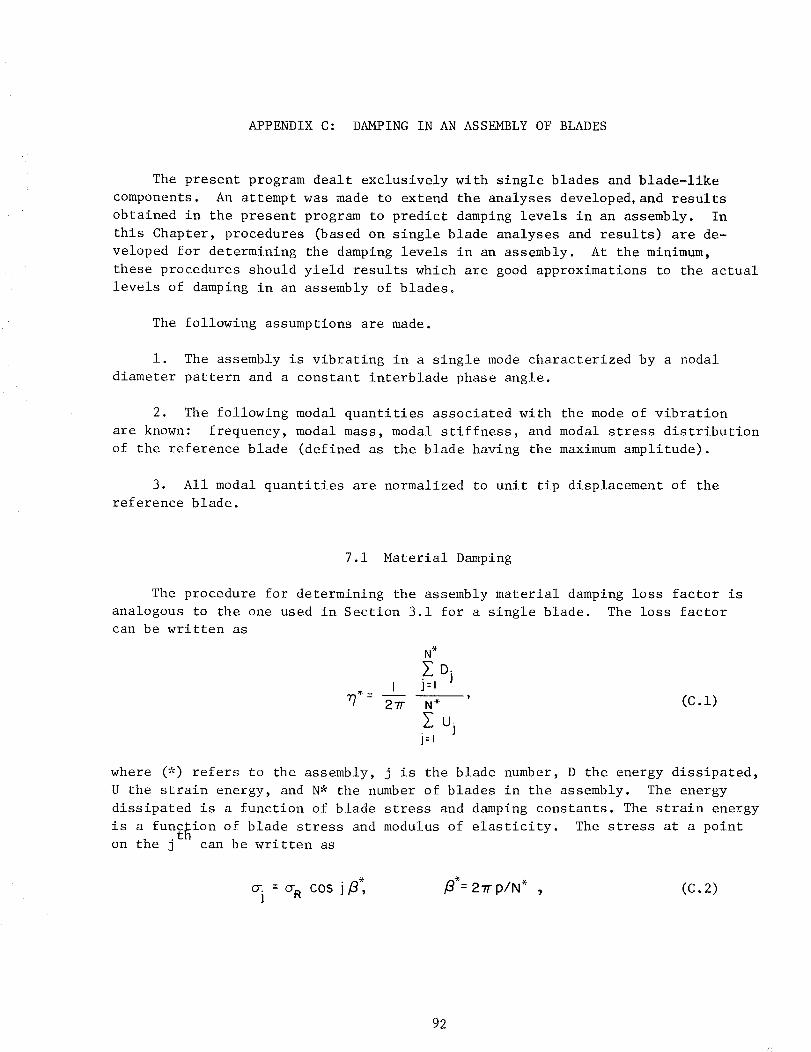
APPENDIXC: DAMPINGIN ANASSEMBLYOFBLADES
The present program dealt exclusively with single blades and blade-likecomponents. An attempt was madeto extend the analyses developed,and resultsobtained in the present program to predict dampinglevels in an assembly. Inthis Chapter, procedures (based on single blade analyses and results) are de-veloped for determining the damping levels in an assembly. At the minimum,these procedures should yield results which are good approximations to the actuallevels of damping in an assembly of blades.
The following assumptions are made.
i. The assemb&yis vibrating in a single modecharacterized by a nodaldiameter pattern and a constant interblade phase angle.
2. The following modal quantities associated with the modeof vibrationare known: frequency, modal mass, modal stiffness, and modal stress distributionof the reference blade (defined as the blade having the maximumamplitude).
3. All modal quantities are normalized to unit tip displacement of thereference blade.
7.1 Material Damping
The procedure for determining the assembly material damping loss factor isanalogous to the one used in Section 3.1 for a single blade. The loss factorcan be written as
N*2 Di
I ]=1
277 N* (C .1)
ujj=l
where (*) refers to the assembly, j is the blade number, D the energy dissipated,
U the strain energy, and N* the number of blades in the assembly. The energy
dissipated is a function of blade stress and damping constants. The strain energy
is a function of blade stress and modulus of elasticity. The stress at a pointon the j can be written as
o-. o-. cos j B';] = 2-rr p/N* , (C. 2)
92
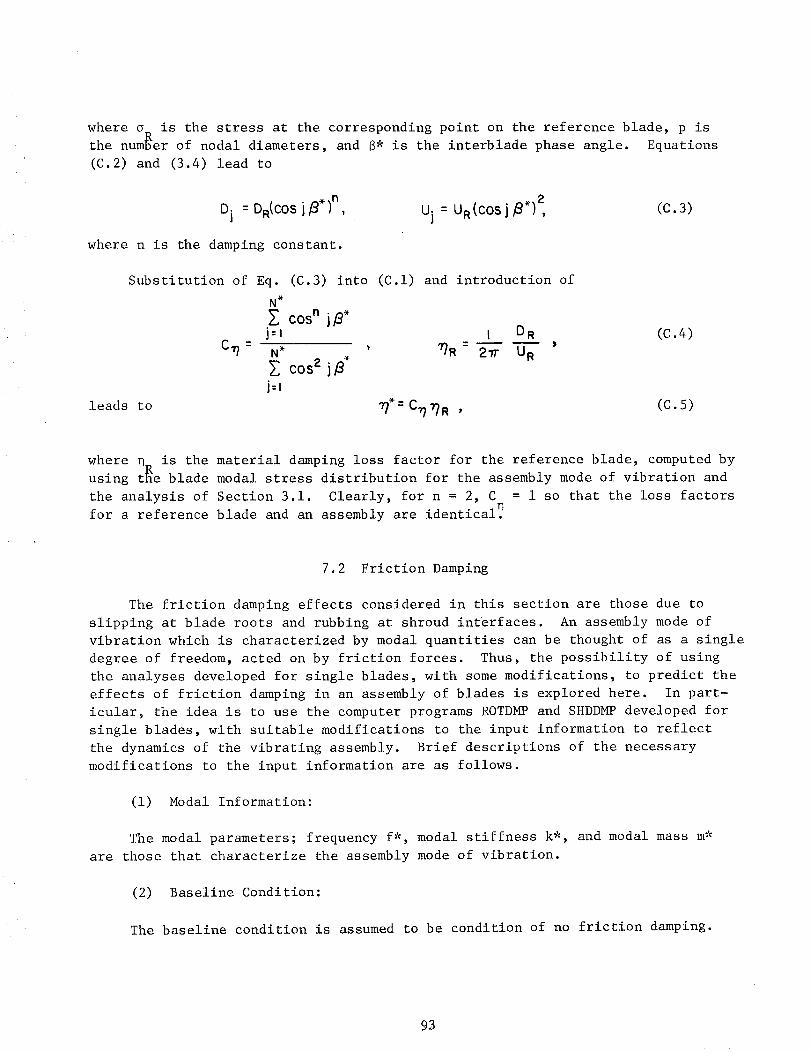
where o is the stress at the corresponding point on the reference blade, p is
the number of nodal diameters, and B* is the interblade phase angle. Equations
(C.2) and (3.4) lead to
Dj : DR(COS j_.)n Uj : UR(COS j #.)2 (C.3)
where n is the damping constant.
Substitution of Eq. (C.3) into (C.I) and introduction of
N*
Z cosn iB*j=l I DR
C,r?-- N* . _ I_R - 2Tr U R '
Z cos2j:l
(C.4)
leads to _*= C_I?R , (C.5)
where q_ is the material damping loss factor for the reference blade, computed by
using t_e blade modal stress distribution for the assembly mode of vibration and
the analysis of Section 3.1. Clearly, for n = 2, C = 1 so that the loss factors
for a reference blade and an assembly are identical_
7.2 Friction Damping
The friction damping effects considered in this section are those due to
slipping at blade roots and rubbing at shroud interfaces. An assembly mode of
vibration which is characterized by modal quantities can be thought of as a single
degree of freedom, acted on by friction forces. Thus, the possibility of using
the analyses developed for single blades, with some modifications, to predict the
effects of friction damping in an assembly of blades is explored here. In part-
icular, the idea is to use the computer programs ROTDMP and SHDDMP developed for
single blades, with suitable modifications to the input information to reflect
the dynamics of the vibrating assembly. Brief descriptions of the necessary
modifications to the input information are as follows.
(i) Modal Information:
The modal parameters; frequency f*, modal stiffness k*, and modal mass m*
are those that characterize the assembly mode of vibration.
(2) Baseline Condition:
The baseline condition is assumed to be condition of no friction damping.
93
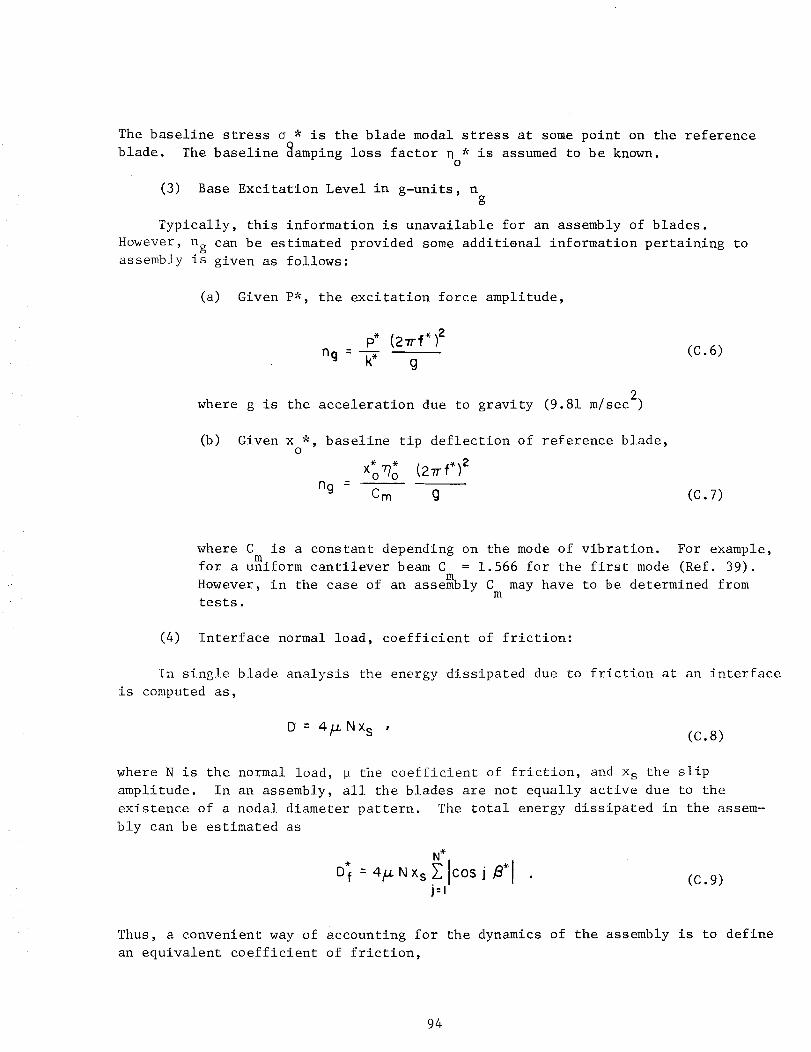
The baseline stress _ * is the blade modal stress at somepoint on the referenceblade. The baseline _amping loss factor q * is assumed to be known.
o
(3) Base Excitation Level in g-units, ng
Typically, this information is unavailable for an assembly of blades.
However, ng can be estimated provided some additional information pertaining to
assembly is given as follows:
(a) Given P*, the excitation force amplitude,
(c.6)
where g is the acceleration due to gravity (9.81 m/sec 2)
(b) Given x *, baseline tip deflection of reference blade,o
%% (2-,rf*)2ng Crn g (C. 7)
where C is a constant depending on the mode of vibration. For example,m
for a uniform cantilever beam C = 1.566 for the first mode (Ref. 39).
However, in the case of an assembly C may have to be determined fromm
tests.
(4) Interface normal load, coefficient of friction:
In single blade analysis the energy dissipated due to friction at an interface
is computed as,
D = 4/J. Nx s ,(c.8)
where N is the normal load, p the coefficient of friction, and x s the slip
amplitude. In an assembly, all the blades are not equally active due to the
existence of a nodal diameter pattern. The total energy dissipated in the assem-
bly can be estimated as
. N*
J:l(c.9)
Thus, a convenient way of accounting for the dynamics of the assembly is to define
an equivalent coefficient of friction,
94
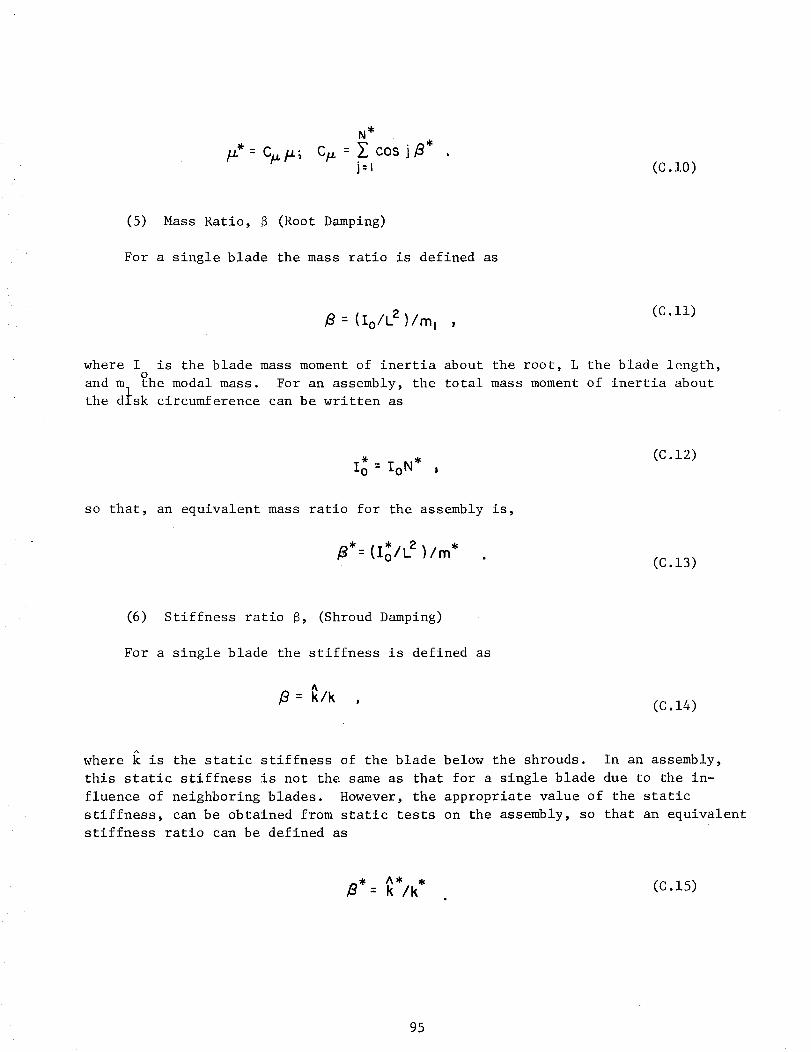
N*
'Zcosj *j=l (c.lo)
(5) Mass Ratio, 6 (Root Damping)
For a single blade the mass ratio is defined as
B = (loll2)/m, ,(c.ii)
where I is the blade mass moment of inertia about the root, L the blade length,
and m _he modal mass. For an assembly, the total mass moment of inertia about
the disk circumference can be written as
Io = IoN*(C.12)
so that, an equivalent mass ratio for the assembly is,
,8": (Io/L 2 )/m* .(C.i3)
(6) Stiffness ratio 6, (Shroud Damping)
For a single blade the stiffness is defined as
,(C.i4)
where k is the static stiffness of the blade below the shrouds. In an assembly,
this static stiffness is not the same as that for a single blade due to the in-
fluence of neighboring blades. However, the appropriate value of the static
stiffness, can be obtained from static tests on the assembly, so that an equivalent
stiffness ratio can be defined as
= k /k (c.15)
95
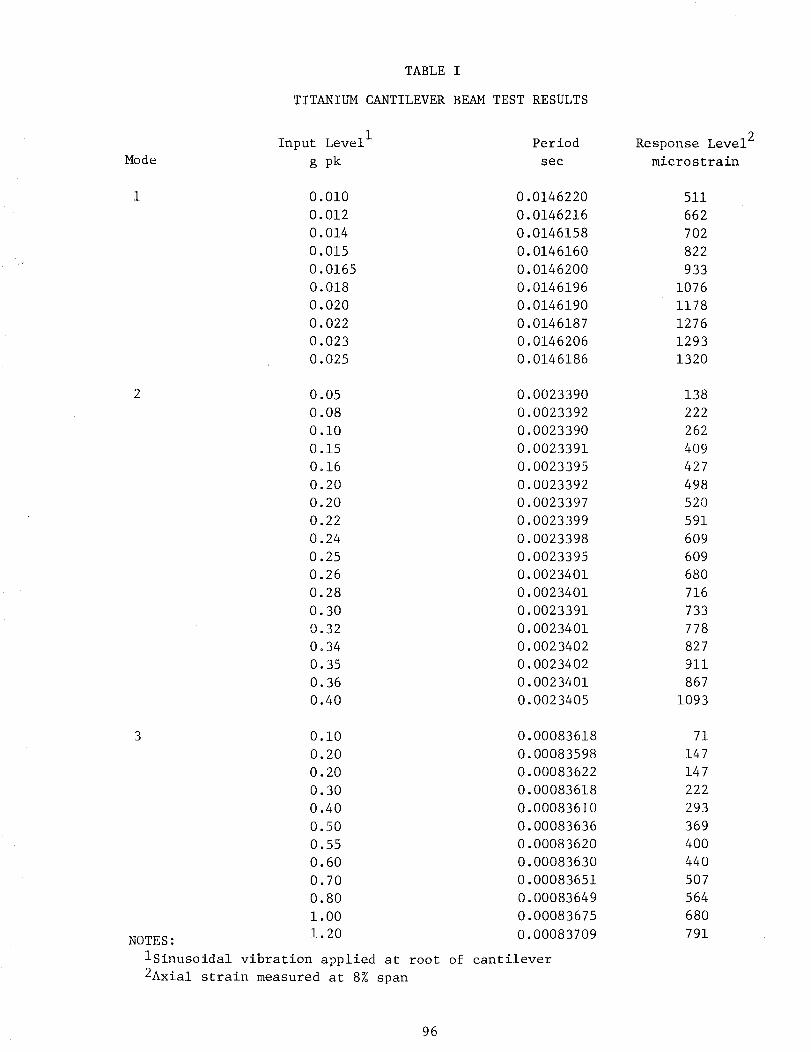
Mode
1
TABLE I
TITANIUM CANTILEVER BEAM TEST RESULTS
Input Level I Period
g pk sec
0.010 0.0146220
0.012 0.0146216
0.014 0.0146158
0.015 0.0146160
0.0165 0.0146200
0.018 0.0146196
0.020 0.0146190
0.022 0.0146187
0.023 0.0146206
0.025 0.0146186
Response Level 2
microstrain
511
662
702
822
933
1076
1178
1276
1293
1320
0.05 0.0023390 138
0.08 0.0023392 222
0.i0 0.0023390 262
0.15 0.0023391 409
0.16 0.0023395 427
0.20 0.0023392 498
0.20 0.0023397 520
0.22 0.0023399 591
0.24 0.0023398 609
0.25 0.0023395 609
0.26 0.0023401 680
0.28 0.0023401 716
0.30 0.0023391 733
0.32 0.0023401 778
0.34 0.0023402 827
0.35 0.0023402 911
0.36 0.0023401 867
0.40 0.0023405 1093
0.00083618
0.00083598
0.00083622
0.00083618
0.00083610
0.00083636
0.00083620
0.00083630
0.00083651
0.00083649
0.00083675
0.00083709
cantileverof
3 0.i0
0.20
0.20
0.30
0.40
0.50
0.55
0.60
0.70
0.80
1.00
I..20NOTES:
iSinusoidal vibration applied at root
2Axial strain measured at 8% span
71
147
147
222
293
369
400
440
507
564
680
791
96
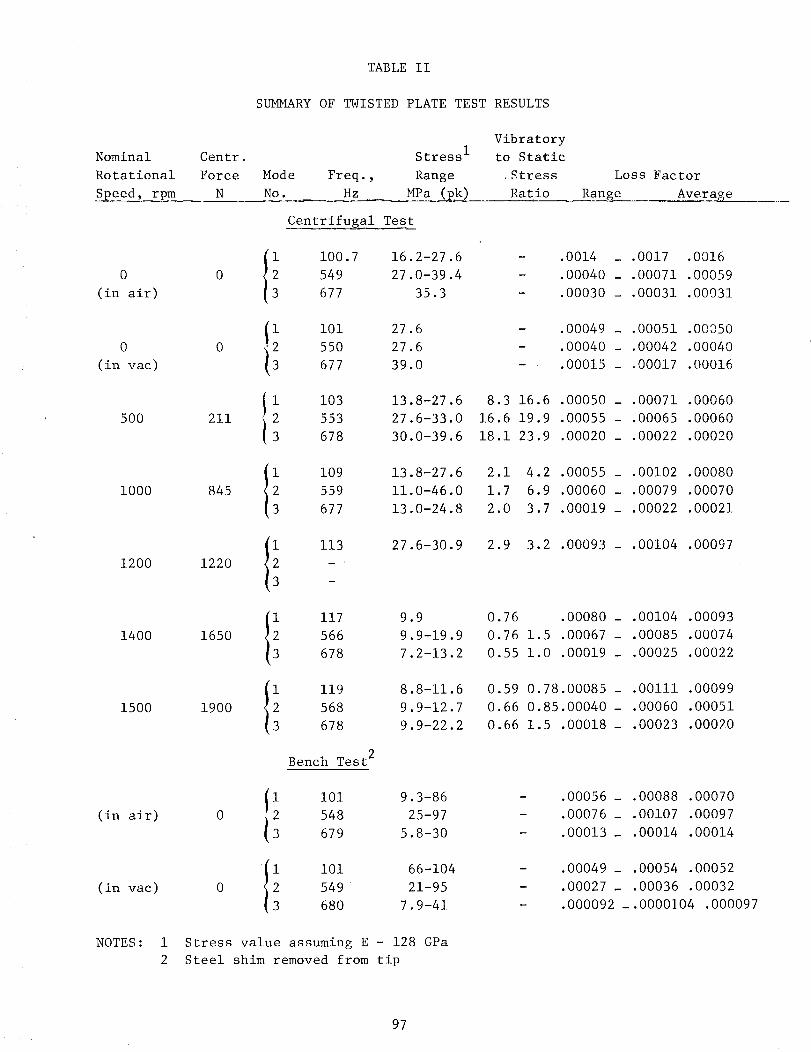
TABLEII
SUMMARYOFTWISTEDPLATETESTRESULTS
NominalRotationalSpeed, rpm
Centr.
Force
N
Vibratory
Stress I to Static
Mode Freq., Range Stress
No. Hz MPa (Pk) Ratio
0
(in air)
0
(in vac)
500
i000
1200
1400
1500
(in air)
(in vac)
NOTES:
Centrifugal Test
0I! 100.7
549
677
16.2-27.6
27.0-39.4
35.3
0i i01
i23 550677
27.6
27.6
39.0
211i 1032 553
3 678
13.8-27.6
27.6-33.0
30.0-39.6
845I! 109
559
677
13.8-27.6
11.0-46.0
13.0-24.8
1220li 113
27.6-30.9
1650
1900
i 117 9.9
566 9.9-19.9
678 7.2-13.2
i 119 8.8-11.62 568 9.9-12.7
3 678 9.9-22.2
Bench Test 2
I I01 9.3-862 548 25-97
3 679 5.8-30
Ii i01 66-1042 549 21-95
3 680 7.9-41
1 Stress value assuming E - 128 GPa
2 Steel shim removed from tip
Loss Factor
Range Average
.0014 _ .0017 .0016
.00040 _ .00071 .00059
.00030 _ .00031 .00031
.00049 - .00051 .00_50
.00040 - .00042 .00040
.00015 _ .00017 .00016
8.3 16.6 .00050 _ .00071 .00060
16.6 19.9 .00055 - .00065 .00060
18.1 23.9 .00020 _ .00022 .00020
2.1 4.2 .00055 _ .00102 .00080
1.7 6.9 .00060 - .00079 .00070
2.0 3.7 .00019 - .00022 .00021
2.9 3.2 .00093 - .00104 .00097
0.76 .00080 _ .00104 .00093
0.76 1.5 .00067 - .00085 .00074
0.55 1.0 .00019 - .00025 .00022
0.59 0.78.00085 - .00111 .00099
0.66 0.85.00040 - .00060 .00051
0.66 1.5 .00018 - .00023 .00020
.00056 - .00088 .00070
.00076 _ .00107 .00097
.00013 _ .00014 .00014
.00049 _ .00054 .00052
.00027 _ .00036 .00032
.000092 _.0000104 .000097
97
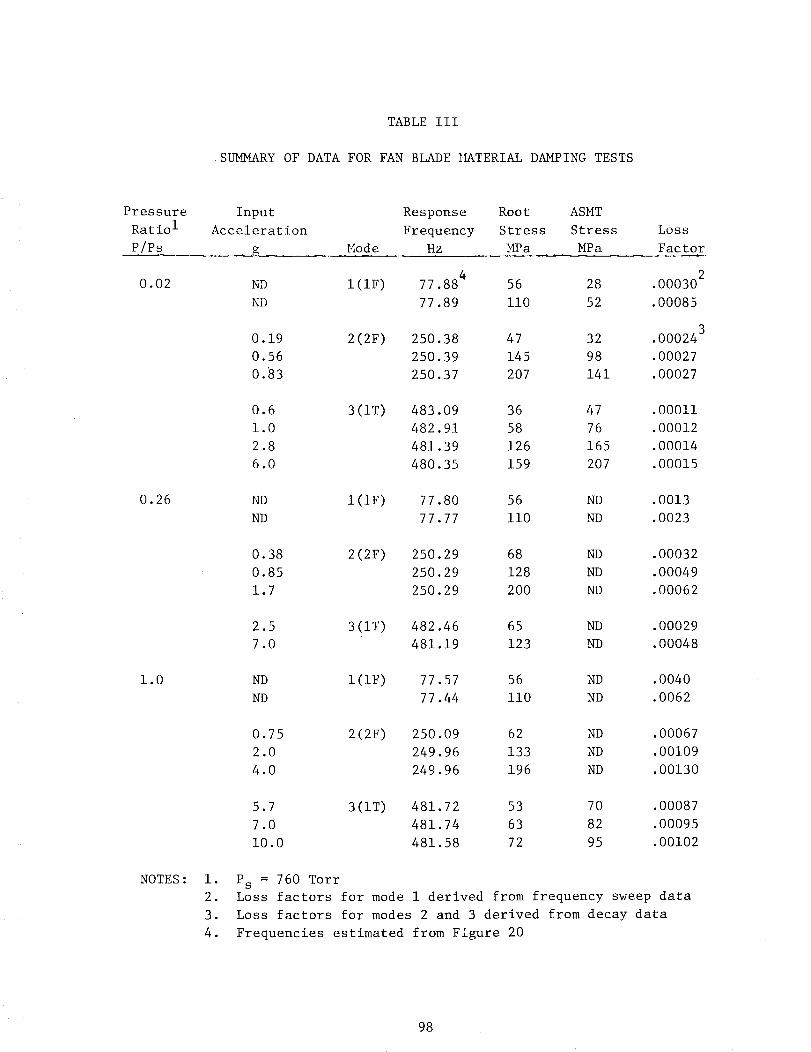
TABLEIII
SUMMARYOFDATAFORFANBLADE_TERIAL DAMPINGTESTS
PressureRatio 1P/Ps
Input Response Root ASMTAcceleration Frequency Stress Stress Loss
g Mode Hz MPa MPa Factor
0.02
0.26
1.0
NOTES:
ND 1(1F)ND
0.19
0.56
0.83
2(2F)
77.884 56 28 .000302
77.89 ii0 52 .00085
250.38 47 32 .000243
250.39 145 98 .00027
250.37 207 141 .00027
0.6 3(IT) 483.09 36 47 .00011
1.0 482.91 58 76 .00012
2.8 481.39 126 165 .00014
6.0 480.35 159 207 .00015
ND 1(IF) 77.80 56 ND .0013
ND 77.77 ii0 ND .0023
0.38 2(2F) 250.29 68 ND .00032
0.85 250.29 128 ND .00049
1.7 250.29 200 ND .00062
2.5 3(IT) 482.46 65 ND .00029
7.0 481.19 123 ND .00048
ND 1(IF) 77.57 56 ND .0040
ND 77.44 ii0 ND .0062
0.75 2(2F) 250.09 62 ND .00067
2.0 249.96 133 ND .00109
4.0 249.96 196 ND .00130
5.7 3(IT) 481.72 53 70 .00087
7.0 481.74 63 82 .00095
I0.0 481.58 72 95 .00102
i. Ps = 760 Torr
2. Loss factors for mode 1 derived from frequency sweep data
3. Loss factors for modes 2 and 3 derived from decay data
4. Frequencies estimated from Figure 20
98
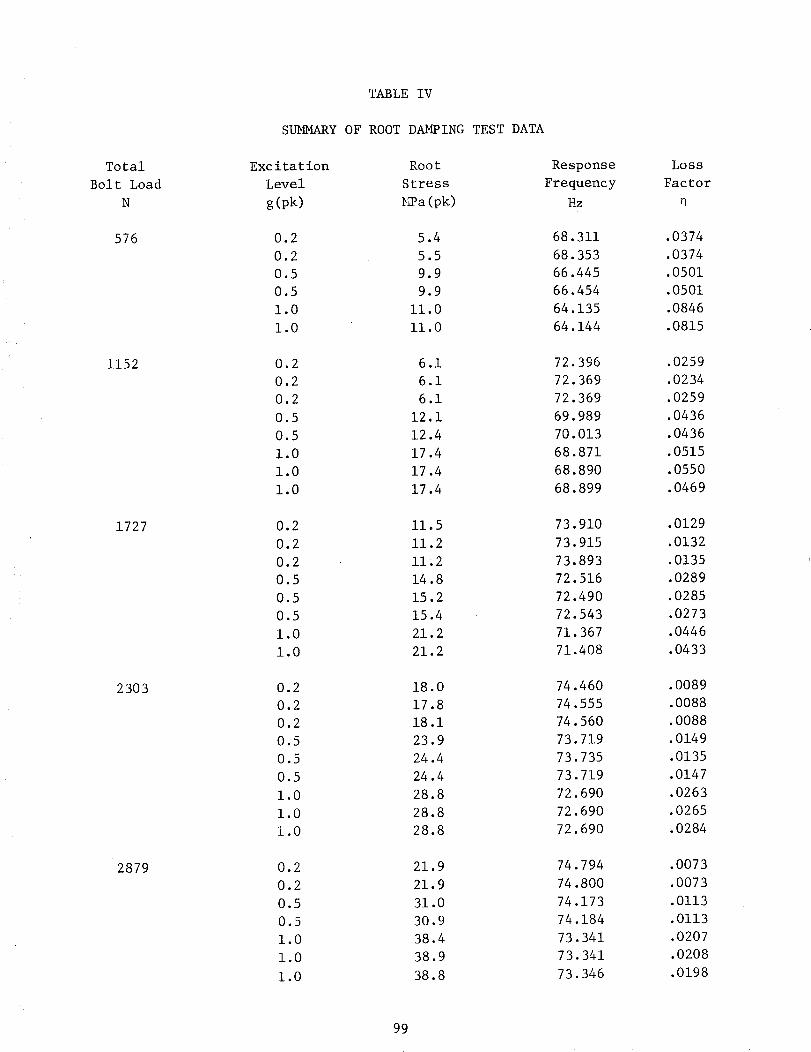
TotalBolt Load
N
576
1152
1727
2303
2879
SU_ARY
ExcitationLevelg(pk)
0.20.20.50.51.01.0
0.20.20.20.50.51.01.01.0
0.20.20.20.50.50.51.01.0
0.20.20.20.50.50.51.01.01.0
0.20.20.50.51.01.01.0
TABLEIV
OFROOTDAMPING
RootStress_ma(pk)
5.45.59.99.9
ii.0ii.0
6.16.16.1
12.112.417.417.417.4
11.511.211.214.815.215.421.221.2
18.017.818.123.924.424.428.828.828.8
21.921.931.030.938.438.938.8
TESTDATA
ResponseFrequency
Hz
68.31168.35366.44566.45464.13564.144
72.39672.36972.36969.98970.01368.87168.89068.899
73.91073.91573.89372.51672.49072.54371.36771.408
74.46074.55574.56073.71973.73573.71972.69072.69072.690
74.79474.80074.17374.18473.34173.34173.346
LossFactor
.0374
.0374
.0501.0501.0846.0815
.0259
.0234
.0259
.0436
.0436
.0515
.0550.0469
.0129
.0132
.0135
.0289
.0285
.0273
.0446
.0433
.0089.0088.0088.0149.0135.0147.0263.0265.0284
.0073
.0073
.0113
.0113.0207.0208.0198
99
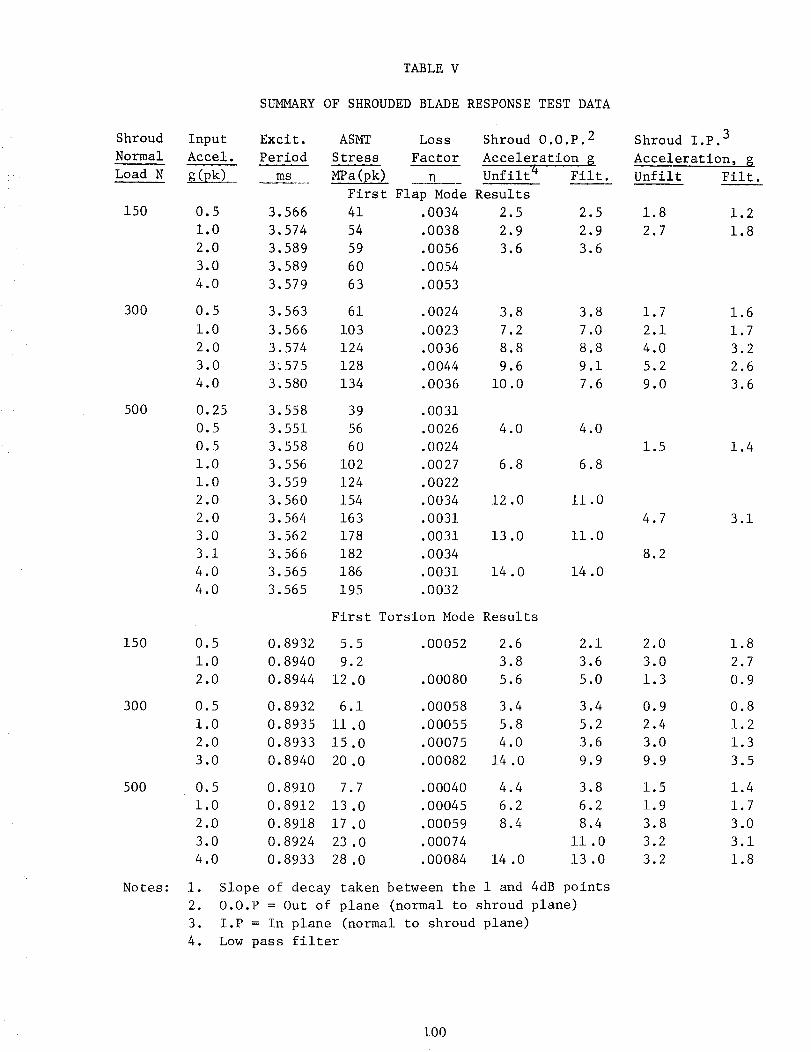
ShroudNormal
Load N
150
300
5OO
150
300
500
Notes:
TABLE V
SUMMARY OF SHROUDED BLADE RESPONSE TEST DATA
Input
Accel.
0.5
1.0
2.0
3.0
4.0
0.5
1.0
2.0
3.0
4.0
0.25
0.5
0.5
1.0
1.0
2.0
2.0
3.0
3.1
4.0
4.0
0.5
1.0
2.0
0.5
1.0
2.0
3.0
0.5
1.0
2.0
3.0
4.0
i. Slope
2. O.O.P
3.
4.
Excit.
Period
ASMT Loss
Stress Factor
ms MPa(pk) n Unfilt 4 Filt.
First Flap Mode Results
Shroud O.O.P. 2 Shroud I.P. 3
Acceleration g Acceleration, g
Unfilt Filt.
3.566 41 .0034 2.5 2.5
3.574 54 .0038 2.9 2.9
3.589 59 .0056 3.6 3.6
3.589 60 .0054
3.579 63 .0053
3.563 61 .0024 3.8 3.8
3.566 103 .0023 7.2 7.0
3.574 124 .0036 8.8 8.8
3_575 128 .0044 9.6 9.1
3.580 134 .0036 i0.0 7.6
3.558 39 .0031
3.551 56 .0026 4.0 4.0
3.558 60 .0024
3.556 102 .0027 6.8 6.8
3.559 124 .0022
3.560 154 .0034 12.0 ii.0
3.564 163 .0031
3.562 178 .0031 13.0 ii.0
3.566 182 .0034
3.565 186 .0031 14.0 14.0
3.565 195 .0032
First Torsion Mode Results
0.8932 5.5 .00052 2.6 2.1
0.8940 9.2 3.8 3.6
0.8944 12.0 .00080 5.6 5.0
0.8932 6.1 .00058 3.4 3.4
0.8935 ii.0 .00055 5.8 5.2
0.8933 15.0 .00075 4.0 3.6
0.8940 20 .0 .00082 14.0 9.9
0.8910 7.7 .00040 4.4 3.8
0.8912 13.0 .00045 6.2 6.2
0.8918 17.0 .00059 8.4 8.4
0.8924 23.0 .00074 ii.0
0.8933 28.0 .00084 14.0 13.0
of decay taken between the 1 and 4dB points
= Out of plane (normal to shroud plane)
I.P = In plane (normal to shroud plane)
Low pass filter
1.8 1.2
2.7 1.8
1.7 1.6
2.1 1.7
4.0 3.2
5.2 2.6
9.0 3.6
1.5 1.4
4.7 3.1
8.2
2.0 1.8
3.0 2.7
1.3 0.9
0.9 0.8
2.4 1.2
3.0 1.3
9.9 3.5
1.5 1.4
1.9 1.7
3.8 3.0
3.2 3.1
3.2 1.8
I00
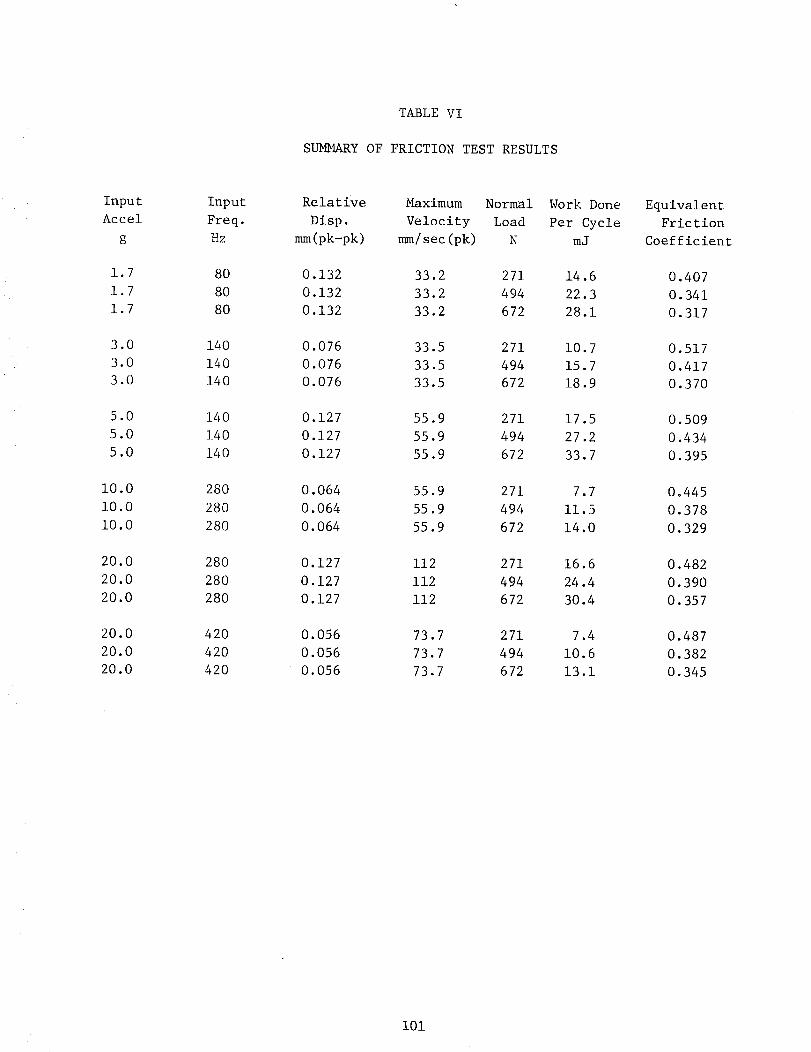
TABLEVI
SUMMARYOFFRICTIONTESTRESULTS
InputAccel
g
1.71.71.7
3.03.03.0
5.05.05.0
i0.0i0.0i0.0
20.020.020.0
20.020.020.0
InputFreq.Hz
80
80
80
140
140
140
140
140
140
280
280
280
280
280
280
420
420
420
Relative Maximum Normal Work Done
Disp. Velocity Load Per Cycle
mm(pk-pk) mm/sec(pk) N mJ
0.132 33.2 271 14.6
0.132 33.2 494 22.3
0.132 33.2 672 28.1
0.076 33.5 271 10.7
0.076 33.5 494 15.7
0.076 33.5 672 18.9
0.127 55.9 271 17.5
0.127 55.9 494 27.2
0.127 55.9 672 33.7
0.064 55.9 271 7.7
0.064 55.9 494 11.5
0.064 55.9 672 14.0
0.127 112 271 16.6
0.127 112 494 24.4
0.127 112 672 30.4
0.056 73.7 271 7.4
0.056 73.7 494 10.6
0.056 73.7 672 13.1
Equivalent
Friction
Coefficient
0.407
0. 341
0.317
0.517
0.417
0.370
0.509
0.434
0.395
0.445
0.378
0.329
0.482
0.390
0. 357
0.487
0.382
0.345
i01
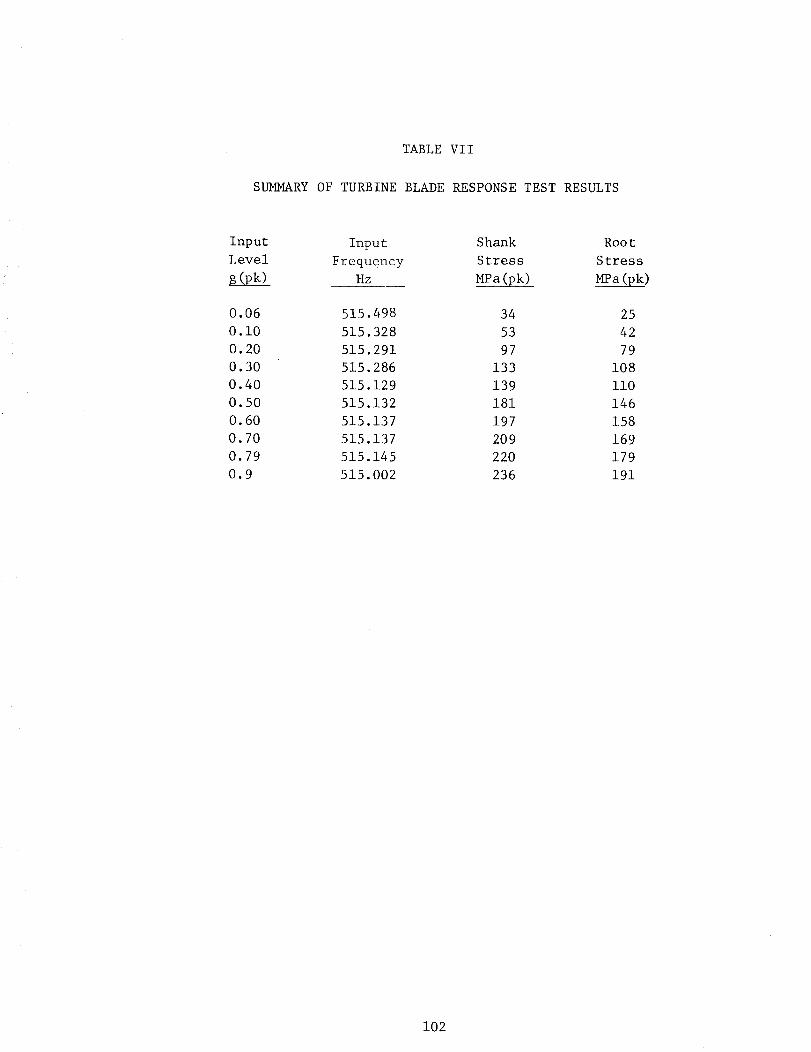
TABLEVII
SUMMARYOFTURBINEBLADERESPONSETESTRESULTS
Input Input Shank RootLevel Frequency Stress Stressg(pk) Hz MPa (pk) MPa (pk)
0.06
0.i0
0.20
0.30
0.40
0.50
O. 60
0.70
0.79
0.9
515.498 34 25
515.328 53 42
515.291 97 79
515.286 133 108
515.129 139 ii0
515.132 181 146
515.137 197 158
515.137 209 169
515.145 220 179
515.002 236 191
102
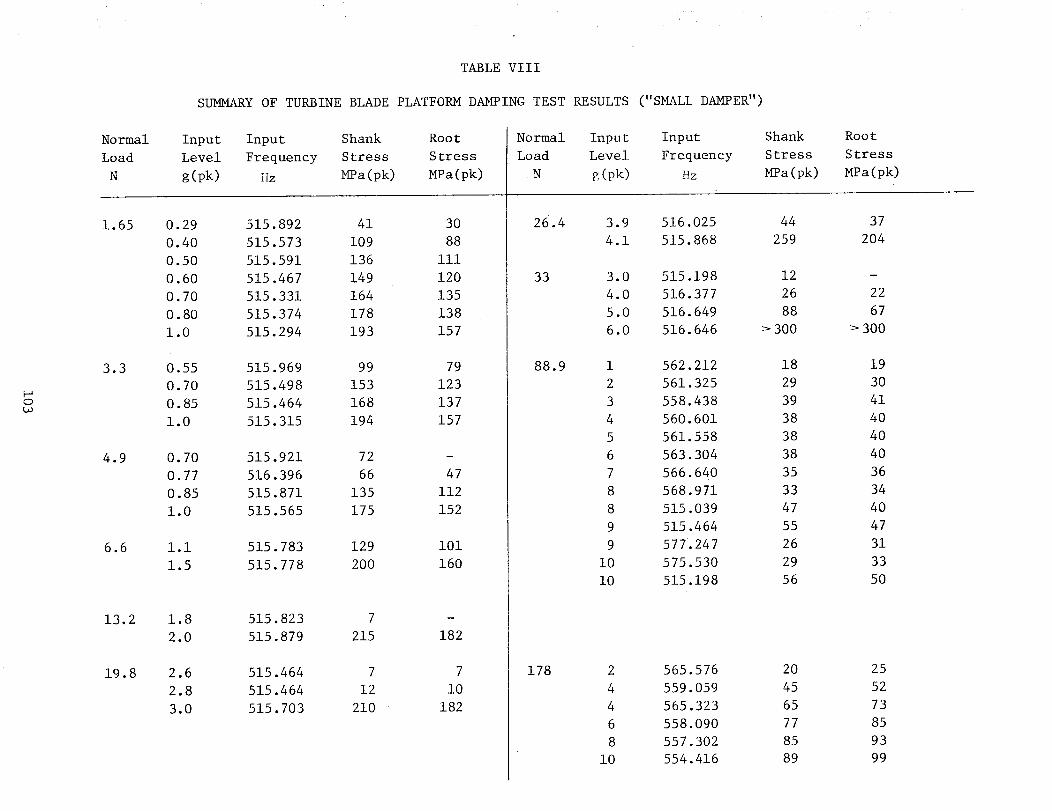
OLo
TABLE VIII
SUMMARY OF TURBINE BLADE PLATFORM DAMPING TEST RESULTS ("SMALL DAMPER")
Normal Input Input Shank Root
Load Level Frequency Stress Stress
N g (pk) ilz MPa (pk) MPa (pk)
1.65
3.3
4.9
6.6
13.2
19.8
0.29 515.892 41 30
0.40 515.573 109 88
0.50 515.591 136 iii
0.60 515.467 149 120
0.70 515.331 164 135
0.80 515.374 178 138
1.0 515.294 193 157
0.55 515.969 99 79
0.70 515.498 153 123
0.85 515.464 168 137
1.0 515.315 194 157
0.70 515.921 72 -
0.77 516.396 66 47
0.85 515.871 135 i12
1.0 515.565 175 152
i.i 515.783 129 i01
1.5 515.778 200 160
1.8 515.823 7 -
2.0 515.879 215 182
2.6 515.464 7 7
2.8 515.464 12 i0
3.0 515.703 210 182
Normal Input Input
Load Level Frequency
N _ (pk) Hz
26.4 3.9 516.025
4.1 515.868
33
88.9
3.0 515.198
4.0 516.377
5.0 516.649
6.0 516.646
Shank
Stress
MPa (pk)
44
259
12
26
88
> 300
1 562.212 18
2 561.325 29
3 558.438 39
4 560.601 38
5 561.558 38
6 563.304 38
7 566.640 35
8 568.971 33
8
9
9
i0
i0
515.039
515.464
577.247
575.530
515.198
47
55
26
29
56
178 2
4
4
6
8
i0
565.576
559.059
565.323
558.090
557.302
554.416
20
45
65
77
85
89
Root
Stress
MPa(pk)
37
204
22
67
> 300
19
30
41
40
40
40
36
34
40
47
31
33
5O
25
52
73
85
93
99
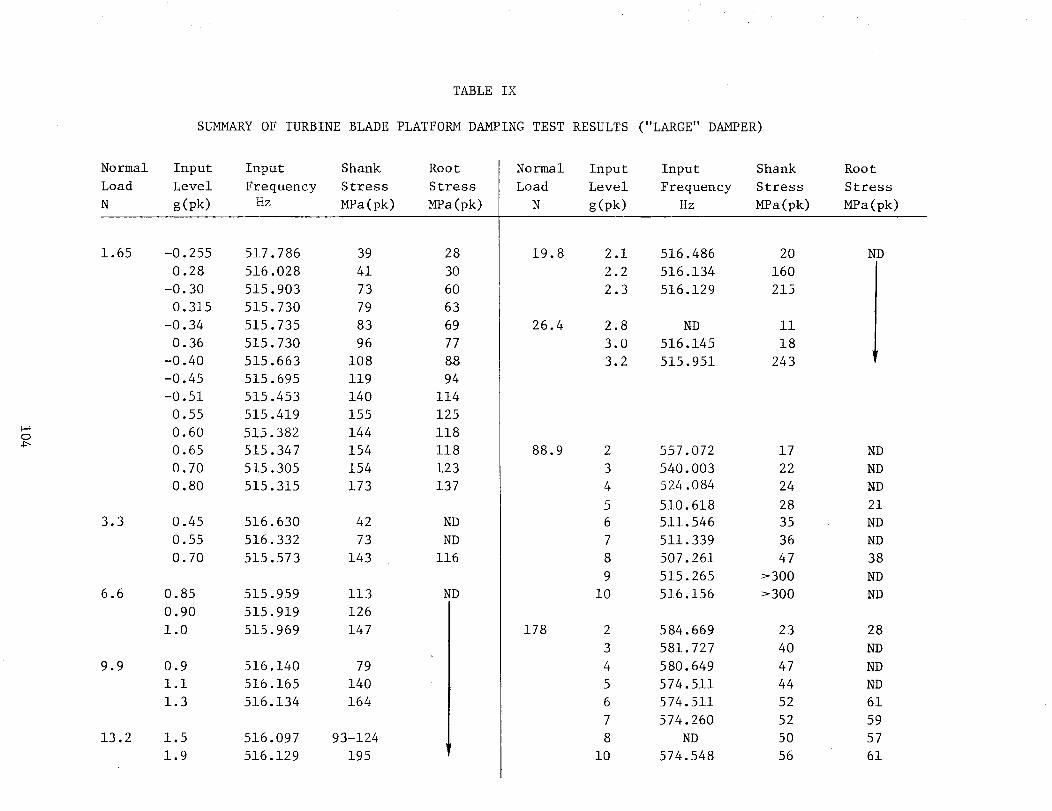
TABLEIX
SUMMARYOFTURBINEBLADEPLATFORMDAMPINGTESTRESULTS("LARGE"DAMPER)
O
Normal Input Input Shank Root
Load Level Frequency Stress Stress
N g(pk) Hz MPa(pk) MPa(pk)
1.65
3.3
6.6
9.9
13.2
-0.255 517.786 39 28
0.28 516.028 41 30
-0.30 515.903 73 60
0.315 515.730 79 63
-0.34 515.735 83 69
0.36 515.730 96 77
-0.40 515.663 108 88
-0.45 515.695 119 94
-0.51 515.453 140 114
0.55 515.419 155 125
0.60 515.382 144 118
0.65 515.347 154 118
0.70 515.305 154 123
0.80 515.315 173 137
0.45 516.630 42 ND
0.55 516.332 73 ND
0.70 515.573 143 116
0.85 515.959 113
0.90 515.919 126
1.0 515.969 147
0.9
i.i
1.3
1.5
1.9
ND
Normal Input Input
Load Level Frequency
N g (pk) I{z
19.8
26.4
2.1 516.486
2.2 516.134
2.3 516.129
516.140 79
516.165 140
516.134 164
516.097 93-124
516.129 195
88.9
2.8 ND
3.0 516.145
3.2 515.951
2 557.072
3 540.003
4 524.084
5 510.618
6 511.546
7 511.339
8 507.261
9 515.265
i0 516.156
178 2
3
4
5
6
7
8
i0
584.669
581.727
580.649
574.511
574.511
574.260
ND
574.548
Shank
Stress
MPa(pk)
20
160
215
ii
18
243
17
22
24
28
35
36
47
>300
>300
23
40
47
44
52
52
5O
56
Root
Stress
MPa(pk)
ND
ND
ND
ND
21
ND
ND
38
ND
ND
28
ND
ND
ND
61
59
57
61
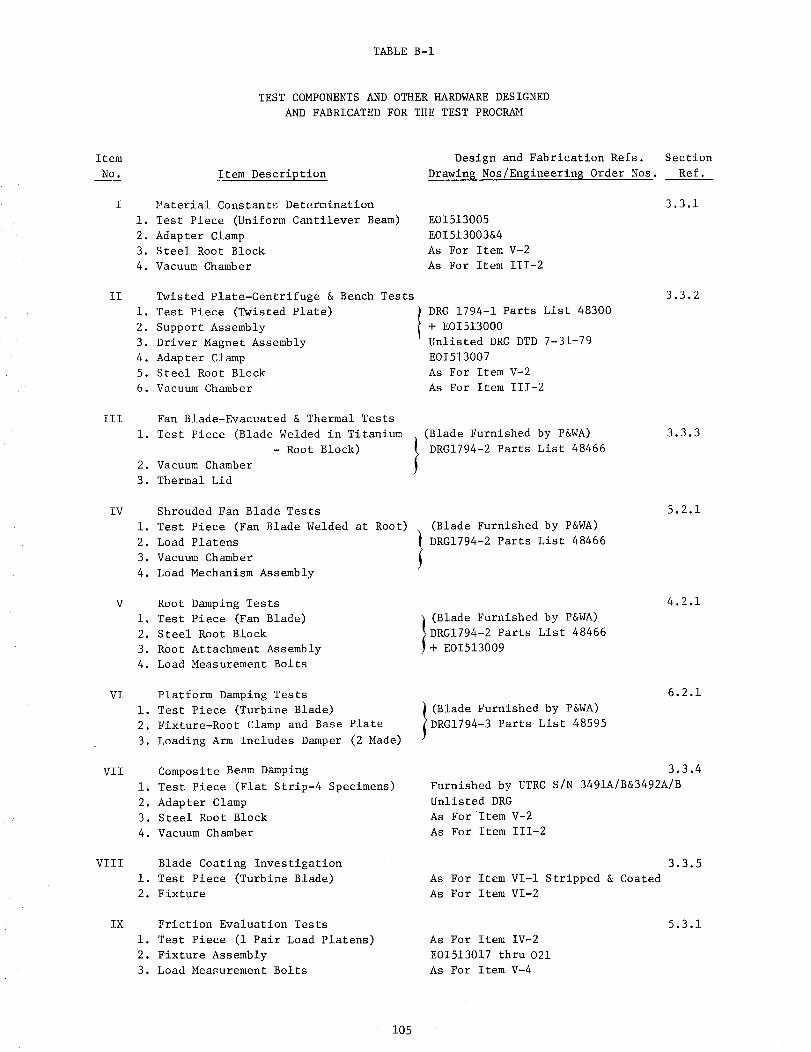
TABLE B-I
TEST COMPONENTS AND OTHER HARDWARE DESIGNED
AND FABRICATED FOR THE TEST PROGRAM
Item
No.
II
III
IV
V
VI
VII
Vlll
IX
Item Description
_!aterial Constants Determination
i. Test Piece (Uniform Cantilever Beam)
2. Adapter Clamp
3. Steel Root Block
4. Vacuum Chamber
Twisted Plate-Centrifuge & Bench Tests
i. Test Piece (Twisted Plate)
2. Support Assembly
3. Driver Magnet Assembly
4. Adapter Clamp
5. Steel Root Block
6. Vacuum Chamber
Fan Blade-Evacuated & Thermal Tests
i. Test Piece (Blade Welded in Titanium
- Root Block)
2. Vacuum Chamber
3. Thermal Lid
Shrouded Fan Blade Tests
i. Test Piece (Fan Blade Welded at Root)
2. Load Platens
3. Vacuum Chamber
4. Load Mechanism Assembly
Root Damping Tests
i. Test Piece (Fan Blade)
2. Steel Root Block
3. Root Attachment Assembly
4. Load Measurement Bolts
Platform Damping Tests
i. Test Piece (Turbine Blade)
2. Fixture-Root Clamp and Base Plate
3. Loading Arm Includes Damper (2 Made)
Composite Besm Damping
i. Test Piece (Flat Strip-4 Specimens)
2. Adapter Clamp
3. Steel Root Block
4. Vacuum Chamber
Blade Coating Investigation
i. Test Piece (Turbine Blade)
2. Fixture
Friction Evaluation Tests
1. Test Piece (1 Pair Load Platens)
2. Fixture Assembly
3. Load Measurement Bolts
Design and Fabrication Refs. Section
Drawin$ Nos/Engineerin$ Order Nos. Ref.
E01513005
EOI513003&4
As For Item V-2
As For Item 111-2
DRG 1794-1 Parts List 48300
+ E01513000
Unlisted DRG DTD 7-31-79
E01513007
As For Item V-2
As For Item 111-2
3.3.1
3.3.2
(Blade Furnished by P&WA)
I DRGI794-2 Parts List 48466
(Blade Furnished by P&WA)
I DRGI794-2 Parts List 48466
(Blade Furnished by P&WA)
DRGI794-2 Parts List 48466
+ EOI513009
3.3.3
5.2.1
4.2.1
I (Blade Furnished by P&WA)
DRGI794-3 Parts List 48595
6.2.1
3.3.4
Furnished by UTRC S/N 3491A/B&3492A/B
Unlisted DRG
As For Item V-2
As For Item III-2
As For Item Vl-1 Stripped & Coated
As For Item VI-2
3.3.5
As For Item IV-2
E01513017 thru 021
As For Item V-4
5.3 .i
105
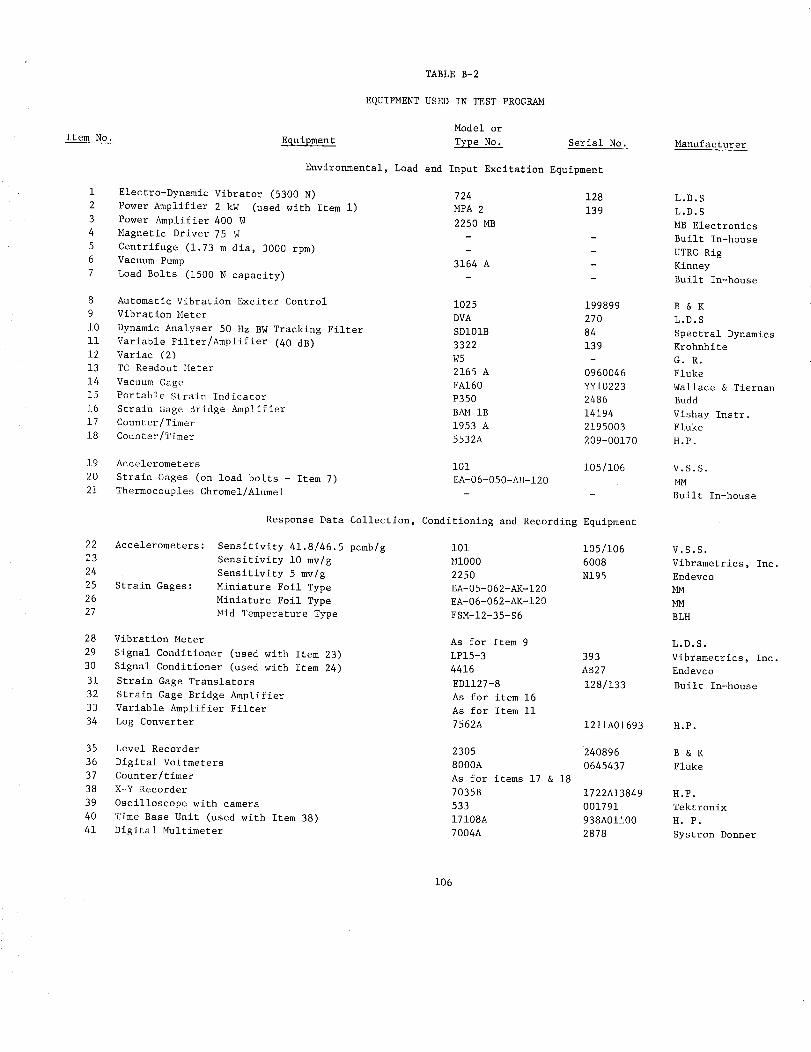
TABLE B-2
EQUIPMENT USED IN TEST PROGRAM
Item No.
Model or
Equipment Type No. Serial No.
Environmental, Load and Input Excitation Equipment
Electro-Dynamic Vibrator (5300 N)
Power Amplifier 2 kW (used with Item I)
Power Amplifier 400 W
Magnetic Driver 75 W
Centrifuge (1.73 m dia, 3000 rpm)
Vacuum Pump
Load Bolts (1500 N capacity)
724
MPA 2
2250 MB
3164 A
128
139
8 Automatic Vibration Exciter Control
9 Vibration Meter
i0 Dynamic Analyser 50 Hz BW Tracking Filter
ii Variable Filter/Amplifier (40 dB)
12 Variac (2)
13 TC Readout Meter
14 Vacuum Gage
15 Portable Strain Indicator
16 Strain Gage Bridge Amplifier
17 Counter/Timer
18 Counter/Timer
1025 199899
DVA 270
SDI01B 84
3322 139
W5
2165 A 0960046
PAl60 YYI0223
P350 2486
BAM IB 14194
1953 A 2195003
5532A 209-00170
19 Aceelerometers
20 Strain Gages (on load bolts - Item 7)
21 Thermocouples Chromel/Alumel
i01 105/106
EA-O6-050-AH-120
22 Aecelerometers:
23
24
25 Strain Gages:
26
27
Response Data Collection, Conditioning and Recording Equipment
Sensitivity 41.8/46.5 pcmb/g
Sensitivity i0 mv/g
Sensitivity 5 mv/g
Miniature Foil Type
Miniature Foil Type
Mid Temperature Type
Manufacturer
28 Vibration Meter
29 Signal Conditioner (used with Item 23)
30 Signal Conditioner (used with Item 24)
31 Strain Gage Translators
32 Strain Gage Bridge Amplifier
33 Variable Amplifier Filter
34 Log Converter
L.D.S
L.D.S
MB Electronics
Built In-house
UTRC Rig
Kinney
Built In-house
35 Level Recorder
36 Digital Voltmeters
37 Counter/timer
38 X-Y Recorder
39 Oscilloscope with camera
40 Time Base Unit (used with Item 38)
41 Digital Multimeter
B&K
L.D.S
Spectral Dynamics
Krohnhite
G. R.
Fluke
Wallace & Tiernan
Budd
Vishay Instr.
Fluke
H.P.
V.S.S.
MM
Built In-house
i01 105/106 V.S.S.
MI000 6008 Vibrametrics, Inc.
2250 N195 Endevco
EA-O5-062-AK-120 MM
EA-O6-062-AK-120 MM
FSM-12-35-S6 BLH
As for Item 9
LPI5-3 393
4416 AB27
EDI127-8 128/133
As for item 16
As for Item ii
7562A 1211A01693
L.D.S.
Vibrametrics, Inc.
Endevco
Built In-house
HoP.
2305 240896 B & K
8000A 0645437 Fluke
As for items 17 & 18
7035B 1722A13849 H.P.
533 001791 Tektronix
17108A 938A01AO0 H.P.
7004A 2878 Systron Donner
106

E
O)0
¢1.
4)J:::
c,m
"04)(/)
::)tnc4)c0D.EO
4)I--
4)c-
O
c
4)"0
I10
4)L_
U.
Og_G_ _ YAGE t_
OF pO0_. QUAN_i_
81 --86"A 81 --3--7--44
107
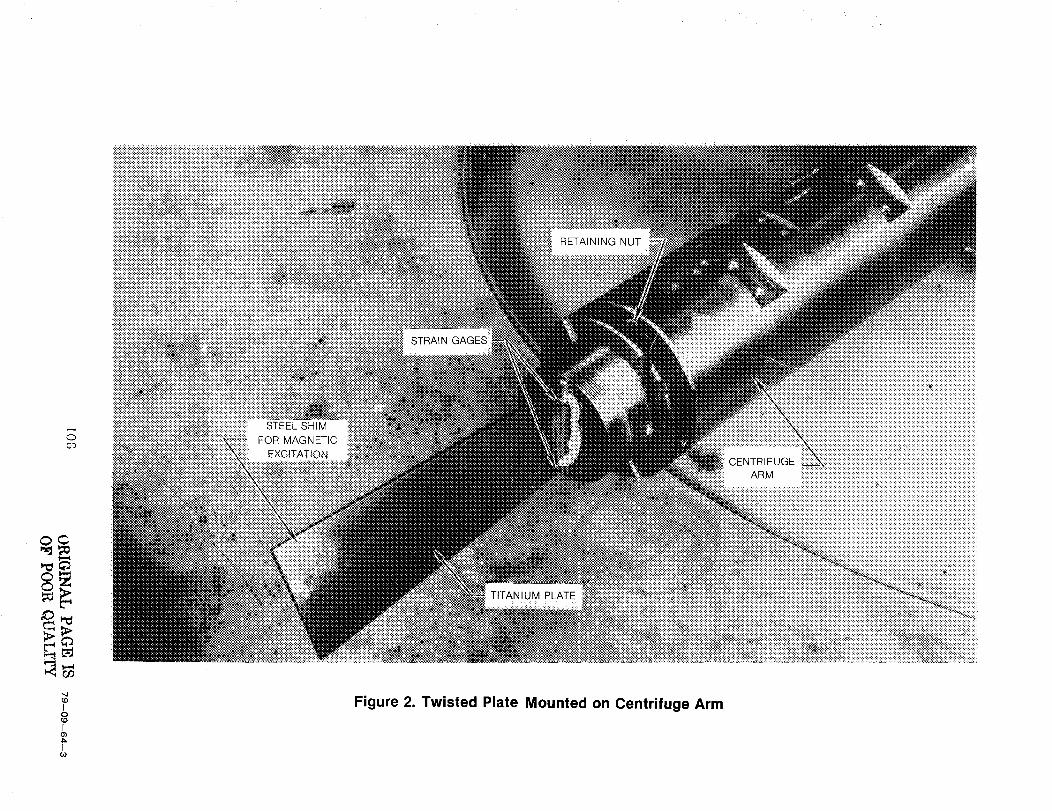
OCo
Oc
IO
[(3)
IG)
_iiiiiiiii_iii_iii______ii_iii_iiiiii!iiiiiiiiiiiiii_iiiiiiiiiiiiiiii!_i_iii_iiiiii_iiiii!i!iiiiiiiiii__ii......iiiiiiii_i!iii!iiiiiiiiiiiiiiiiiiii!!iiii_i_iiiii_iiiiiiiii!i_i_iiiiiiiiiiiiii_ii_i_iiii_i_i_ii!i!i_!_i_
:i_i:i:i:i_!:i:i:i:i:i_i_i:i:i:iiiiiiiiiiii_iiiii_iiiiiiiiiiii!_iiiiiiiiiiiii_iiiii_iii_ii!_iii!!i!!!i!i!!:"._
OE.TRFUGE_iiiiiiiiiiiiiiiiiiiiiiiiiiiiiiiiiiiiiiiiiiiiiiiiiiiiiiii!iiiARM ::::::::::::::::::::::::::::::::::::::::::::::::::::::::::::::::::::::::::::::::::::::::::::::::::::::::::::::::::::::::::::::::::::::::::::::::::::::::::::::::::::::::::::::::::::::::::
Figure 2. Twisted Plate Mounted on Centrifuge Arm
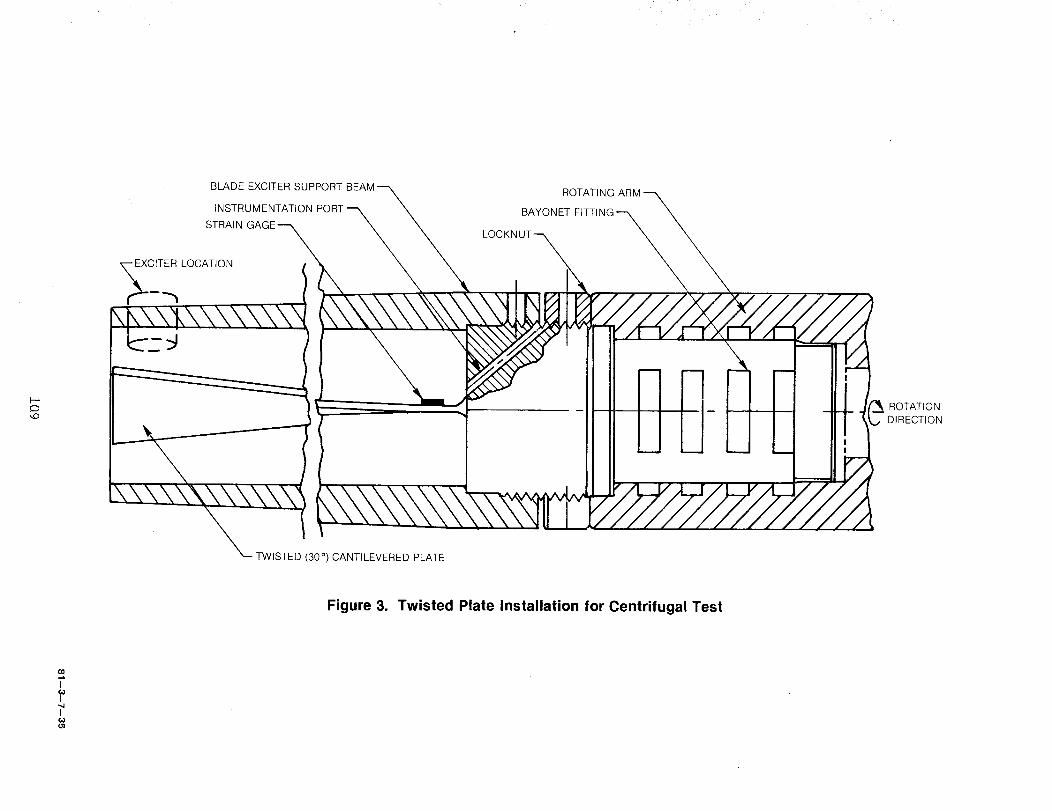
ok.o
BLADE EXCITER SUPPORT
INSTRUMENTATION PORT
STRAIN
,_CIT_ LOCATION
\b\-",_,\\\\\\\_
\ E 'TWIST D (30 °) CANTILEVERED PLATE
ROTATING ARM
BAYONET FITTING
ROTATION
DIRECTION
Figure 3. Twisted Plate Installation for Centrifugal Test
O0
IG_I
IGIO1
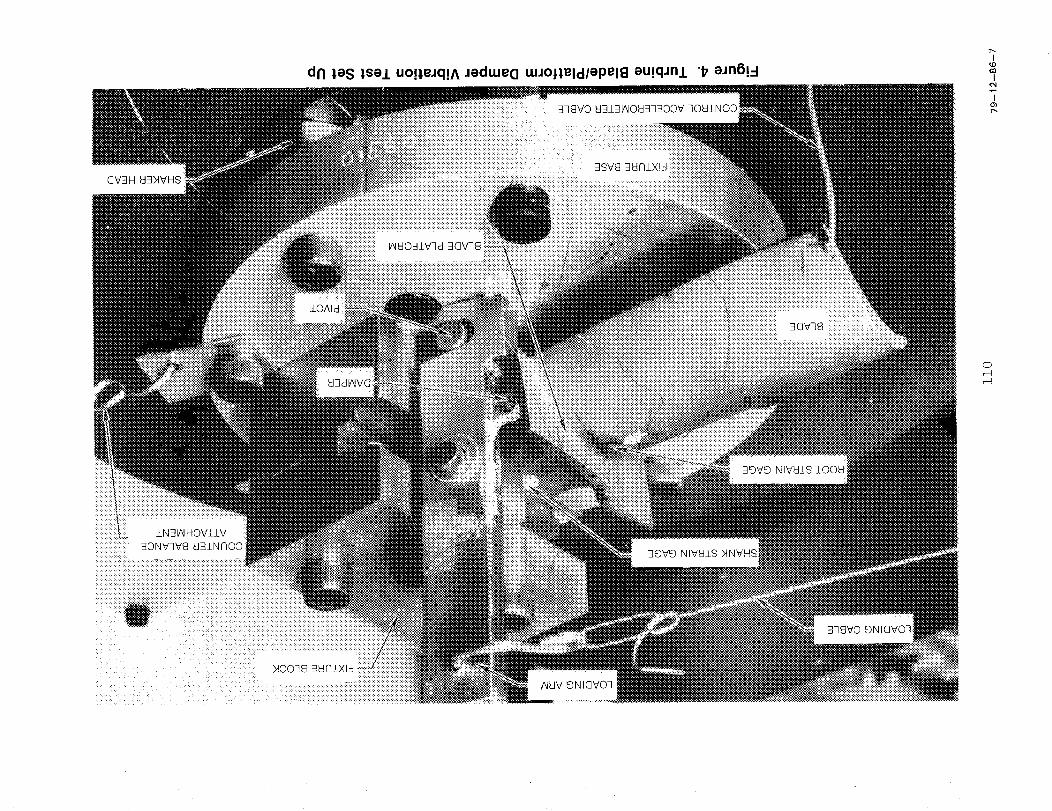
OV3H
::::::i:i::/ii ±N3WHOVZ±V:::: j:..;w
dFI Ias lSel uo!leJq!A JedtueQ uJJojleldlepell_ au!qjnl "b aJn6!-I¢ocO
I<N
1
T_
o
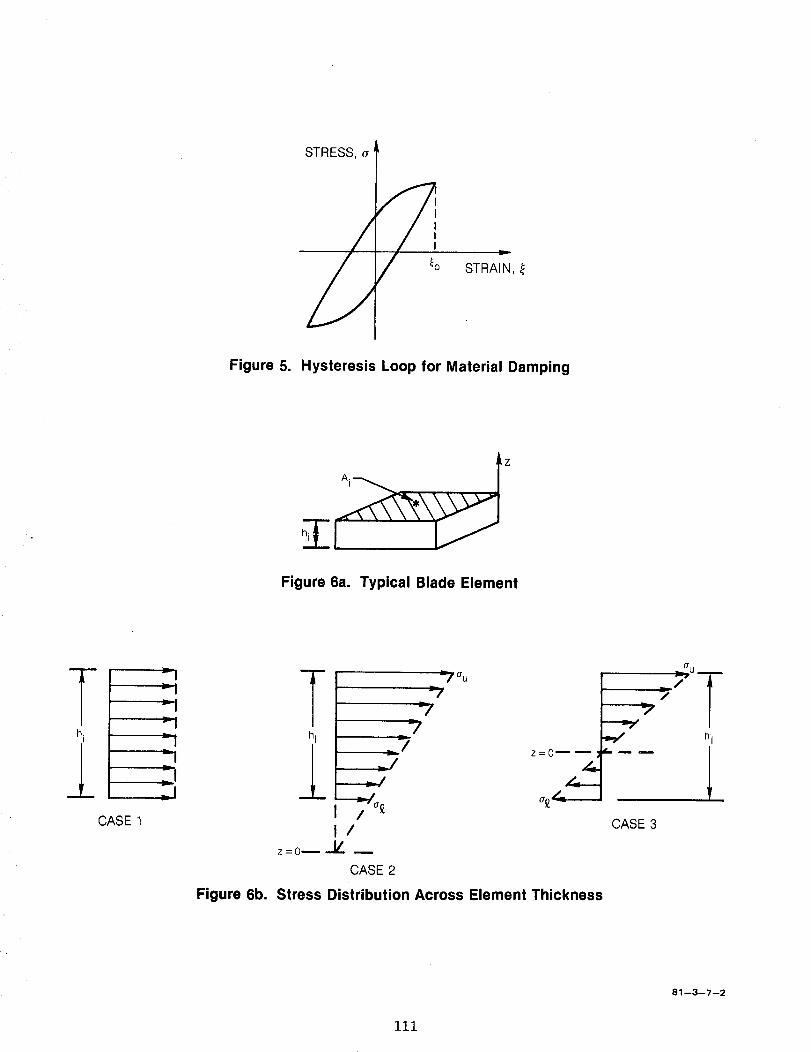
STRESS, a
/ I
/ to STRAI N,
Figure 5. Hysteresis Loop for Material Damping
Figure 6a. Typical Blade Element
Thi
lCASE 1
T I
r I-[
hi
_L
_0" u
-73
"--"_"//o£ a£_,_
/
z=0_-V-
CASE 2
Figure 6b. Stress Distribution Across Element Thickness
CASE 3
81--3--7--2
iii
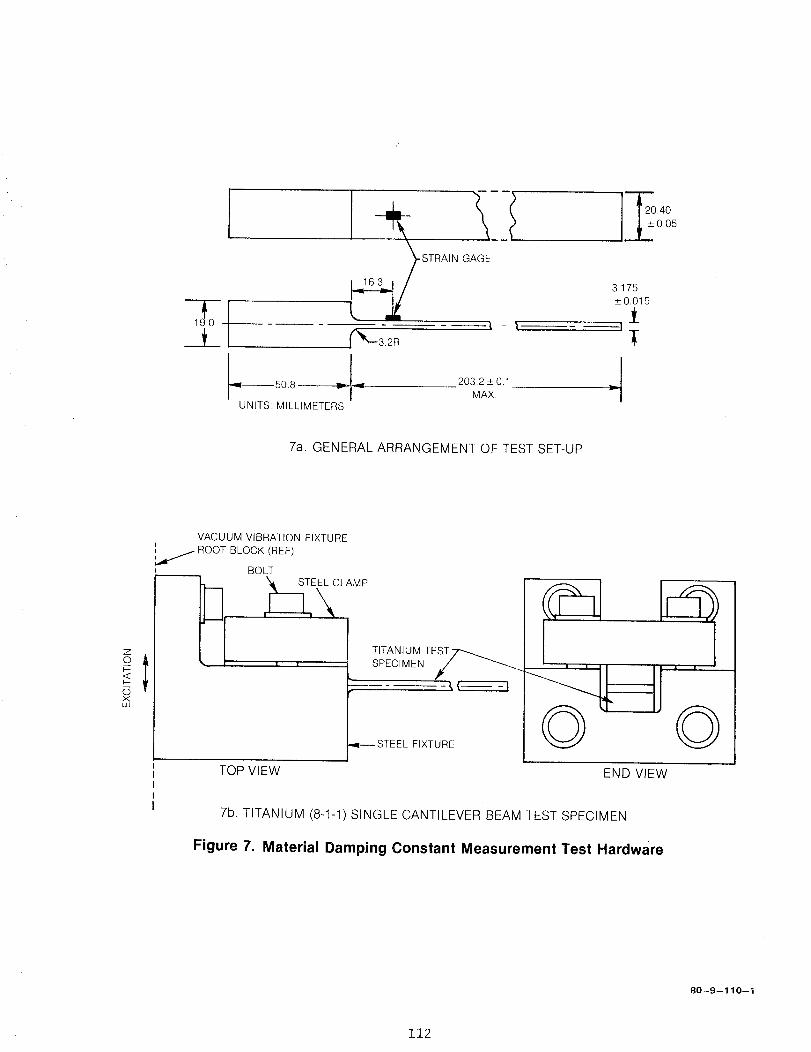
4--50.8 _l_
UNITS: MILLIMETERS
, STRAIN GAGE
_-3.2 R --_ - _
203.2+0.1
MAX.
3.175
_+0.015
i--]
I
20.40
_+0.05
7a. GENERAL ARRANGEMENT OF TEST SET-UP
Z
OF-<F-oxuJ
VACUUM VIBRATION FIXTURE
ROOT BLOCK (REF)
BOLT
, _ SPECIMEN /
-- STEEL FIXTURE
| |
©TOP VIEW END VIEW
7b. TITANIUM (8-1-1) SINGLE CANTILEVER BEAM TEST SPECIMEN
Figure 7. Material Damping Constant Measurement Test Hardware
©
80--9--110--1
112
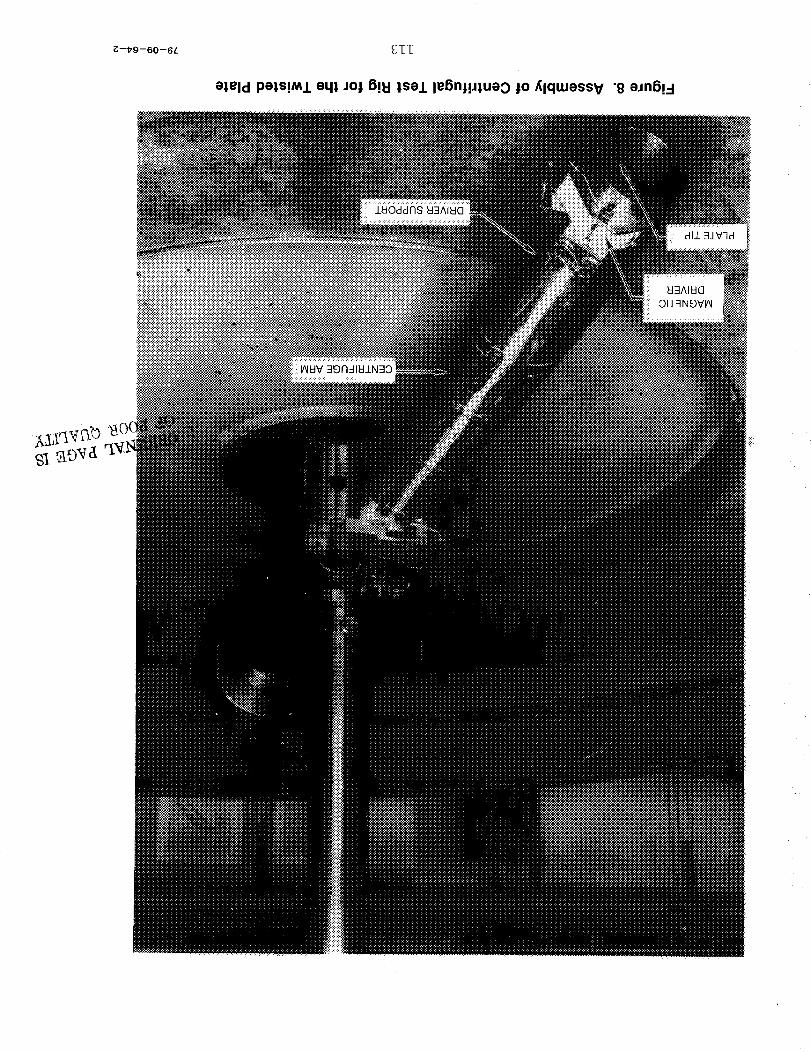
_--t79--60--6L
eleld pels!Ml eql JOj 5!1:1 lsel leSnj!Jlueo Jo Alqtuessv "g eJnS!_-I
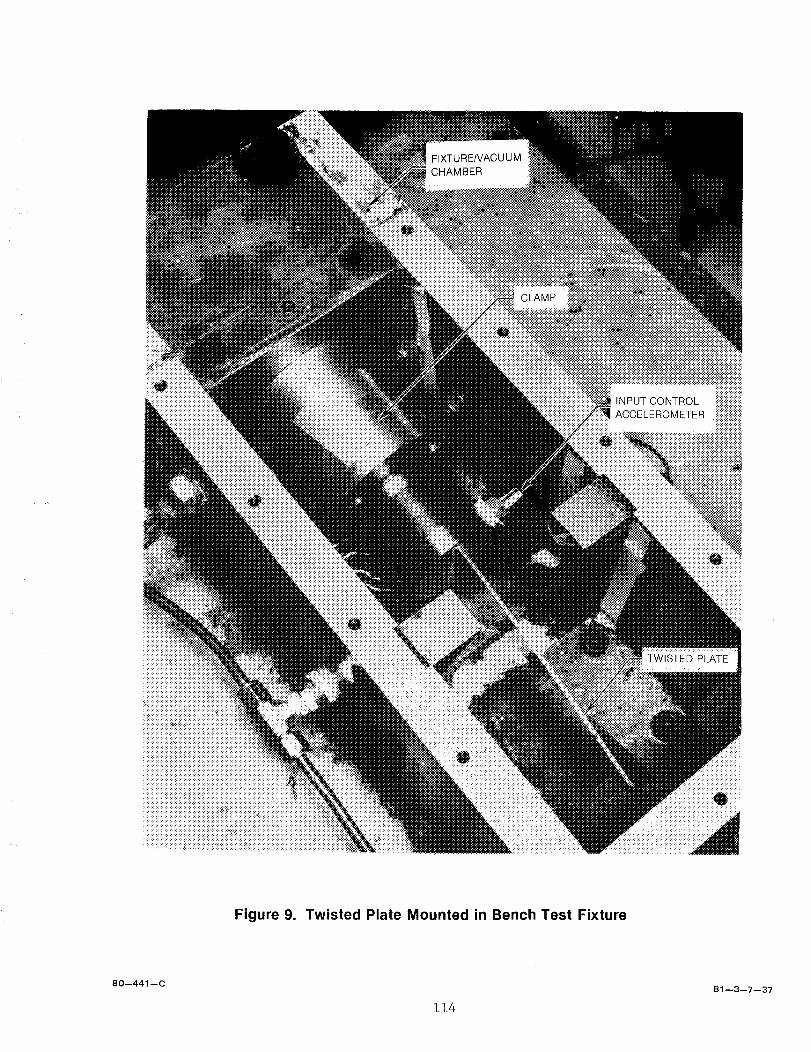
Figure 9. Twisted Plate Mounted in Bench Test Fixture
80--441--C
114
81 --3--7--37
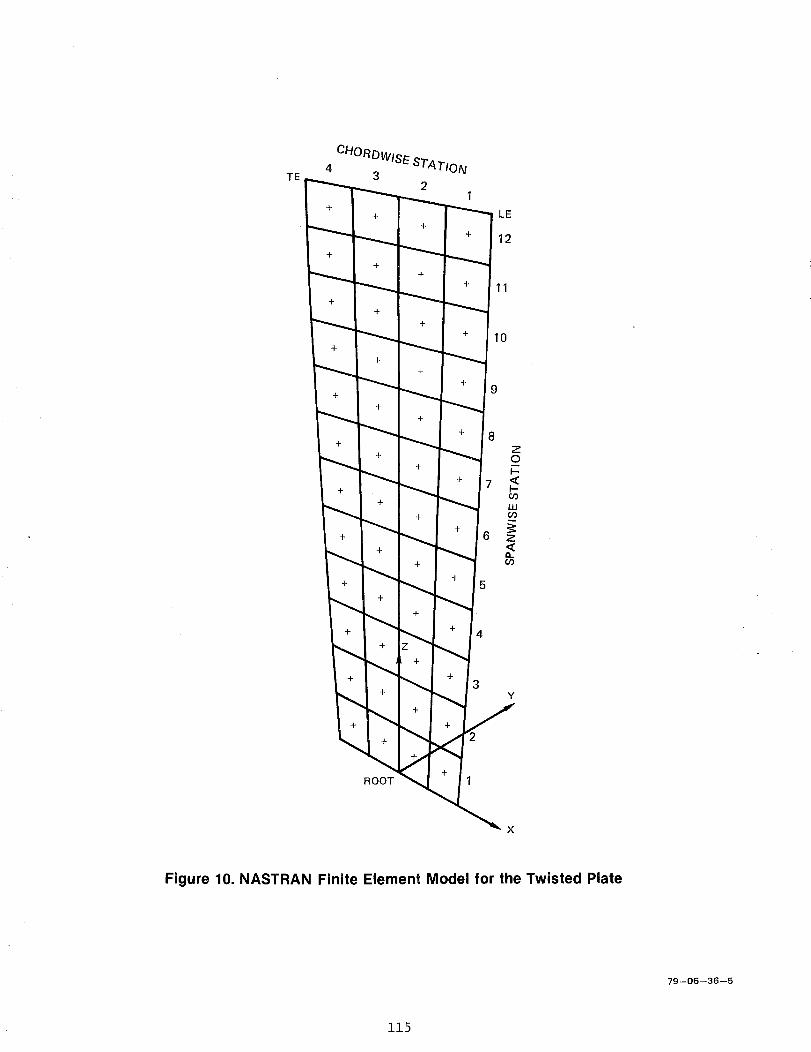
TE4 CHoRE)WISE STATION
32
._. 1
+
+
+
+
+
+
+
+
ROOT
LE
12
11
10
4
3 Y
J2
Figure 10. NASTRAN Finite Element Model for the Twisted Plate
79--06--36--5
115
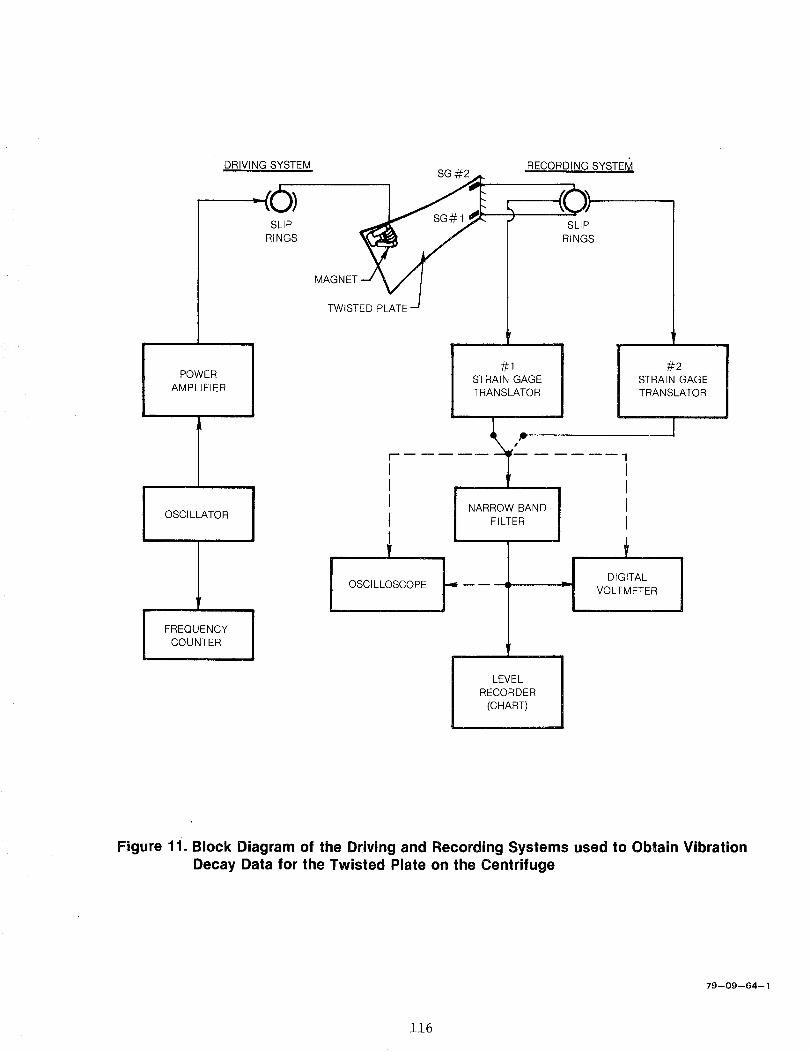
DRIVING SYSTEM
40)SLIP
RINGS
MAGN ET _
TWISTED PLATE
RECORDING SYSTEIVl
OSLIP
RINGS
POWER
AMPLIFIER
OSCI LLATOR
FREQUENCY JCOUNTER
#1
STRAIN GAGE
TRANSLATOR
OSCILLOSCOPE
NARROW BAND
FILTER
LEVEL
RECORDER
(CHART)
#2
STRAIN GAGE
TRANSLATOR
I
I1
1 'I+
i DIGITALVOLTMETER
Figure 11. Block Diagram of the Driving and Recording Systems used to Obtain VibrationDecay Data for the Twisted Plate on the Centrifuge
79--09--64--1
116
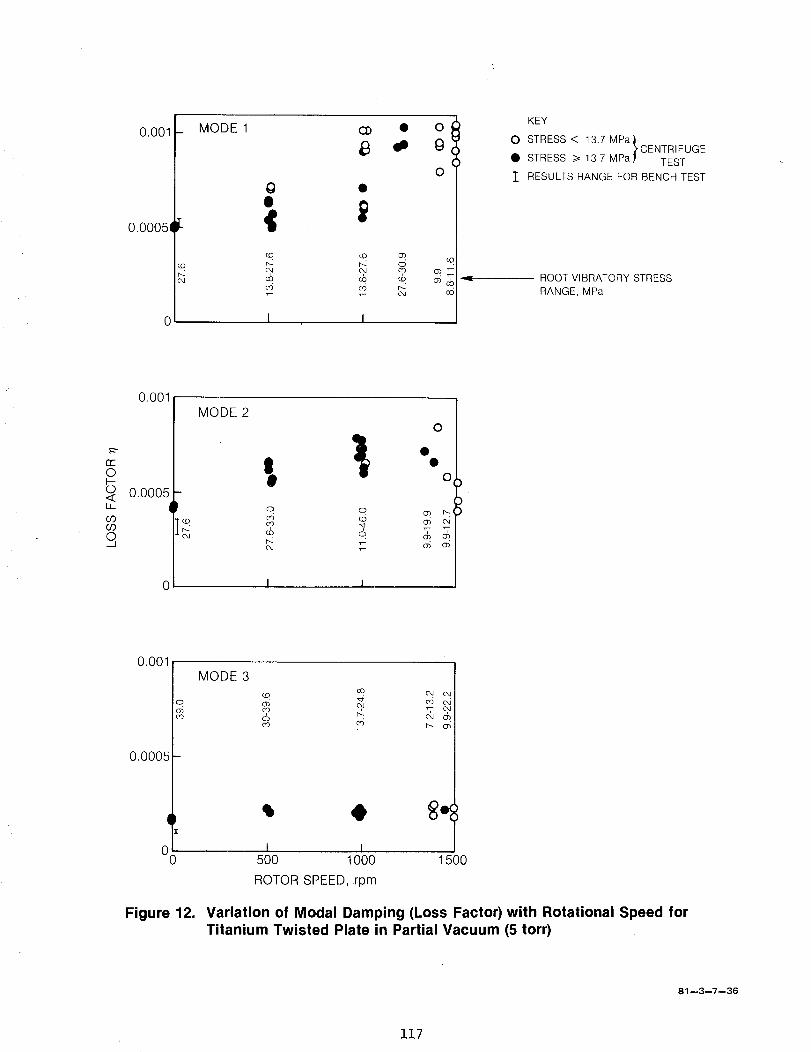
0.001
0.00051
_ MODE I
(.o
0 •
¢D
qB o
_o cO o'_
os_6 o6 _6co co
I I
O
8
O
Ob
oS c6 _-o5
KEY
O STRESS < 13.7 MPa[cENTRIFUG E
• STRESS /> 13.7 MPa_" TEST
T RESULTS RANGE FOR BENCH TEST
ROOT VIBRATORY STRESS
RANGE, MPa
rrOI--o<LL
CO09O._1
0.001
0.0005
MODE 2O
•o
_, I,
I I
0.001
0.0005
(
00
Figure 12.
MODE 3
_.o oo c! c,co c,,J
co c_ r-.- ob
I I500 1000
ROTOR SPEED, rpm
1500
Variation of Modal Damping (Loss Factor) with Rotational Speed for
Titanium Twisted Plate in Partial Vacuum (5 torr)
81 --3--7--36
117
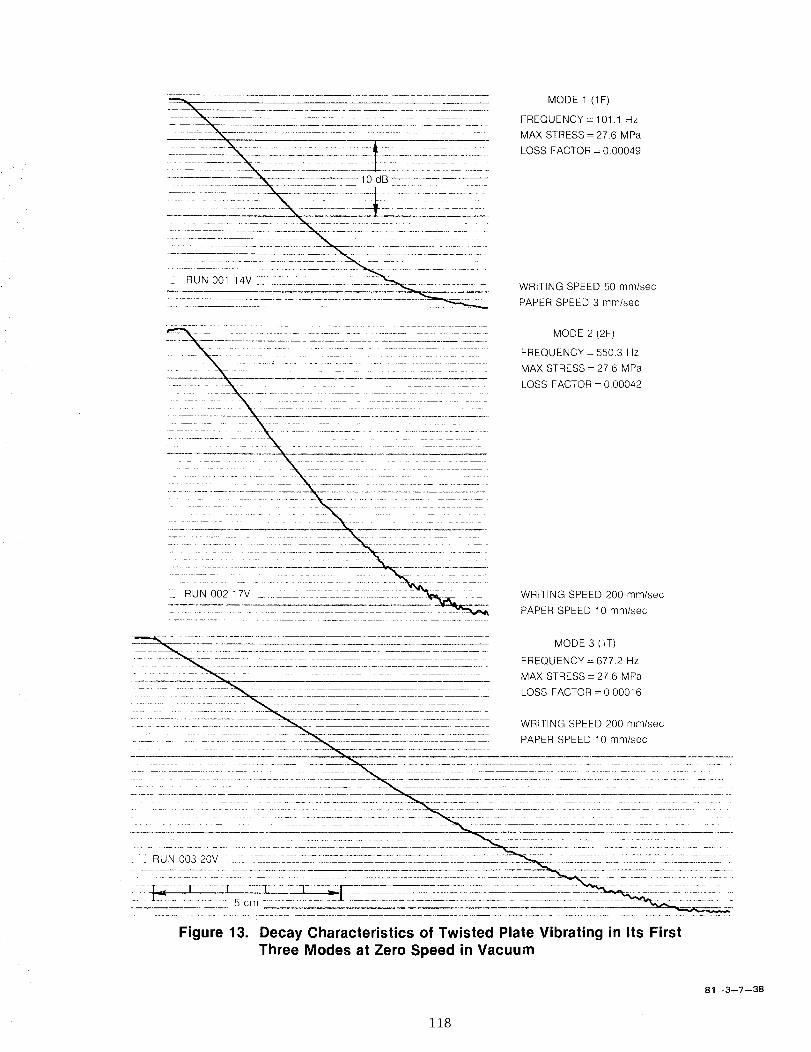
MODE 1 (1 F)
FREQUENCY = 101.1 Hz
MAX STRESS = 27.6 MPa
LOSS FACTOR = 0.00049
WRITING SPEED 50 mm/sec
PAPER SPEED 3 mm/sec
MODE 2 (2F)
FREQUENCY = 550.3 Hz
MAX STRESS = 27.6 MPa
LOSS FACTOR = 0.00042
WRITING SPEED 200 mm/sec
PAPER SPEED 10 mm/sec
MODE 3 (1T)FREQUENCY = 677.2 Hz
MAX STRESS = 27.6 MPa
i!{. }_-i ii:ii}__}_[_-_-}iF_-iT_7__-_Z__-_}ii_iiT_-[-_%-[_-_._"___ LOSS FACTOR = 0.00016
-TZI._-_7__-_-LTZ_-______--___{-_-_, _--. -. ___-___[: WRITING SPEED 200 mm/sec_:]2Z_ [ Z _-ZTL7:_--_-:#._Z .2.-__ _:_TZ 7____-____i_-._iLW 7 ----__--_ PAPER SPEED 10 mm/sec
:;:C-:::::i:::-::: =- ::- :-::;:::; ___ _.rzt_............ 5 cm ..................... J........................................................................ :: ........ __i
Figure 13. Decay Characteristics of Twisted Plate Vibrating in Its FirstThree Modes at Zero Speed in Vacuum
81 --3--7--38
118
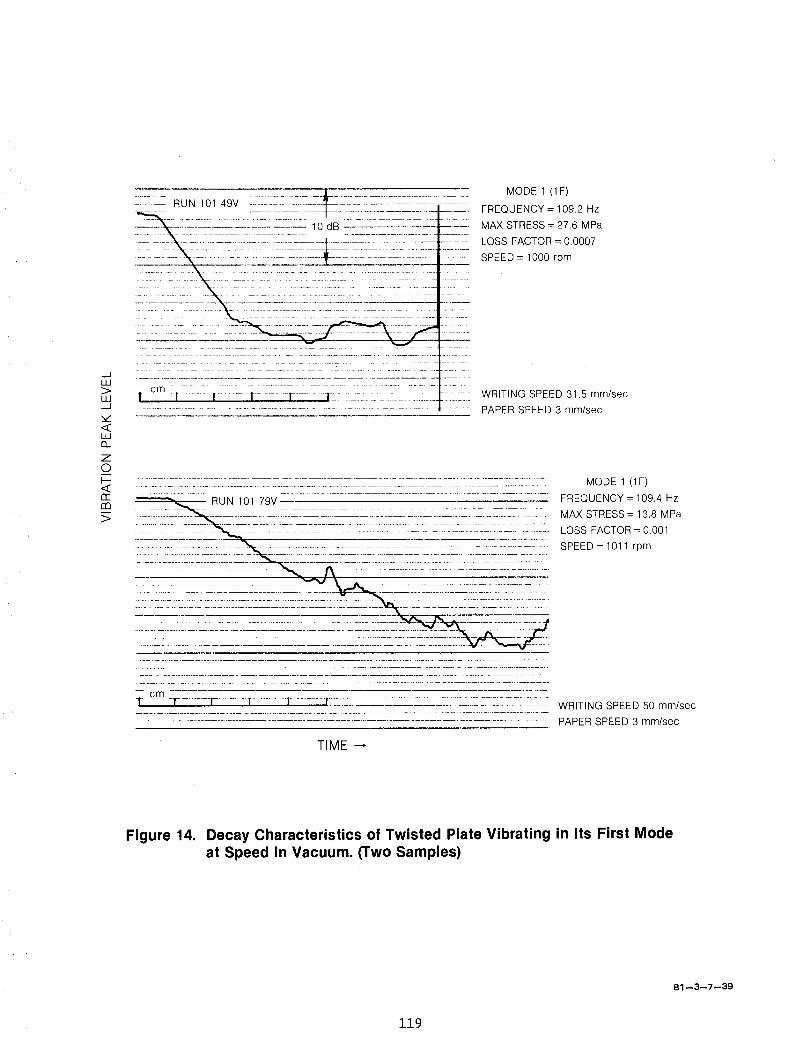
__1
III
>Iii_,J
<III
13..ZOI--<IT"m>
1:::: -: RUN10149v
cm 1 ..... 1 " - I ........... r .............1-:.:: ::L:-::2::L ::7. 7_ :_-:777.._.:7_L::::
MODE 1 (1F)
FREQUENCY= 109.2 Hz
MAX STRESS = 27.6 MPa
LOSS FACTOR = 0.0007
SPEED = 1000 rpm
WRITING SPEED 31.5 mm/sec
....................................................... PAPER SPEED 3 mm/sec
............................................................................................. FREQUENCY = 109.4 Hz
MAX STRESS= 13.8 MPa
LOSS FACTOR = 0.001
SPEED = 1011 rpm
cm
T -T....... -f- ...... _f..... -1-- .... I_-:_7_-_::-----_--LLZ::::_Z:T-_L-:Z::7:--_::L:L::2: WRITING SPEED 50 mm/sec
................................................................................................... PAPER SPEED 3 mm/sec
TIME ---
Figure 14. Decay Characteristics of Twisted Plate Vibrating in Its First Modeat Speed in Vacuum. (Two Samples)
81 --3--7--39
119
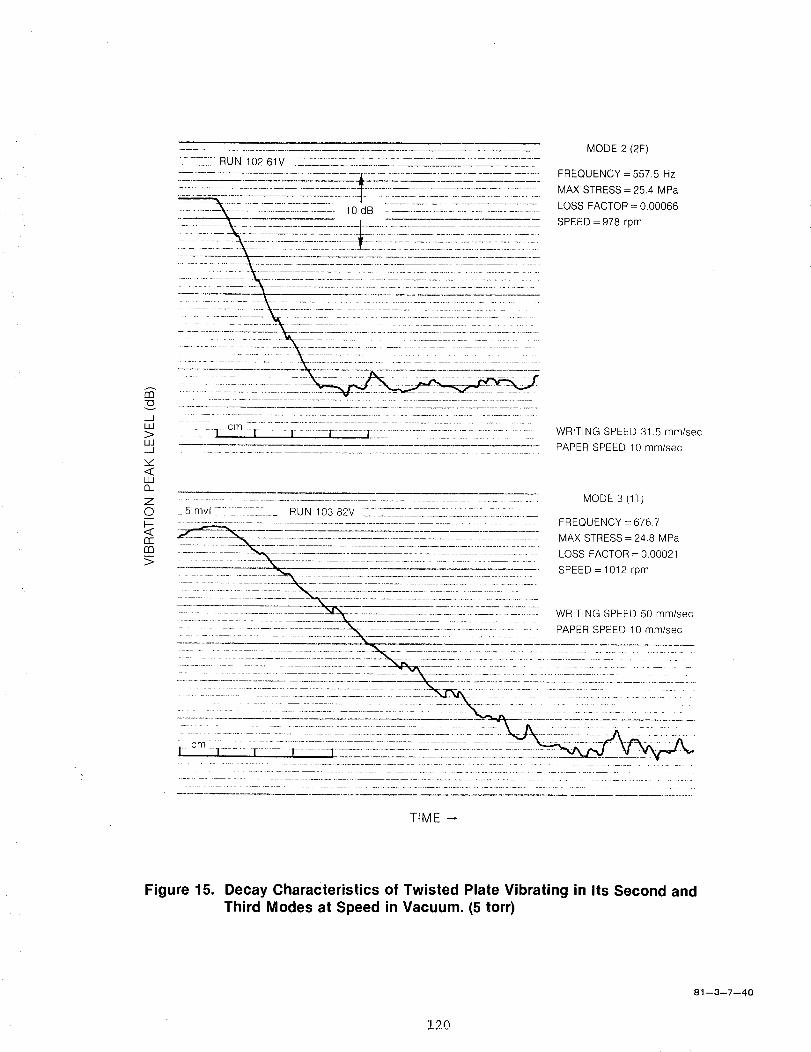
col
LU>LU_J
-,,/<£LLI13_
ZOI.-<:r,c
>
........ :_ ................................................................................. MODE 2 (2F)_f__-I_-'C-I'RUN 102 61V .............................................................
MAX STRESS = 25.4 MPa
--_._i::_. -7_-_I..-.IC_.-_-_I:______.-Z:__-- 10 dB [I:Z--_I-:-C--I.--2--_[:/_--fT7.:/_-:7:_:-I:.I,_:_ LOSS FACTOR = 0.00066
SPEED =978 rpm
. _ :;] cm -1-..... I .......... T ......... [_::LL::2-__-i-_Ti:7:L-..7;Z_[T;:.lie _"-_. WRITING SPEED31.5 mm/secPAPER SPEED 10 mm/sec
......................................................................... MODE 3 (1T)
_5 mvf -_-f. L .... _- _:_ RUN 103 82V ............................................................................................................ FREQUENCY = 676.7
MAX STRESS = 24.8 MPa
LOSS FACTOR = 0.00021
SPEED = 1012 rpm
WRITING SPEED 50 mm/sec
PAPER SPEED 10 mm/sec
cr'n ...................................."] ....... f ...... r ...... -1 i_-__-_2_iz--:_7- I ..LIL:_-__I:_:-_:_- ":__-_i.... _.___2_
TIME
Figure 15. Decay Characteristics of Twisted Plate Vibrating in Its Second and
Third Modes at Speed in Vacuum. (5 torr)
81 --3--7--40
120
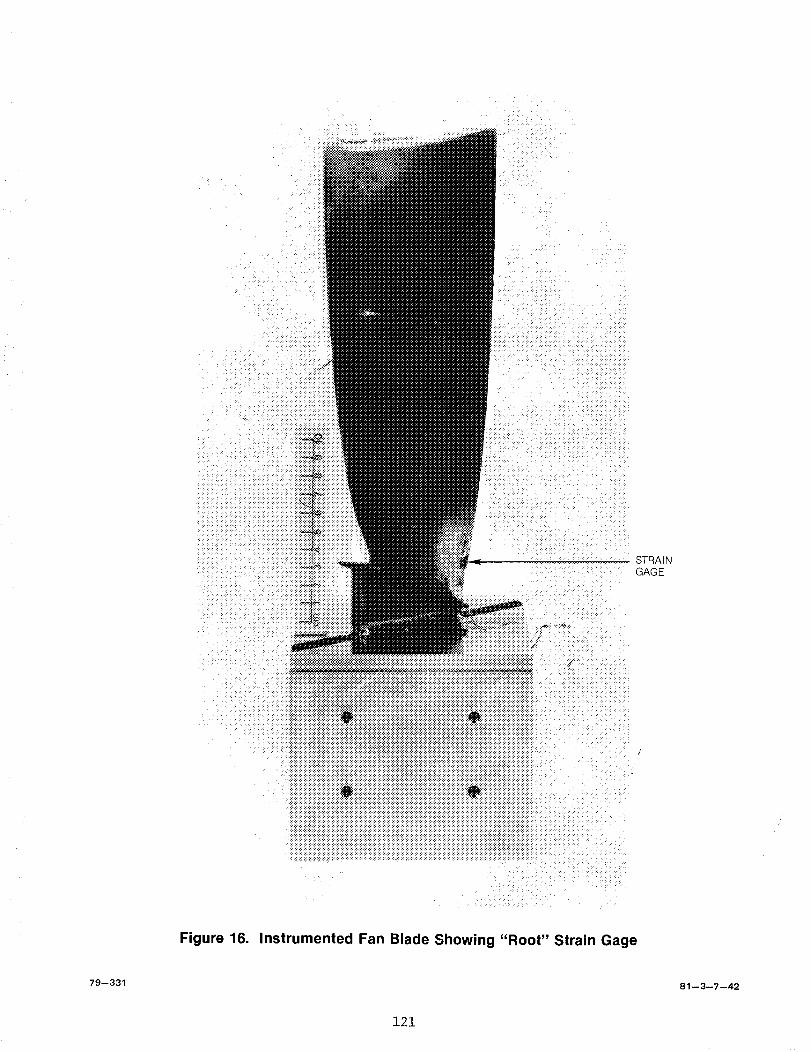
STRAIN
GAGE
iii_i_i_iii_i_iiiiiiiiiiiiiiiiiiiiiiiii_iiiiiiiiiii_iiiiiiiiiiiii_iii_i_i_iiiiiiiiiiiiii_iii!iii_iiiiiiii_iiiiiiii_ii_i_iiiiiiiiiiiiiii_iiiiiiiiiiiiiiiiiiiii_i_iiiiii_i_iiiiiiii_!iii_i_:':+:':':':':':':':':':':<':':':':::::::::::::2:::::::::2:::::::::::::::::::::::::::::::2::::::::::::::::::::::::::::::::::::::::::::::::::::::::::::::;::::::::::2 <,:<..........
......_i_!i_i_!_i_i_i_!_i_iiiii_!i!_!ii_!_ii_:i_iiiiiii_iii_i_i_i_!i!_ii_i_ii!_i_i_i_i_!_i_i!i_i_ii_i_i_i_ii_iiii_i_i_i_i_i_i_i_i_!ii_i_i_i::i:_:_!ii!{_!ii_i_iii_:i_iiiiiii_i_/_?_:_:
Figure 16. Instrumented Fan Blade Showing "Root" Strain Gage
79--331 81--3--7--42
121
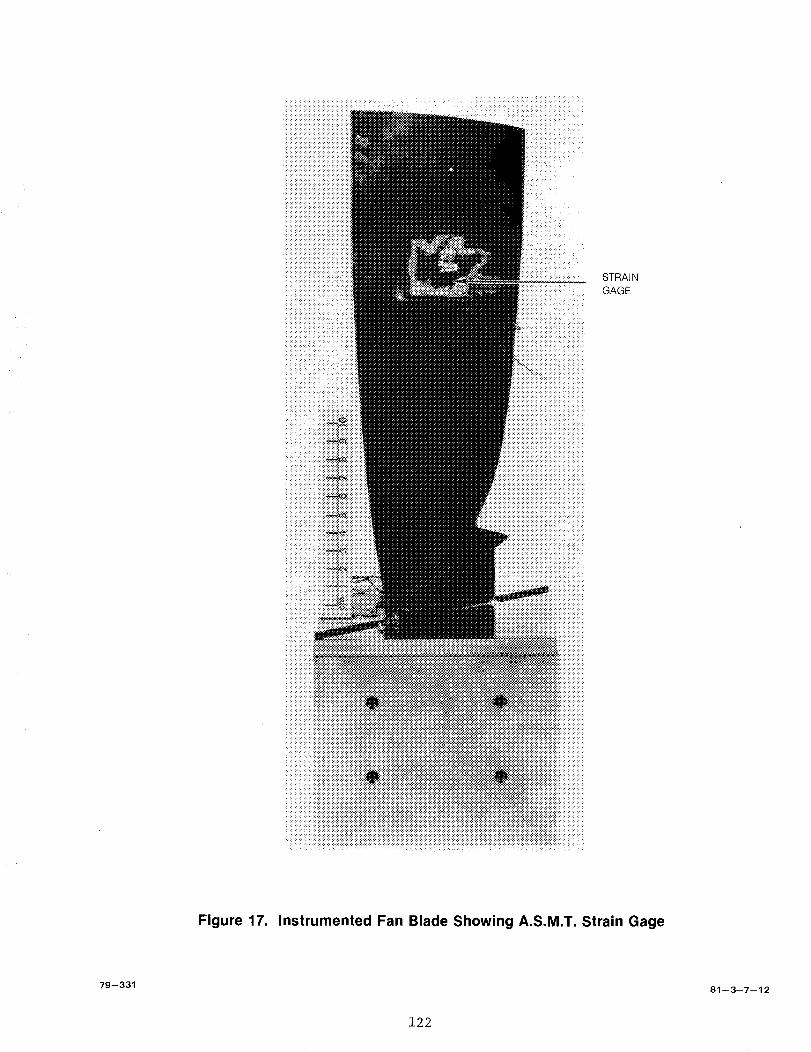
.............. " STRAI N
GAGE
Figure 17. Instrumented Fan Blade Showing A.S.M.T. Strain Gage
79--331 81--3--7--12
122

boL_
COO
I.-LIO
IO_
I.a,
EXCITATION I
DIRECTION
@
@
ALUMINUM FIXTURE /
TITANIUM FAN BLADE WELDED AT
@ @ @
HEATING ELEMENTS
O OO
@ @ @ @, i ,
O O O O O
I_ INSTRUMENTATION UPORT
"11"TITANIUM BLOCK
FIBERGLASS COVER 7
II[ II' 1i I
\_kk I _ f l _\l I ,,_\"\ i 'l '[ _ , I _ I ]I\\\\ ' _ I I I NI I
@ L&_%' -"-----i I \ _ ,i \!o
....... ,; ,\
ROOT T HERMOCOUPLE _ MIDSPAN THERMOCOUPLE "_ TIE DOWN TIP THERMOCOUPLE "_
BOLT
Figure 18. Test Set-Up for Fan Blade Material Damping Investigation at Elevated Temperatures
@INPUT ;ONTROL
ACCELEROMETER" _ _
_SHAKER SLIP PLATE '_
3 _
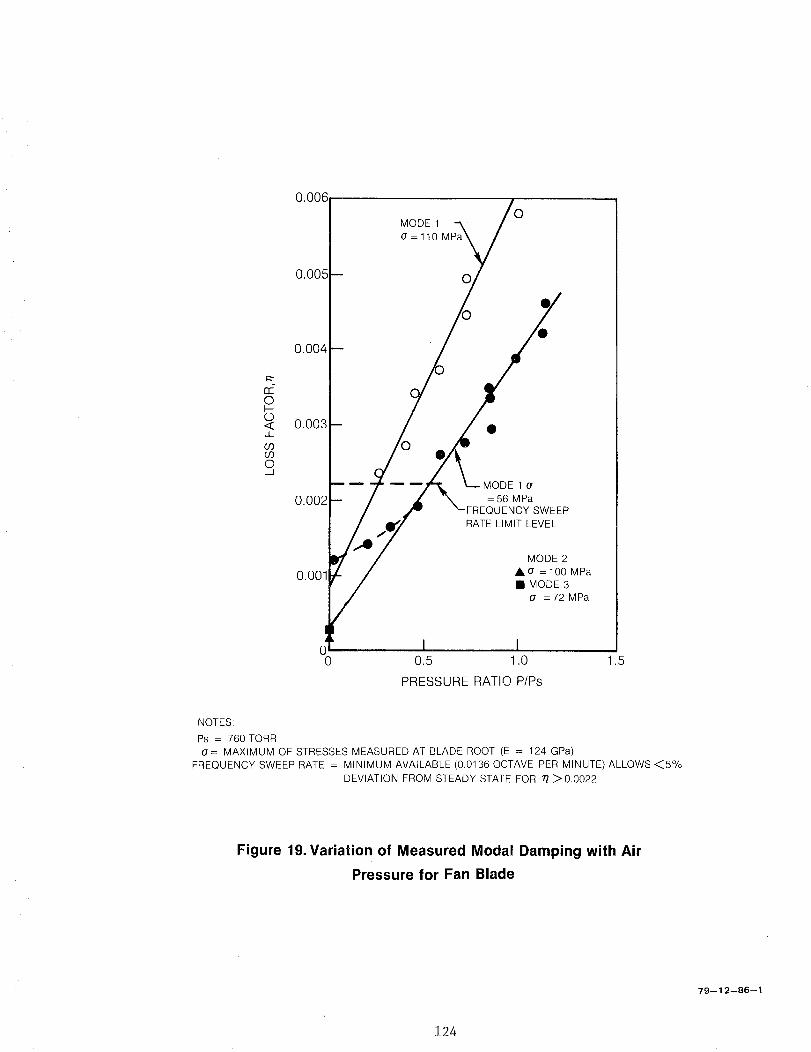
O
O<u_
cOcOO.J
0.004
0.003i
0.002
0.001
OMODE 1
(/=110
/o/ .lo
= 56 MPa
FREQUENCY SWEEP
RATE LIMIT LEVEL
MODE 2
Aa =100 MPa
• MODE 3
(z = 72 MPa
I0.5 1.0
PRESSURE RATIO PIPs
.5
NOTES:
Ps = 760 TORR
0= MAXIMUM OF STRESSES MEASURED AT BLADE ROOT (E = 124 GPa)
FREQUENCY SWEEP RATE = MINIMUM AVAILABLE (0.0136 OCTAVE PER MINUTE) ALL©WS _5%
DEVIATION FROM STEADY STATE FOR 1"/_ 0.0022
Figure 19. Variation of Measured Modal Damping with Air
Pressure for Fan Blade
79--12--86--1
124
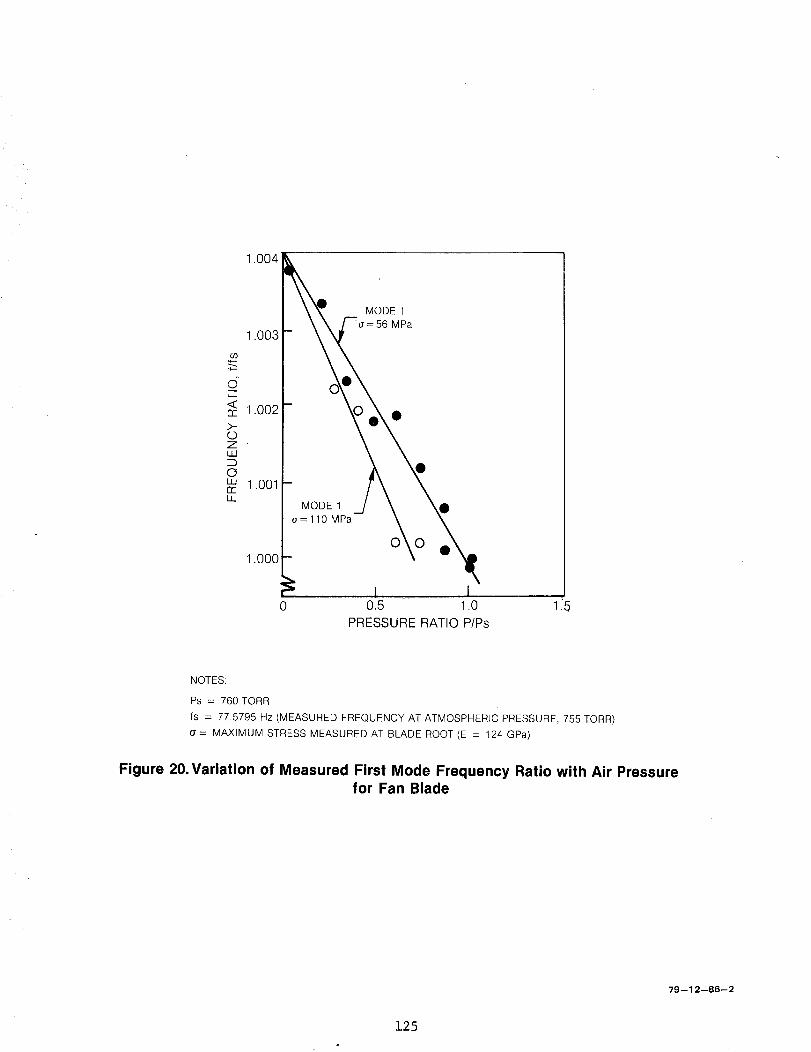
d
<rr
0ZuJ
0LUn'-U_
1.004
1.003
1.002
1.001
1,000
MODE 1
o=56 MPa
MODE 1
o=110 MPa
O
0 0.5 1.0 1.5
PRESSURE RATIO PIPs
NOTES:
Ps = 760 TORR
fs = 77.5795 Hz (MEASURED FREQUENCY AT ATMOSPHERIC PRESSURE, 755 TORR)
o-- MAXIMUM STRESS MEASURED AT BLADE ROOT(E = 124 GPa)
Figure 20. Variation of Measured First Mode Frequency Ratio with Air Pressurefor Fan Blade
79--12--86--2
125
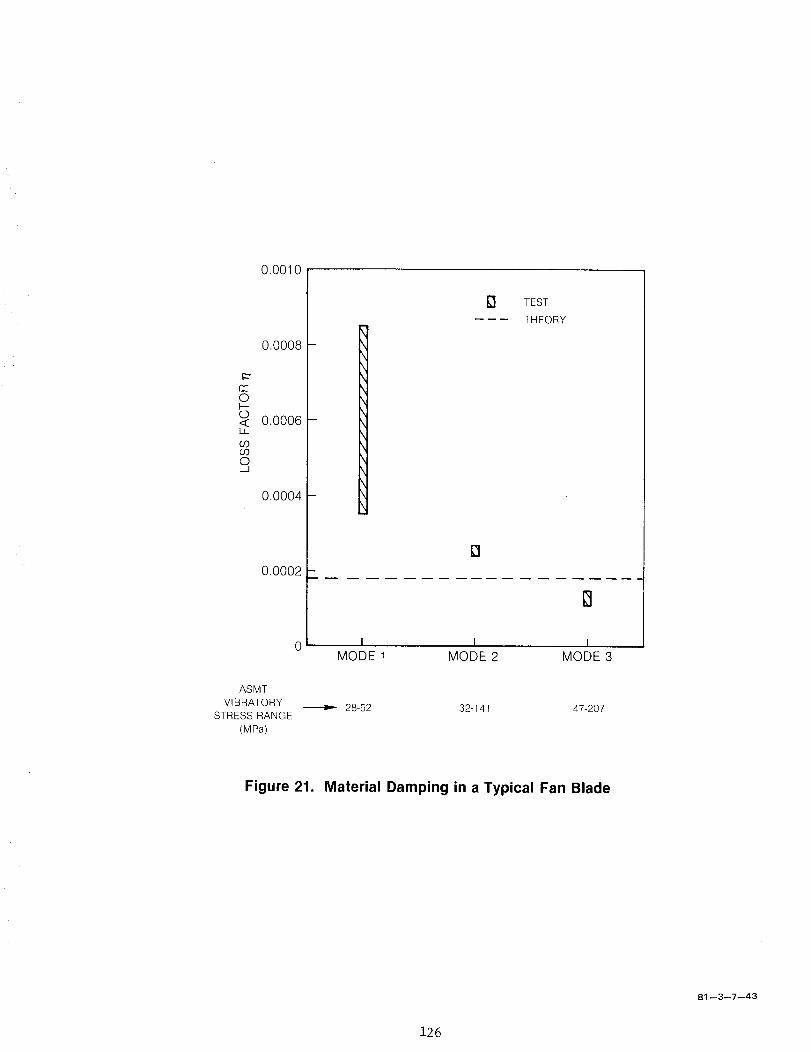
rrOI.-O<I:ii
o909O.--J
0.0010
0.0008
0.0006
0.0004
0.0002
0
TEST
THEORY
ASMT
VIBRATORY
STRESS RANGE
(MPa)
I;:1
I I IMODE 1 MODE 2 MODE 3
28-52 32-141 47-207
Figure 21. Material Damping in a Typical Fan Blade
81 --3--7--43
126
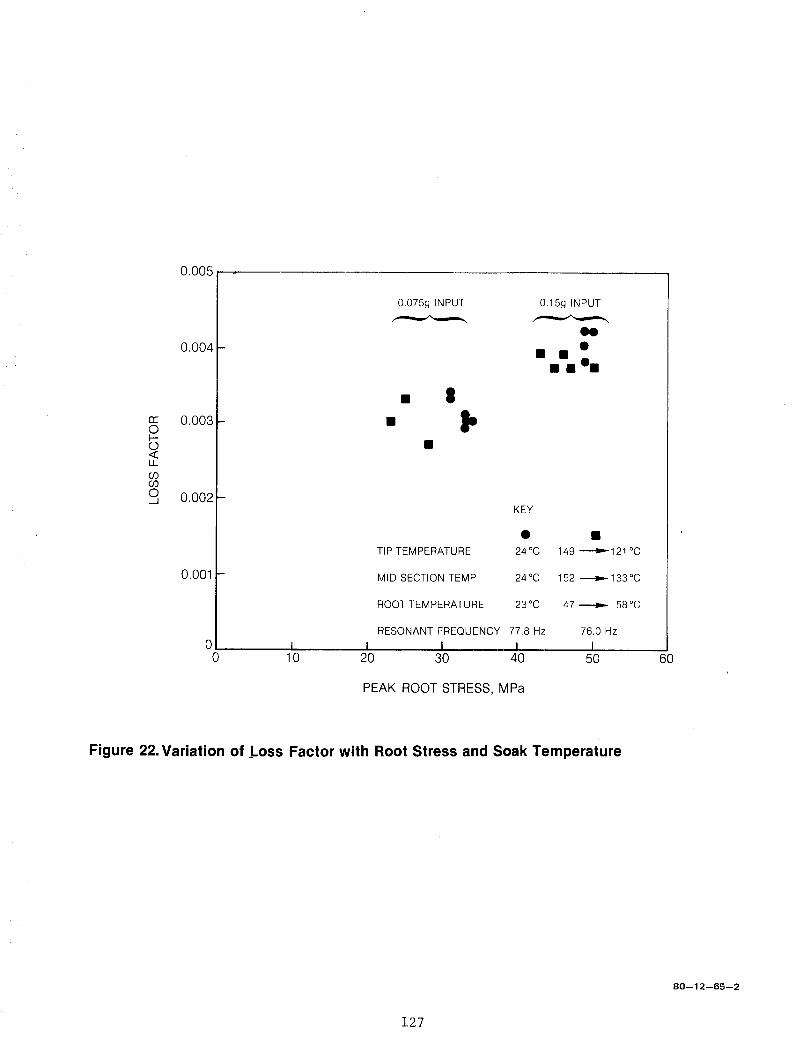
n"OI.-O<LL
0303O_J
0.005
0.004
0.003
0.002 -
0.001 -
00
0.075g INPUT
• II
0.15g INPUT
N
• m°m
KEY
TIP TEMPERATURE 24°C 149 ---'_'-121 °C
MID SECTION TEMP 24°C 152 _133°C
ROOT TEMPERATURE 23°C 47 _ 58°C
RESONANT FREQUENCY 77.8Hz 76.0 Hz
I I I I10 20 30 40 50
PEAK ROOT STRESS, MPa
60
Figure 22. Variation of _Loss Factor with Root Stress and Soak Temperature
80--12--65--2
127
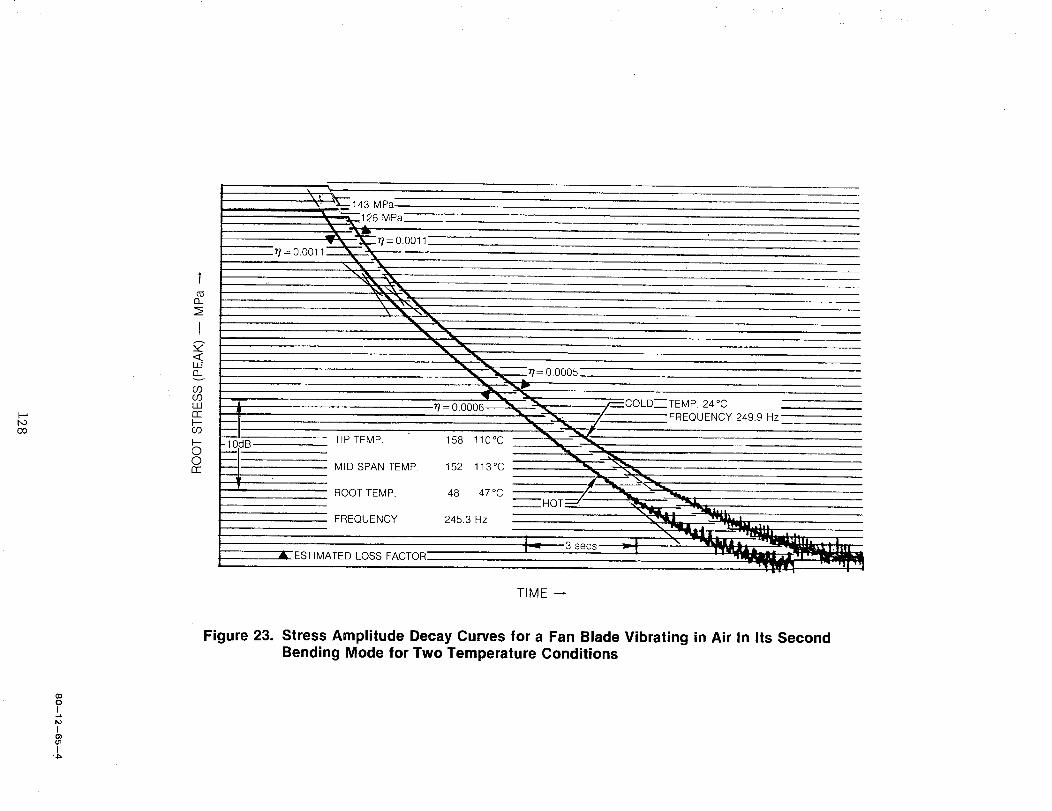
I.-,I-,3oo
t
(3-
f
<_LLJO..v
O90"3III132I---CO
I..--OOn'-
.!43 MPa.
126 MPa__
r=0.0011
'= 0.0005
-t_ 7/= TEMP. 24°C
FREQUENCY 249.9 Hz
B TIP TEMP. 158110°C
H MID SPAN TEMP. 152 113°C
ROOT TEMP. 48 47°C
FREQUENCY 245.3 Hz
A ESTIMATED LOSS FACTOR
TIME
Figure 23. Stress Amplitude Decay Curves for a Fan Blade Vibrating in Air In Its SecondBending Mode for Two Temperature Conditions
00OI
IO3O1I
'.b.
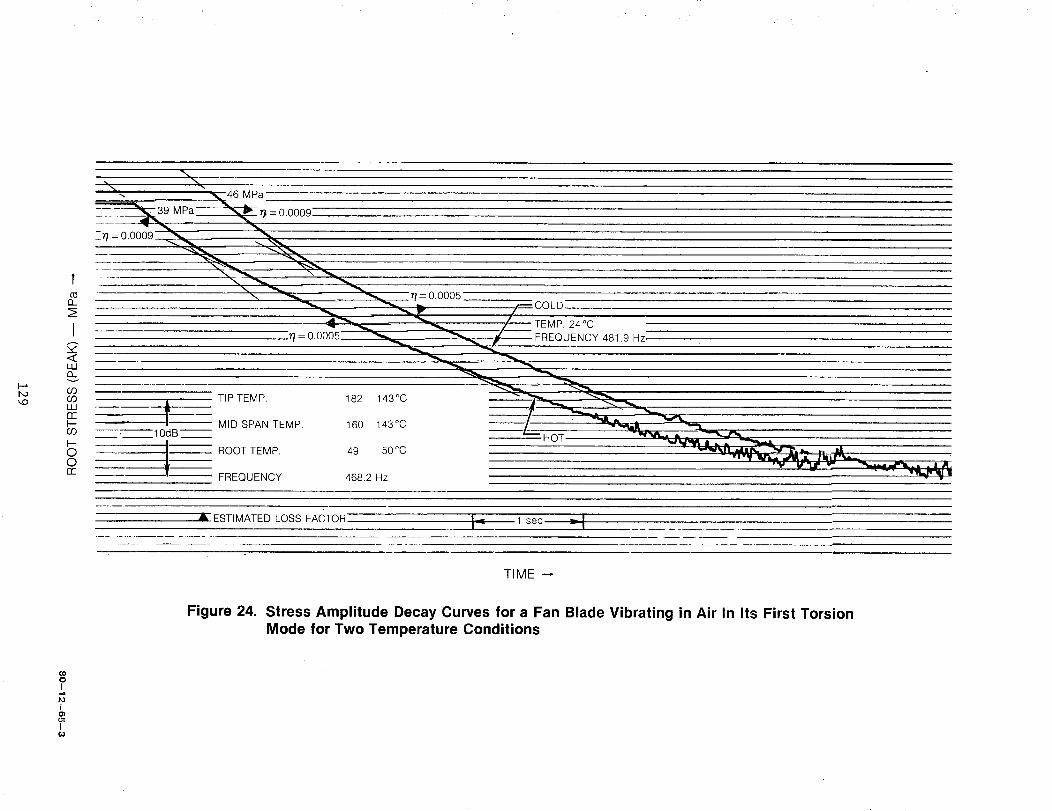
46 MPa
= 0.0009
t,o
f
o_
IY
iiio_v
O909Iiirr
CO
OOrr
:_10dB
TIP TEMP. 182 143°C
MID SPAN TEMP. 160 143°C
ROOT TEMP. 49 50°C
FREQUENCY 468.2 Hz
0.0005)LD
24°C
DUENCY 481.9 Hz
HO]
ESTIMATED LOSS FACTOR
TIME
Figure 24. Stress Amplitude Decay Curves for a Fan Blade Vibrating in Air In Its First TorsionMode for Two Temperature Conditions
¢0OI..t
I
ol
I
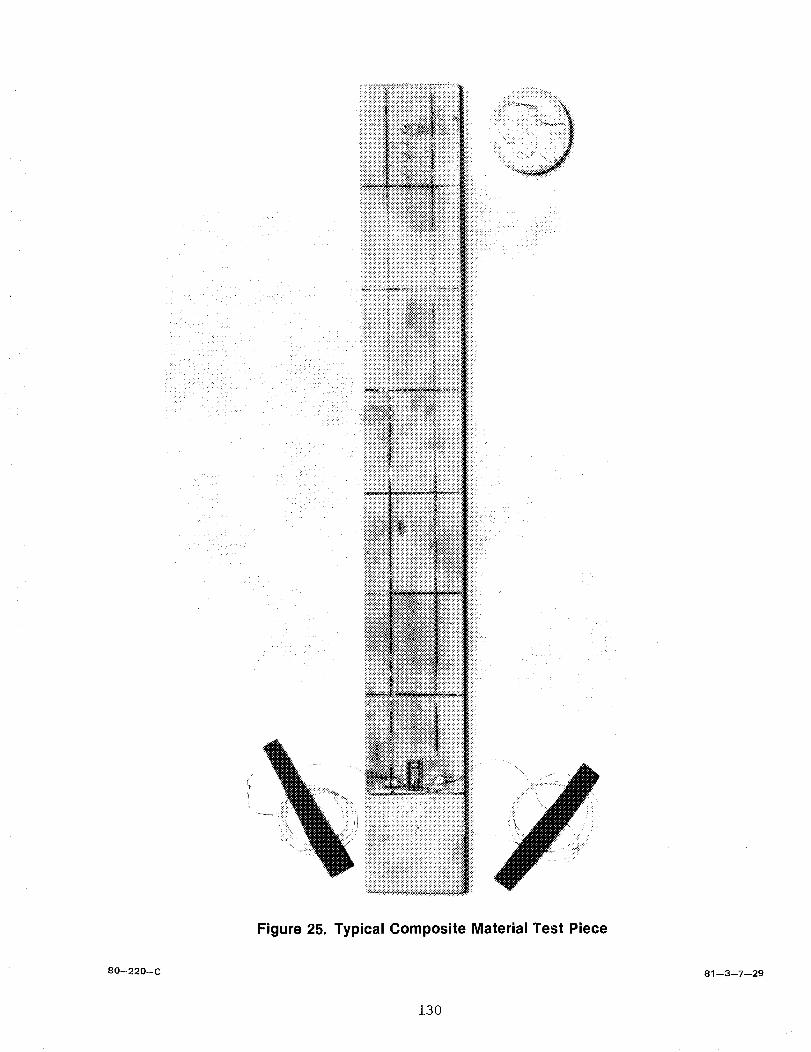
Figure 25. Typical Composite Material Test Piece
80--220--C 81--3--7--29
130
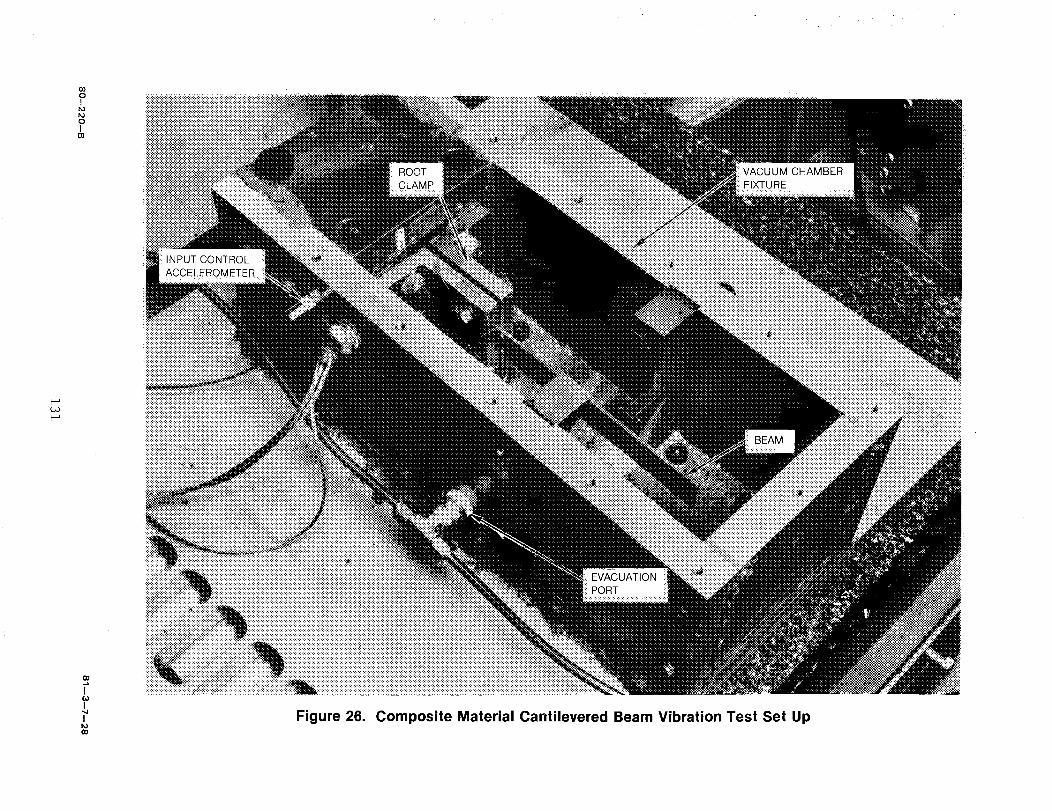
QOQI1,3
QI
GO
!G)
!
CO
Figure 26. Composite Material Cantilevered Beam Vibration Test Set Up
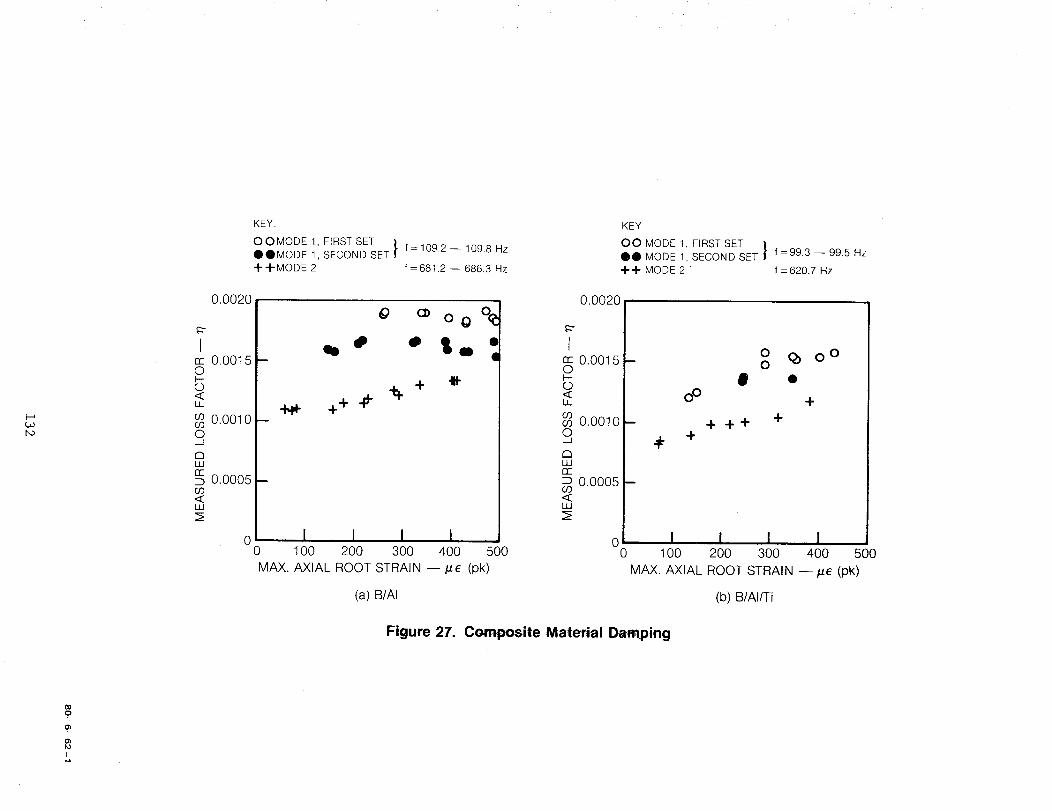
_ot,o
KEY:
OOMODE 1, FIRST SET} f=109.2 -- 109.8 Hz• •MODE 1, SECOND SET
4, 4.MODE 2 f=681.2 -- 686.3 Hz
0.0020
Irr 0.0015 --O
O<LL
co 0.0010 --coOJ
d3iii
0.0005 --cO<LU
4-_ ++ #aor +
I I I I0 100 200 300 400 500
MAX. AXIAL ROOT STRAIN --/_e (pk)
(a) B/AI
In-O
o<u_
cocoO_J
d3LUr_
CO<LLJ
KEY
OO MODE 1, FIRST SET I
• •MODE 1, SECOND SET _" f=99.3--99.5Hz
+4- MODE 2 " f =620.7 Hz
0.0020
0.0015
0.0010
0.0005
00
0 Q) 0 o0
• •o° +
4.
I I I I100 200 300 400 500
MAX. AXIAL ROOT STRAIN -- #e (pk)
(b) B/AI/Ti
Figure 27. Composite Material Damping
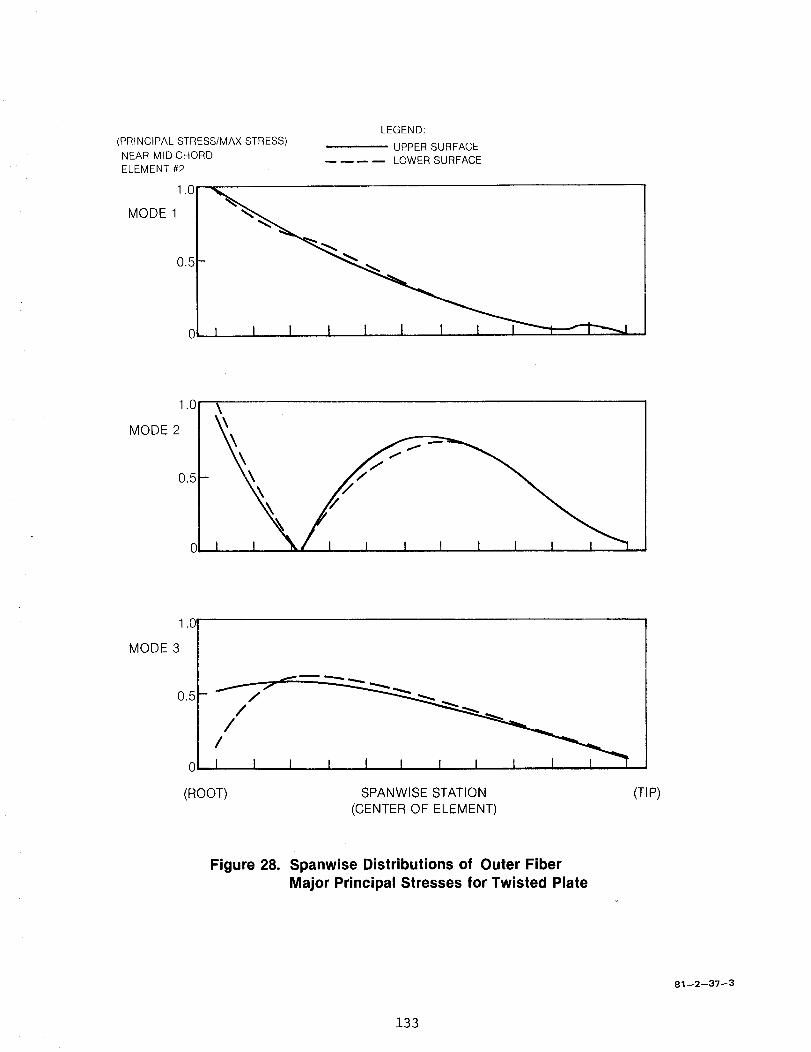
(PRINCIPAL STRESS/MAX STRESS)NEAR MID-CHORDELEMENT #2
1.0
MODE 1
0.. _
LEGEND:
UPPER SURFACELOWER SURFACE
I i I I I I I I I -"t---'-'f'_
1.0
MODE 2
0.5
\
1.0
MODE 3
0.5
0
(ROOT) SPANW,SESTAT,ON/CENTEROFE'EMENT/
(TIP)
Figure 28. Spanwise Distributions of Outer Fiber
Major Principal Stresses for Twisted Plate
81 --2--37--3
133
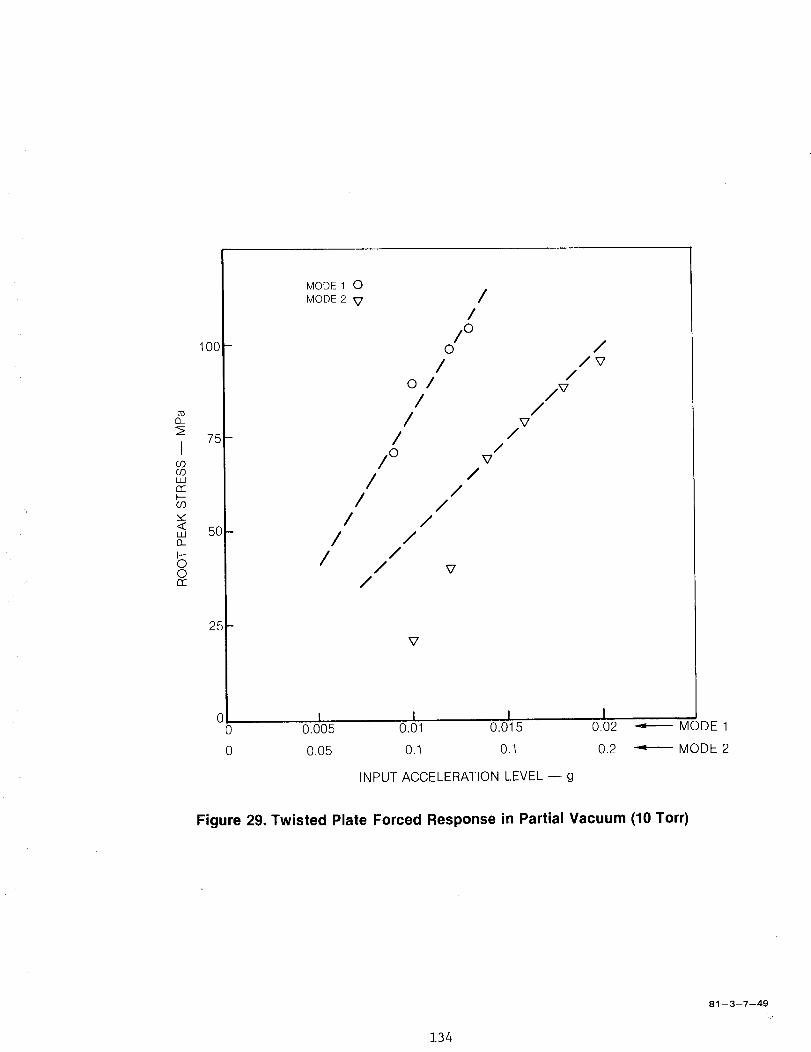
[3-
ICOCOLLIr'r-I.--O9
w".<LLIO-
I--OOrr
100
75
5O
25
00
0
MODE 10
MODE 2/
/
/oO
/o//
//
/o/
/ // /
/ // /
// / v
/
/
/v/
V/
/V
V
I II I0.005 0.01 0.015 0.02 _ MODE 1
0.05 0.1 0.1 0.2 _ MODE2
INPUT ACCELERATION LEVEL -- g
Figure 29. Twisted Plate Forced Response in Partial Vacuum (10 Torr)
134
81 --3--7--49
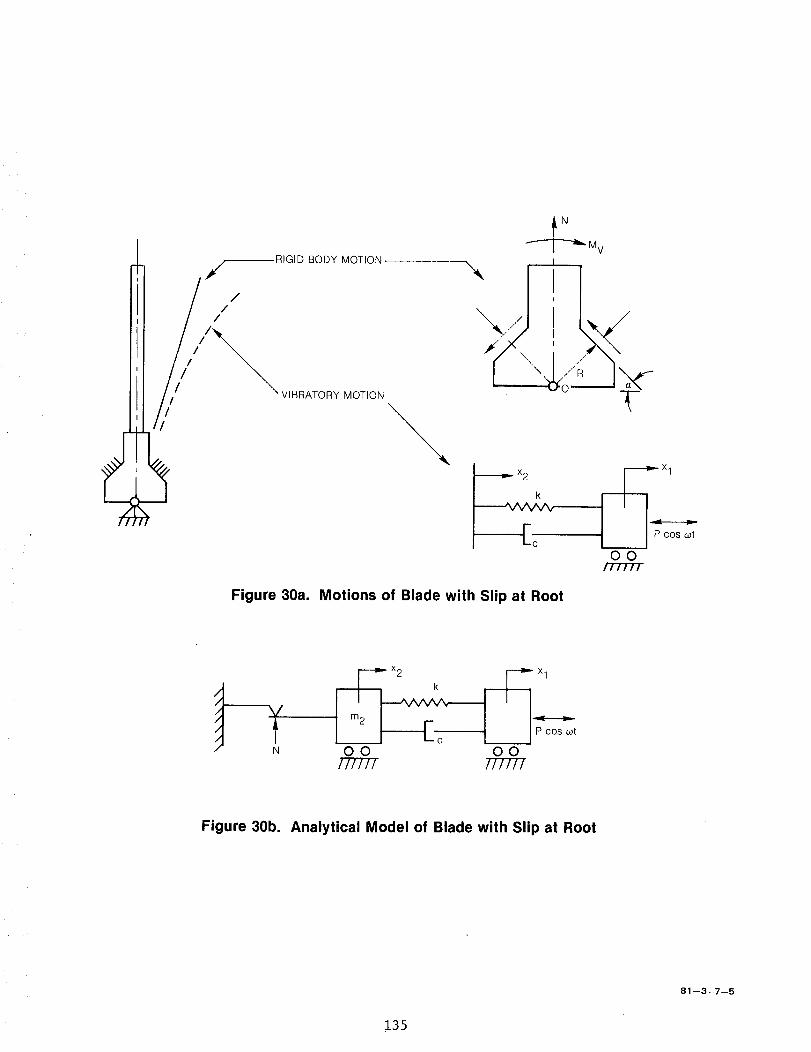
RIGID BODY MOTION
///
\ VIBRATORY MOTION
//
MV
_ x2
k
------<c
--_- x1
P cos c_t
OO/T/T/'T
Figure 30a. Motions of Blade with Slip at Root
OO OOFf'/T/7 777777
Figure 30b. Analytical Model of Blade with Slip at Root
81 --3--7--5
!35
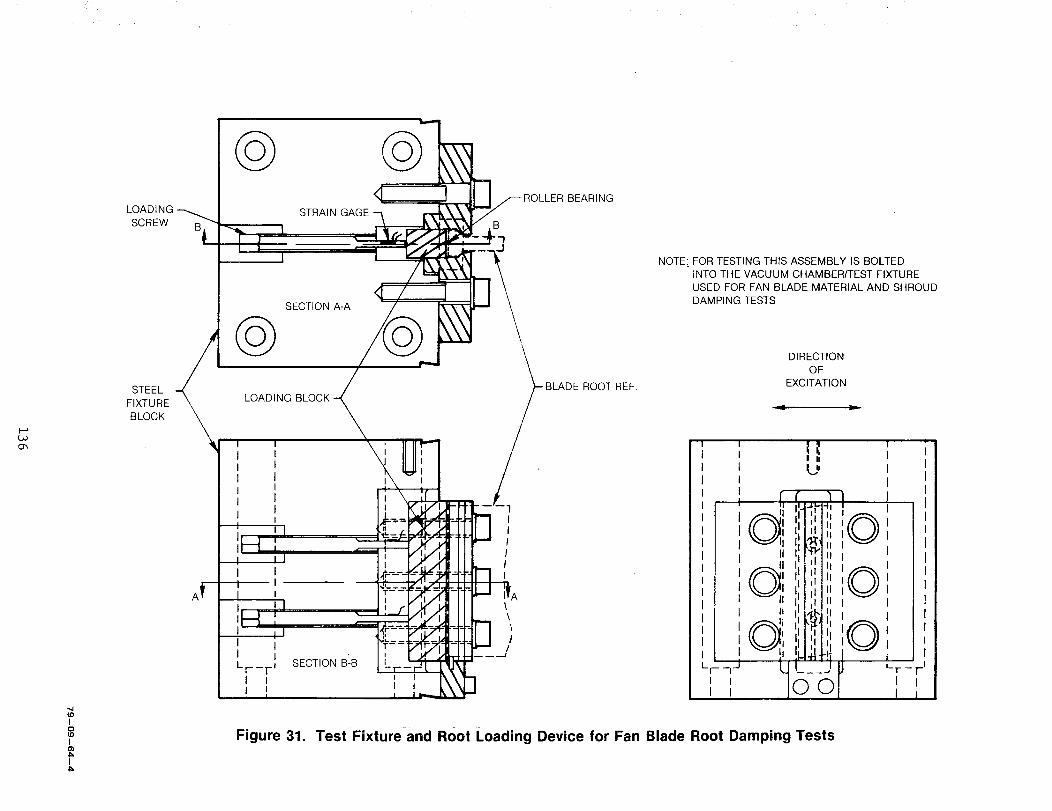
L,OO",
LOADINGSCREW
STEELFIXTUREBLOCK
©STRAIN GAGE
SECTION A-A
©LOADING BLOCK
SECTION B_BLr--f-JI iI l
0
BEARING
B
-)J
ROOT REF.
\
1/
NOTE- FOR TESTING THIS ASSEMBLY IS BOLTEDINTO THE VACUUM CHAMBER/TEST FIXTUREUSED FOR FAN BLADE MATERIAL AND SHROUDDAMPING TESTS
DIRECTIONOF
EXCITATION
LT-- rI II
Figure 31. Test-Fixture-and Root Loading Device for Fan Blade Root Damping Tests
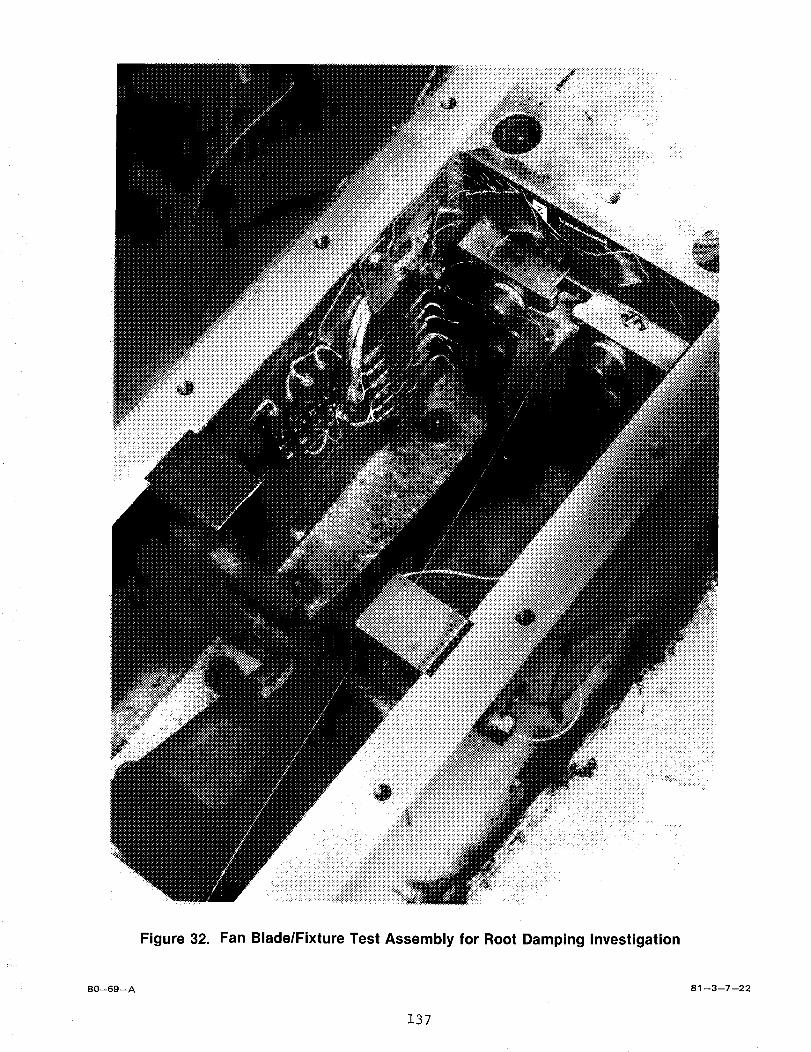
Figure 32. Fan Blade/Fixture Test Assembly for Root Damping Investigation
80--69--A 81 --3--7--22
137
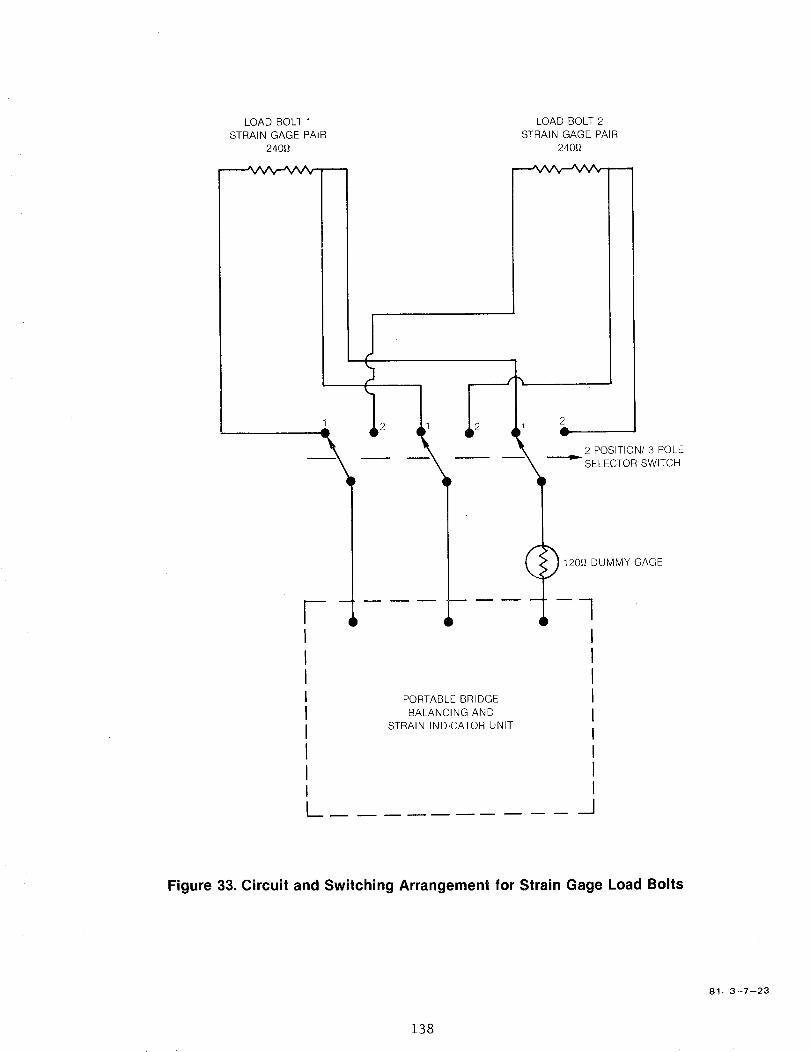
LOAD BOLT 1
STRAIN GAGE PAIR
240_
1 2A
-X
LOAD BOLT 2
STRAIN GAGE PAIR
2401}
-_vvv-,kzv_,- --
2
@
2 POSITION/ 3 POLE
SELECTOR SWITCH
IIIIIIIII
L_ _
PORTABLE BRIDGE
BALANCING AND
STRAIN INDICATOR UNIT
) 120_ DUMMY GAGE
Figure 33. Circuit and Switching Arrangement for Strain Gage Load Bolts
81 --3--7--23
138
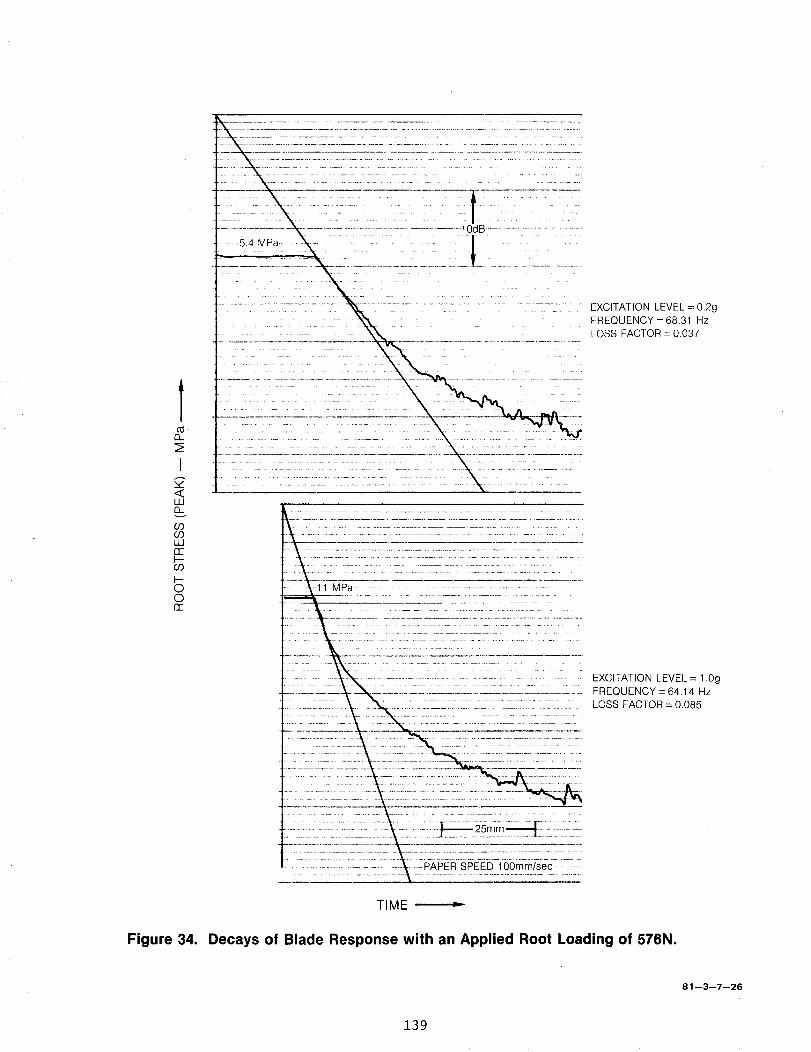
tn
I",,/<_uJD_v
O9COLUrr
CO
H-OOn-
Figure 34.
....i:- __::__-_....i_-::t.....10dB ...........................
5.4 MPa
--11MPa ....................................................
.... --.---- EXCITATION LEVEL=0.2g
FREQUENCY =68.31 Hz
LOSS FACTOR = 0.037
EXCITATION LEVEL = 1.0g
FREQUENCY = 64.14 Hz
LOSS FACTOR = 0.085
TIME
Decays of Blade Response with an Applied Root Loading of 576N.
81--3--7--26
139
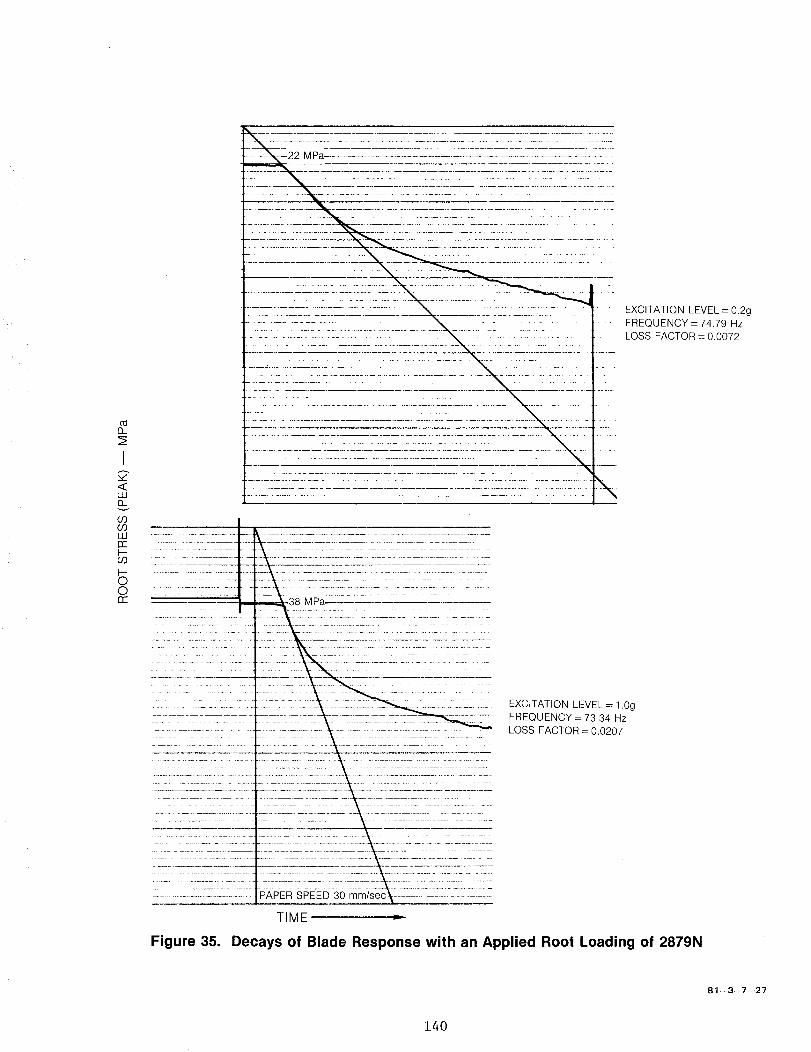
£L
<r.LLI13_v
6OCOIiirrI--CO
t--00rr
EXCITATION LEVEL = 0.2g
FREQUENCY = 74.79 Hz
LOSS FACTOR = 0.0072
-38 MPa,
EXCITATION LEVEL = 1.0g
FREQUENCY = 73.34 Hz
LOSS FACTOR = 0.0207
TIME
Figure 35. Decays of Blade Response with an Applied Root Loading of 2879N
81 °-3--7--27
140
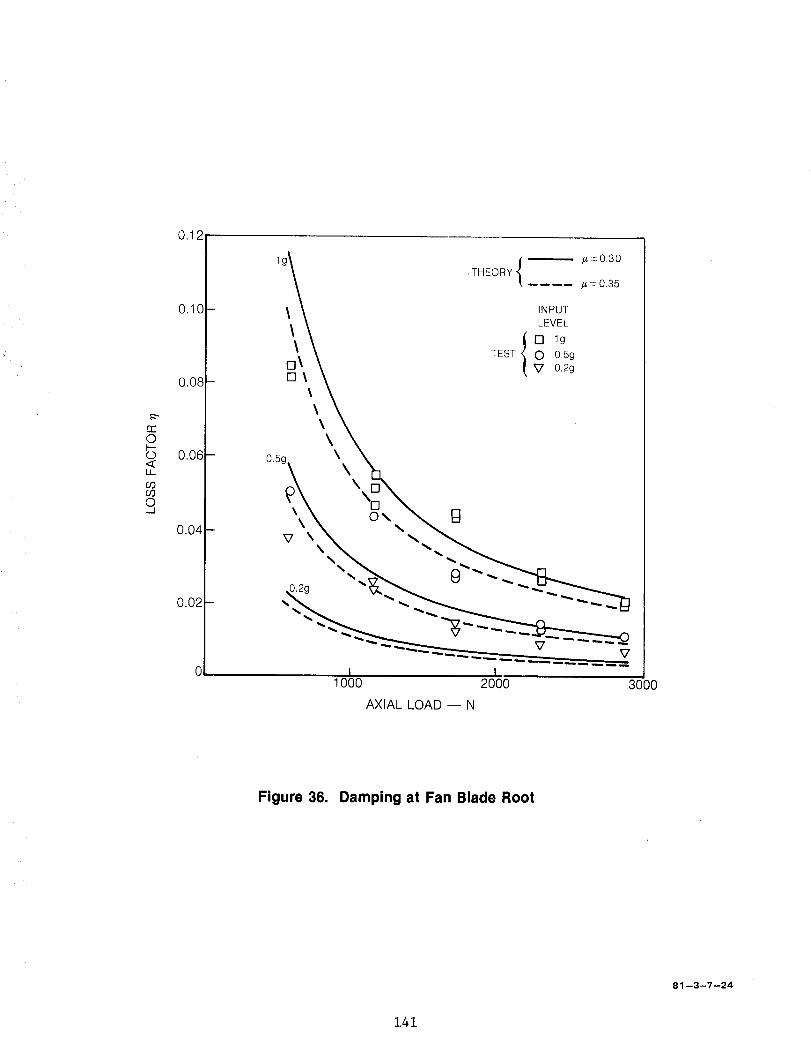
0.12
0.10
0.08
rroI--
0 0.06LL.
q0.04
0.02
.THEORY { ....
AXIAL LOAD -- N
Figure 36. Damping at Fan Blade Root
81 --3--7--24
141
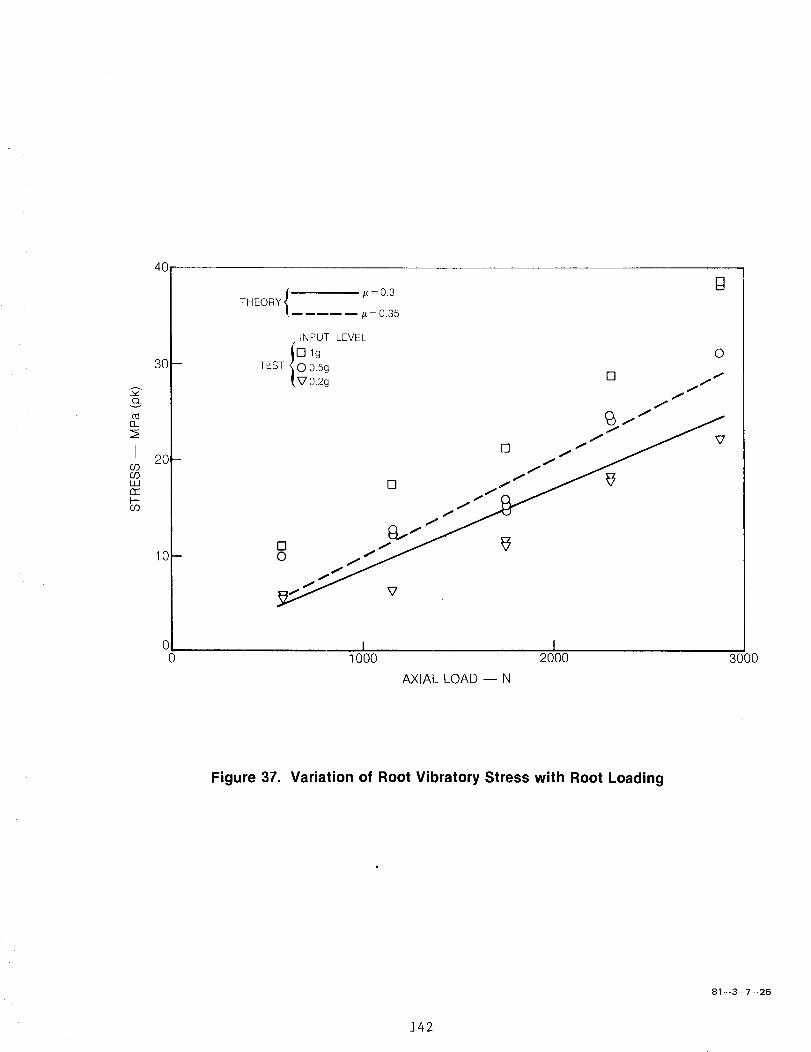
4O
o_v
EL
IO9COLLIrrI--CO
30-
20-
10-
00
/z = 0.3THEORY
/_ = 0.35
B
INPUT LEVEL
_i'q lg O
TEST <jO 0.5g I
[_0.2g [] fff
.I
©
I I1000 2O00
AXIAL LOAD -- N
3000
Figure 37. Variation of Root Vibratory Stress with Root Loading
81 --3--7--25
142
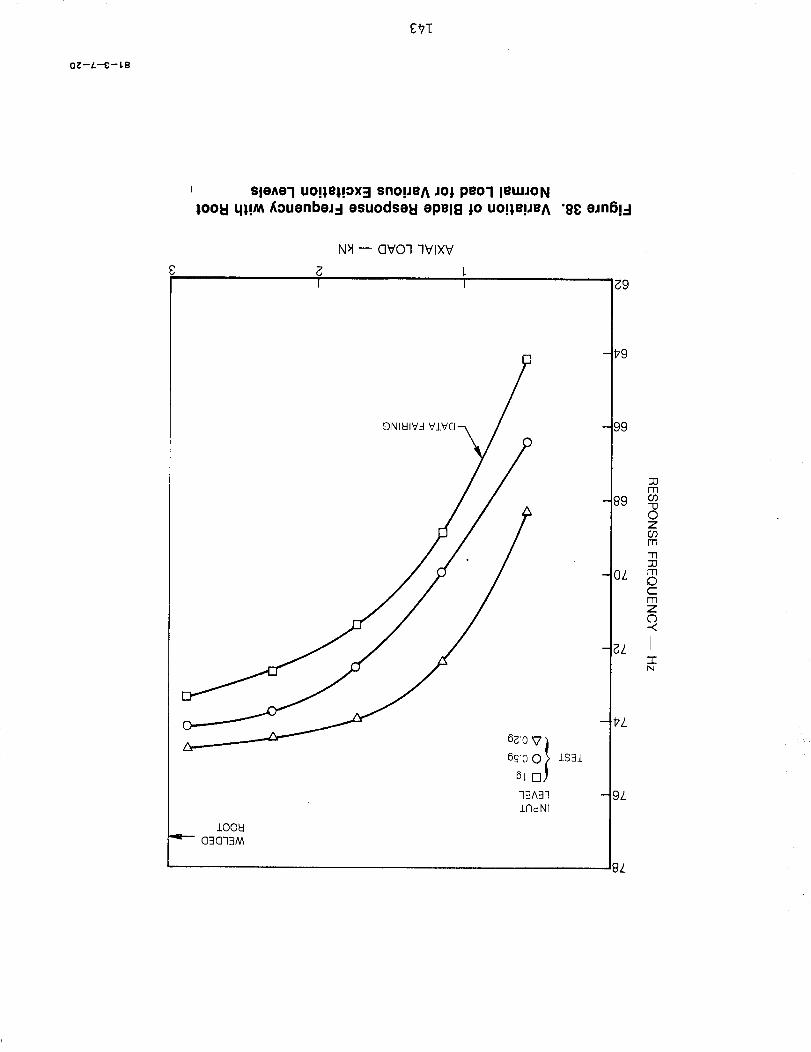
O_--L--C--I,8
I sis^el uop, el!ox3 snopeA Joj peo-I leuJJoNJ,OOl:l ql!M _ouenbeJ:l esuodseH epel8 jo uop, epeA "8g eJn6!_-I
N_t -- GVOI -IVlXV
I I
79A:17
lrTdNI
1001:1
(]3(]79M
1S31
_9
_,9
99
33m
_90Z03r"n
77
OZ mOCmZ0
az I7-N
_Z
9Z
8Z
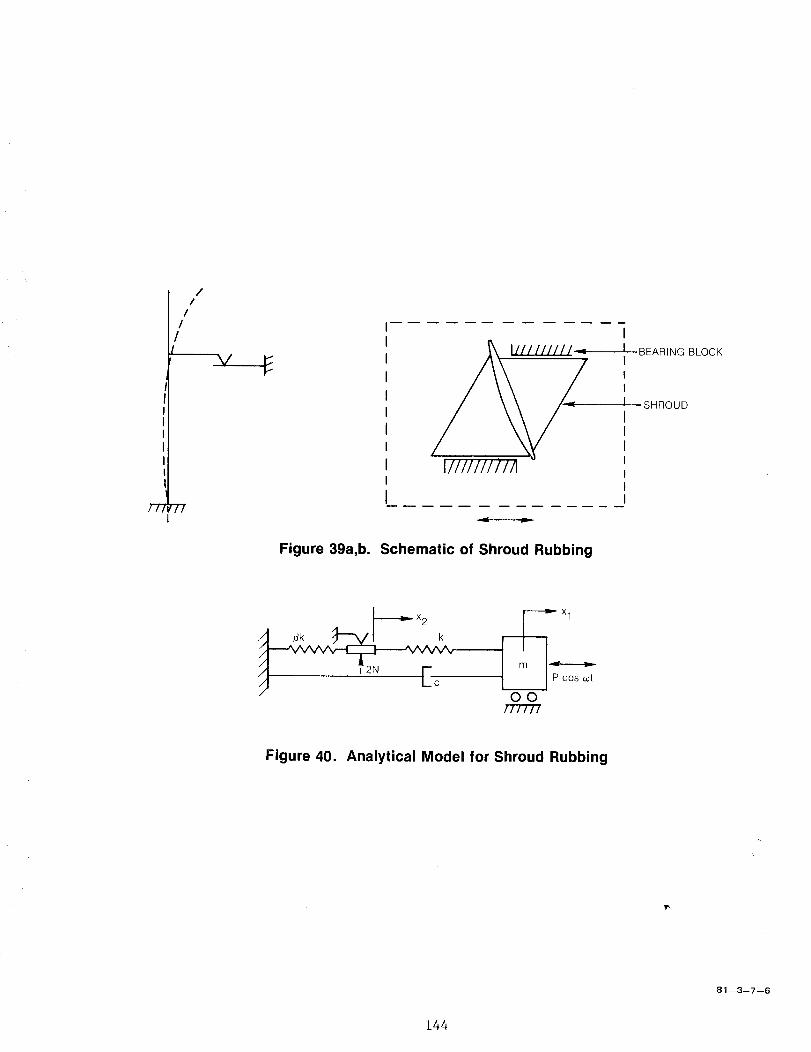
7"7
//
//
/
L----v
77
Figure 39a,b.
I/i/i/I/HA
Schematic of Shroud Rubbing
BEARINGBLOCK
SHROUD
Ec
-_-_- x1
P cos c_t
OOrT"7"7"T7
Figure 40. Analytical Model for Shroud Rubbing
81--3--7--6
144
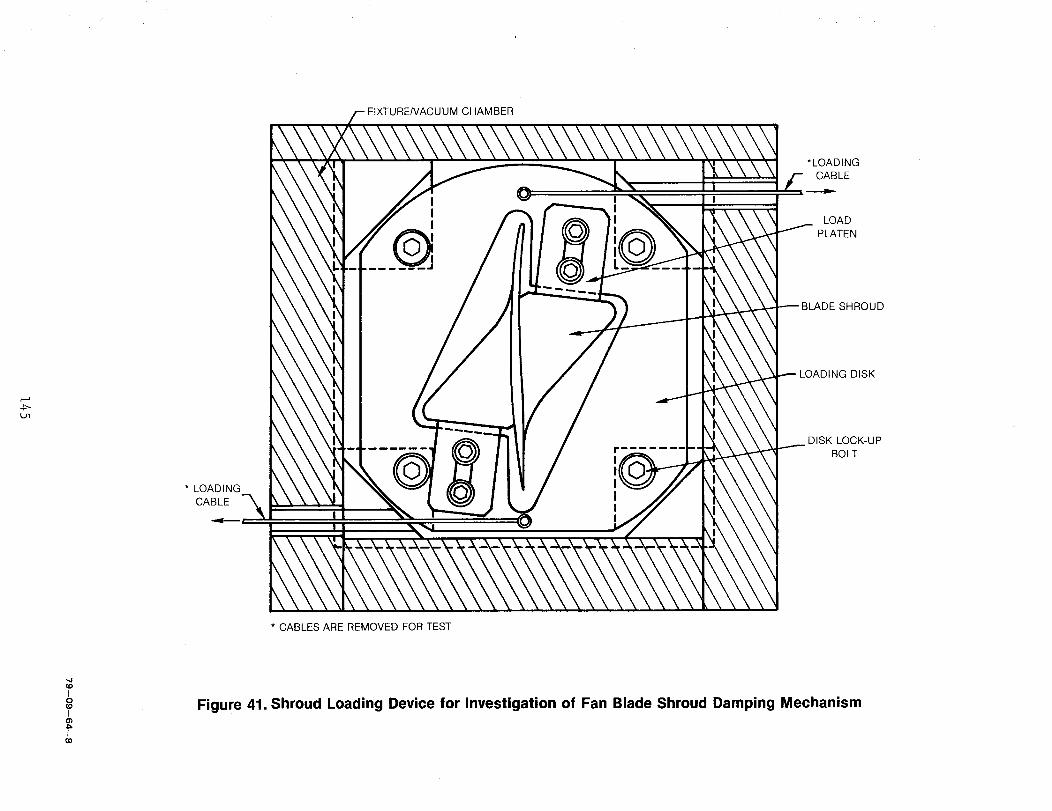
* LOADING
CABLE
FIXTURE/VACUUM CHAMBER
* CABLES ARE REMOVED FOR TEST
*LOADING
CABLE
LOAD
PLATEN
BLADESHROUD
LOADING DISK
DISK LOCK-UP
BOLT
Io
Io3
I60
Figure 41. Shroud Loading Device for Investigation of Fan Blade Shroud Damping Mechanism
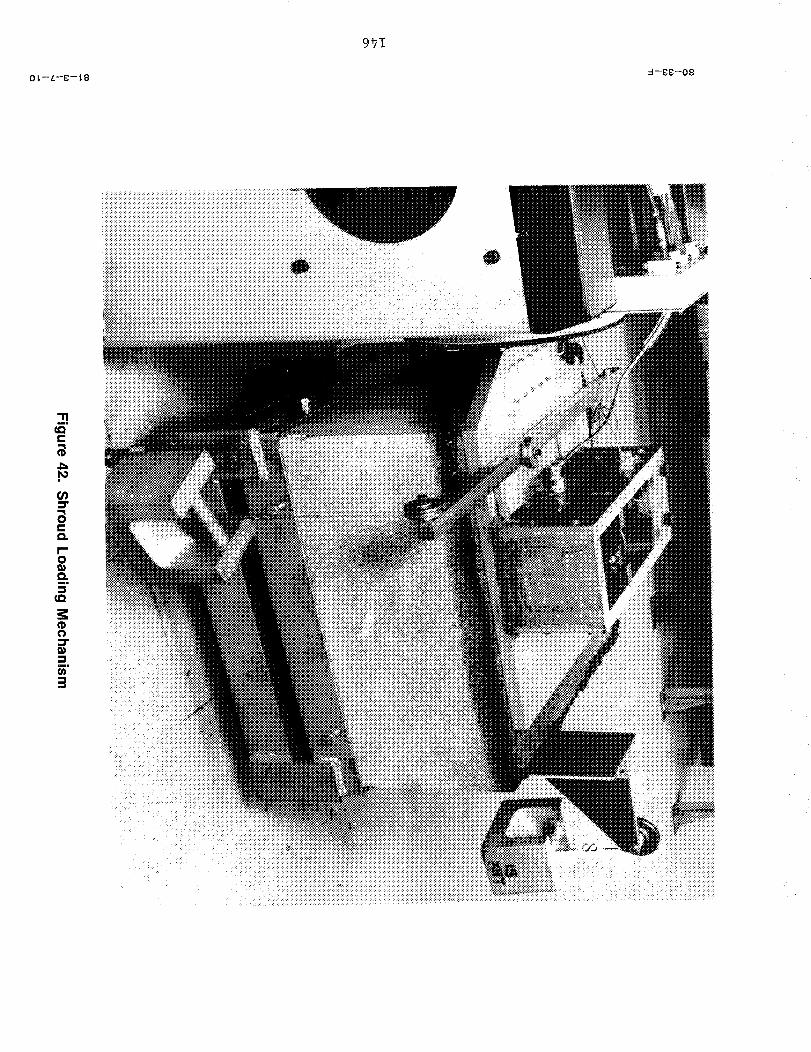
0 I,--L--E--t8
9_7T
--88--08
"nm,
_Q
(D
r_
=r
0e-Q.
r"09}Q.m,
0
3
_iiliii_iiiiiiiiiiiiiiiiiiiiiiiiiiiiiiiiiiiiiiiiiiiiiiiiiiiiiiiiiiiiiiiiiiiiiiiiiiiiiiiiiiiiiiiiiiiiiiiiiiiiiiiiiiiiiiiiiiiiiiiiiiiiiiiiiiiiiiiiiiiiiiiiiiiiiiiiiiii_ii_iii!iiii_!i_iiiiiii_i_!!i_iii_i!i,!_!_i_ii!iill_!:i!ilii!!_:
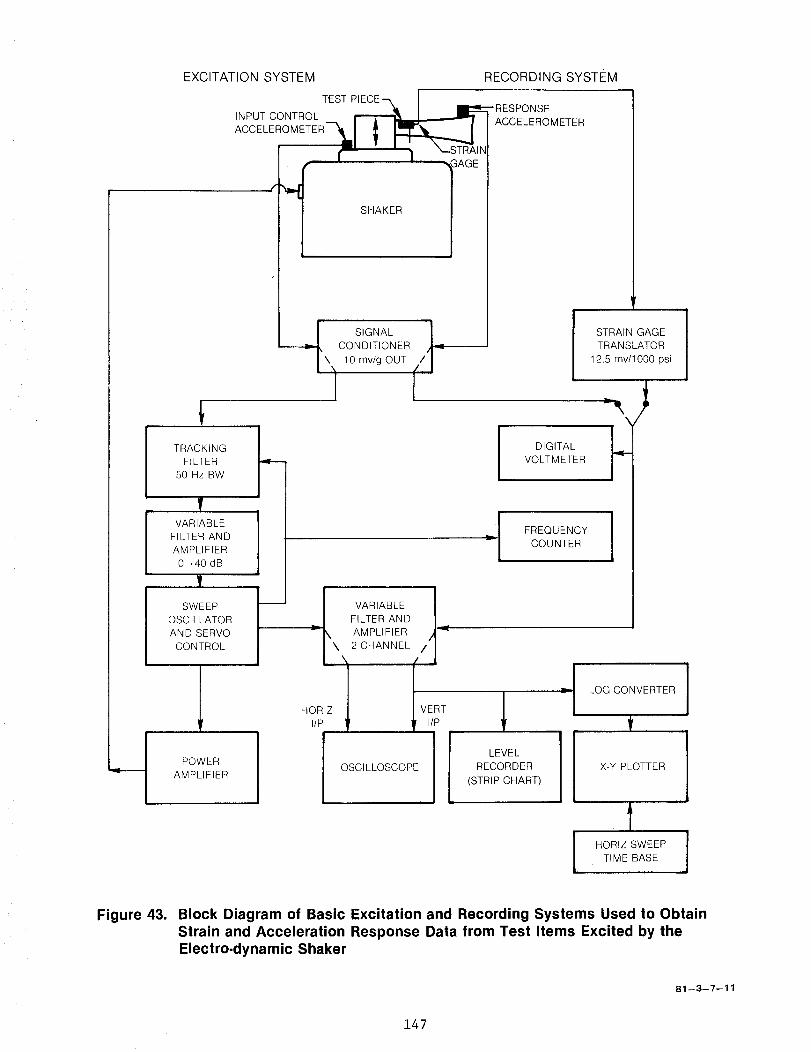
EXCITATION SYSTEM
TEST PIECE-m II _RESPONSE
INPUT CONTROL _._'_. _ I ACCELE
ACCELEROMETER ROMETER
, ['-- I STRAIN
TRACKING
FILTER
50 Hz BW
fVARIABLE
FILTER AND
AMPLIFIER
0- 40 dB
SWEEP
OSCILLATOR
AND SERVO
CONTROL
POWER
AMPLIFIER
SHAKER
SIGNAL 1h_
-- CONDITIONER
RECORDING SYSTEM
HORIZ
I/P
VARIABLE I
FILTER AND I
AMPLIFIER ,_-q
2 CHANNEL /|
OSCI LLOSCOPE 1
DIGITAL
VOLTMETER
._[ FREQUENCYCOUNTER
GAGE
LEVEL
RECORDER
(STRIP CHART)
STRAIN GAGE
TRANSLATOR
12.5 mv/1000 psi
1
LOG CONVERTER
X-Y PLOTTER
HORIZ SWEEPTIME BASE
Figure 43. Block Diagram of Basic Excitation and Recording Systems Used to Obtain
Strain and Acceleration Response Data from Test Items Excited by the
Electro-dynamic Shaker
81 -:-3--7-- 11
147
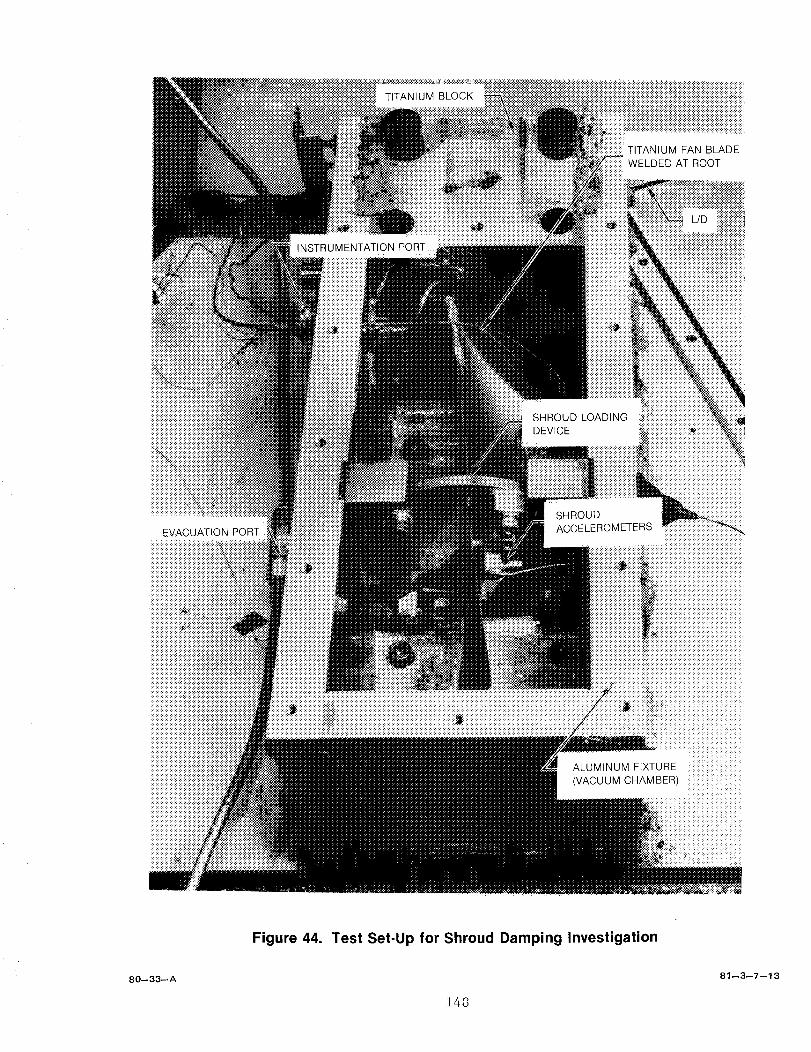
TITANIUM FAN BLADE
WELDED AT ROOT
EVACUAT ON PORT
ALUMINUM FIXTURE
(VACUUM CHAMBER)
80--33--A
Figure 44. Test Set-Up for Shroud Damping Investigation
148
81_3--7--13
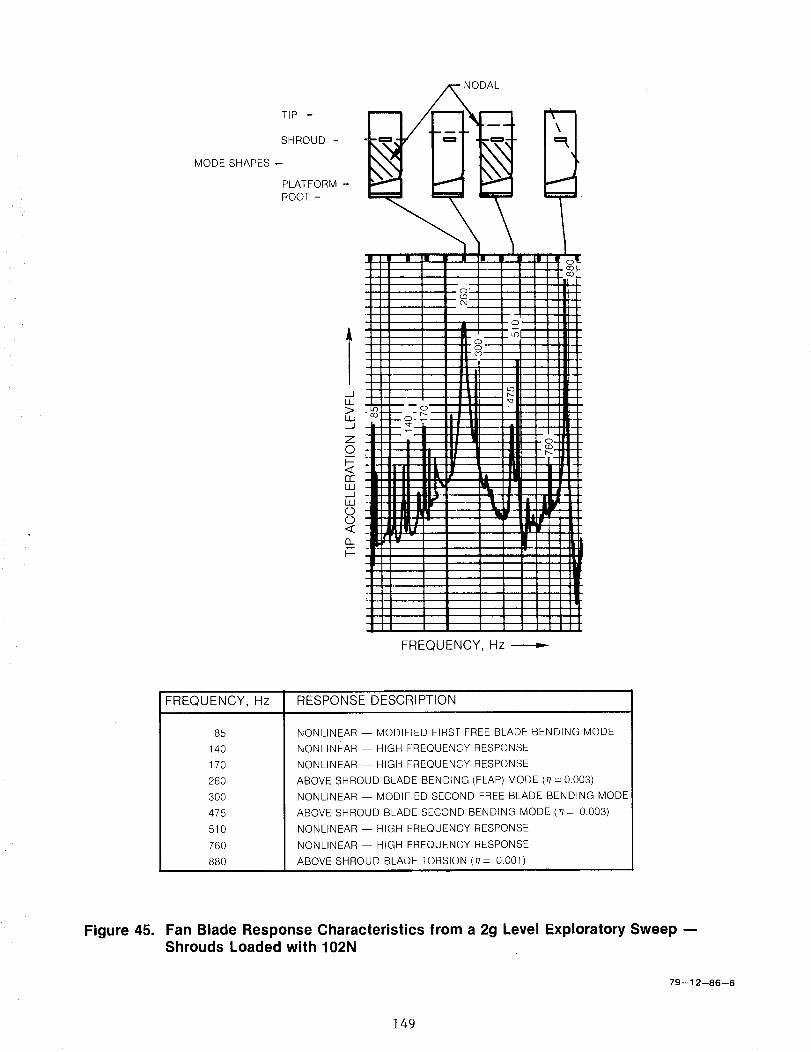
TIP- J
SHROUD- IMODESHAPES-IPLATFORM -
ROOT -
NODAL
• I
I I
II
-j:uJ>uJ.J
Zo
rruJ._JELIO©<
n
IIIi
i
zlz: _
I
i, ,iII nI| IiII IS .
II il I |
Bill l III Ill P
II IEI i •
_u,,v
iJ
I!!1
FREQUENCY, Hz
FREQUENCY, Hz RESPONSE DESCRIPTION
85
140
170
26O
3OO
475
510
76O
88O
NONLINEAR -- MODIFIED FIRST FREE BLADE BENDING MODE
NONLINEAR -- HIGH FREQUENCY RESPONSE
NONLINEAR -- HIGH FREQUENCY RESPONSE
ABOVE SHROUD BLADE BENDING (FLAP) MODE (11=0.003)
NONLINEAR -- MODIFIED SECOND FREE BLADE BENDING MODE
ABOVE SHROUD BLADE SECOND BENDING MODE (11= 0.003)
NONLINEAR -- HIGH FREQUENCY RESPONSE
NONLINEAR -- HIGH FREQUENCY RESPONSE
ABOVE SHROUD BLADE TORSION (r_= 0.001)
Figure 45. Fan Blade Response Characteristics from a 2g Level Exploratory Sweep --Shrouds Loaded with 102N
79--12--86--6
149
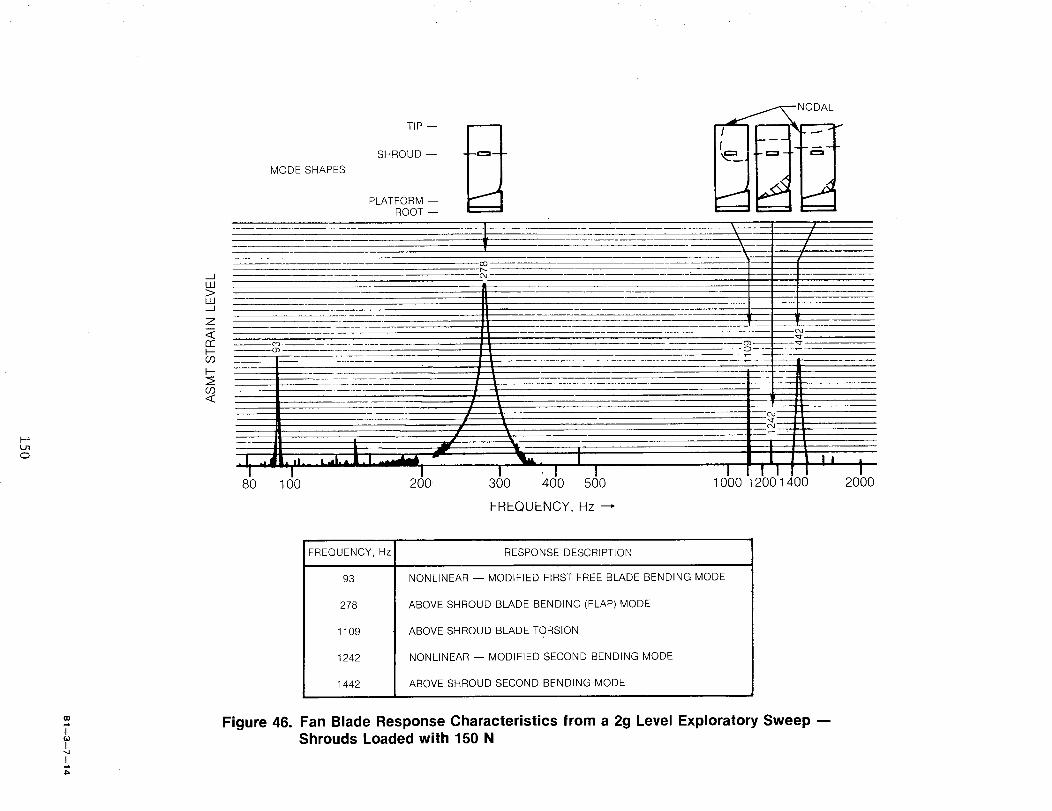
LnO
.JUJ
UJ_J
Z
<rrb-CO
F-
CO<
MODE SHAPES
TIP --
SHROUD --
PLATFORM --ROOT --
-O4
I
O4
- -C
O4
tI I I
80 100 200 300 400 500 1000 12001400 2000
FREQUENCY, Hz -_
FREQUENCY, Hz RESPONSE DESCRIPTION
93
278
1109
1242
1442
NONLINEAR -- MODIFIED FIRST FREE BLADE BENDING MODE
ABOVE SHROUD BLADE BENDING (FLAP) MODE
ABOVE SHROUD BLADE TORSION
NONLINEAR -- MODIFIED SECOND BENDING MODE
ABOVE SHROUD SECOND BENDING MODE
t_
I60
I
Figure 46. Fan Blade Response Characteristics from a 2g Level Exploratory Sweep --Shrouds Loaded with 150 N
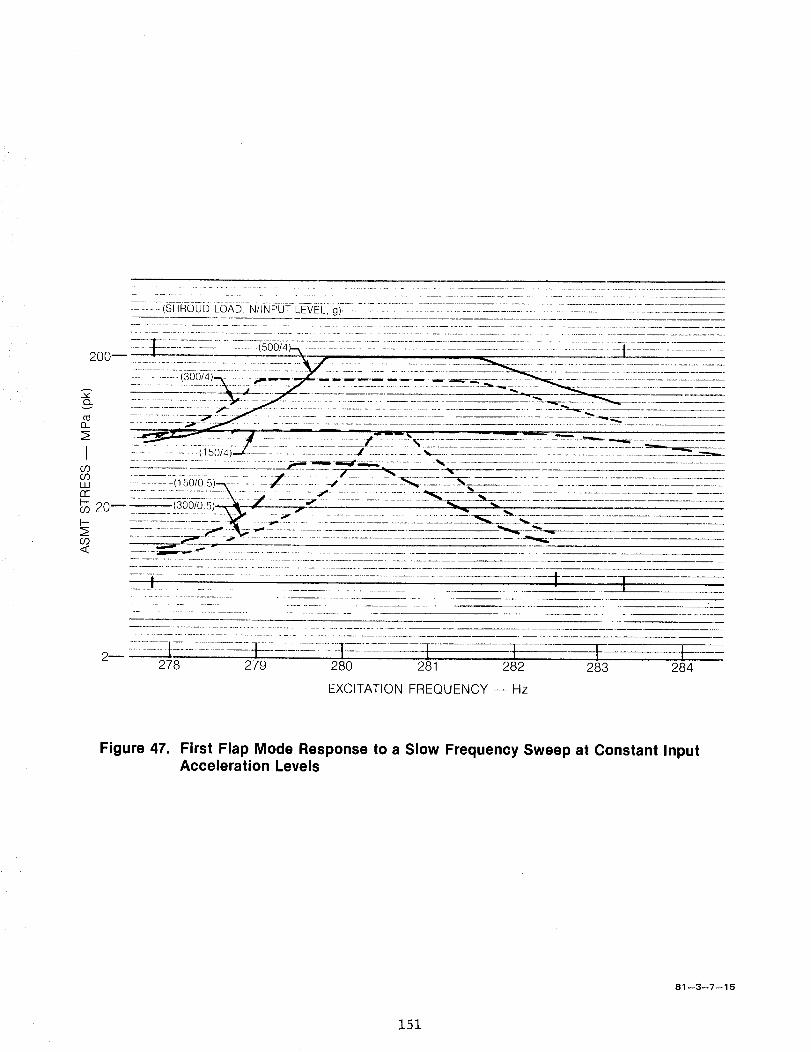
...... (SHROUD LOAD, N/INPUT LEVEL, g) ....................................................
__ ........ - -..._.. .......................................... -._ _,,___ : ..................................
v :::.:z:::::---:.-- :_:. "'..::.__.: :::::...-:- - :_:::::::::::::::::::::::::::::-::::----_-_:.-:-..: ::-- -'._-< ................
J ............ (150t4)--Z ....................... A ............ _ ............................. L_Z_:__:-__L--______--...-.._...................................... _ i,= _t'_ .............. _, .....................................................
couJ .......... (_50/0.5)--_.......... _/__.L_:.:::.L4 T_-: :_..2____:.--:..... 2_2-.__:_ ......... Z:::T_:_-. .... --_2_L.... _.......i-
I'-- _(300/0.5)-_ _ -I I "'" _ "_ -"-CO 20 ........................... s ....................................... _"............t..- ............. "_-_- .......,,,'- .................................... _ -_- .... --
CO _ -_'.--.---._, .................
-_]:: ..........................:-:L::-_--_:-::_-i-_: ::__- ................. ,- .....1 ...... I
278 279 280 281 282 283 284
EXCITATION FREQUENCY -- Hz
Figure 47. First Flap Mode Response to a Slow Frequency Sweep at Constant InputAcceleration Levels
81--3--7--15
151
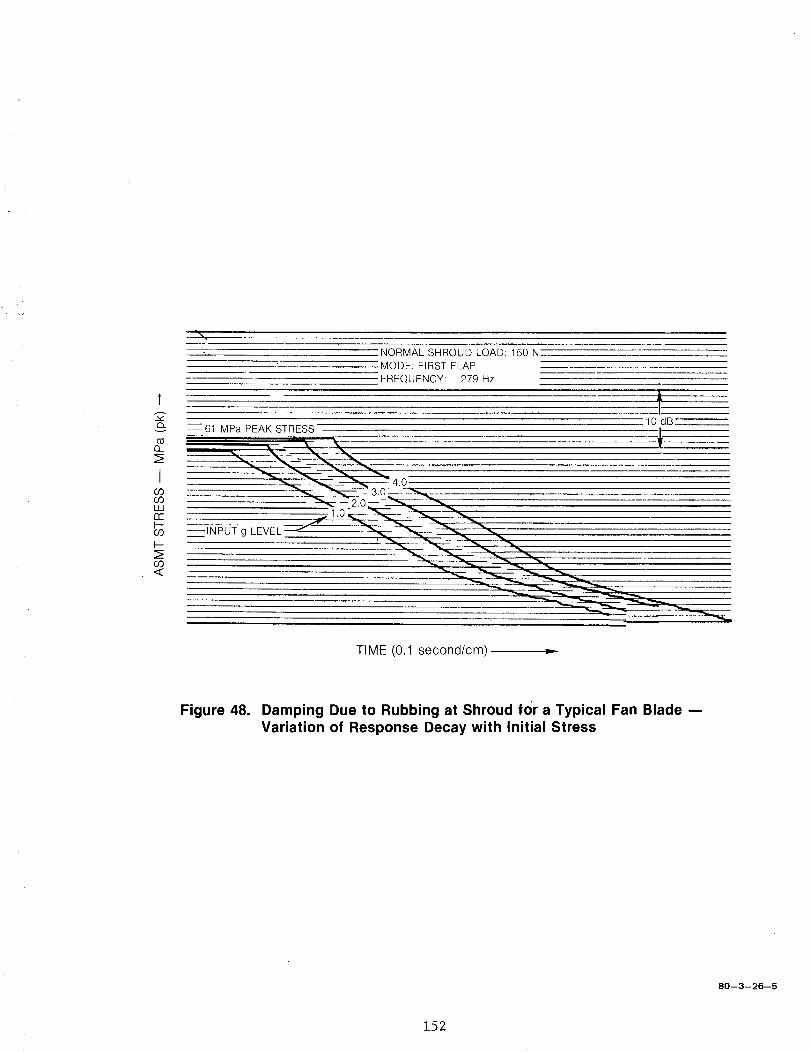
- =%'4
NORMAL SHROUD LOAD: 150 N
MODE: FIRST FLAP
FREQUENCY: 279 Hz
10 dB
<(
TIME (0.1 second/cm)
Figure 48. Damping Due to Rubbing at Shroud for a Typical Fan Blade --
Variation of Response Decay with Initial Stress
80--3--26--5
152
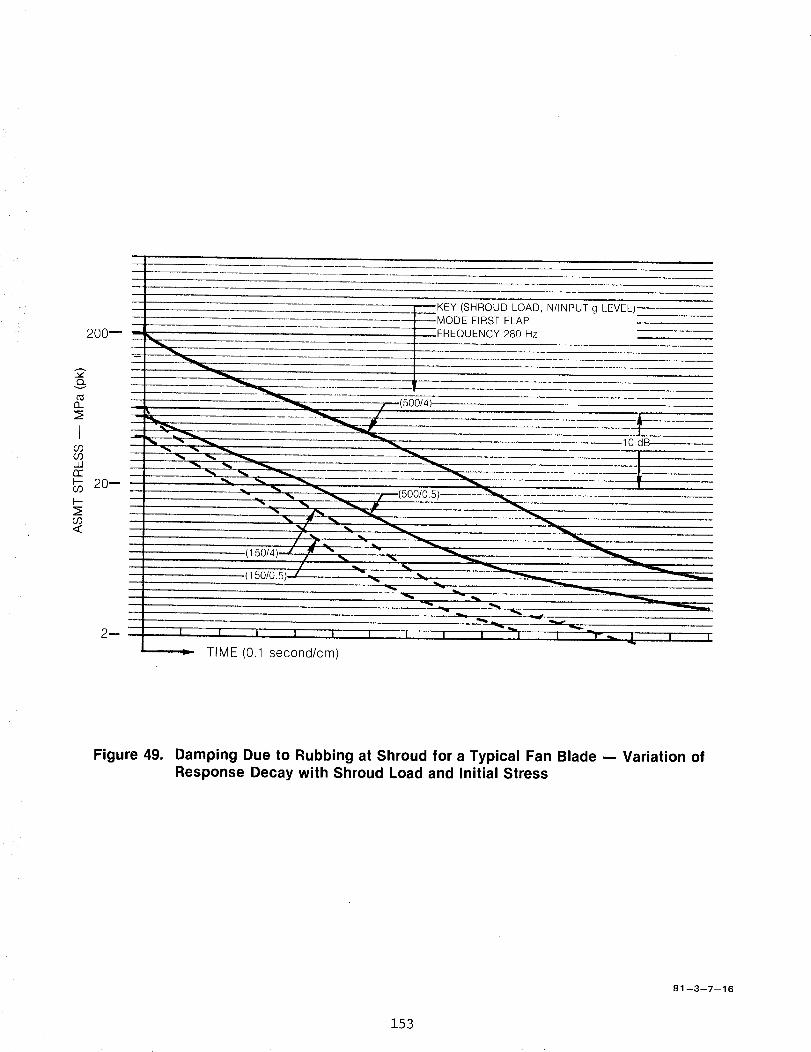
200--
| KEY (SHROUD LOAD, N/INPUT g LEVEL)
_____MODE FIRST FLAP
FREQUENCY 280 Hz
el..
IcO69iiicrF-cO
o9<
20--
2_
TIME (0.1 second/cm)
Figure 49. Damping Due to Rubbing at Shroud for a Typical Fan Blade -- Variation of
Response Decay with Shroud Load and Initial Stress
81 --3--7--16
153
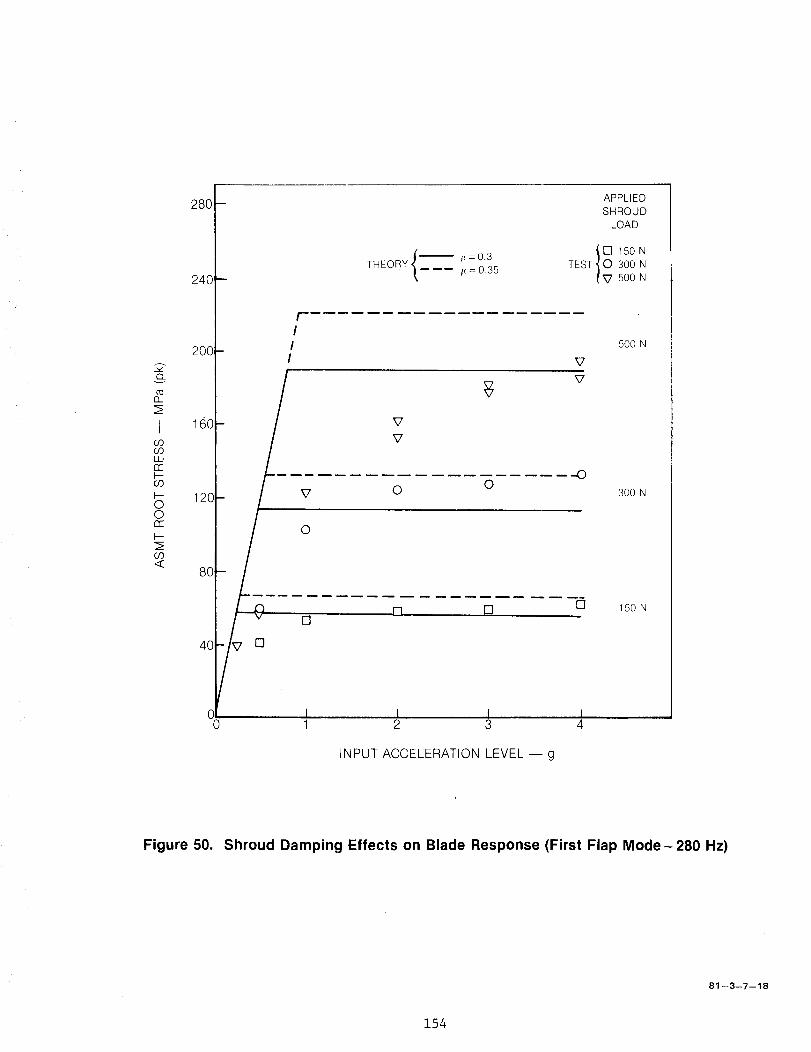
o_
13_:s
Icoo9uJr"r-I--oo
I.-OOr'r
I..--
o9<
I
280;
240'
200
16o
120
8O
40
THEORY
fIII
A
APPLIED
SHROUD
LOAD
13 150NTEST O 300 N
_7 500 N
V
_7
V
_7
..O
500 N
V O O 300 N
O
13[] E_ E] 150 N
0 I I I I0 1 2 3 4
INPUT ACCELERATION LEVEL -- g
Figure 50. Shroud Damping Effects on Blade Response (First Flap Mode-280 Hz)
81 --3--7--18
154
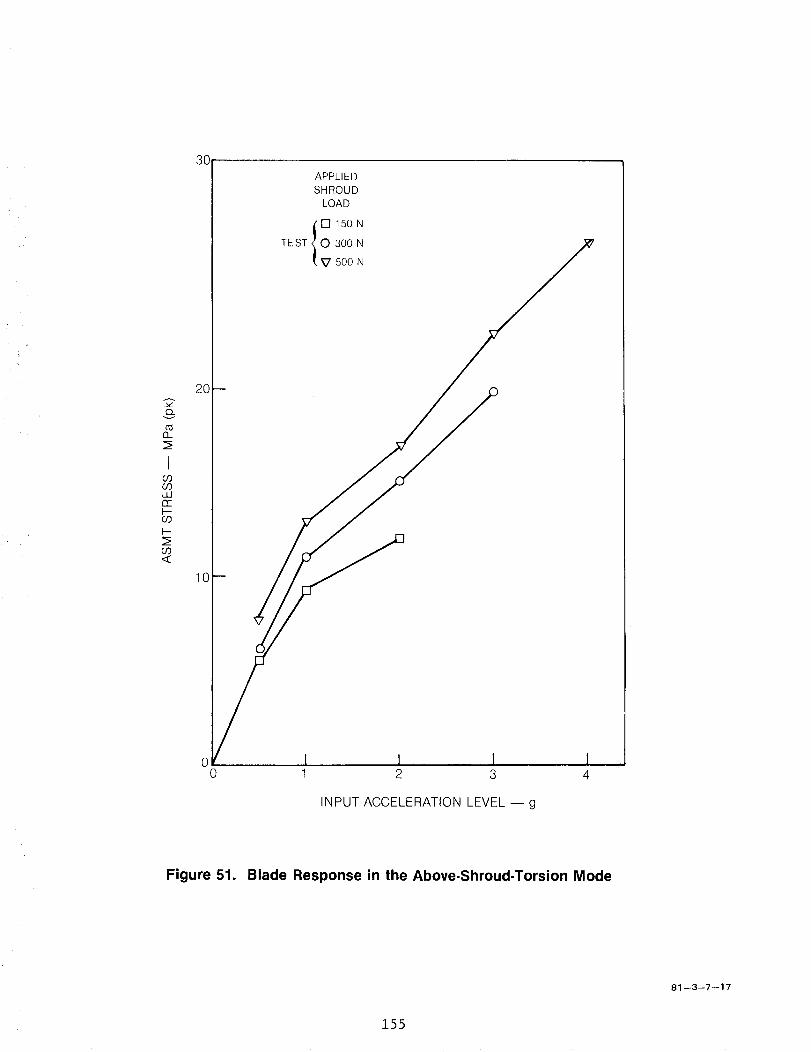
3°I APPLIED
SHROUD
LOAD
! 150 NTE ST 300 N
500 N
10
o I 1 10 1 2 3 4
INPUT ACCELERATION LEVEL -- g
Figure 51. Blade Response in the Above-Shroud-Torsion Mode
81--3=7--17
155
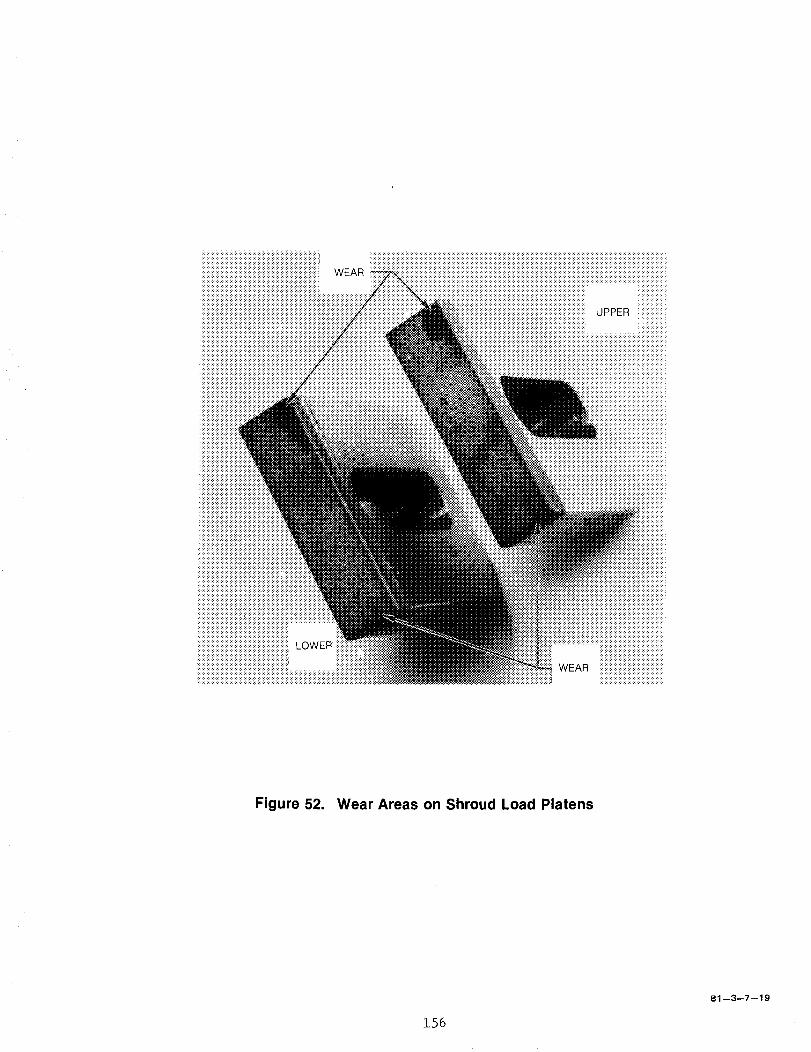
Figure 52. Wear Areas on Shroud Load Platens
156
81--3--7--19
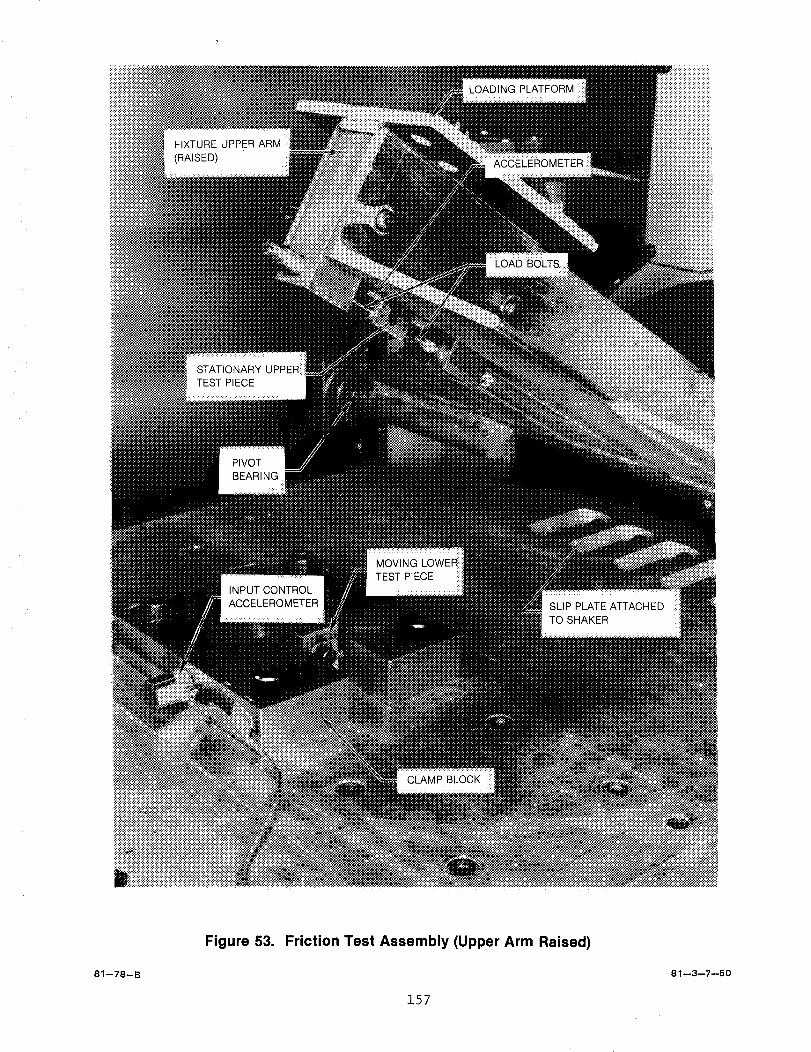
81--78--B
Figure 53. Friction Test Assembly (Upper Arm Raised)
157
81--3--7--50
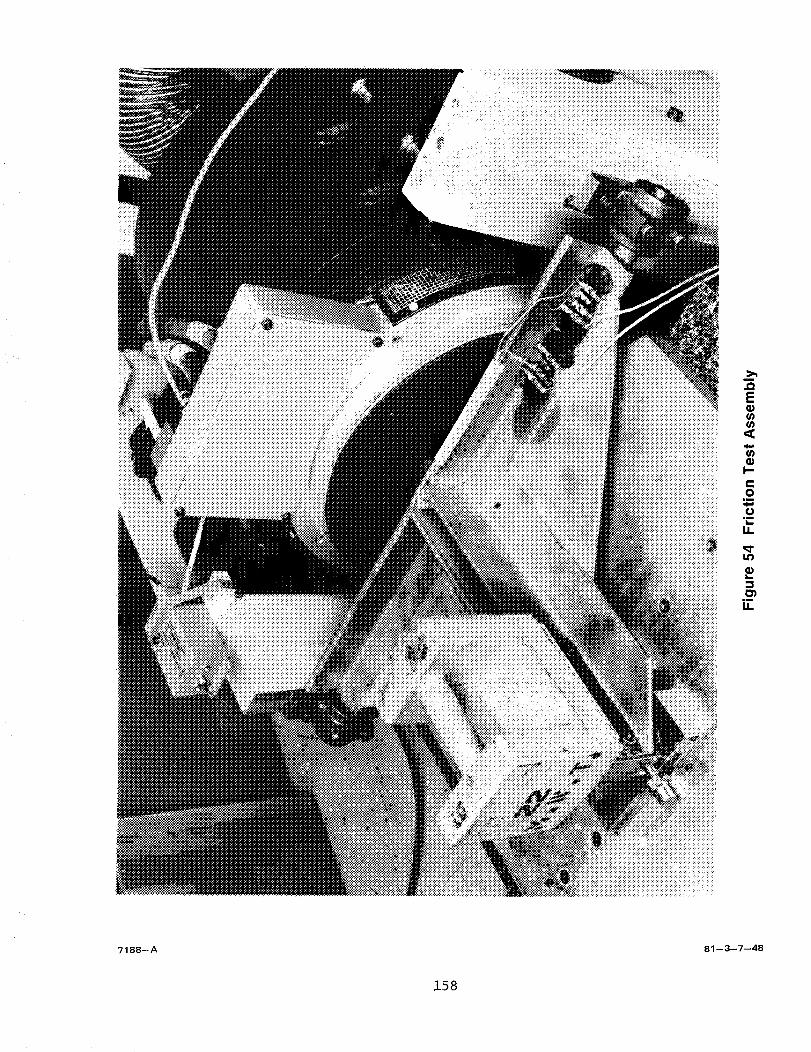
%_i__i17- _ ....
,.QE
(n
tn
I--e.-O
=m
O.u
L_I.I.
Lo
L_
,mI.I.
7188--A 81 --3--7--48
158
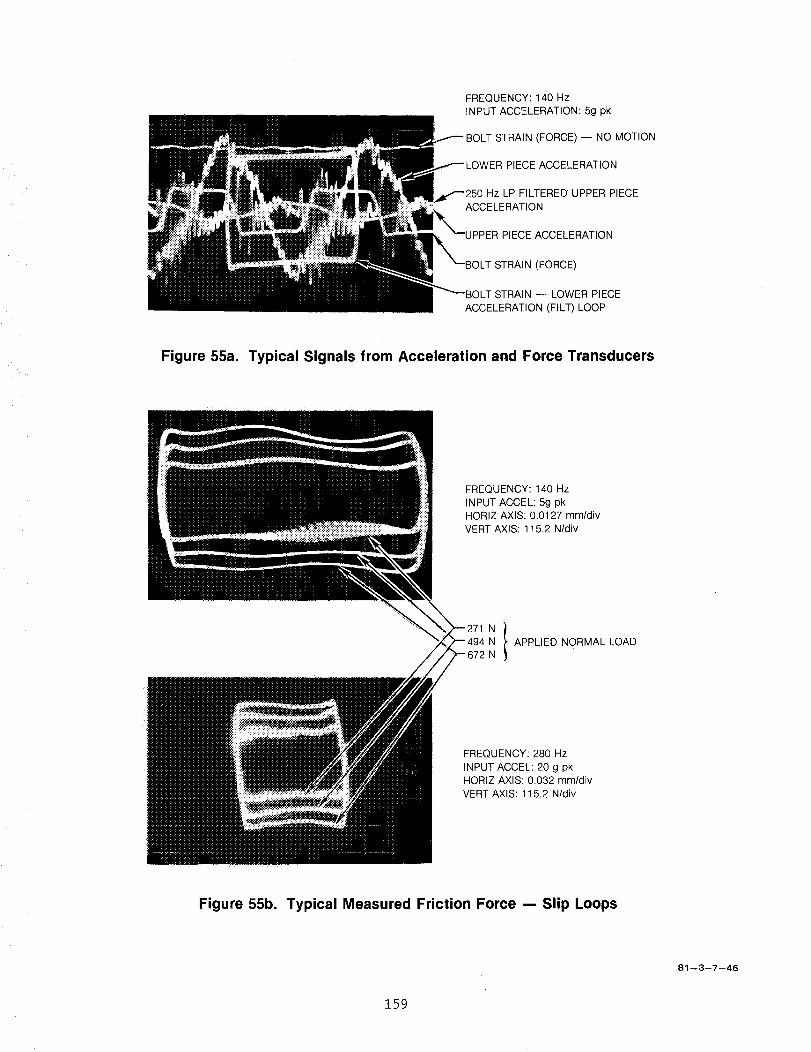
FREQUENCY: 140 HzINPUT ACCELERATION: 5g pk
STRAIN (FORCE) -- NO MOTION
_ER PIECE ACCELERATION
Hz LP FILTERED UPPER PIECE;ELERATION
PIECE ACCELERATION
STRAIN (FORCE)
STRAIN -- LOWER PIECE
ACCELERATION (FILT) LOOP
Figure 55a. Typical Signals from Acceleration and Force Transducers
FREQUENCY: 140 Hz
INPUT ACCEL: 5g pkHORIZ AXIS: 0.0127 mm/divVERT AXIS: 115.2 N/div
N APPLIED NORMAL LOADN
FREQUENCY: 280 Hz
INPUT ACCEL: 20 g pkHORIZ AXIS: 0.032 mm/divVERT AXIS: 115.2 N/div
Figure 55b. Typical Measured Friction Force -- Slip Loops
81 --3--7--46
159
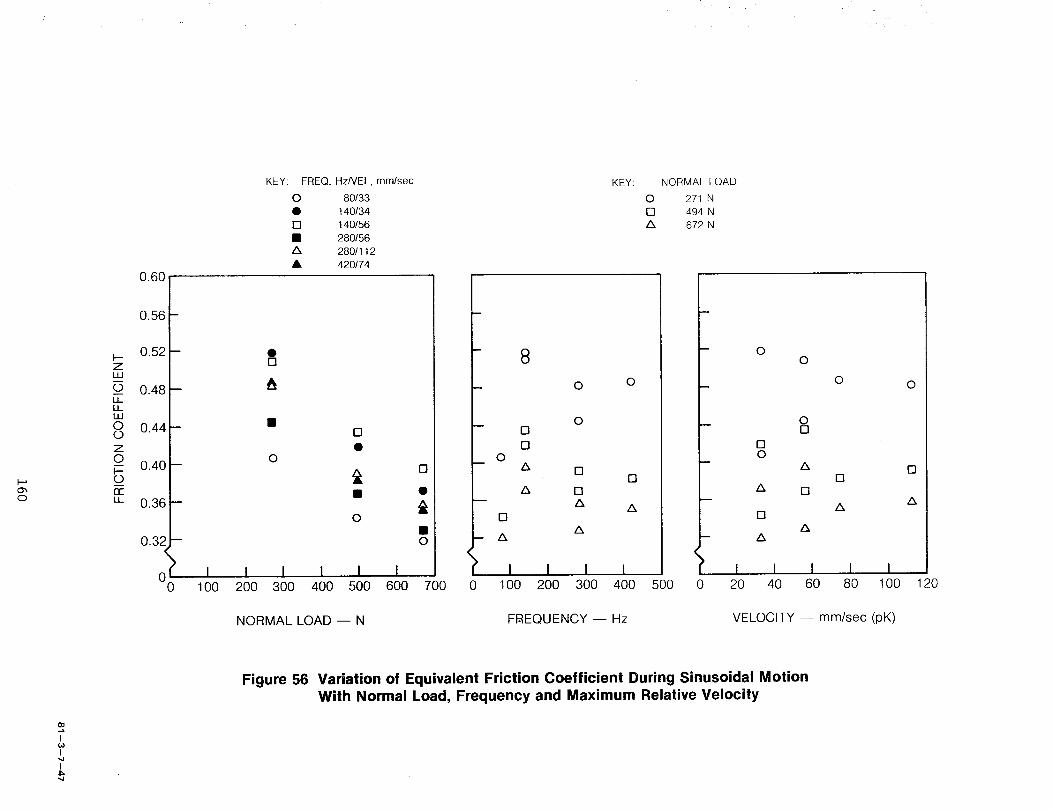
o_o
0.60
0.56 -
0.52 --ZuJ
o 0.48 --u_LLLU
0 0.44 --0z
0.40 --t--oIIT
EL 0.36 --
0.32 --
KEY: FREQ, Hz/VEL, mm/sec
O 80/33
• 140/34
n 140/56
• 280/56
A 280/112
• 420/74
O
IB
o
o
o I I I I I I0 100 200 300 400 500 600
NORMAL LOAD -- N
O
O
700
KEY:
8
o o
o0
0o
z_ 0
z_ nA
0z&
A
n
A
>l I l l
0 100 200 300 400
FREQUENCY -- Hz
NORMAL LOAD
O 271 N
F] 494 N
Z& 672 N
I500 0 20
OO
O
OO
Oo
AD
A 0
AD
AZ_
I I I I40 60 80 100
VELOCITY -- mm/sec (pK)
O
[3
A
120
I
I
I
Figure 56 Variation of Equivalent Friction Coefficient During Sinusoidal MotionWith Normal Load, Frequency and Maximum Relative Velocity
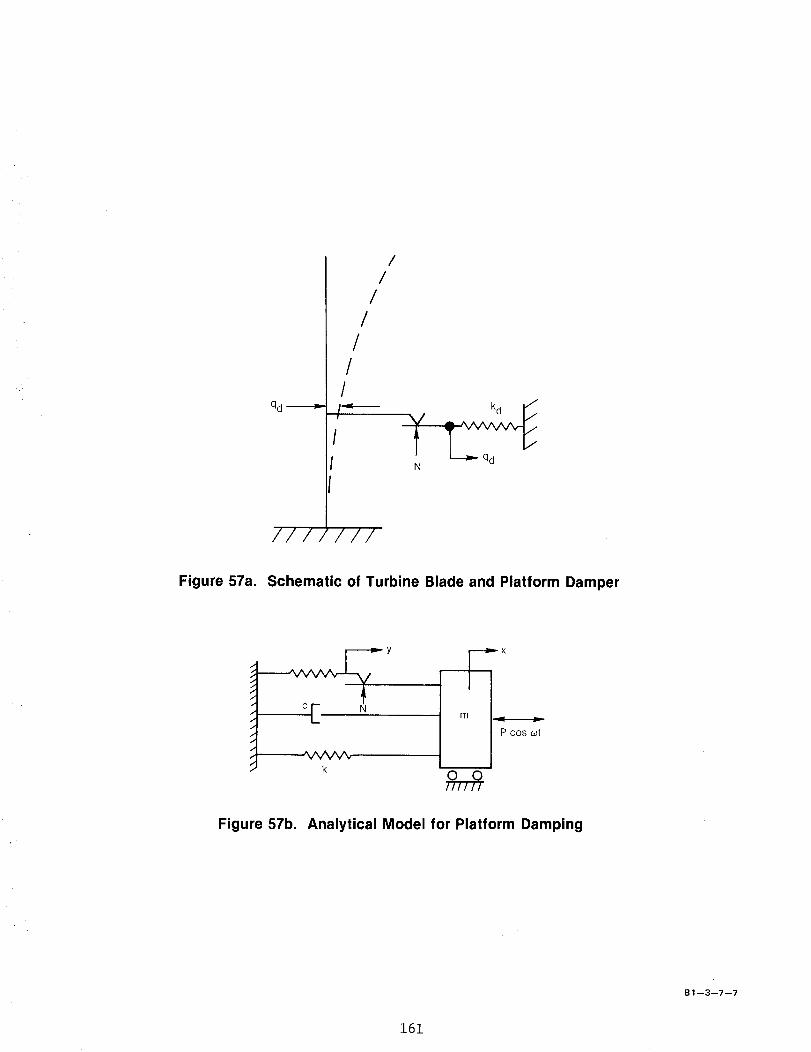
qd
//// ///
/
//
II
II
V -I
N
Figure 57a. Schematic of Turbine Blade and Platform Damper
I
oF, . m I__..P cos c_t
_NVW Ik 0 0
FFFFF[
Figure 57b, Analytical Model for Platform Damping
81 --3--7--7
161
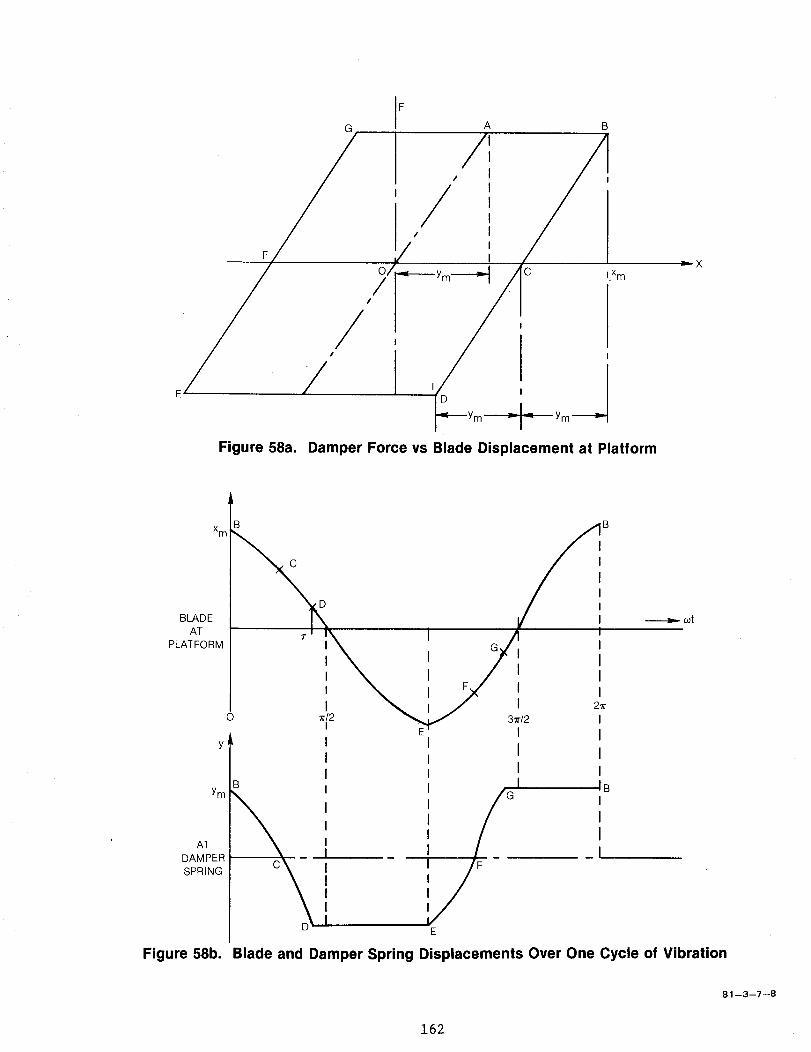
G
F
/
E
F
A B
I
"/i,'/ i
O/ ,gt-...__.ym_ C i Xrn
/
I_----_Ym _ Ym
Damper Force vs Blade Displacement at PlatformFigure 58a.
_X
Xm_ f,'
BLAOEI X / IAT I _1 N I A" =
.LATFORMI ' \ G/i I\ :_71 ',
! ', \,,j ', .,.I E I0 zr./2 _,_ L.,,,"_ 3_r/2 II
y I I I II II I I I
, / GII IBI II I
AT I I
DAMPER _ I ISPRING C I I! /F
I ,yII
I E
---_,,- oat
Figure 58b. Blade and Damper Spring Displacements Over One Cycle of Vibration
81 --3--7--8
162
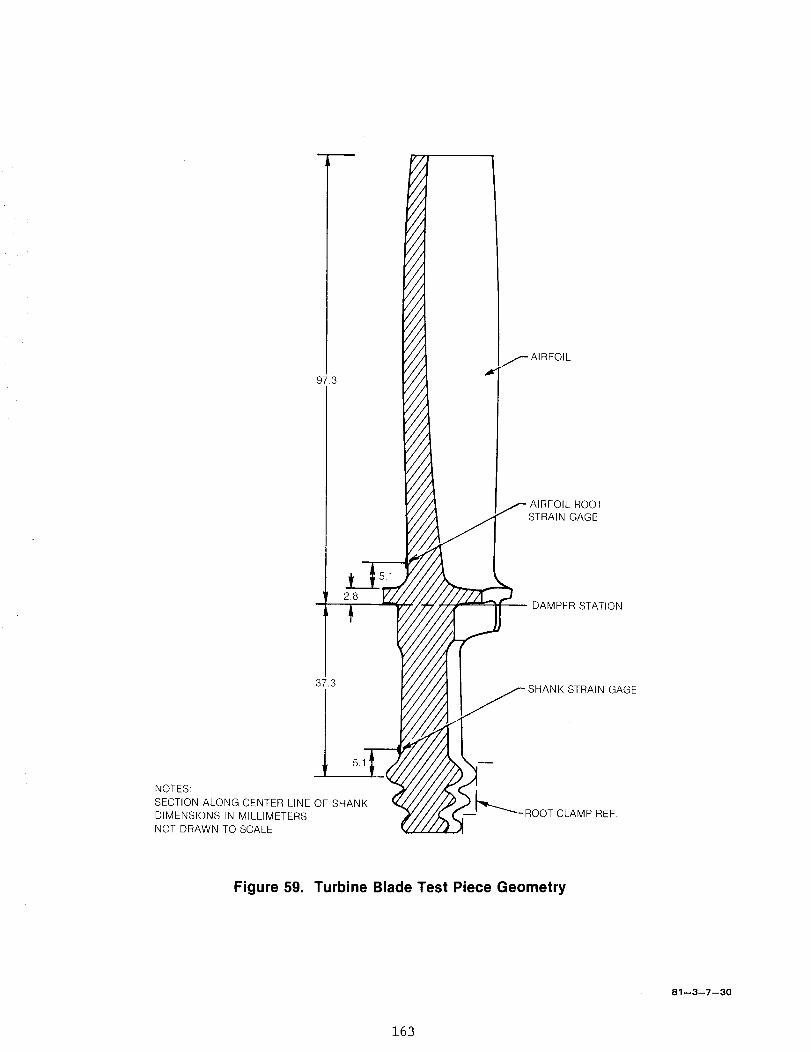
97.3
L_ 1l
' 28 r_.Z',t
37.3
ISECTION ALONG CENTER LINE SHA
DIMENSIONS IN MILLIMETERS
NOT DRAWN TO SCALE
Y/V/
////
//////////////////////
//////////////
//
//
//
_- AIRFOIL
/I
//IIII
II
II
II
II/ / ROOT
// STRAIN GAGE//
////
f-y//////
//- DAMPER STATION//////////
////
// SHANK STRAIN GAGE////
//
/// •
//////
// _._.._//
// -ROOT CLAMP REF.
//I,
Figure 59. Turbine Blade Test Piece Geometry
81--3--7--30
163
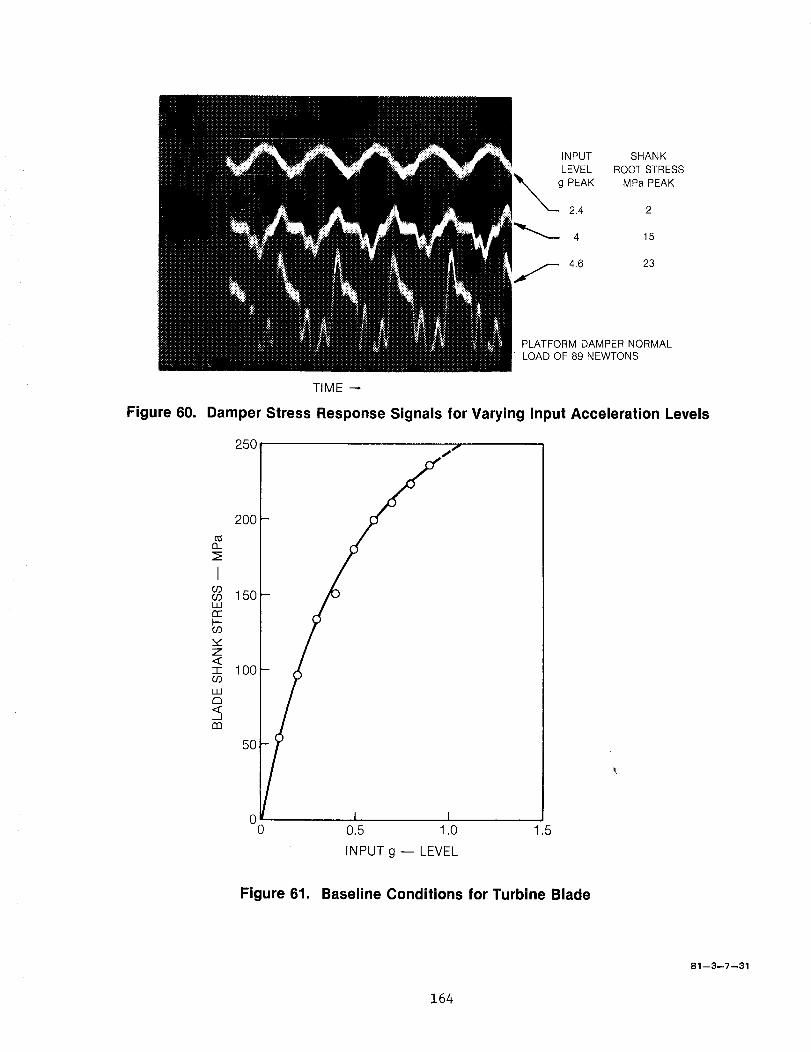
INPUT SHANK
LEVEL ROOT STRESS
g PEAK MPa PEAK
2.4 2
_ 4 15
_, 4,6 23
Figure 60.
PLATFORM DAMPER NORMAL
LOAD OF 89 NEWTONS
TIME
Damper Stress Response Signals for Varying Input Acceleration Levels
13..
ICOCOiiiCEI--CO
Z,<-l-cO
LUd3<:dm
25O
2OO
150
100
50
0 I I0 0.5 1.0 1.5
INPUT g -- LEVEL
Figure 61. Baseline Conditions for Turbine Blade
81 --3--7--31
164
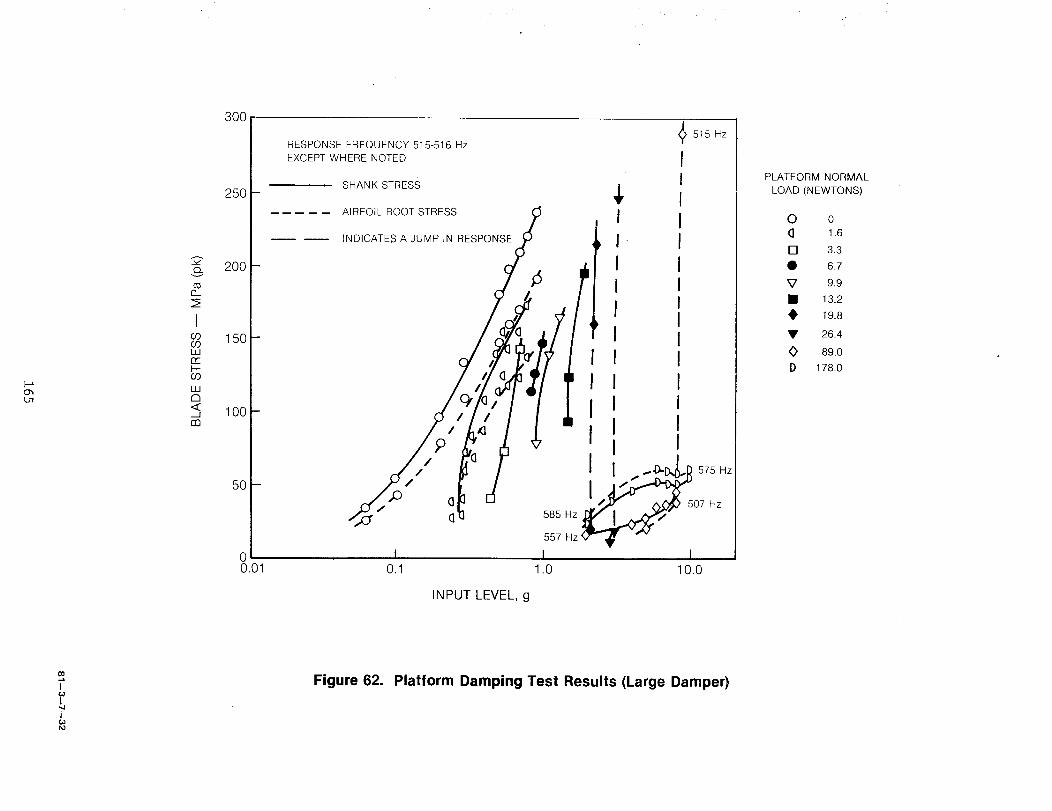
o_L_
El-
IO3O9UJrt-
cO
LUd3
/m
300
25O
200
150
100
5O
RESPONSE FREQUENCY 515-516 Hz
EXCEPT WHERE NOTED
SHANK STRESS
AIRFOIL ROOT STRESS
INDICATES A JUMP IN RESPONSE
00.01
/
INPUT LEVEL, g
585
557
I1.0
515 Hz
I!IIIIIIIIIIII
10.0
PLATFORM NORMAL
LOAD (NEWTONS)
O o(] 1.6
[] 3.3
• 6.7
V 9.9
• 13.2
• 19.8
• 26.4
O 89.0
D 178.0
I
I60
Figure 62. Platform Damping Test Results (Large Damper)
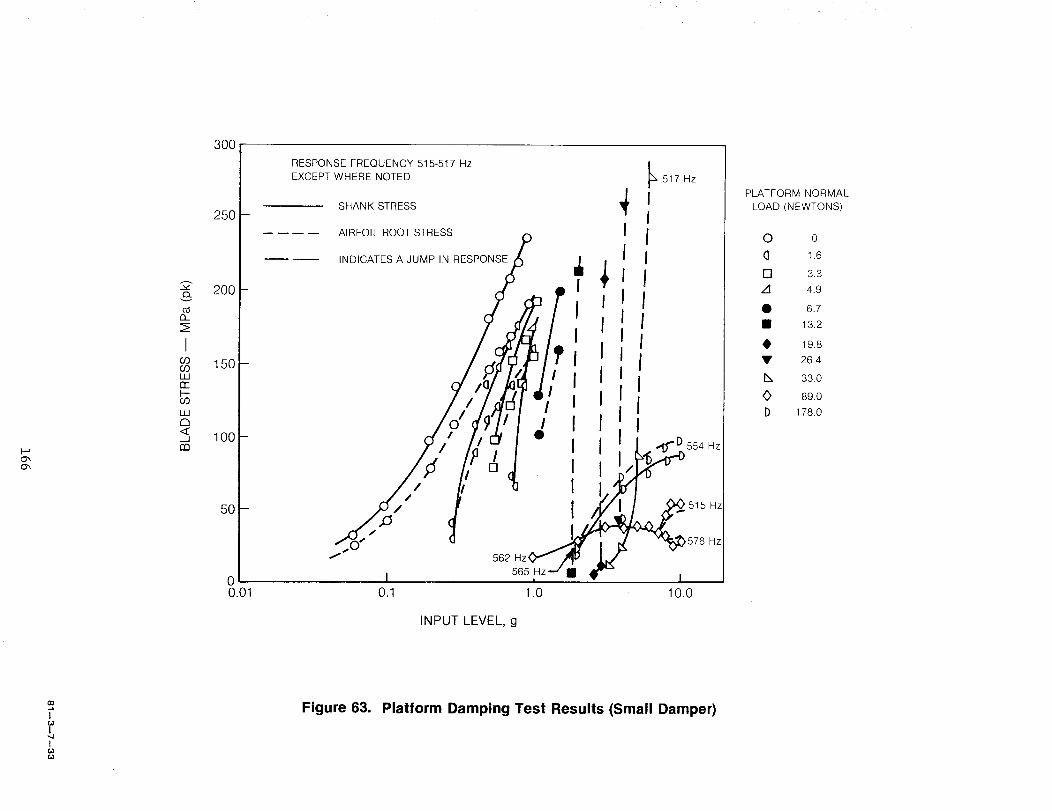
O",
3OO
250
200
150
100I::9
50
0
INPUT LEVEL, g
PLATFORM NORMAL
LOAD (NEWTONS)
O 0
d _.6
[] 3.3
/I 4.9
• 6.7
! 13.2
• 19.8
• 26.4
IN 33.0
O 89.0
D 178.0
!
It_
Figure 63. Platform Damping Test Results (Small Damper)
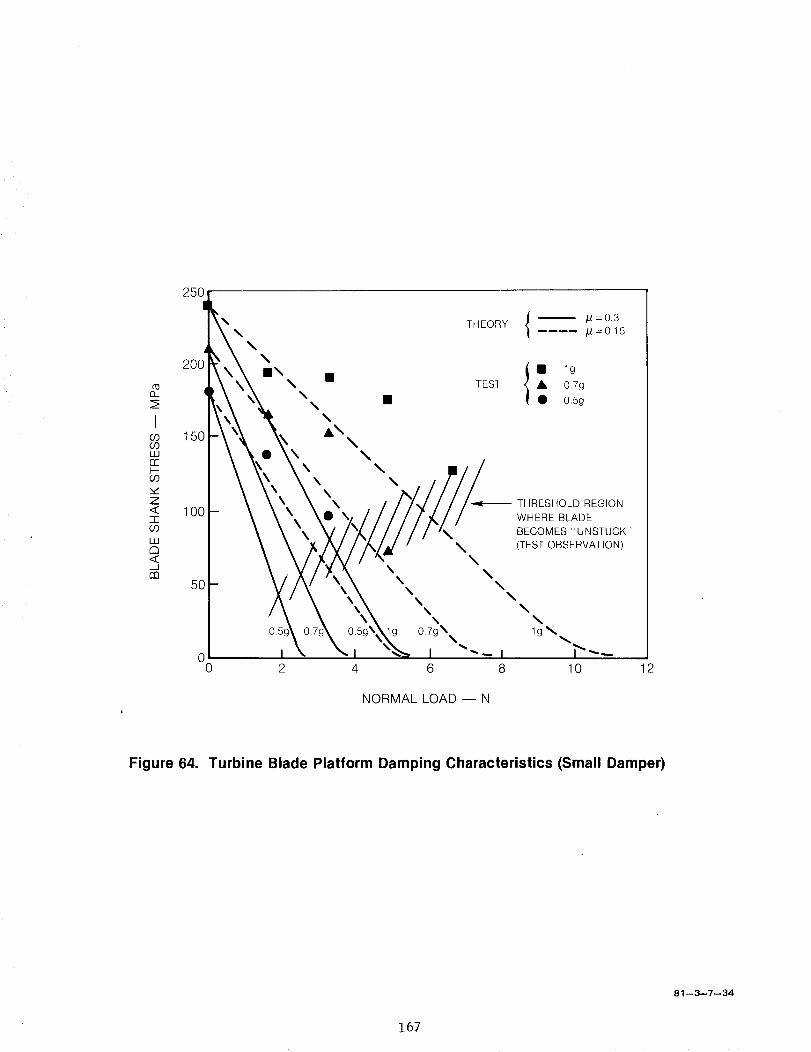
n
IO3
WO2
3_
Z
ICO
Ill
--.Jnn
25O
20C
150
100
\\
\m\
\ m
", •\
A\\
\ \\ \\ \\
THEORY
TEST
\\
\\ \
50 \ \\
I m lg• 0.7g
• 0.5g
THRESHOLD REGION
WHERE BLADE
BECOMES "UNSTUCK"
(TEST OBSERVATION)
\\
\
lg 0.7g\ lg_
00 2 4 6 8 10 12
NORMAL LOAD -- N
Figure 64. Turbine Blade Platform Damping Characteristics (Small Damper)
81 --3.-7--34
167
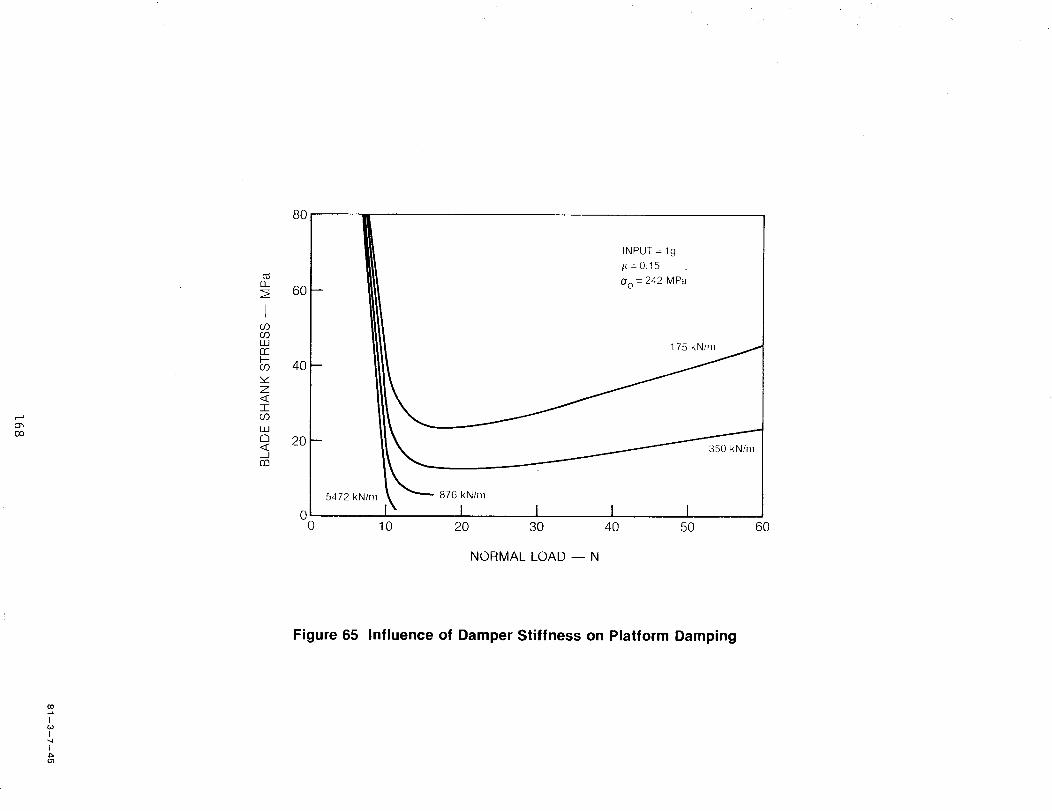
0",Oo
8O
U_lr"rI--co 40
Z
m09
U_I
r_ 20<__Jm
00
INPUT = lg
i_ =0.15
00 = 242 MPa
1 75
5472 kN/n_ 876 kU/rn
I I I I I10 20 30 40 50 60
NORMAL LOAD -- N
Figure 65 Influence of Damper Stiffness on Platform Damping
(3O
I
L
I
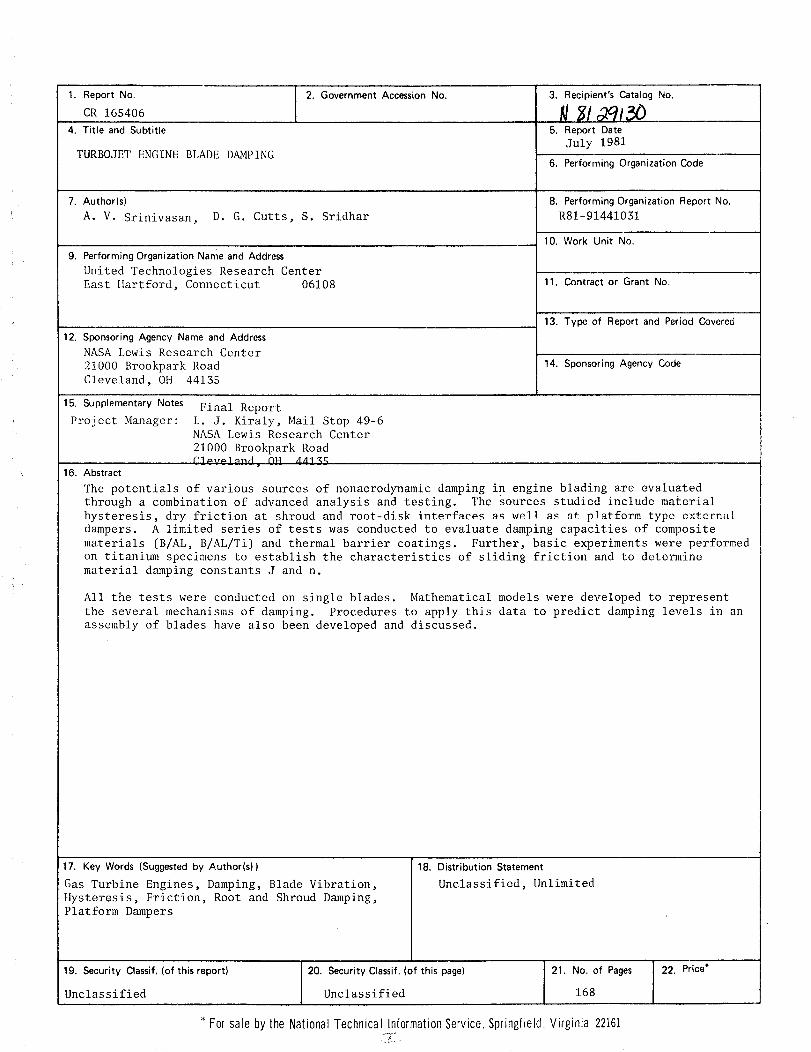
1. Report No.
CR 165406
4. Title and Subtitle
TURBOJET ENGINE BLADE DAMPING
7. Author(s)
A. V. Srinivasan,
i 2. Government Accession No.
D. G. Cutts, S. Sridhar
9. Performing Organization Nameand Address
United Technologies Research CenterEast Hartford, Connecticut 06108
12. Sponsoring Agency Name and Address
NASA Lewis Research Center
21000 Brookpark Road
Cleveland, OH 44135
3. Recipient's Catalog No.
5. Report DateJuly 1981
6. Performing Organization Code
8. Performing Organization Report No.R81-91441031
10. Work Unit No.
11. Contract or Grant No.
13. Type of Report and Period Covered
14. Sponsoring Agency Code
15. Supplementary Notes
Project Manager:
16.
Final Report
L. J. Kiraly, Mail Stop 49-6NASA Lewis Research Center
21000 Brookpark Road
Abstract
The potentials of various sources of nonaerodynamic damping in engine blading are evaluatedthrough a combination of advanced analysis and testing. The sources studied include material
hysteresis, dry friction at shroud and root-disk inter£aces as well as at platform type external
dampers. A limited series of tests was conducted to evaluate damping capacities of composite
materials (B/AL, B/AL/Ti) and thermal barrier coatings. Further, basic experiments were performed
on titanium specimens to establish the characteristics of sliding friction and to determine
material damping constants J and n.
All the tests were conducted on single blades. Mathematical models were developed to represent
the several mechanisms of damping. Procedures to apply this data to predict damping levels in an
assembly of blades have also been developed and discussed.
17. Key Words(Suggested by Author(s))
Gas Turbine Engines, Damping, Blade Vibration,
Hysteresis, Friction, Root and Shroud Damping,
Platform Dampers
18. Distribution Statement
Unclassified, Unlimited
19. Security Classif. (of this report) 20. Security Classif. (of this page) 21. No. of Pages
Unclassified Unclassified 168
* For sale by the National Technical Information Service, Springfield, Virginia 22161
22. Price*