Tupuranga Waikato · Tupuranga Waikato monitoring programme, ... // ... (537 from Hamilton and 743...
29
Waikato Regional Council Technical Report 2017/16 Waikato progress indicators – Tupuranga Waikato Summary update May 2017 www.waikatoregion.govt.nz ISSN 2230-4355 (Print) ISSN 2230-4363 (Online
-
Upload
truonghanh -
Category
Documents
-
view
220 -
download
0
Transcript of Tupuranga Waikato · Tupuranga Waikato monitoring programme, ... // ... (537 from Hamilton and 743...

Waikato Regional Council Technical Report 2017/16
Waikato progress indicators – Tupuranga Waikato
Summary update May 2017
www.waikatoregion.govt.nz ISSN 2230-4355 (Print) ISSN 2230-4363 (Online

Prepared by: Beat Huser and Paul Killerby For: Waikato Regional Council Private Bag 3038 Waikato Mail Centre HAMILTON 3240 May 2017 Doc # 9961326
)

Doc #9961326
Peer reviewed by: Katie Mayes Date May 2017 Approved for release by: Tracey May Date May 2017 Disclaimer This technical report has been prepared for the use of Waikato Regional Council as a reference document and as such does not constitute Council’s policy. Council requests that if excerpts or inferences are drawn from this document for further use by individuals or organisations, due care should be taken to ensure that the appropriate context has been preserved, and is accurately reflected and referenced in any subsequent spoken or written communication. While Waikato Regional Council has exercised all reasonable skill and care in controlling the contents of this report, Council accepts no liability in contract, tort or otherwise, for any loss, damage, injury or expense (whether direct, indirect or consequential) arising out of the provision of this information or its use by you or any other party.

Doc #9961326

Doc #9961326 Page i
Table of contents
1 Purpose 1
2 Quality of Life Survey 2
3 Latest WPI results 5
4 Economic trends 11
5 Social and cultural trends 12
6 Environmental trends 13
7 Overall progress (experimental indexes) 14
8 Next steps 15
References 16
Appendix 1 Review of WPI indicators 17
Appendix 2 The Waikato Progress Indicators 18
Appendix 3 WPI time series data 2001 to 2015-16 21

Page ii Doc #9961326

Doc #9961326 Page 1
1 Purpose This document summarises latest results from the Waikato Progress Indicators (WPI) – Tupuranga Waikato monitoring programme, updated in May 2017. The WPI is an online dashboard of 32 environmental, social and economic indicators of a range of societal wellbeings, at: www.waikatoregion.govt.nz/wpi/. It provides a valuable tool for monitoring regional progress, including progress towards Waikato Regional Council’s Strategic Direction 2016-2019 goals for a healthy environment, strong economy and vibrant communities.1 This update compares the latest available results for each of the WPI indicators with 2006-07 baseline results, enabling regional progress to be assessed over a decade period. Around half of the WPI indicators also have historical data going back to 2001 or earlier, giving a longer-term view where available. The aim is to inform the Waikato public, planners and decision-makers of genuine progress against key indicators of wellbeing. The 2017 data refresh incorporates a range of WPI indicator changes and improvements compared to 2016, primarily due to participation in the 2016 Quality of Life Survey (refer Section 2 of this report, and Killerby and Huser 2017). 2 The structure of this update report is:
1. Purpose 2. Overview of Quality of Life Survey 3. Summary of latest WPI results 4. Economic trends update 5. Social and cultural trends update 6. Environmental trends update 7. Overall progress update (experimental indexes).
For background on the WPI programme, refer to Killerby and Huser (2014).3
1 Council’s Strategic Direction 2016-2019 was adopted in December 2016:
https://www.waikatoregion.govt.nz/council/about-us/wrc-strategy/
2 https://www.waikatoregion.govt.nz/services/publications/technical-reports/2017/tr201711/
3 https://www.waikatoregion.govt.nz/services/publications/technical-reports/tr/tr201444/

Page 2 Doc #9961326
2 Quality of Life Survey The Quality of Life Project was initiated in 1999 as a collaboration between councils to monitor the wellbeing of its residents. The 2016 Quality of Life survey was a collaboration between seven city councils (including Hamilton) and two regional councils (Wellington and Waikato). The perceptions of more than 7,000 New Zealanders including 1,280 Waikato regional residents were recorded in relation to overall quality of life, health and wellbeing, crime and safety and other aspects of wellbeing. From prior participation in the Quality of Life survey in 2006, the Waikato region now has a decade-long comparison on the following key indicators (refer Appendix 1):
Pride in look and feel of city/local area
Perceived overall health
Frequency of being physically active
Perception of impact of greater cultural diversity
Perception of influence on council decisions
Perceived safety walking alone in neighbourhood after dark
Sense of community experienced
Overall quality of life. Due to a high level of consistency in survey methods over time, reasonable comparisons can be made between the 2006 and 2016 results. Over the past decade, Waikato respondents have apparently become:
less likely to rate their overall quality of life positively (84% in 2016 compared to 90% in 2006)
less likely to rate their overall health positively (84% compared to 90% previously)
less likely to report having been physically activity on five or more of the past seven days (47% compared to 61% previously)
less likely to report feeling safe walking alone in their neighbourhood after dark (65% compared to 80% previously)
less likely to agree that the public have an influence over the decisions that their local Council makes (46% compared to 62% previously)
less likely to agree that New Zealand becoming home for an increasing number of people with different lifestyles and cultures from different countries makes their city or local area a better place to live (43% compared to 51% previously).
The 2016 Quality of Life survey results provide comprehensive information on public perceptions, attitudes and behaviours in the Waikato region and other parts of New Zealand. The results will help inform regional and local government policy and support monitoring towards strategic social, cultural and economic goals. Summary results for the Waikato region are shown in infographics on the following pages. For further information on Quality of Life Survey results for the Waikato region, refer to Killerby and Huser (2017). 4
4 https://www.waikatoregion.govt.nz/services/publications/technical-reports/2017/tr201711/

Doc #9961326 Page 3
Quality of Life Survey 2016 results – Waikato region
The 2016 Quality of Life survey measures perceptions of New
Zealanders aged 18 and over across a range of factors that
impact on quality of life. These include health and wellbeing,
crime and safety, community, culture and social networks,
council decision-making processes, environment, public
transport, economic wellbeing, and housing. A random
selection of residents from each Council was made from the
electoral roll, and respondents completed the survey online
or via a hardcopy questionnaire. A total of 7155 New
Zealanders completed the survey – 1280 residents from the
Waikato (537 from Hamilton and 743 other regional
residents), giving a high level of confidence in the results.

Page 4 Doc #9961326

Doc #9961326 Page 5
3 Latest WPI results Results from the WPI monitoring programme including selected Quality of Life Survey results are presented through:
Indicator Report Cards
Scorecard
Comparisons with other regions and New Zealand
Circle of wellbeing The 32 indicators are listed in Appendix 2 and the results for each indicator (primary dataset 2001- 2015/16) are tabulated in Appendix 3.
Indicator Report Cards
Results for each indicator are summarised in online Report Cards, along with supporting information. These are available online at: www.waikatoregion.govt.nz/wpi/.
Waikato Region Scorecard
The Scorecard (Figure 1) gives an overview of the Waikato region’s progress towards wellbeing since 2007. The largest positive measured trends over the period 2007 to 2015-16 include, in declining order:
Improved air quality – decrease in the number of annual exceedances per year of the regional quality guideline for particulate matter in air, from 20 in 2007 to only five in 2016.
Increased road safety – decrease in the social cost of road injury crashes from approximately $1,800 per capita in 2007 to $1,100 per capita in 2015.5
Better educational attainment – increase in the percentage of school leavers with NCEA level 2 or above from 64 per cent in 2009 to 76 per cent in 2015.6
Less crime – reduction in annual rate of victimisations in the Waikato region, from an estimated 617 per 10,000 people in 2006/07 down to 507 in 2015/16.
Higher average incomes – increase in real median weekly household income from $1,334 in 2007 (expressed in 2016 equivalent dollars) up to $1,486 in 2016.
Growth in regional GDP – increase in real regional GDP per capita from approximately $44,700 in 2007 (in 2016-equivalent dollars) to $47,100 in 2016.
The largest negative trends over this period include, in declining order:
Higher water use – increase in water allocation as a percent of total allocable water at the Waikato River mouth during the summer months from 67% in 2007 up to 86% in 2016.7
More rural subdivision – increase in the percentage of rural land being subdivided each year in the Waikato region, from an average of 414 hectares per year during the period 2001-
5 Despite a significant improvement in road safety over the last decade, the Waikato region still has a higher cost of
road crashes per person than the national average (see Table 1). This is influenced by the extent of open roads in
the Waikato region, with around 60 per cent of the national total cost of road injury crashes relating to crashes that
occur on open roads.
6 The level of educational attainment in the Waikato, while significantly improved in recent years, is still slightly below
the national average (Table 1, Figure 4). 7 While increased allocation of water up to 100% of the total allocable water is not necessarily negative, the observed
trend of increasing water use puts an increased pressure on our water resources. The more rapid increase of water
use compared with the economy (GDP growth) in recent years indicates that water is being used less efficiently.

Page 6 Doc #9961326
2006 up to 527 hectares per year during 2006-2013. The greatest amount of subdivision has been occurring on land classed as having higher productive capabilities.
Poorer perceptions of community engagement – decrease in the percentage of Waikato survey respondents who agreed that the public has an influence over the decisions their local Council makes (down from 62% in 2006 to 46% in 2016).
Less physical activity – decrease in the percentage of Waikato survey respondents who reported having been physically active on five or more of the past seven days (down from 61% in 2006 to 47% in 2016).
Lower perceptions of safety – decrease in the percentage of Waikato survey respondents who reported feeling safe walking alone in their neighbourhood after dark, from 80% in 2006 to 65% in 2016.
Less cultural respect – decrease in the percentage of Waikato survey respondents who agree that New Zealand becoming home for an increasing number of people with different lifestyles and cultures from different countries makes their city/area a better place to live (down from 51% in 2006 to 43% in 2016).
Poorer coastal habitats – increase in the amount of estuarine area covered with invasive species (saltwater paspalum) on both the East Coast and West Coast.
Fewer Te Reo Māori speakers – decrease in the percentage of Waikato region residents who say that they speak Te Reo, from 5.8% in 2006 and 5.3% in 2013.
Lower perceived life satisfaction – decrease in the percentage of Waikato survey respondents who rate their overall quality of life positively, from 90% in 2006 to 84% in 2016.
Worse perceived health – decrease in the percentage of Waikato survey respondents who rate their overall health positively, from 90% in 2006 to 84% in 2016.

Doc #9961326 Page 7
Figure 1 WPI trends – Scorecard for 2006-07 to 2015-16 (refer Appendix 3 for data).
Source: WPI Monitoring Programme database (Waikato Regional Council)
Page 8 Doc #9961326
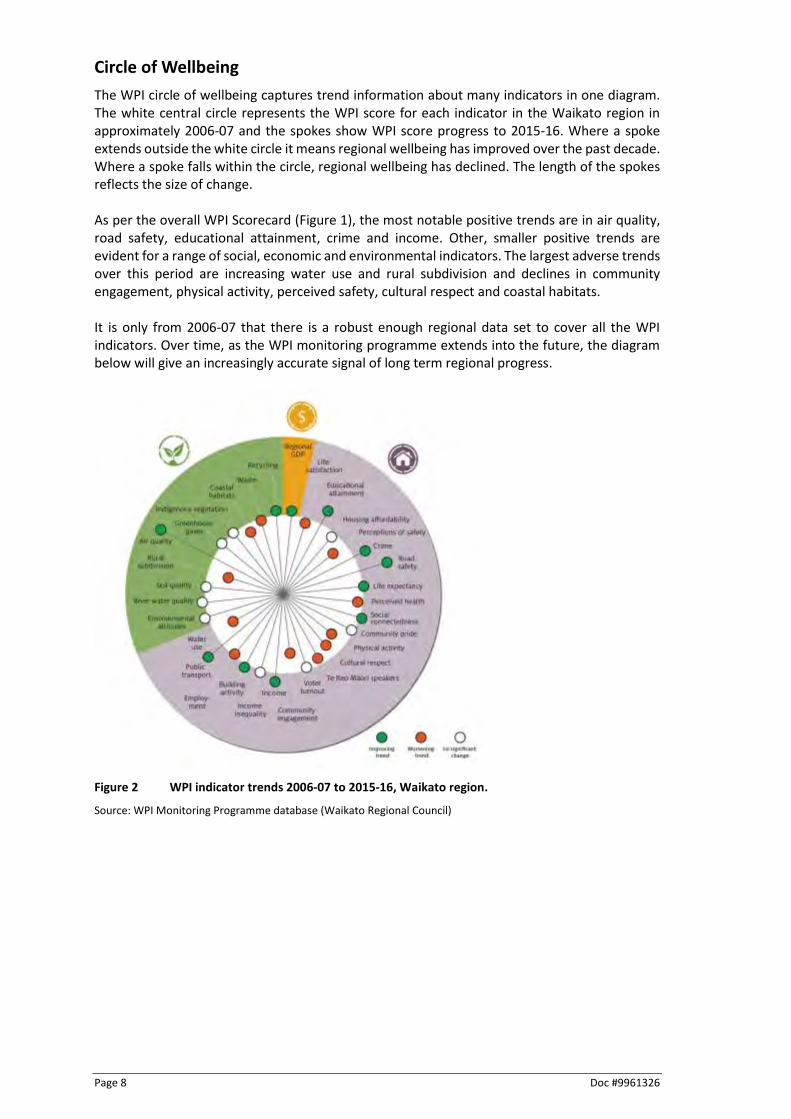
Circle of Wellbeing
The WPI circle of wellbeing captures trend information about many indicators in one diagram. The white central circle represents the WPI score for each indicator in the Waikato region in approximately 2006-07 and the spokes show WPI score progress to 2015-16. Where a spoke extends outside the white circle it means regional wellbeing has improved over the past decade. Where a spoke falls within the circle, regional wellbeing has declined. The length of the spokes reflects the size of change. As per the overall WPI Scorecard (Figure 1), the most notable positive trends are in air quality, road safety, educational attainment, crime and income. Other, smaller positive trends are evident for a range of social, economic and environmental indicators. The largest adverse trends over this period are increasing water use and rural subdivision and declines in community engagement, physical activity, perceived safety, cultural respect and coastal habitats. It is only from 2006-07 that there is a robust enough regional data set to cover all the WPI indicators. Over time, as the WPI monitoring programme extends into the future, the diagram below will give an increasingly accurate signal of long term regional progress.
Figure 2 WPI indicator trends 2006-07 to 2015-16, Waikato region.
Source: WPI Monitoring Programme database (Waikato Regional Council)

Doc #9961326 Page 9
Comparison of Waikato with other regions and New Zealand
Table 1 and Figure 3 below show the latest indicator comparisons between the Waikato region, selected other regions and New Zealand average where comparable data is available. This shows that the Waikato region is behind the national average on a range of economic, social and environmental wellbeing indicators.
Indicator Waikato Auckland Wellington Bay of Plenty New Zealand
Regional GDP $47,119 $58,717 $67,888 $44,997 $54,178
Life satisfaction 84% 79% 87% n/a 81%
Educational attainment 76.2% 82.9% 84.4% 76.4% 79.1%
Housing affordability 16.1% 19.8% 15.5% 16.1% 17.3%
Perceptions of safety 65% 60% 73% n/a 63%
Crime 506 TBC TBC TBC 575
Road safety 1,139 596 423 975 825
Life expectancy 81.0 82.3 81.6 81.1 81.4
Perceived health 84% 80% 83% n/a 82%
Social connectedness 65% 56% 59% n/a 58%
Community pride 68% 64% 71% n/a 62%
Physical activity 47% 43% 49% n/a 45%
Cultural respect 43% 52% 62% n/a 56%
Te Reo Māori speakers 5.3% 2.2% 3.3% 7.9% 3.5%
Voter turnout 36% pending pending pending pending
Community engagement 46% 36% 46% n/a 40%
Income $1,486 $1,682 $1,726 $1,419 $1,534
Income inequality 0.276 0.304 0.320 0.277 0.297
Building activity ($m) 1,400 n/a n/a n/a n/a
Employment 66.0% 67.7% 69.9% 65.8% 67.2%
Public transport 9.1 51.4 74.0 11.4 31.5
Water use 86% n/a n/a n/a n/a
Environmental attitudes 88 n/a n/a n/a n/a
River water quality 28% n/a n/a n/a n/a
Soil quality 84% n/a n/a n/a n/a
Rural subdivision 527 n/a n/a n/a n/a
Air quality 5 n/a n/a n/a n/a
Greenhouse gases NZ proxy n/a n/a n/a 81,104
Indigenous vegetation 27.2% n/a n/a n/a n/a
Coastal habitats 76.75 n/a n/a n/a n/a
Waste 228,723 n/a n/a 127,193 2,461,000
Recycling 70.3% 86.1% 79.2% 72.6% 80.1%
Table 1 Comparison of WPI with selected other regions and New Zealand
Source: WPI Monitoring Programme database (Waikato Regional Council)
Note: Several indicators do not have comparable regional and/or national results (n/a) because either: (1) the WPI data are from a Waikato regional-specific survey (e.g. environmental attitudes) or (2) comparable regional data are not collected or comparison is not meaningful (e.g. soil quality, river water quality) or (3) scale-related data rather than dimensionless data are being used for the WPI indicator (e.g. building activity, rural subdivision) or (4) in the case of greenhouse gases, changes in the New Zealand total are used as a proxy for regional changes in the absence of regional data.

Page 10 Doc #9961326
Comparisons of the Waikato region with New Zealand average for specific key indicators are shown in Figure 3 using latest available data. In this diagram, the white central circle represents national average wellbeing. Where a spoke extends outside the white circle it means regional wellbeing is better than the national average, and where it falls within the white circle, wellbeing is worse than the national average. The diagram shows that the Waikato region is behind the national average on a range of economic, social and environmental wellbeing indicators but also that the region has relatively affordable housing and an above-average percentage of Te Reo Māori speakers.
Figure 3 Comparison Waikato region with New Zealand (selected indicators only).
Source: WPI Monitoring Programme database (Waikato Regional Council)
Note: Excludes indicators that do not have comparable regional or national results. Information based on latest measured data (i.e. no imputed or estimated missing values). Indicators whose spoke end-points overlap the white central circle are classified as not being significantly from the New Zealand average.
Doc #9961326 Page 11
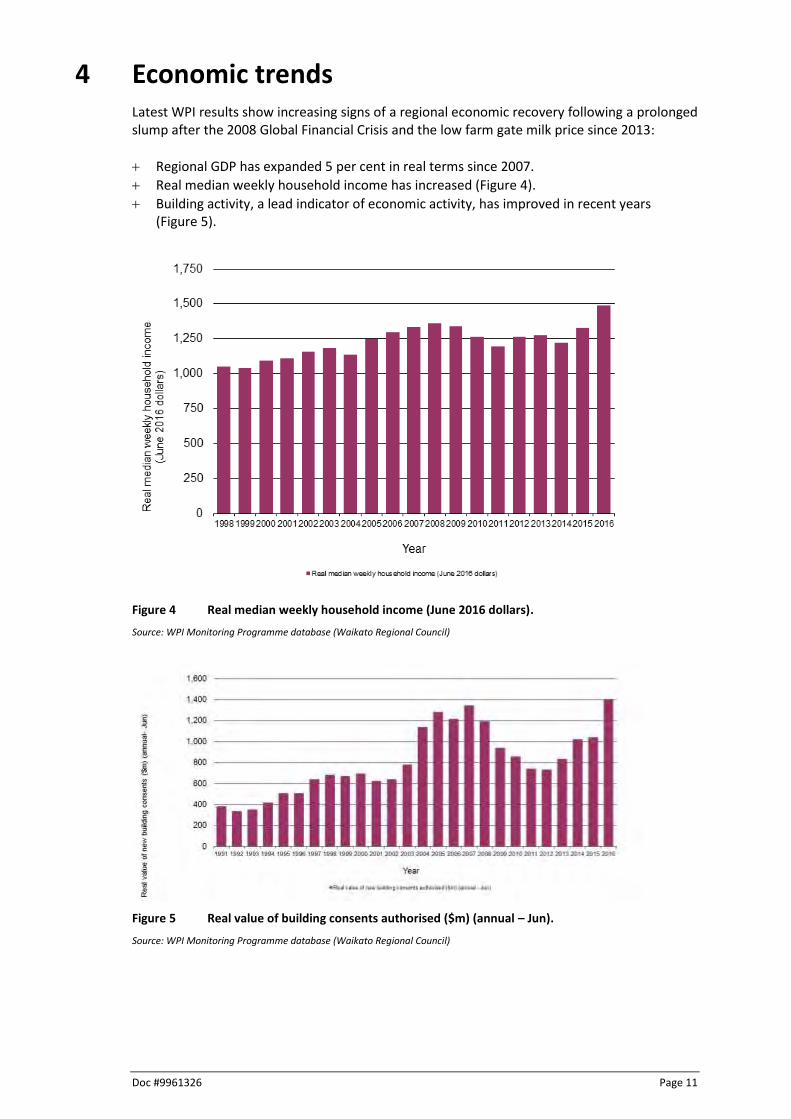
4 Economic trends Latest WPI results show increasing signs of a regional economic recovery following a prolonged slump after the 2008 Global Financial Crisis and the low farm gate milk price since 2013:
Regional GDP has expanded 5 per cent in real terms since 2007.
Real median weekly household income has increased (Figure 4).
Building activity, a lead indicator of economic activity, has improved in recent years (Figure 5).
Figure 4 Real median weekly household income (June 2016 dollars).
Source: WPI Monitoring Programme database (Waikato Regional Council)
Figure 5 Real value of building consents authorised ($m) (annual – Jun).
Source: WPI Monitoring Programme database (Waikato Regional Council)

Page 12 Doc #9961326
5 Social and cultural trends Latest WPI results show a mix of positive and negative social and cultural trends over the past decade. Positives include:
Decrease in the social cost of road injury crashes.
Increase in the percentage of school leavers with NCEA level 2 or above (Figure 6).
Reduction in annual rate of criminal victimisations. Negatives include decreases in the percentage of people who:
Agree the public has an influence over the decisions their local Council makes.
Are physically activity on a regular basis (Figure 7).
Feel safe walking alone in their neighbourhood after dark.
Agree that New Zealand becoming home for an increasing number of people with different lifestyles and cultures from different countries makes their city/area a better place to live.
Figure 6 Percentage of school leavers with NCEA Level 2 or above.
Source: WPI Monitoring Programme database (Waikato Regional Council)
Figure 7 Frequency of doing regular physical activity in past week.
Source: WPI Monitoring Programme database (Waikato Regional Council)

Doc #9961326 Page 13
6 Environmental trends Latest WPI results show a mix of positive and negative environmental trends over the past decade. Positives include:
Decrease in the number of annual exceedances per year of the regional air quality guideline for particulate matter (Figure 8).
Increase in recycling. Negatives include:
Increase in water use.
Increase in rural subdivision.(Figure 9).
Increase in the amount of estuarine area covered with invasive species.
Figure 8 Air quality exceedances.
Source: WPI Monitoring Programme database (Waikato Regional Council)
Figure 9 Rural land subdivided (average ha per year).
Source: WPI Monitoring Programme database (Waikato Regional Council)
0
150
300
450
600
1991-1996 1996-2001 2001-2006 2006-2013
Year
Rura
l la
nd s
ubdiv
ided (
ha p
er
year)
Rural land subdivided (ha per year)

Page 14 Doc #9961326
7 Overall progress (experimental indexes) Work has been undertaken over recent years to investigate methods for deriving a composite index using the WPI dataset (Huser et al. 2016).8 Composite indexes combine several individual indicators into fewer summary indicators. Approaches explored to derive an exploratory Waikato Wellbeing Index have included the Canadian Index of Wellbeing (CIW) reference-year method (Michalos et al. 2011) and Principal Components Analysis (PCA). Most approaches show a widening gap between GDP and alternative measures of wellbeing (Figures 10 and 11). Further efforts are required to develop and test composite indicators that provide meaningful information and are sensitive to change over time.
Figure 10 GDP vs Waikato Wellbeing Index (PCA method) 2001-2013.
Source: Huser, Killerby and Patterson 2016.
Note: Based on actual and imputed data.
Figure 11 GDP vs Waikato composite indexes (CIW method) 2001-2016.
Source: WPI Monitoring Programme database (Waikato Regional Council)
Note: Based on actual and imputed data.
8 Towards a wellbeing index for the Waikato Region. New Zealand Planning Quarterly, Issue 200, March
2016.

Doc #9961326 Page 15
8 Next steps The results of the WPI programme provide a robust basis for discussing regional challenges and opportunities and identifying priorities for closer collaboration and partnerships. Results from the WPI help monitor and inform Council’s strategic direction and other region-wide initiatives, such as the Waikato Plan and the Waikato Regional Economic Development Strategy (‘Waikato Means Business’). Selected individual indicators that reflect Waikato Regional Council’s functions and roles are also included as performance measures in Council’s Long Term Plan. Further work is ongoing towards indicator improvements, better accessibility and communication of indicator results and more harmonised monitoring in New Zealand. This includes working with the Ministry for the Environment and Statistics NZ on environmental reporting and with NZ Police to ensure a consistent long-term regional time series of crime trends. In addition, WPI secondary indicators and territorial authority data have been compiled to support closer analysis and develop ‘progress stories’ about how and why levels of wellbeing are changing over time in the Waikato region. This includes information about distributional aspects, such as by age, gender, ethnicity, income or locality. Engaging with strategic regional partners to share data, align indicators and combine knowledge to tell progress stories from different perspectives will be a continuing focus for the WPI. Partners include Iwi/Waikato River Authority, Hamilton City Council, District Councils, Waikato District Health Board, New Zealand Transport Agency, New Zealand Treasury, Statistics New Zealand, Ministry for the Environment, Ministry of Social Development, Ministry of Business, Innovation and Employment, business and sector groups, community trusts (WEL Energy, Trust Waikato, Momentum Waikato Community Foundation) and other non-government organisations.

Page 16 Doc #9961326
References
Huser B, Killerby P, Patterson M 2016. Towards a wellbeing index for the Waikato Region. New Zealand Planning Quarterly, Issue 200, March 2016.
Killerby P, Huser B 2014. Development of the Waikato Progress Indicators (WPI). Waikato Regional
Council technical report 2014/44. Hamilton, Waikato Regional Council. https://www.waikatoregion.govt.nz/services/publications/technical-reports/tr/tr201444/
Killerby P, Huser B 2017. Quality of Life Survey 2016 – Waikato regional results. Waikato Regional
Council Technical Report 2017/11. Hamilton, Waikato Regional Council. https://www.waikatoregion.govt.nz/services/publications/technical-reports/2017/tr201711/
Michalos AC, Smale B, Labonté R, Muharjarine N, Scott K, Moore K, Swystun L, Holden B, Bernardin
H, Dunning B, Graham P, Guhn M, Gadermann AM, Zumbo BD, Morgan A, Brooker A-S, Hyman I 2011. The Canadian Index of Wellbeing. Technical Report 1.0. Waterloo, ON: Canadian Index of Wellbeing and University of Waterloo.

Doc #9961326 Page 17
Appendix 1 Review of WPI indicators A review of the WPI indicators was undertaken prior to the March 2016 data update focusing on options for harmonisation with other wellbeing monitoring programmes, particularly the Wellington Region Genuine Progress Index (WR-GPI), and addressing time series breaks for some items. Issues and changes resulting from this review were reported in the 2016 WPI annual update summary report. Further changes since March 2016 are summarised below. Discussions are ongoing regarding data improvements and harmonisation of other indicators over time.
WPI indicator changes between March 2016 and March 2017
Indicator Issue/change Discussion/ rationale
Life satisfaction Changed from NZ General Social Survey (NZGSS) to Quality of Life Survey
Changes in the NZ General Social Survey (GSS) for this item created a time series break
Perceptions of safety Changed from NZGSS to Quality of Life Survey Changes in the NZ GSS for this item created a time series break
Crime Changed to new NZ Police data on victimisations Change in method of monitoring and reporting from 2014 created a time series break NZ Police are assisting with ensuring a consistent historical regional time series
Perceived health Changed from NZ Health Survey (NZHS) to Quality of Life Survey
Quality of Life Survey data have similar properties to NZ Health Survey regional data for this item
Social connectedness Changed from NZGSS to Quality of Life Survey Changes in the NZ GSS for this item created a time series break
Community pride Changed from MARCO Waikato Regional Perception Survey to Quality of Life Survey
Harmonisation with WR-GPI MARCO Waikato Regional Perception Survey discontinued (replaced by Quality of Life survey)
Physical activity Changed from NZHS to Quality of Life Survey Quality of Life Survey results have similar properties to NZ Health Survey regional data for this item
Cultural respect Changed from MARCO Waikato Regional Perception Survey to Quality of Life Survey
Harmonisation with WR-GPI MARCO Waikato Regional Perception Survey discontinued (replaced by Quality of Life survey)
Voter turnout Consideration is being given to changing from voter turnout in regional council elections to average voter turnout in local council, DHB and regional council elections
Pending harmonisation with WR-GPI indicator on voter turnout
Community engagement
Changed from MARCO Waikato Regional Perception Survey to Quality of Life Survey
Harmonisation with WR-GPI MARCO Waikato Regional Perception Survey discontinued (replaced by Quality of Life survey)
Recycling No change but exploring options for alternative indicators
Changes in the NZ GSS for this item have substantially reduced the frequency of data updates
Page 18 Doc #9961326
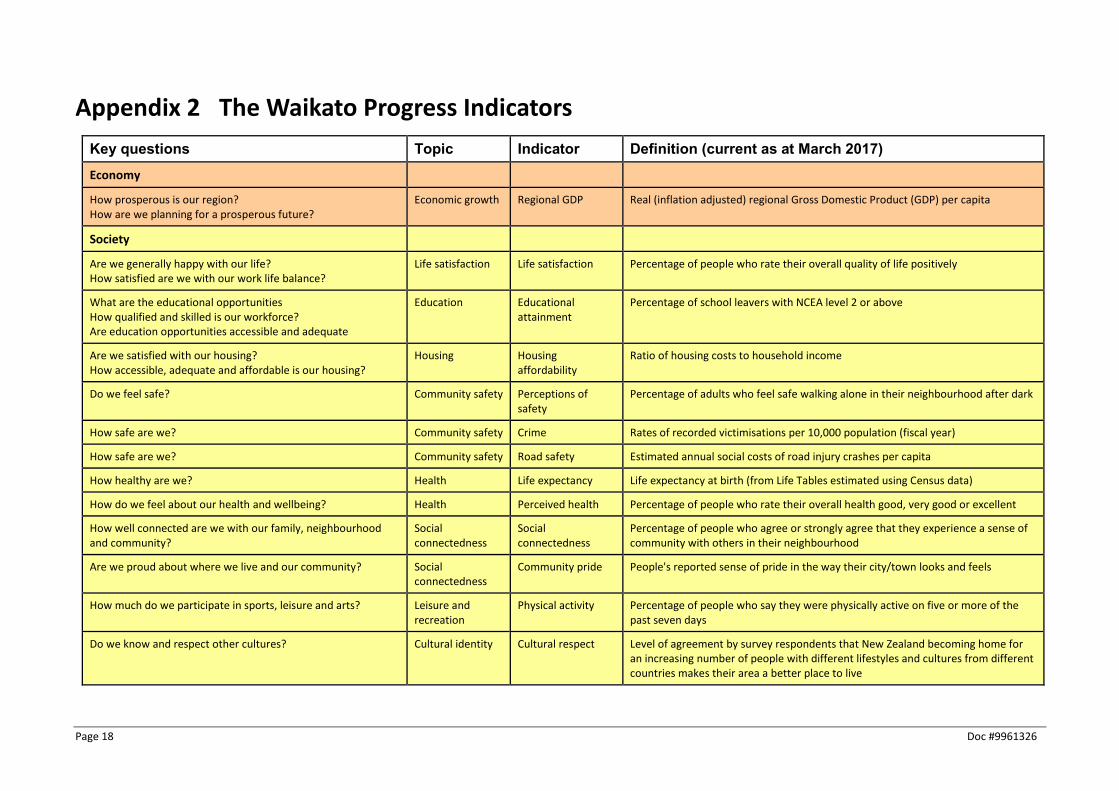
Appendix 2 The Waikato Progress Indicators
Key questions Topic Indicator Definition (current as at March 2017)
Economy
How prosperous is our region? How are we planning for a prosperous future?
Economic growth Regional GDP Real (inflation adjusted) regional Gross Domestic Product (GDP) per capita
Society
Are we generally happy with our life? How satisfied are we with our work life balance?
Life satisfaction Life satisfaction Percentage of people who rate their overall quality of life positively
What are the educational opportunities How qualified and skilled is our workforce? Are education opportunities accessible and adequate
Education Educational attainment
Percentage of school leavers with NCEA level 2 or above
Are we satisfied with our housing? How accessible, adequate and affordable is our housing?
Housing Housing affordability
Ratio of housing costs to household income
Do we feel safe? Community safety Perceptions of safety
Percentage of adults who feel safe walking alone in their neighbourhood after dark
How safe are we? Community safety Crime Rates of recorded victimisations per 10,000 population (fiscal year)
How safe are we? Community safety Road safety Estimated annual social costs of road injury crashes per capita
How healthy are we? Health Life expectancy Life expectancy at birth (from Life Tables estimated using Census data)
How do we feel about our health and wellbeing? Health Perceived health Percentage of people who rate their overall health good, very good or excellent
How well connected are we with our family, neighbourhood and community?
Social connectedness
Social connectedness
Percentage of people who agree or strongly agree that they experience a sense of community with others in their neighbourhood
Are we proud about where we live and our community? Social connectedness
Community pride People's reported sense of pride in the way their city/town looks and feels
How much do we participate in sports, leisure and arts? Leisure and recreation
Physical activity Percentage of people who say they were physically active on five or more of the past seven days
Do we know and respect other cultures? Cultural identity Cultural respect Level of agreement by survey respondents that New Zealand becoming home for an increasing number of people with different lifestyles and cultures from different countries makes their area a better place to live

Doc #9961326 Page 19
Key questions Topic Indicator Definition (current as at March 2017)
Do we recognise and protect our cultural heritage and distinctive identity? How comfortable do we feel about expressing our cultural practices?
Cultural identity Te Reo Māori speakers
Percentage of Te Reo Māori speakers in the total population
Are we involved in our community? How much do we participate in decision making?
Civic engagement Voter turnout Percentage of all enrolled electors (residents and ratepayers) who cast a vote in their regional council elections – pending change to average voter turnout in local council, DHB and regional council elections
Are we satisfied with our opportunity to participate in (council) decision making?
Civic engagement Community engagement
Percentage of people who agree that the public have ‘large’ or ‘some’ influence over the decisions that their local Council makes
How wealthy are we? Wealth and income
Income Real median weekly household income
Wealth and income Wealth and income
Income inequality Gini coefficient – a measure of the concentration of income within the region
How prosperous is our region? How are we planning for a prosperous future?
Wealth and income
Building activity Real value of total new building consents issued per annum (year to June)
How many people have a job? How many are unemployed - and how long
Employment Employment Employment rate - the proportion of total working age population who are employed
Does our infrastructure cope with current and increasing demand? What services are available?
Infrastructure Public transport Public transport volumes per capita – average number of passenger transport boardings per resident per annum
How do we use our natural resources? How much water do we use? How much have we got?
Resource use Water use Water allocation as a percent of total allocable water – Waikato River mouth during summer months
Environment
How much do we value or environment? Can we sustain a healthy environment and grow our economy? What do we value most? What are the threats to our environment?
Environmental values
Environmental attitudes
Average regional NEP (New Environmental Paradigm) Scale score
How good is our water quality? Land and water River water quality River water quality for ecological health – percentage of unsatisfactory river water samples for ecological water quality in Waikato rivers and streams (all sites average)
How healthy are our soils? How resilient are we to food production?
Land and water Soil quality Percentage of soil monitoring sites meeting five or more soil quality targets - Waikato Region
Page 20 Doc #9961326
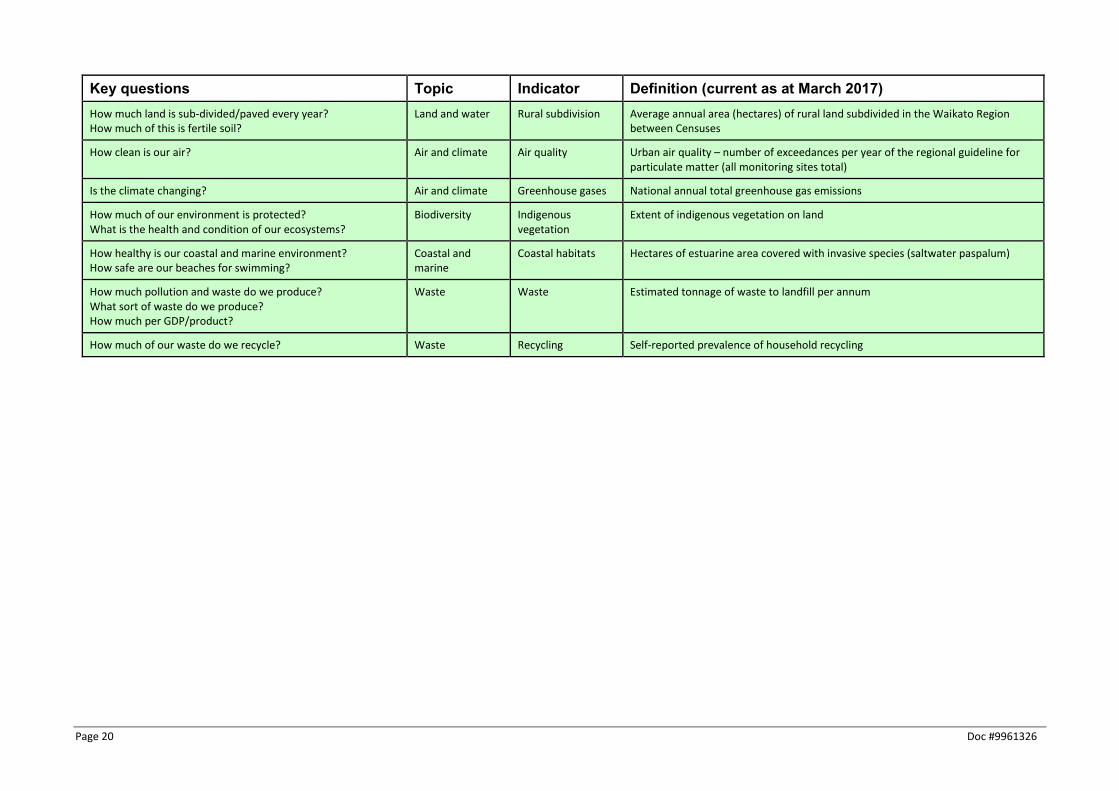
Key questions Topic Indicator Definition (current as at March 2017)
How much land is sub-divided/paved every year? How much of this is fertile soil?
Land and water Rural subdivision Average annual area (hectares) of rural land subdivided in the Waikato Region between Censuses
How clean is our air? Air and climate Air quality Urban air quality – number of exceedances per year of the regional guideline for particulate matter (all monitoring sites total)
Is the climate changing? Air and climate Greenhouse gases National annual total greenhouse gas emissions
How much of our environment is protected? What is the health and condition of our ecosystems?
Biodiversity Indigenous vegetation
Extent of indigenous vegetation on land
How healthy is our coastal and marine environment? How safe are our beaches for swimming?
Coastal and marine
Coastal habitats Hectares of estuarine area covered with invasive species (saltwater paspalum)
How much pollution and waste do we produce? What sort of waste do we produce? How much per GDP/product?
Waste Waste Estimated tonnage of waste to landfill per annum
How much of our waste do we recycle? Waste Recycling Self-reported prevalence of household recycling

Doc #9961326 Page 21
Appendix 3 WPI time series data 2001 to 2015-16 Key:
Grey cell indicates imputed or extrapolated data
White cell indicates measured data
Note that (a) the trend direction for some of these indicators has a negative interpretation (e.g. crime); and (b) pre-2009 historical data for the educational attainment measure has not yet been sourced.
Indicator 2001 2002 2003 2004 2005 2006 2007 2008 2009 2010 2011 2012 2013 2014 2015 2016
Regional GDP $38,929 $41,010 $38,390 $40,062 $40,721 $41,569 $44,713 $45,097 $46,111 $43,786 $43,550 $45,659 $43,871 $47,430 $46,494 $47,119
Life satisfaction 90% 90% 90% 90% 90% 90% 89% 89% 88% 88% 87% 86% 86% 85% 85% 84%
Educational attainment 63.8% 63.8% 66.1% 68.9% 71.4% 72.9% 74.5% 76.2%
Housing affordability 15.4% 15.4% 15.4% 15.4% 15.4% 15.4% 15.4% 14.1% 15.5% 13.6% 14.7% 16.0% 14.1% 16.4% 14.7% 16.1%
Perceptions of safety 80% 80% 80% 80% 80% 80% 79% 77% 76% 74% 73% 71% 70% 68% 67% 65%
Crime 622.5 620.9 590.2 566.1 521.6 604.3 617.0 579.1 575.0 614.8 596.5 587.8 513.4 515.7 469.1 506.5
Road safety 1,378 1,378 1,378 1,378 1,672 1,475 1,812 1,569 1,377 1,237 1,198 1,068 824 975 1,139
Life expectancy 78.5 78.8 79.0 79.3 79.5 79.8 80.0 80.1 80.3 80.5 80.6 80.8 81.0 81.1 81.1
Perceived health 90% 90% 90% 90% 90% 90% 89% 89% 88% 88% 87% 86% 86% 85% 85% 84%
Social connectedness 63% 63% 63% 63% 63% 63% 63% 63% 64% 64% 64% 64% 64% 65% 65% 65%
Community pride 70% 70% 70% 70% 70% 70% 70% 70% 69% 69% 69% 69% 69% 68% 68% 68%
Physical activity 61% 61% 61% 61% 61% 61% 60% 58% 57% 55% 54% 53% 51% 50% 48% 47%
Cultural respect 51% 51% 51% 51% 51% 51% 50% 49% 49% 48% 47% 46% 45% 45% 44% 43%
Te Reo Māori speakers 6.4% 6.3% 6.2% 6.0% 5.9% 5.8% 5.7% 5.7% 5.6% 5.5% 5.4% 5.4% 5.3% 5.3% 5.3%
Voter turnout 49% 48% 46% 45% 42% 40% 37% 39% 40% 42% 41% 40% 40% 40% 40%
Community engagement 62% 62% 62% 62% 62% 62% 60% 59% 57% 56% 54% 52% 51% 49% 48% 46%
Income $1,109 $1,157 $1,182 $1,137 $1,249 $1,294 $1,334 $1,363 $1,338 $1,262 $1,198 $1,266 $1,278 $1,223 $1,331 $1,486
Income inequality 0.295 0.294 0.294 0.293 0.291 0.288 0.286 0.293 0.268 0.276 0.322 0.302 0.276 0.276 0.276
Building activity 625 641 780 1,138 1,281 1,215 1,345 1,194 939 859 741 732 834 1,023 1,040 1,400
Employment 67.8% 67.8% 67.8% 67.8% 67.8% 67.8% 68.4% 66.9% 64.7% 64.5% 64.5% 62.7% 64.1% 65.1% 64.0% 66.0%
Public transport 4.2 4.3 4.5 4.9 5.1 5.5 7.3 9.1 11.1 11.0 10.9 12.2 11.9 10.1 9.9 9.1
Water use 67% 67% 67% 67% 67% 67% 67% 65% 64% 69% 72% 76% 87% 86% 86% 86%
Environmental attitudes 87 84 80 77 79 82 84 86 87 87 88 88 89 89 88 88

Page 22 Doc #9961326
Indicator 2001 2002 2003 2004 2005 2006 2007 2008 2009 2010 2011 2012 2013 2014 2015 2016
River water quality 29.0% 29.0% 29.0% 29.0% 29.0% 29.0% 29.0% 29.0% 29.0% 29.0% 29.0% 29.0% 29.0% 28.0% 27.9% 28%
Soil quality 88 88 88 87 86 87 86 87 80 84 82 82 76 79 79 84
Rural subdivision 436 432 427 423 418 414 430 446 462 479 495 511 527 527 527
Air quality 17 17 27 50 38 47 20 28 38 22 20 17 12 11 10 5
Greenhouse gases 79,059 79,617 82,022 81,649 83,666 83,697 81,158 81,021 78,625 78,942 78,942 80,890 80,298 81,104 81,104
Indigenous vegetation 27.2% 27.2% 27.2% 27.2% 27.2% 27.2% 27.2% 27.2% 27.2% 27.2% 27.2% 27.2% 27.2% 27.2% 27.2%
Coastal habitats 62.18 63.80 65.42 67.04 68.66 70.27 71.89 73.51 75.13 76.75 78.37 79.99 81.61 81.61 81.61
Waste 222,000 222,000 222,000 222,000 222,000 222,000 222,815 223,629 224,444 225,258 226,073 226,887 227,499 228,111 228,723
Recycling 66.2% 66.2% 66.2% 66.2% 66.2% 66.2% 66.2% 66.2% 68.9% 71.5% 70.9% 70.3% 70.3% 70.3% 70.3%

Doc #9961326 Page 23