Tunkhannock Area School District Algebra 1 1 Curriculum ... · Tunkhannock Area School District...
39
1 Tunkhannock Area School District Algebra 1 Curriculum Map 2014 Quarter 1 Targeted Standard(s): PA Core 2.1.HS.F.1 Apply and extend the properties of exponents to solve problems with rational exponents. 2.1.HS.F.2 Apply properties of rational and irrational numbers to solve real world or mathematical problems. 2.1.HS.F.3 Apply quantitative reasoning to choose and Interpret units and scales in formulas, graphs and data displays. 2.1.HS.F.4 Use units as a way to understand problems and to guide the solution of multi-step problems. 2.1.HS.F.5 Choose a level of accuracy appropriate to limitations on measurement when reporting quantities. 2.2.HS.D.1 Interpret the structure of expressions to represent a quantity in terms of its context. 2.2.HS.D.8 Apply inverse operations to solve equations or formulas for a given variable. 2.2.HS.D.9 Use reasoning to solve equations and justify the solution method. 2.2.HS.D.10 Represent, solve and interpret equations/inequalities and systems of equations/inequalities algebraically and graphically. Keystone Algebra 1 Eligible Content A1.1.1.1.1 Compare and/or order any real numbers. Note: Rational and irrational may be mixed. A1.1.1.1.2 Simplify square roots (e.g., √24 = 2√6 ) . A1.1.1.2.1 Find the Greatest Common Factor (GCF) and/or the Least Common Multiple (LCM) for sets of monomials. A1.1.1.3.1 Simplify/evaluate expressions involving properties/laws of exponents, roots, and/ or absolute values to solve problems. Note: Exponents should be integers from -10 to 10. A1.1.2.1.1 Write, solve, and/or apply a linear equation (including problem situations). A1.1.2.1.2 Use and/or identify an algebraic property to justify any step in an equation solving process. Note: Linear equations only. A1.1.2.1.3 Interpret solutions to problems in the context of the problem situation. Note: Linear equations only. A1.1.1.5.1 Add, subtract, and/or multiply polynomial expressions (express answers in simplest form). Note: Nothing larger than a binomial multiplied by a trinomial. Enduring Understandings: • Know that there are numbers that are not rational, and approximate them by rational numbers. • Extend the properties of exponents to rational exponents. • Perform arithmetic operations on polynomials. • Solve equations and inequalities in one variable. • Create equations that describe numbers or relationships. • Define, evaluate, and compare functions. • Use functions to model relationships between quantities. • Understand solving equations as a process of reasoning and explain the reasoning. • Create equations that describe numbers or relationships. • Interpret functions that arise in applications in terms of the context.
Transcript of Tunkhannock Area School District Algebra 1 1 Curriculum ... · Tunkhannock Area School District...

1 Tunkhannock Area School District
Algebra 1 Curriculum Map 2014
Quarter 1 Targeted Standard(s): PA Core 2.1.HS.F.1 Apply and extend the properties of exponents to solve problems with rational exponents. 2.1.HS.F.2 Apply properties of rational and irrational numbers to solve real world or mathematical problems. 2.1.HS.F.3 Apply quantitative reasoning to choose and Interpret units and scales in formulas, graphs and data displays. 2.1.HS.F.4 Use units as a way to understand problems and to guide the solution of multi-step problems. 2.1.HS.F.5 Choose a level of accuracy appropriate to limitations on measurement when reporting quantities. 2.2.HS.D.1 Interpret the structure of expressions to represent a quantity in terms of its context. 2.2.HS.D.8 Apply inverse operations to solve equations or formulas for a given variable. 2.2.HS.D.9 Use reasoning to solve equations and justify the solution method. 2.2.HS.D.10 Represent, solve and interpret equations/inequalities and systems of equations/inequalities algebraically and graphically. Keystone Algebra 1 Eligible Content A1.1.1.1.1 Compare and/or order any real numbers. Note: Rational and irrational may be mixed. A1.1.1.1.2 Simplify square roots (e.g., √24 = 2√6 ) . A1.1.1.2.1 Find the Greatest Common Factor (GCF) and/or the Least Common Multiple (LCM) for sets of monomials. A1.1.1.3.1 Simplify/evaluate expressions involving properties/laws of exponents, roots, and/ or absolute values to solve problems. Note: Exponents should be integers from -10 to 10. A1.1.2.1.1 Write, solve, and/or apply a linear equation (including problem situations). A1.1.2.1.2 Use and/or identify an algebraic property to justify any step in an equation solving process. Note: Linear equations only. A1.1.2.1.3 Interpret solutions to problems in the context of the problem situation. Note: Linear equations only. A1.1.1.5.1 Add, subtract, and/or multiply polynomial expressions (express answers in simplest form). Note: Nothing larger than a binomial multiplied by a trinomial. Enduring Understandings:
• Know that there are numbers that are not rational, and approximate them by rational numbers. • Extend the properties of exponents to rational exponents. • Perform arithmetic operations on polynomials. • Solve equations and inequalities in one variable. • Create equations that describe numbers or relationships. • Define, evaluate, and compare functions. • Use functions to model relationships between quantities. • Understand solving equations as a process of reasoning and explain the reasoning. • Create equations that describe numbers or relationships. • Interpret functions that arise in applications in terms of the context.
2 Tunkhannock Area School District
Algebra 1 Curriculum Map 2014
• Define, evaluate, and compare functions. • Use functions to model relationships between quantities.
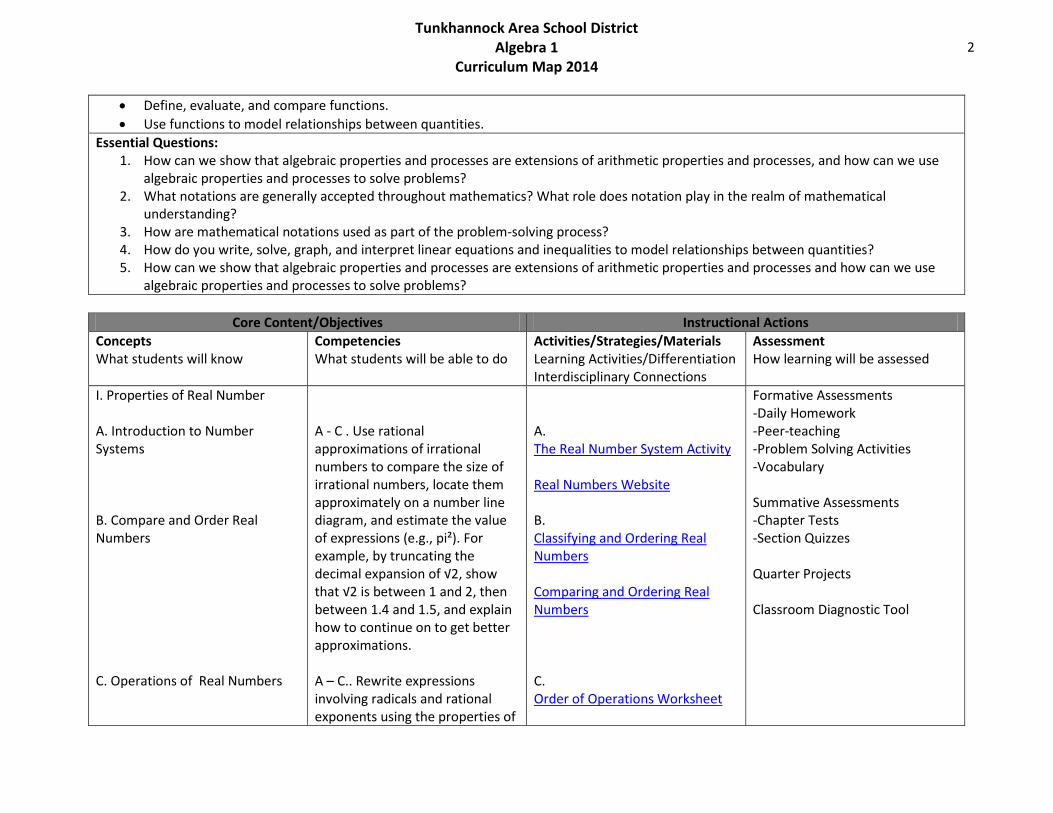
Essential Questions: 1. How can we show that algebraic properties and processes are extensions of arithmetic properties and processes, and how can we use
algebraic properties and processes to solve problems? 2. What notations are generally accepted throughout mathematics? What role does notation play in the realm of mathematical
understanding? 3. How are mathematical notations used as part of the problem-solving process? 4. How do you write, solve, graph, and interpret linear equations and inequalities to model relationships between quantities? 5. How can we show that algebraic properties and processes are extensions of arithmetic properties and processes and how can we use
algebraic properties and processes to solve problems?
Core Content/Objectives Instructional Actions Concepts What students will know
Competencies What students will be able to do
Activities/Strategies/Materials Learning Activities/Differentiation Interdisciplinary Connections
Assessment How learning will be assessed
I. Properties of Real Number A. Introduction to Number Systems B. Compare and Order Real Numbers C. Operations of Real Numbers
A - C . Use rational approximations of irrational numbers to compare the size of irrational numbers, locate them approximately on a number line diagram, and estimate the value of expressions (e.g., pi²). For example, by truncating the decimal expansion of √2, show that √2 is between 1 and 2, then between 1.4 and 1.5, and explain how to continue on to get better approximations. A – C.. Rewrite expressions involving radicals and rational exponents using the properties of
A. The Real Number System Activity Real Numbers Website B. Classifying and Ordering Real Numbers Comparing and Ordering Real Numbers C. Order of Operations Worksheet
Formative Assessments -Daily Homework -Peer-teaching -Problem Solving Activities -Vocabulary Summative Assessments -Chapter Tests -Section Quizzes Quarter Projects Classroom Diagnostic Tool

3 Tunkhannock Area School District
Algebra 1 Curriculum Map 2014
D. Apply Distributive Property II. Simplifying Expressions A. Simplify Square Roots B. Find Greatest Common Factor and Least Common Multiple
exponents. D. Understand that polynomials form a system analogous to the integers, namely, they are closed under the operations of addition, subtraction, and multiplication; add, subtract, and multiply polynomials. A. Use rational approximations of irrational numbers to compare the size of irrational numbers, locate them approximately on a number line diagram, and estimate the value of expressions (e.g., pi²). For example, by truncating the decimal expansion of √2, show that √2 is between 1 and 2, then between 1.4 and 1.5, and explain how to continue on to get better approximations. A. Rewrite expressions involving radicals and rational exponents using the properties of exponents. B - D. Explain how the definition of the meaning of rational exponents follows from extending the properties of integer exponents to those values, allowing for a notation for radicals
Balancing Exponents D. Distributive Matching Game Distributive Property A. Square Roots Game Square Root B. GCF Worksheets Apply GCF and LCM to Monomials

4 Tunkhannock Area School District
Algebra 1 Curriculum Map 2014
C. Use laws of exponents D. Absolute Value III. Linear Equations A. Solving One-Step Equations B. Solving Two-Step Equations
in terms of rational exponents. For example, we define 5 ˡ/³ to be the cube root of 5 because we want (5¹/³)³ = 5(¹/³)³ to hold, so (5¹/³)³ must equal 5. B - D. Rewrite expressions involving radicals and rational exponents using the properties of exponents. Use properties of rational and irrational numbers. B - D. Explain why the sum or product of two rational numbers is rational; that the sum of a rational number and an irrational number is irrational; and that the product of a nonzero rational number and an irrational number is irrational. A - F. Solve linear equations and inequalities in one variable, including equations with coefficients represented by letters. A - F. Create equations and inequalities in one variable and use them to solve problems. Include equations arising from linear and quadratic functions, and simple rational and exponential functions.
C. Exponent Activity Interactive Algebra Review D. Absolute Value Absolute Value Website A. Battleship Game One-Step Equations Website B. Hoop Shot Game Two Step Equations

5 Tunkhannock Area School District
Algebra 1 Curriculum Map 2014
C. Solving Multi-Step Equations D. Solving Equations with Variables on Both Sides E. Write and Solve Ratios and Proportions
A - F. Create equations in two or more variables to represent relationships between quantities; graph equations on coordinate axes with labels and scales. A - F. Understand that a function is a rule that assigns to each input exactly one output. The graph of a function is the set of ordered pairs consisting of an input and the corresponding output. A -F. Compare properties of two functions each represented in a different way (algebraically, graphically, numerically in tables, or by verbal descriptions). For example, given a linear function represented by a table of values and a linear function represented by an algebraic expression, determine which function has the greater rate of change. A - F. Interpret the equation y = mx + b as defining a linear function, whose graph is a straight line; give examples of functions that are not linear. For example, the function A = s² giving the area of a square as a function of its side length is not linear because its graph contains the points (1,1), (2,4) and (3,9),
C. Multi-step equation Game Solving Equations D. Equation Jeopardy How Sweet It Is! E. Solving Proportions Worksheet RATIO, PROPORTION AND PROBABILITY
6 Tunkhannock Area School District
Algebra 1 Curriculum Map 2014
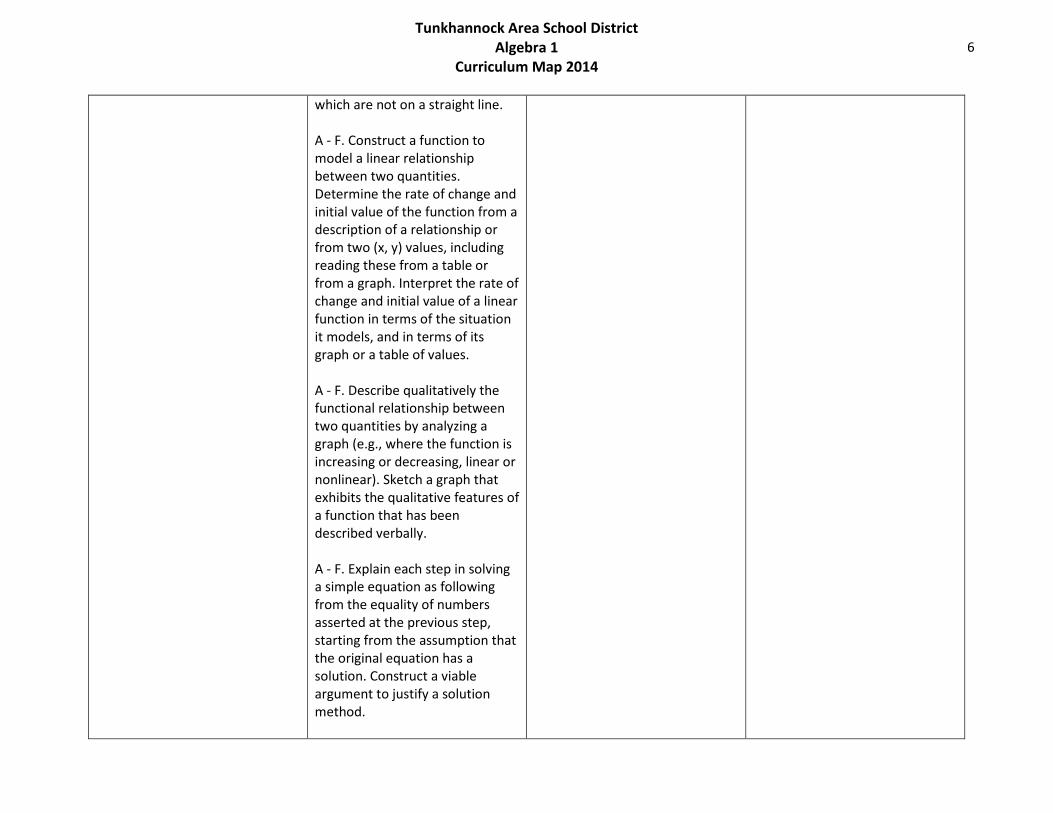
which are not on a straight line. A - F. Construct a function to model a linear relationship between two quantities. Determine the rate of change and initial value of the function from a description of a relationship or from two (x, y) values, including reading these from a table or from a graph. Interpret the rate of change and initial value of a linear function in terms of the situation it models, and in terms of its graph or a table of values. A - F. Describe qualitatively the functional relationship between two quantities by analyzing a graph (e.g., where the function is increasing or decreasing, linear or nonlinear). Sketch a graph that exhibits the qualitative features of a function that has been described verbally. A - F. Explain each step in solving a simple equation as following from the equality of numbers asserted at the previous step, starting from the assumption that the original equation has a solution. Construct a viable argument to justify a solution method.
7 Tunkhannock Area School District
Algebra 1 Curriculum Map 2014
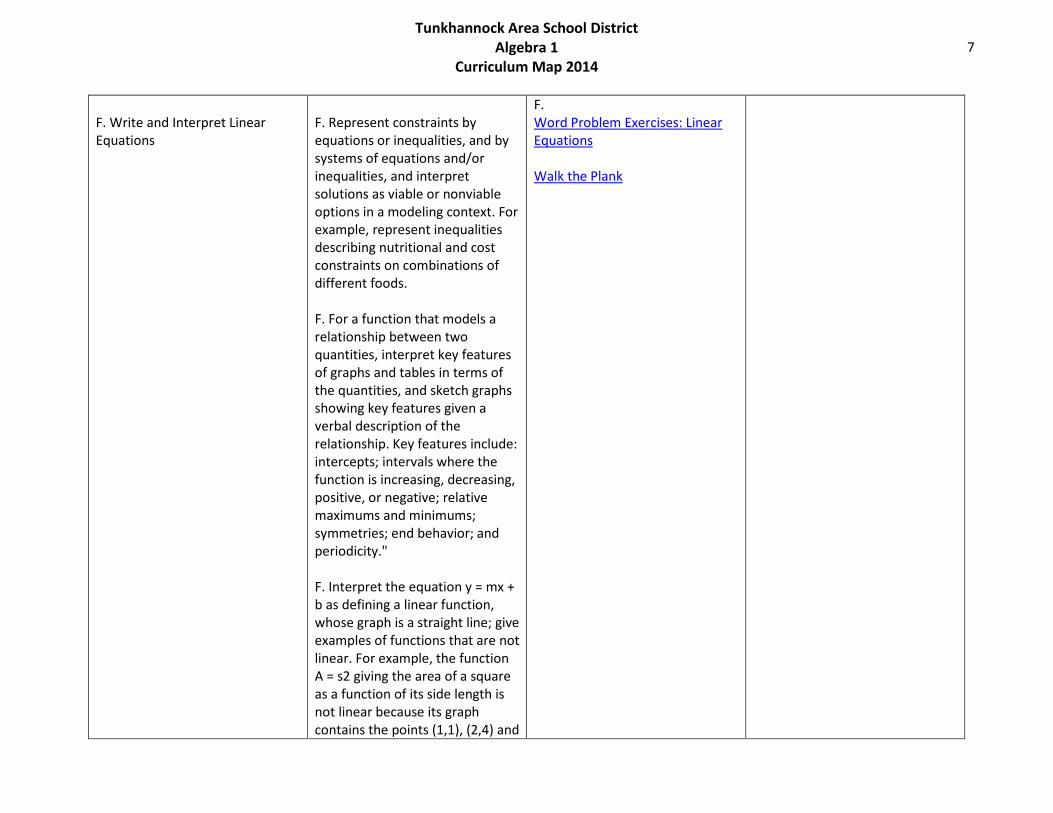
F. Write and Interpret Linear Equations
F. Represent constraints by equations or inequalities, and by systems of equations and/or inequalities, and interpret solutions as viable or nonviable options in a modeling context. For example, represent inequalities describing nutritional and cost constraints on combinations of different foods. F. For a function that models a relationship between two quantities, interpret key features of graphs and tables in terms of the quantities, and sketch graphs showing key features given a verbal description of the relationship. Key features include: intercepts; intervals where the function is increasing, decreasing, positive, or negative; relative maximums and minimums; symmetries; end behavior; and periodicity." F. Interpret the equation y = mx + b as defining a linear function, whose graph is a straight line; give examples of functions that are not linear. For example, the function A = s2 giving the area of a square as a function of its side length is not linear because its graph contains the points (1,1), (2,4) and
F. Word Problem Exercises: Linear Equations Walk the Plank

8 Tunkhannock Area School District
Algebra 1 Curriculum Map 2014
(3,9), which are not on a straight line. F. Construct a function to model a linear relationship between two quantities. Determine the rate of change and initial value of the function from a description of a relationship or from two (x, y) values, including reading these from a table or from a graph. Interpret the rate of change and initial value of a linear function in terms of the situation it models, and in terms of its graph or a table of values.
9 Tunkhannock Area School District
Algebra 1 Curriculum Map 2014
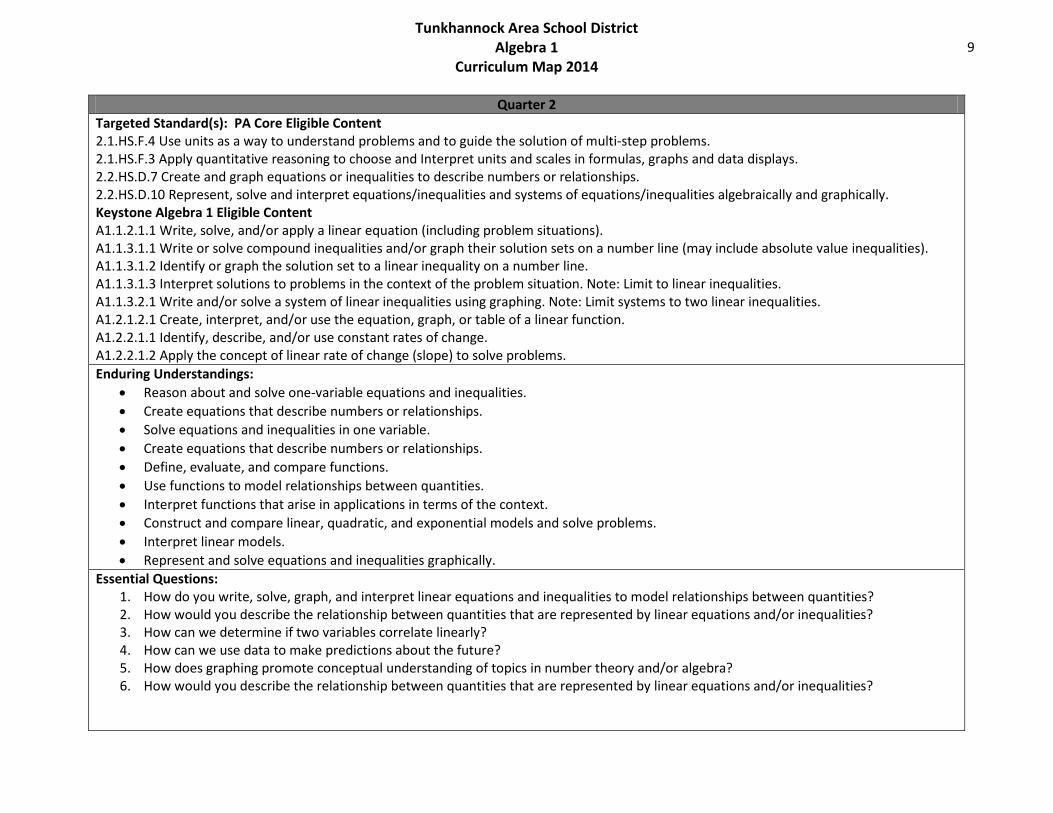
Quarter 2 Targeted Standard(s): PA Core Eligible Content 2.1.HS.F.4 Use units as a way to understand problems and to guide the solution of multi-step problems. 2.1.HS.F.3 Apply quantitative reasoning to choose and Interpret units and scales in formulas, graphs and data displays. 2.2.HS.D.7 Create and graph equations or inequalities to describe numbers or relationships. 2.2.HS.D.10 Represent, solve and interpret equations/inequalities and systems of equations/inequalities algebraically and graphically. Keystone Algebra 1 Eligible Content A1.1.2.1.1 Write, solve, and/or apply a linear equation (including problem situations). A1.1.3.1.1 Write or solve compound inequalities and/or graph their solution sets on a number line (may include absolute value inequalities). A1.1.3.1.2 Identify or graph the solution set to a linear inequality on a number line. A1.1.3.1.3 Interpret solutions to problems in the context of the problem situation. Note: Limit to linear inequalities. A1.1.3.2.1 Write and/or solve a system of linear inequalities using graphing. Note: Limit systems to two linear inequalities. A1.2.1.2.1 Create, interpret, and/or use the equation, graph, or table of a linear function. A1.2.2.1.1 Identify, describe, and/or use constant rates of change. A1.2.2.1.2 Apply the concept of linear rate of change (slope) to solve problems. Enduring Understandings:
• Reason about and solve one-variable equations and inequalities. • Create equations that describe numbers or relationships. • Solve equations and inequalities in one variable. • Create equations that describe numbers or relationships. • Define, evaluate, and compare functions. • Use functions to model relationships between quantities. • Interpret functions that arise in applications in terms of the context. • Construct and compare linear, quadratic, and exponential models and solve problems. • Interpret linear models. • Represent and solve equations and inequalities graphically.
Essential Questions: 1. How do you write, solve, graph, and interpret linear equations and inequalities to model relationships between quantities? 2. How would you describe the relationship between quantities that are represented by linear equations and/or inequalities? 3. How can we determine if two variables correlate linearly? 4. How can we use data to make predictions about the future? 5. How does graphing promote conceptual understanding of topics in number theory and/or algebra? 6. How would you describe the relationship between quantities that are represented by linear equations and/or inequalities?

10 Tunkhannock Area School District
Algebra 1 Curriculum Map 2014
Core Content/Objectives Instructional Actions
Concepts What students will know
Competencies What students will be able to do
Activities/Strategies/Materials Learning Activities/Differentiation Interdisciplinary Connections
Assessment How learning will be assessed
IV. Linear Inequalities A. Solving One-Step Inequalities B. Solving Two-Step Inequalities C. Solving Multi-Step Inequalities D. Solving Inequalities with Variables on Both Sides
A - D. Solve linear equations and inequalities in one variable, including equations with coefficients represented by letters. A - D. Create equations and inequalities in one variable and use them to solve problems. Include equations arising from linear and quadratic functions, and simple rational and exponential functions.
A. One-step Inequalities Worksheet An Introduction To Solving And Graphing Inequalities B. Two-step Inequalities Worksheet Two step equations and inequalities C. Multi-step Inequalities Worksheet Solving Multi-Step Inequalities D. Module - Solving Inequalities Solving Linear Inequalities
Formative Assessments -Daily Homework -Peer-teaching -Problem Solving Activities -Vocabulary Summative Assessments -Chapter Tests -Section Quizzes Quarter Projects Classroom Diagnostic Tool

11 Tunkhannock Area School District
Algebra 1 Curriculum Map 2014
E. Solve Compound Inequalities F. Write and Interpret Linear Inequalities V. Graph Linear Equations A. Use Coordinate Plane B. Graph Using Table of Values
E. Write an inequality of the form x > c or x < c to represent a constraint or condition in a real-world or mathematical problem. Recognize that inequalities of the form x > c or x < c have infinitely many solutions; represent solutions of such inequalities on number line diagrams. F. Represent constraints by equations or inequalities, and by systems of equations and/or inequalities, and interpret solutions as viable or nonviable options in a modeling context. For example, represent inequalities describing nutritional and cost constraints on combinations of different foods. A - D. Solve linear equations and inequalities in one variable, including equations with coefficients represented by letters. A - D. Create equations and inequalities in one variable and use them to solve problems. Include equations arising from linear and quadratic functions, and simple rational and
E. Compound Inequalities Worksheet Solving Inequalities F. Word Problem Exercises: Inequalities Building Bridges A. The Coordinate Plane Activity Coordinate Plane GeoGebra Activity B. Graph Using a Table Worksheet Fire Behavior
12 Tunkhannock Area School District
Algebra 1 Curriculum Map 2014
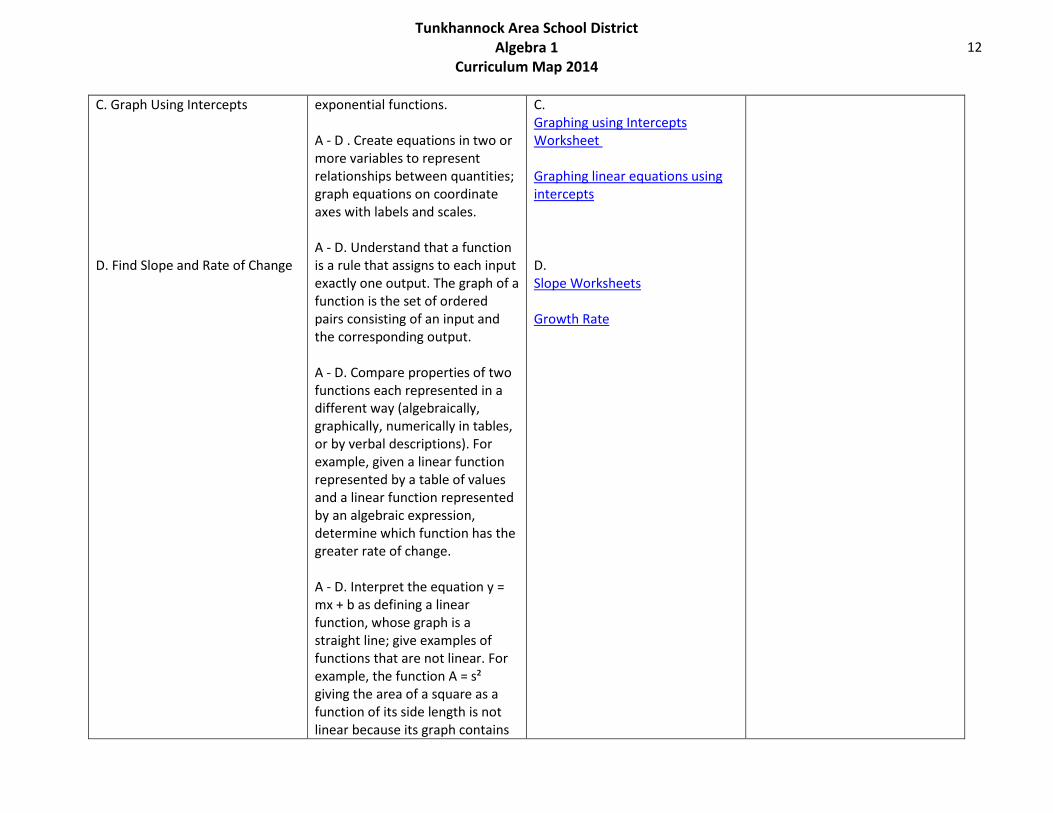
C. Graph Using Intercepts D. Find Slope and Rate of Change
exponential functions. A - D . Create equations in two or more variables to represent relationships between quantities; graph equations on coordinate axes with labels and scales. A - D. Understand that a function is a rule that assigns to each input exactly one output. The graph of a function is the set of ordered pairs consisting of an input and the corresponding output. A - D. Compare properties of two functions each represented in a different way (algebraically, graphically, numerically in tables, or by verbal descriptions). For example, given a linear function represented by a table of values and a linear function represented by an algebraic expression, determine which function has the greater rate of change. A - D. Interpret the equation y = mx + b as defining a linear function, whose graph is a straight line; give examples of functions that are not linear. For example, the function A = s² giving the area of a square as a function of its side length is not linear because its graph contains
C. Graphing using Intercepts Worksheet Graphing linear equations using intercepts D. Slope Worksheets Growth Rate
13 Tunkhannock Area School District
Algebra 1 Curriculum Map 2014
E. Graph Using Slope Intercept Form
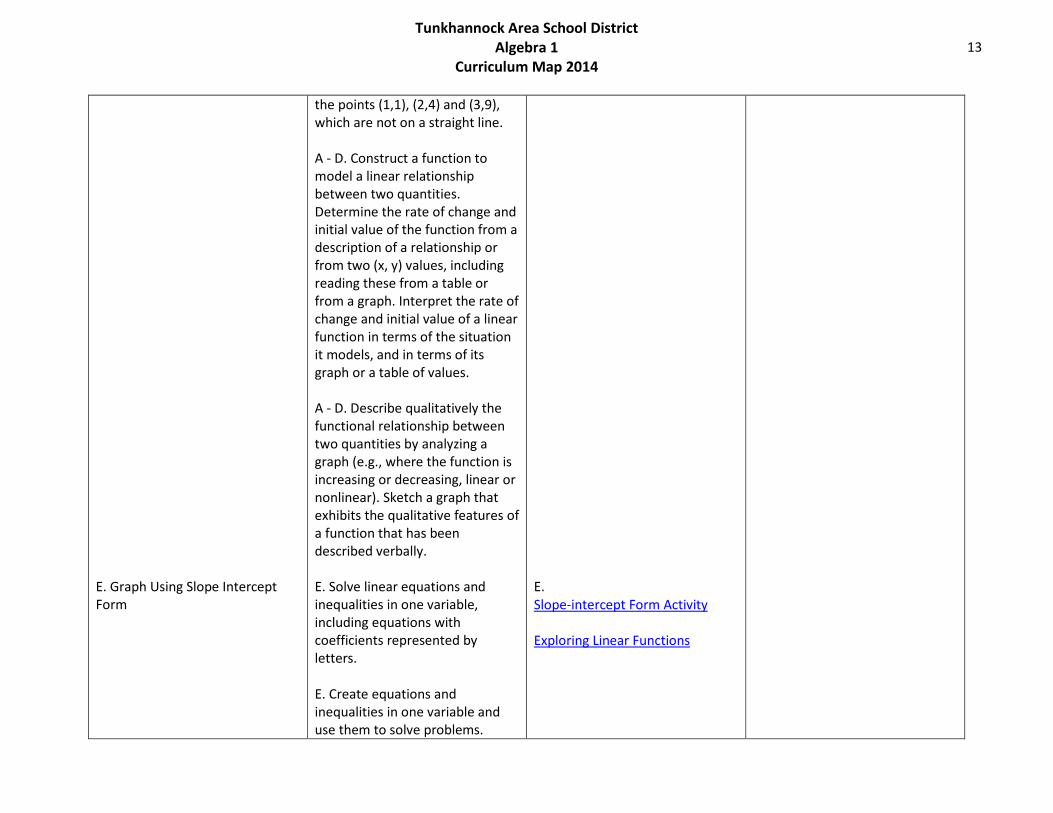
the points (1,1), (2,4) and (3,9), which are not on a straight line. A - D. Construct a function to model a linear relationship between two quantities. Determine the rate of change and initial value of the function from a description of a relationship or from two (x, y) values, including reading these from a table or from a graph. Interpret the rate of change and initial value of a linear function in terms of the situation it models, and in terms of its graph or a table of values. A - D. Describe qualitatively the functional relationship between two quantities by analyzing a graph (e.g., where the function is increasing or decreasing, linear or nonlinear). Sketch a graph that exhibits the qualitative features of a function that has been described verbally. E. Solve linear equations and inequalities in one variable, including equations with coefficients represented by letters. E. Create equations and inequalities in one variable and use them to solve problems.
E. Slope-intercept Form Activity Exploring Linear Functions

14 Tunkhannock Area School District
Algebra 1 Curriculum Map 2014
Include equations arising from linear and quadratic functions, and simple rational and exponential functions. E. Create equations in two or more variables to represent relationships between quantities; graph equations on coordinate axes with labels and scales. E. Understand that a function is a rule that assigns to each input exactly one output. The graph of a function is the set of ordered pairs consisting of an input and the corresponding output. E. Compare properties of two functions each represented in a different way (algebraically, graphically, numerically in tables, or by verbal descriptions). For example, given a linear function represented by a table of values and a linear function represented by an algebraic expression, determine which function has the greater rate of change. E. Interpret the equation y = mx + b as defining a linear function, whose graph is a straight line; give examples of functions that are not linear. For example, the function A = s² giving the area of a square

15 Tunkhannock Area School District
Algebra 1 Curriculum Map 2014
F. Interpret Graphs and Tables
as a function of its side length is not linear because its graph contains the points (1,1), (2,4) and (3,9), which are not on a straight line. E. Construct a function to model a linear relationship between two quantities. Determine the rate of change and initial value of the function from a description of a relationship or from two (x, y) values, including reading these from a table or from a graph. Interpret the rate of change and initial value of a linear function in terms of the situation it models, and in terms of its graph or a table of values. E. Describe qualitatively the functional relationship between two quantities by analyzing a graph (e.g., where the function is increasing or decreasing, linear or nonlinear). Sketch a graph that exhibits the qualitative features of a function that has been described verbally. F. For a function that models a relationship between two quantities, interpret key features of graphs and tables in terms of the quantities, and sketch graphs showing key features given a
F. Determining the Equation of a Line From a Graph Interpreting Graphs
16 Tunkhannock Area School District
Algebra 1 Curriculum Map 2014
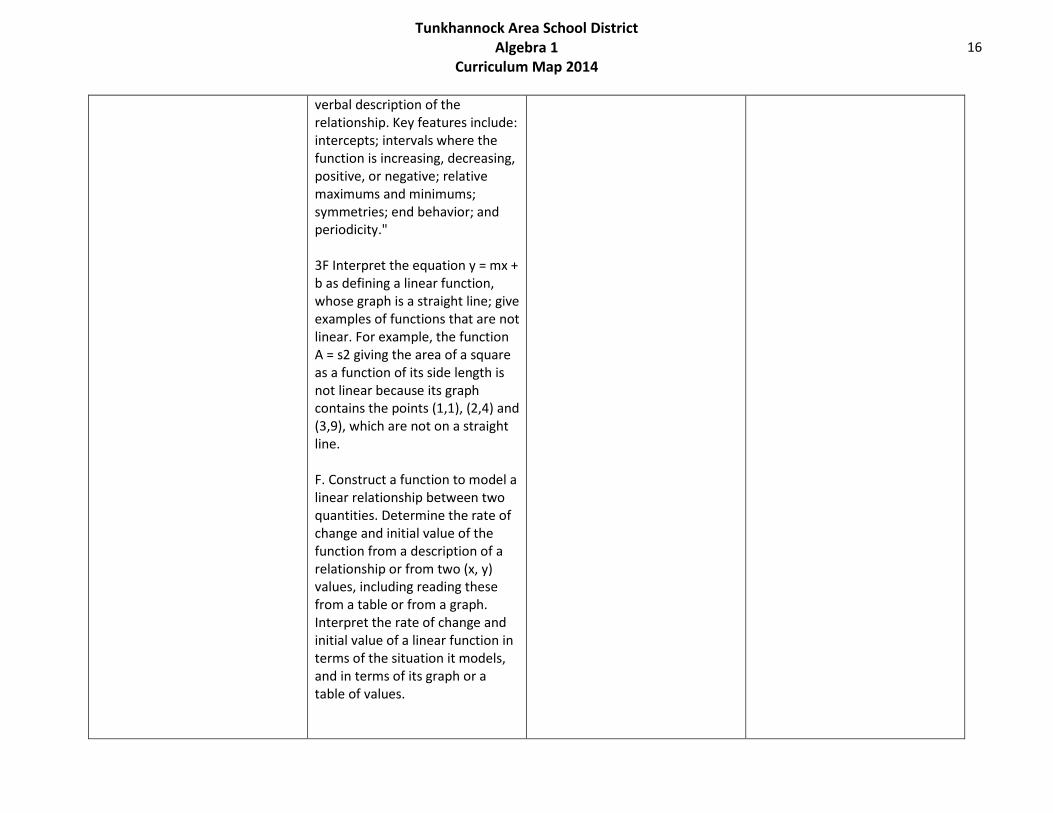
verbal description of the relationship. Key features include: intercepts; intervals where the function is increasing, decreasing, positive, or negative; relative maximums and minimums; symmetries; end behavior; and periodicity." 3F Interpret the equation y = mx + b as defining a linear function, whose graph is a straight line; give examples of functions that are not linear. For example, the function A = s2 giving the area of a square as a function of its side length is not linear because its graph contains the points (1,1), (2,4) and (3,9), which are not on a straight line. F. Construct a function to model a linear relationship between two quantities. Determine the rate of change and initial value of the function from a description of a relationship or from two (x, y) values, including reading these from a table or from a graph. Interpret the rate of change and initial value of a linear function in terms of the situation it models, and in terms of its graph or a table of values.

17 Tunkhannock Area School District
Algebra 1 Curriculum Map 2014
VI. Graph Linear Inequalities A. Graph Compound Inequalities B. Graph Linear Inequalities in Two Variables C. Interpret Graphs
A. Write an inequality of the form x > c or x < c to represent a constraint or condition in a real-world or mathematical problem. Recognize that inequalities of the form x > c or x < c have infinitely many solutions; represent solutions of such inequalities on number line diagrams. B. Graph the solutions to a linear inequality in two variables as a half plane (excluding the boundary in the case of a strict inequality), and graph the solution set to a system of linear inequalities in two variables as the intersection of the corresponding half-planes. C. Represent constraints by equations or inequalities, and by systems of equations and/or inequalities, and interpret solutions as viable or nonviable options in a modeling context. For example, represent inequalities describing nutritional and cost constraints on combinations of different foods.
A. Compound Inequalities Practice Compound Inequalities B. Graph Linear Inequalities Game Graphing linear inequalities C. Compound Inequalities Worksheet Graphs to Linear Inequalities

18 Tunkhannock Area School District
Algebra 1 Curriculum Map 2014
Quarter 3 Targeted Standard(s): PA Core Eligible Content 2.1.HS.F.4 Use units as a way to understand problems and to guide the solution of multi-step problems. 2.1.HS.C.3 Write functions or sequences that model relationships between two quantities. 2.2.HS.D.3 Extend the knowledge of arithmetic operations and apply to polynomials. 2.2.HS.D.4 Understand the relationship between zeros and factors of polynomials to make generalizations about functions and their graphs. 2.2.HS.D.5 Use polynomial identities to solve problems. 2.2.HS.D.7 Create and graph equations or inequalities to describe numbers or relationships. 2.2.HS.D.8 Apply inverse operations to solve equations or formulas for a given variable. 2.2.HS.D.9 Use reasoning to solve equations and justify the solution method. 2.2.HS.D.10 Represent, solve and interpret equations/inequalities and systems of equations/inequalities algebraically and graphically. 2.4.HS.B.2 Summarize, represent, and interpret data on two categorical and quantitative variables. 2.4.HS.B.3 Analyze linear models to make interpretations based on the data. Keystone Algebra 1 Eligible Content A1.1.1.5.1 Add, subtract, and/or multiply polynomial expressions (express answers in simplest form). Note: Nothing larger than a binomial multiplied by a trinomial. A1.1.1.5.2 Factor algebraic expressions, including difference of squares and trinomials. Note: Trinomials are limited to the form ax² + bx + c where ‘a’ is equal to 1 after factoring out all monomial factors. A1.1.1.5.3 Simplify/reduce a rational algebraic expression. A1.1.2.2.1 Write and/or solve a system of linear equations (including problem situations) using graphing, substitution, and/or elimination. Note: Limit systems to two linear equations. A1.1.2.2.2 Interpret solutions to problems in the context of the problem situation. Note: Limit systems to two linear equations. A1.1.3.2.1 Write and/or solve a system of linear inequalities using graphing. Note: Limit systems to two linear inequalities. A1.1.3.2.2 Interpret solutions to problems in the context of the problem situation. Note: Limit systems to two linear inequalities. A1.2.2.1.3 Write or identify a linear equation when given Note: Linear equation may be in point-slope, standard, and/or slope-intercept form. • the graph of the line, • two points on the line, or • the slope and a point on the line. A1.2.2.1.4 Determine the slope and/or y-intercept represented by a linear equation or graph. A1.2.2.2.1 Draw, identify, find, and/or write an equation for a line of best fit for a scatter plot. Enduring Understandings:
• Construct and compare linear, quadratic, and exponential models and solve problems. • Use functions to model relationships between quantities. • Interpret functions that arise in applications in terms of the context.

19 Tunkhannock Area School District
Algebra 1 Curriculum Map 2014
• Investigate patterns of association in bivariate data. • Summarize, represent, and interpret data on two categorical and quantitative variables • Create equations that describe numbers or relationships. • Solve systems of equations. • Analyze and solve linear equations and pairs of simultaneous linear equations. • Reason about and solve one-variable equations and inequalities. • Create equations that describe numbers or relationships. • Perform arithmetic operations on polynomials. • Interpret the structure of expressions. • Write expressions in equivalent forms to solve problems. • Rewrite rational expressions.
Essential Questions: 1. How do you write, solve, graph, and interpret linear equations and inequalities to model relationships between quantities? 2. How would you describe the relationship between quantities that are represented by linear equations and/or inequalities? 3. How can we determine if two variables correlate linearly? 4. How can we use data to make predictions about the future? 5. How does graphing promote conceptual understanding of topics in number theory and/or algebra? 6. How would you describe the relationship between quantities that are represented by linear equations and/or inequalities? 7. How do you write, solve, and interpret systems of two linear equations and inequalities using graphing and algebraic techniques? 8. How would you use graphical and/or algebraic techniques to solve a system of equations and how would you interpret the solutions of
that system?
Core Content/Objectives Instructional Actions Concepts What students will know
Competencies What students will be able to do
Activities/Strategies/Materials Learning Activities/Differentiation Interdisciplinary Connections
Assessment How learning will be assessed
VII. Write and Identify Linear Equations and Inequalities A. Slope-Intercept Form
A - C. Construct linear and exponential functions, including arithmetic and geometric sequences, given a graph, a description of a relationship, or
A. Slope-intercept Activity Writing Equations in Slope-intercept Form
Formative Assessments -Daily Homework -Peer-teaching -Problem Solving Activities -Vocabulary Summative Assessments -Chapter Tests
20 Tunkhannock Area School District
Algebra 1 Curriculum Map 2014
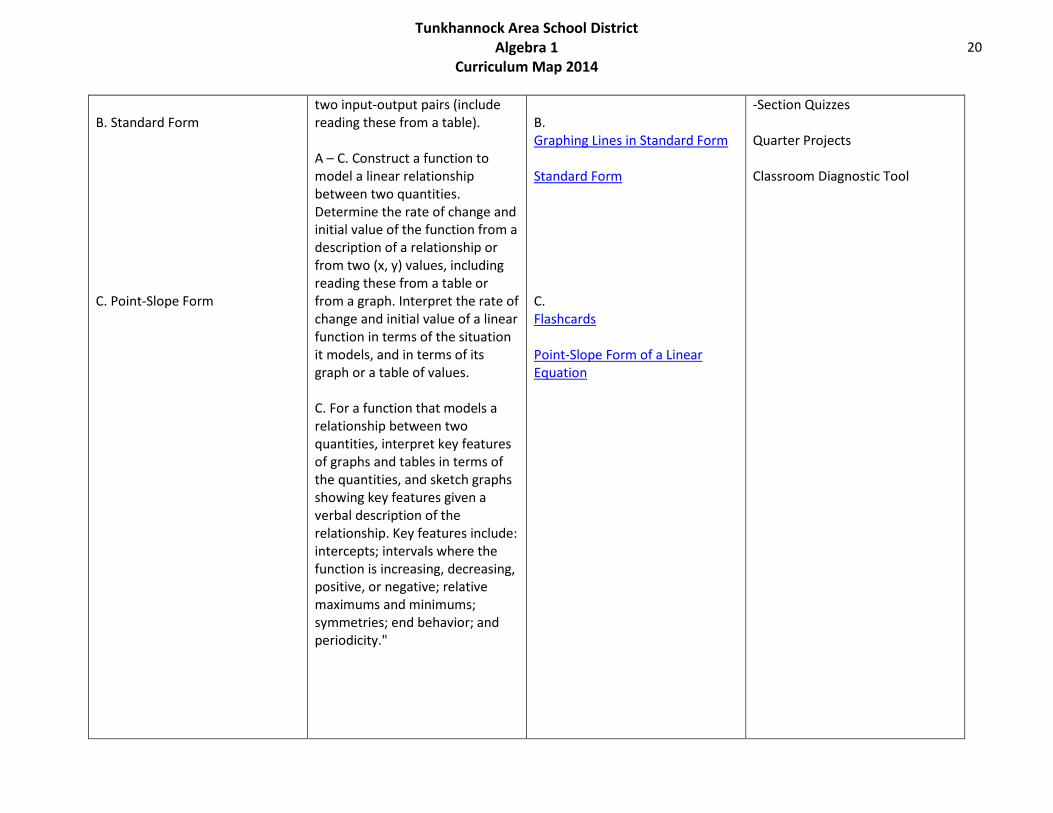
B. Standard Form C. Point-Slope Form
two input-output pairs (include reading these from a table). A – C. Construct a function to model a linear relationship between two quantities. Determine the rate of change and initial value of the function from a description of a relationship or from two (x, y) values, including reading these from a table or from a graph. Interpret the rate of change and initial value of a linear function in terms of the situation it models, and in terms of its graph or a table of values. C. For a function that models a relationship between two quantities, interpret key features of graphs and tables in terms of the quantities, and sketch graphs showing key features given a verbal description of the relationship. Key features include: intercepts; intervals where the function is increasing, decreasing, positive, or negative; relative maximums and minimums; symmetries; end behavior; and periodicity."
B. Graphing Lines in Standard Form Standard Form C. Flashcards Point-Slope Form of a Linear Equation
-Section Quizzes Quarter Projects Classroom Diagnostic Tool

21 Tunkhannock Area School District
Algebra 1 Curriculum Map 2014
D. Fit a Line to Data
D. Know that straight lines are widely used to model relationships between two quantitative variables. For scatter plots that suggest a linear association, informally fit a straight line, and informally assess the model fit by judging the closeness of the data points to the line. D. Represent data on two quantitative variables on a scatter plot, and describe how the variables are related. a. Fit a function to the data; use functions fitted to data to solve problems in the context of the data. Use given functions or choose a function suggested by the context. Emphasize linear, quadratic, and exponential models. b. Informally assess the fit of a function by plotting and analyzing residuals. c. Fit a linear function for a scatter plot that suggests a linear association.
D. Line of Best Fit Activity Lines of Best Fit
22 Tunkhannock Area School District
Algebra 1 Curriculum Map 2014
VIII. Systems of Equations and Inequalities A. Solve Linear Equations by Graphing B. Solve Linear Equations by Substitution C. Solve Linear Equations by Elimination
A - C. Create equations in two or more variables to represent relationships between quantities; graph equations on coordinate axes with labels and scales. A - C. Solve systems of linear equations exactly and approximately (e.g., with graphs), focusing on pairs of linear equations in two variables. A - C. Solve a simple system consisting of a linear equation and a quadratic equation in two variables algebraically and graphically. For example, find the points of intersection between the line y = –3x and the circle x²+y² = 3. A - C. Analyze and solve pairs of simultaneous linear equations. a. Understand that solutions to a system of two linear equations in two variables correspond to points of intersection of their graphs, because points of intersection satisfy both equations simultaneously. b. Solve systems of two linear equations in two variables algebraically, and estimate
A. Solving Systems of Equations by Graphing Solving Systems by Graphing B. Solving Systems of Equations by Substitution Solving Systems by Substitution C. Solving Systems of Equations by Elimination Solving Systems by Elimination Using Addition and Subtraction
http://www.kutasoftware.com/FreeWorksheets/Alg1Worksheets/Systems%20of%20Equations%20Elimination.pdf

23 Tunkhannock Area School District
Algebra 1 Curriculum Map 2014
D. Solve Linear Inequalities by Graphing E. Interpret Systems of Equations and Inequalities
solutions by graphing the equations. Solve simple cases by inspection. For example, 3x + 2y = 5 and 3x + 2y = 6 have no solution because 3x + 2y cannot simultaneously be 5 and 6. D. Write an inequality of the form x > c or x < c to represent a constraint or condition in a real-world or mathematical problem. Recognize that inequalities of the form x > c or x < c have infinitely many solutions; represent solutions of such inequalities on number line diagrams. E. Represent constraints by equations or inequalities, and by systems of equations and/or inequalities, and interpret solutions as viable or nonviable options in a modeling context. For example, represent inequalities describing nutritional and cost constraints on combinations of different foods. E. Analyze and solve pairs of simultaneous linear equations. c. Solve real-world and mathematical problems leading to two linear equations in two variables. For example, given
D. Solving Systems of Inequalities Graphing Systems of Inequalities E. Systems of Equations Word Problems Supply and Demand
24 Tunkhannock Area School District
Algebra 1 Curriculum Map 2014
IX. Polynomials A. Operations of Polynomials B. Factoring
coordinates for two pairs of points, determine whether the line through the first pair of points intersects the line through the second pair. A. Understand that polynomials form a system analogous to the integers, namely, they are closed under the operations of addition, subtraction, and multiplication; add, subtract, and multiply polynomials. B. Use the structure of an expression to identify ways to rewrite it. For example, see x ⁴ -y ⁴ as (x² )² - (y² ) ² ; thus recognizing it as a difference of squares that can be factored as (x² -y² )(x²+y²) B. Choose and produce an equivalent form of an expression to reveal and explain properties of the quantity represented by the expression." a. Factor a quadratic expression to reveal the zeros of the function it defines. b. Complete the square in a quadratic expression to reveal the maximum or minimum value of the function it defines. c. Use the properties of
A. Polynomials Adding and Subtracting Polynomials B. Factoring Puzzle: Factoring Trinomials

25 Tunkhannock Area School District
Algebra 1 Curriculum Map 2014
C. Simplify and Reduce
exponents to transform expressions for exponential functions. For example the expression 1.15 ˣ can be rewritten as (1.15¹/¹²)¹² ˣ ~1.012¹² ˣ to reveal the approximate equivalent monthly interest rate if the annual rate is 15%. C. Rewrite simple rational expressions in different forms; write a(x)/b(x) in the form q(x) + r(x)/b(x), where a(x), b(x), q(x), and r(x) are polynomials with the degree of r(x) less than the degree of b(x), using inspection, long division, or, for the more complicated examples, a computer algebra system.
C. Simplifying Rational Expressions Rational Expressions

26 Tunkhannock Area School District
Algebra 1 Curriculum Map 2014
Quarter 4 Targeted Standard(s): PA Core Eligible Content 2.1.HS.C.1 Use the concept and notation of functions to interpret and apply them in terms of their context. 2.1.HS.C.2 Graph and analyze functions and use their properties to make connections between the different representations. 2.1.HS.F.3- Apply quantitative reasoning to choose and Interpret units and scales in formulas, graphs and data displays. 2.2.HS.D.10 Represent, solve and interpret equations/inequalities and systems of equations/inequalities algebraically and graphically. 2.4.HS.B.1 Summarize, represent, and interpret data on a single count or measurement variable. 2.4.HS.B.4 Recognize and evaluate random processes underlying statistical experiments. 2.4.HS.B.5 Make inferences and justify conclusions based on sample surveys, experiments, and observational studies. 2.4.HS.B.6 Use the concepts of independence and conditional probability to interpret data. 2.4.HS.B.7 Apply the rules of probability to compute probabilities of compound events in a uniform probability model. Keystone Algebra 1 Eligible Content A1.1.1.4.1 Use estimation to solve problems A1.2.1.1.1 Analyze a set of data for the existence of a pattern and represent the pattern algebraically and/or graphically. A1.2.1.1.2 Determine whether a relation is a function, given a set of points or a graph. A1.2.1.1.3 Identify the domain or range of a relation (may be presented as ordered pairs, a graph, or a table). A1.2.1.2.1 Create, interpret, and/or use the equation, graph, or table of a linear function. A1.2.1.2.2 Translate from one representation of a linear function to another (i.e., graph, table, and equation). A1.2.3.1.1 Calculate and/or interpret the range, quartiles, and interquartile range of data. A1.2.3.2.1 Estimate or calculate to make predictions based on a circle, line, bar graph, measures of central tendency, or other representations. A1.2.3.2.2 Analyze data, make predictions, and/or answer questions based on displayed data (box-and-whisker plots, stem-and-leaf plots, scatter plots, measures of central tendency, or other representations). A1.2.3.2.3 Make predictions using the equations or graphs of best-fit lines of scatter plots. A1.2.3.3.1 Find probabilities for compound events (e.g., find probability of red and blue, find probability of red or blue) and represent as a fraction, decimal, or percent. Enduring Understandings:
• Understand the concept of a function and use function notation. • Define, evaluate, and compare functions. • Interpret functions that arise in applications in terms of the context. • Define, evaluate, and compare functions. • Use functions to model relationships between quantities. • Summarize, represent, and interpret data on a single count or measurement variable. • Summarize, represent, and interpret data on two categorical and quantitative variables. • Interpret linear models. • Understand independence and conditional probability and use them to interpret data.
27 Tunkhannock Area School District
Algebra 1 Curriculum Map 2014
• Solve real-life and mathematical problems using numerical and algebraic expressions and equations. Essential Questions:
1. How do you decide which functional representation to choose when modeling a real world situation, and how would you explain your solution to the problem?
2. How can we use univariate and bivariate data to analyze relationships and make predictions? 3. What functional representation would you choose to model a real-world situation and how would you explain your solution to the
problem? 4. How can we use data to make predictions about the future? 5. What notations are generally accepted throughout mathematics? What role does notation play in the realm of mathematical
understanding? 6. How are mathematical notations used as part of the problem-solving process?
Core Content/Objectives Instructional Actions Concepts What students will know
Competencies What students will be able to do
Activities/Strategies/Materials Learning Activities/Differentiation Interdisciplinary Connections
Assessment How learning will be assessed
X. Functions A. Identify Domain or Range B. Determine if Relation is a Function
A. Understand that a function from one set (called the domain) to another set (called the range) assigns to each element of the domain exactly one element of the range. If f is a function and x is an element of its domain, then f(x) denotes the output of f corresponding to the input x. The graph of f is the graph of the equation y = f(x). B. Understand that a function is a rule that assigns to each input exactly one output. The graph of a
A. Relation, Function, Domain & Range Domain and Range of a Function B. Functions &Relations
Formative Assessments -Daily Homework -Peer-teaching -Problem Solving Activities -Vocabulary Summative Assessments -Chapter Tests -Section Quizzes Quarter Projects Classroom Diagnostic Tool

28 Tunkhannock Area School District
Algebra 1 Curriculum Map 2014
C. Interpret Functions
function is the set of ordered pairs consisting of an input and the corresponding output.1 B. Understand that a function from one set (called the domain) to another set (called the range) assigns to each element of the domain exactly one element of the range. If f is a function and x is an element of its domain, then f(x) denotes the output of f corresponding to the input x. The graph of f is the graph of the equation y = f(x). C. For a function that models a relationship between two quantities, interpret key features of graphs and tables in terms of the quantities, and sketch graphs showing key features given a verbal description of the relationship. Key features include: intercepts; intervals where the function is increasing, decreasing, positive, or negative; relative maximums and minimums; symmetries; end behavior; and periodicity." C. Interpret the equation y = mx + b as defining a linear function, whose graph is a straight line; give examples of functions that are not linear. For example, the function
Relation Machines C. Functions Worksheet Functions

29 Tunkhannock Area School District
Algebra 1 Curriculum Map 2014
A = s2 giving the area of a square as a function of its side length is not linear because its graph contains the points (1,1), (2,4) and (3,9), which are not on a straight line. C. Construct a function to model a linear relationship between two quantities. Determine the rate of change and initial value of the function from a description of a relationship or from two (x, y) values, including reading these from a table or from a graph. Interpret the rate of change and initial value of a linear function in terms of the situation it models, and in terms of its graph or a table of values. C. Compare properties of two functions each represented in a different way (algebraically, graphically, numerically in tables, or by verbal descriptions). For example, given a linear function represented by a table of values and a linear function represented by an algebraic expression, determine which function has the greater rate of change. C. Construct a function to model a linear relationship between two quantities. Determine the rate of

30 Tunkhannock Area School District
Algebra 1 Curriculum Map 2014
change and initial value of the function from a description of a relationship or from two (x, y) values, including reading these from a table or from a graph. Interpret the rate of change and initial value of a linear function in terms of the situation it models, and in terms of its graph or a table of values. C. Describe qualitatively the functional relationship between two quantities by analyzing a graph (e.g., where the function is increasing or decreasing, linear or nonlinear). Sketch a graph that exhibits the qualitative features of a function that has been described verbally. C. For a function that models a relationship between two quantities, interpret key features of graphs and tables in terms of the quantities, and sketch graphs showing key features given a verbal description of the relationship. Key features include: intercepts; intervals where the function is increasing, decreasing, positive, or negative; relative maximums and minimums; symmetries; end behavior; and periodicity."

31 Tunkhannock Area School District
Algebra 1 Curriculum Map 2014
D. Analyze Patterns XI. Probability and Data Analysis A. Use Measures of Central Tendency
D. Construct a function to model a linear relationship between two quantities. Determine the rate of change and initial value of the function from a description of a relationship or from two (x, y) values, including reading these from a table or from a graph. Interpret the rate of change and initial value of a linear function in terms of the situation it models, and in terms of its graph or a table of values. D. Describe qualitatively the functional relationship between two quantities by analyzing a graph (e.g., where the function is increasing or decreasing, linear or nonlinear). Sketch a graph that exhibits the qualitative features of a function that has been described verbally. A. Represent data with plots on the real number line (dot plots, histograms, and box plots). A. Use statistics appropriate to the shape of the data distribution to compare center (median, mean) and spread (interquartile range, standard deviation) of two
D. Function Matching Machine Problem Solving and Patterns A. Fruit Loops/Cheerios Activity Measures of Central Tendency Assessments
32 Tunkhannock Area School District
Algebra 1 Curriculum Map 2014
or more different data sets. A. Interpret differences in shape, center, and spread in the context of the data sets, accounting for possible effects of extreme data points (outliers). A. Use the mean and standard deviation of a data set to fit it to a normal distribution and to estimate population percentages. Recognize that there are data sets for which such a procedure is not appropriate. Use calculators, spreadsheets, and tables to estimate areas under the normal curve. A. Summarize categorical data for two categories in two-way frequency tables. Interpret relative frequencies in the context of the data (including joint, marginal, and conditional relative frequencies). Recognize possible associations and trends in the data. A. Represent data on two quantitative variables on a scatter plot, and describe how the variables are related. a. Fit a function to the data; use functions fitted to data to solve problems in the context of the

33 Tunkhannock Area School District
Algebra 1 Curriculum Map 2014
B. Analyze Data and Make Predictions
data. Use given functions or choose a function suggested by the context. Emphasize linear, quadratic, and exponential models. b. Informally assess the fit of a function by plotting and analyzing residuals. c. Fit a linear function for a scatter plot that suggests a linear association. A. Interpret the slope (rate of change) and the intercept (constant term) of a linear model in the context of the data. a. Compute (using technology) and interpret the correlation coefficient of a linear fit. A. Distinguish between correlation and causation. B. Represent data with plots on the real number line (dot plots, histograms, and box plots). B. Use statistics appropriate to the shape of the data distribution to compare center (median, mean) and spread (interquartile range, standard deviation) of two or more different data sets. B. Interpret differences in shape,
B. Data Analysis with Graphs Don't Freeze the Engine

34 Tunkhannock Area School District
Algebra 1 Curriculum Map 2014
center, and spread in the context of the data sets, accounting for possible effects of extreme data points (outliers). B. Use the mean and standard deviation of a data set to fit it to a normal distribution and to estimate population percentages. Recognize that there are data sets for which such a procedure is not appropriate. Use calculators, spreadsheets, and tables to estimate areas under the normal curve. B. Summarize categorical data for two categories in two-way frequency tables. Interpret relative frequencies in the context of the data (including joint, marginal, and conditional relative frequencies). Recognize possible associations and trends in the data. B. Represent data on two quantitative variables on a scatter plot, and describe how the variables are related. a. Fit a function to the data; use functions fitted to data to solve problems in the context of the data. Use given functions or choose a function suggested by the context. Emphasize linear,

35 Tunkhannock Area School District
Algebra 1 Curriculum Map 2014
C. Find and Apply Probabilities
quadratic, and exponential models. b. Informally assess the fit of a function by plotting and analyzing residuals. c. Fit a linear function for a scatter plot that suggests a linear association. B. Interpret the slope (rate of change) and the intercept (constant term) of a linear model in the context of the data. a. Compute (using technology) and interpret the correlation coefficient of a linear fit. B. Distinguish between correlation and causation. C. Describe events as subsets of a sample space (the set of outcomes) using characteristics (or categories) of the outcomes, or as unions, intersections, or complements of other events(“or,” “and,” “not”). C. Understand that two events A and B are independent if the probability of A and B occurring together is the product of their probabilities, and use this characterization to determine if they are independent.
C. Compound Probability Webquest Real Life Probability

36 Tunkhannock Area School District
Algebra 1 Curriculum Map 2014
C. Understand the conditional probability of A given B as P(A and B)/P(B), and interpret independence of A and B as saying that the conditional probability of A given B is the same as the probability of A, and the conditional probability of B given A is the same as the probability of B. C. Construct and interpret two-way frequency tables of data when two categories are associated with each object being classified. Use the two-way table as a sample space to decide if events are independent and to approximate conditional probabilities. For example, collect data from a random sample of students in your school on their favorite subject among math, science, and English. Estimate the probability that a randomly selected student from your school will favor science given that the student is in tenth grade. Do the same for other subjects and compare the results. C. Recognize and explain the concepts of conditional probability and independence in everyday language and everyday situations. For example, compare

37 Tunkhannock Area School District
Algebra 1 Curriculum Map 2014
the chance of having lung cancer if you are a smoker with the chance of being a smoker if you have lung cancer. C. Find the conditional probability of A given B as the fraction of B’s outcomes that also belong to A, and interpret the answer in terms of the model. C. Apply the Addition Rule, P(A or B) = P(A) + P(B) – P(A and B), and interpret the answer in terms of the model. C. (+) Apply the general Multiplication Rule in a uniform probability model, P(A and B) = P(A)P(B|A) = P(B)P(A|B), and interpret the answer in terms of the model. C. (+) Use permutations and combinations to compute probabilities of compound events and solve problems. C. Find probabilities of compound events using organized lists, tables, tree diagrams, and simulation. a. Understand that, just as with simple events, the probability of a compound event is the fraction of outcomes in the sample space for

38 Tunkhannock Area School District
Algebra 1 Curriculum Map 2014
XII. Use Estimation to Solve Problems
which the compound event occurs. b. Represent sample spaces for compound events using methods such as organized lists, tables and tree diagrams. For an event described in everyday language(e.g., “rolling double sixes”), identify the outcomes in the sample space which compose the event. c. Design and use a simulation to generate frequencies for compound events. For example, use random digits as a simulation tool to approximate the answer to the question: If 40% of donors have type A blood, what is the probability that it will take at least 4 donors to find one with type A blood? Solve multi-step real-life and mathematical problems posed with positive and negative rational numbers in any form (whole numbers, fractions, and decimals), using tools strategically. Apply properties of operations to calculate with numbers in any form; convert between forms as appropriate; and assess the reasonableness of answers using mental computation and estimation
Estimate to solve word problems Estimate to solve square roots
39 Tunkhannock Area School District
Algebra 1 Curriculum Map 2014
strategies. For example: If a woman making $25 an hour gets a 10% raise, she will make an additional 1/10 of her salary an hour, or $2.50, for a new salary of $27.50. If you want to place a towel bar 9 3/4 inches long in the center of a door that is 27 1/2 inches wide, you will need to place the bar about 9 inches from each edge; this estimate can be used as a check on the exact computation.