TUNED VIBRATION ABSORBER DESIGN FOR A …etd.lib.metu.edu.tr/upload/12619394/index.pdf · Prof. Dr....
111
TUNED VIBRATION ABSORBER DESIGN FOR A SUPPORTED HOLLOW CYLINDRICAL STRUCTURE A THESIS SUBMITTED TO THE GRADUATE SCHOOL OF NATURAL AND APPLIED SCIENCES OF MIDDLE EAST TECHNICAL UNIVERSITY BY TUĞRUL AKSOY IN PARTIAL FULFILLMENT OF THE REQUIREMENTS FOR THE DEGREE OF MASTER OF SCIENCE IN MECHANICAL ENGINEERING SEPTEMBER 2015
Transcript of TUNED VIBRATION ABSORBER DESIGN FOR A …etd.lib.metu.edu.tr/upload/12619394/index.pdf · Prof. Dr....

TUNED VIBRATION ABSORBER DESIGN FOR A SUPPORTED HOLLOW
CYLINDRICAL STRUCTURE
A THESIS SUBMITTED TO
THE GRADUATE SCHOOL OF NATURAL AND APPLIED SCIENCES
OF
MIDDLE EAST TECHNICAL UNIVERSITY
BY
TUĞRUL AKSOY
IN PARTIAL FULFILLMENT OF THE REQUIREMENTS
FOR
THE DEGREE OF MASTER OF SCIENCE
IN
MECHANICAL ENGINEERING
SEPTEMBER 2015


Approval of the thesis:
TUNED VIBRATION ABSORBER DESIGN FOR A SUPPORTED HOLLOW
CYLINDRICAL STRUCTURE
submitted by TUĞRUL AKSOY in partial fulfillment of the requirements for the
degree of Master of Science in Mechanical Engineering Department, Middle
East Technical University by,
Prof. Dr. Gülbin Dural Ünver ________________
Dean, Graduate School of Natural and Applied Sciences
Prof. Dr. Tuna Balkan ________________
Head of Department, Mechanical Engineering
Asst. Prof.Dr. Gökhan O. Özgen ________________
Supervisor, Mechanical Engineering Dept., METU
Examining Committee Members:
Prof. Dr. Mehmet Çalışkan ________________
Mechanical Engineering Dept., METU
Asst. Prof. Dr. Gökhan O. Özgen ________________
Mechanical Engineering Dept., METU
Assoc. Prof. Dr. Yiğit Yazıcıoğlu ________________
Mechanical Engineering Dept., METU
Asst. Prof. Dr. Kutluk Bilge Arıkan ________________
Mechatronic Engineering Dept., Atılım University
Assoc. Prof. Dr. Ender Ciğeroğlu ________________
Mechanical Engineering Dept., METU
Date: 08.09.2015

iv
I hereby declare that all information in this document has been obtained and
presented in accordance with academic rules and ethical conduct. I also declare
that, as required by these rules and conduct, I have fully cited and referenced
all material and results that are not original to this work.
Name, Last name: Tuğrul AKSOY
Signature:

v
ABSTRACT
TUNED VIBRATION ABSORBER DESIGN FOR A SUPPORTED HOLLOW
CYLINDRICAL STRUCTURE
Aksoy, Tuğrul
M. S. Department of Mechanical Engineering
Supervisor: Assist. Prof. Gökhan O. Özgen
September 2015, 93 pages
Supported hollow structural elements have a usage area in various types of structures
or machines. They exhibit an oscillatory behavior under various excitations since
their modal frequencies are quite low. This behavior results in vibrations which reach
huge amplitudes especially at the tip of the structures. This situation may be harmful
for the structural integrity of the structures and may reduce the service life.
Moreover, these vibrations can distort the performance of the machines’ which
involve the supported hollow structure.
In this thesis study, a tuned vibration absorber (also called as tuned mass damper)
design is proposed to suppress the vibrations of a supported hollow cylindrical
structure under impulsive loading. Within the scope of this study, a tuned vibration
absorber (TVA) designed and applied on a sample supported hollow cylinder
structure. Then, the mitigation in vibration amplitudes as a result of this application
is investigated.
In order to see the effectiveness of the TVA application, a physical structure
involving a supported hollow cylindrical structure is designed and manufactured.
TVA is designed by considering the modal parameters of this physical structure and
applied on it. Experiments are carried out in order to verify the effectiveness of the
TVA application on the dynamics of the system. After then, dynamic test are carried

vi
out on the system and the mitigation in vibration levels is investigated as the result of
the TVA application.
Keywords: Supported hollow cylinder vibrations, tuned vibration absorbers, tuned
mass dampers

vii
ÖZ
DESTEKLENMİŞ İÇİ BOŞ SİLİNDİRİK BİR YAPI İÇİN AYARLI TİTREŞİM
EMİCİ TASARIMI
Aksoy, Tuğrul
Yüksek lisans, Makine Mühendisliği Bölümü
Tez Yöneticisi: Yrd. Doç Dr. Gökhan O. Özgen
Eylül 2015, 93 sayfa
Desteklenmiş içi boş yapısal elemanlar, çeşitli yapılarda ve makinalarda kullanım
alanı bulmaktadırlar. Bu yapısal elemanlar, doğal frekanslarının oldukça düşük
olması nedeniyle çeşitli tahrikler altında salınımlı davranış göstermektedirler. Bu
davranış, özellikle yapıların uç kısımlarında yüksek genliklere ulaşan titreşimlere yol
açabilmektedir. Bu durum, söz konusu yapıların yapısal bütünlüğü açısından zararlı
olabilmekte ve servis ömürlerini azaltabilmektedir. Ayrıca bu titreşimler,
desteklenmiş içi boş yapısal elemanları içeren makinaların performansını da
bozabilmektedir.
Bu tez çalışmasında, desteklenmiş içi boş bir silindirik yapının titreşim seviyelerini
azaltmak için bir ayarlı titreşim emici (ayarlı kütle sönümleyici olarak da adlandırılır)
tasarımı önerilmiştir. Çalışma kapsamında bir ayarlı titreşim emici (TVA)
tasarlanmış ve örnek bir desteklenmiş içi boş silindirik yapının üzerine
uygulanmıştır. Sonrasında, bu uygulama sonucunda titreşim büyüklüklerinde
meydana gelen azalma incelenmiştir.
TVA uygulamasının etkinliğini görebilmek amacıyla, desteklenmiş içi boş silindirik
bir yapı içeren deneysel bir prototip tasarlanmış ve üretilmiştir. TVA tasarımı da bu
deneysel prototipin modal parametreleri dikkate alınarak gerçekleştirilmiş ve
prototipin üzerine uygulanmıştır. Sonrasında, sistem üzerinde dinamik testler

viii
gerçekleştirilmiş ve TVA uygulaması sonucunda titreşim seviyelerinde meydana
gelen azalma incelenmiştir.
Anahtar kelimeler: Desteklenmiş içi boş silindir titreşimleri, ayarlı titreşim
emiciler, ayarlı kütle sönümleyicileri

ix
ACKNOWLEDGMENTS
The author wants to thank his supervisor Asst. Prof. Dr. Gökhan ÖZGEN and his
manager Mr. Bülent ACAR for their precious advices, critics and suggestions
throughout the thesis study.
The author also wishes to thank his colleagues Caner GENÇOĞLU, Bilgehan
ERDOĞAN and Haşim ÖZEL because of their substantial efforts and assistances
during the experimental studies.
The author would also like to thank Tahsin ŞAHİN due to his worthwhile assistance
while the production of experimental prototype.
Finally author sends his greatest thanks to his family due to their support and
encouragement over many years.

x
TABLE OF CONTENTS
ABSTRACT ................................................................................................................. v
ÖZ ............................................................................................................................... vii
ACKNOWLEDGMENTS ........................................................................................... ix
TABLE OF CONTENTS ............................................................................................. x
LIST OF TABLES ..................................................................................................... xii
LIST OF FIGURES ................................................................................................... xiii
NOMENCLATURE ................................................................................................. xvii
CHAPTERS
1. INTRODUCTION ................................................................................................ 1
2. LITERATURE SURVEY ..................................................................................... 3
2.1. BASIC THEORY OF TUNED VIBRATION ABSORBERS ...................... 3
2.1.1. The Undamped Tuned Vibration Absorbers .......................................... 4
2.1.2. The Damped Tuned Vibration Absorbers .............................................. 8
2.2. TUNED VIBRATION ABSORBER DESIGN STUDIES FOR
RESONANT VIBRATION PROBLEMS .............................................................. 11
2.3. TVA DESIGN STUDIES FOR SLENDER STRUCTURES ..................... 15
2.4. VARIOUS TYPES OF TVA APPLICATIONS ......................................... 20
3. DESCRIPTION OF THE VIBRATION CONTROL PROBLEM ..................... 25
3.1. DESCRIPTION OF THE PHYSICAL STRUCTURE ............................... 25
xi
3.2. DEFINITION OF THE VIBRATION PROBLEM ..................................... 32
3.3. VALIDATION OF THE FINITE ELEMENT MODEL OF THE
STRUCTURE ......................................................................................................... 33
4. DESIGN OF TVA .............................................................................................. 49
4.1. DETERMINATION OF THE TVA PARAMETERS ................................ 49
4.2. REALIZATION OF THE TVA DESIGN ................................................... 64
4.3. EXPERIMENTAL VERIFICATION OF THE TVA PARAMETERS ...... 69
5. CHARACTERIZATION OF THE VIBRATION CONTROL PERFORMANCE
OF TVA ..................................................................................................................... 73
5.1. COMPARISON FOR THE WITHOUT MASS CASE .............................. 74
5.2. COMPARISON FOR THE MASS ADDED CASE ................................... 77
5.3. TOTAL ANALYSIS-TEST COMPARISON ............................................. 80
6. CONCLUSION AND FUTURE WORK ........................................................... 85
REFERENCES ........................................................................................................... 87
APPENDICES ........................................................................................................... 91
Appendix A: Technical Specifications of the Accelerometers............................... 91
Appendix B: Technical Specifications of the Impact Hammer .............................. 92
Appendix C: Technical Specifications of the Modal Shaker ................................. 93

xii
LIST OF TABLES
TABLES
Table 2-1: Modal test and MATLAB results for the plain gun barrel [7] .................. 16
Table 2-2: Modal impact testing results with vibration absorber [7] ......................... 17
Table 3-1: Modal analysis results obtained from FEA .............................................. 32
Table 3-2: Results for the first three modes of the physical structure ........................ 41
Table 3-3: Comparison of the natural frequency and mode shape results ................. 44
Table 4-1: Selected TVA Parameters ......................................................................... 55
Table 4-2: Maximum harmonic response amplitudes for different angular
orientations of the TVA .............................................................................................. 60
Table 4-3: The final TVA parameter combination ..................................................... 64
Table 4-4: Damping ratios with respect to various magnet positions ........................ 72
Table 5-1: Comparison of the optimum and realized TVA parameters ..................... 80
Table 5-2: Comparison of the maximum harmonic displacements and total reductions
.................................................................................................................................... 83

xiii
LIST OF FIGURES
FIGURES
Figure 2-1: Addition of small k-m vibration absorber to the main K-M system [1] ... 5
Figure 2-2: Change of the two resonance frequencies with respect to the mass ratio . 7
Figure 2-3: Vibration amplitudes of the main system with respect to various
disturbing frequencies .................................................................................................. 7
Figure 2-4: Responses of the main mass with respect to various damping values .... 10
Figure 3-1: CAD model of the sample physical structure.......................................... 26
Figure 3-2: Optimized dimensions of the back and front foot plates ......................... 27
Figure 3-3: General view of the fabricated structure ................................................. 27
Figure 3-4: Clamp-tube connection detail ................................................................. 28
Figure 3-5: General mesh structure of the physical structure .................................... 29
Figure 3-6: Tie constraints between the parts of physical structure........................... 30
Figure 3-7: Fixed boundary condition regions ........................................................... 30
Figure 3-8: 1st mode (tip-off) of the prototype (FEA result) ...................................... 31
Figure 3-9: 2nd
mode (side-off) of the prototype (FEA result)................................... 31
Figure 3-10: 3rd
mode of the prototype (FEA result) ................................................. 32
Figure 3-11: Accelerometer locations on the physical structure ................................ 34
Figure 3-12: Impact hammer used in the modal tests ................................................ 35
Figure 3-13: Excitation location................................................................................. 35
Figure 3-14: Sample force-time data obtained during modal tests ............................ 36
Figure 3-15: LMS hardware used in the modal tests ................................................. 36
Figure 3-16: PCB accelerometers .............................................................................. 37
Figure 3-17: Sample acceleration-time data obtained during modal tests ................. 37
Figure 3-18: 1st mode (tip-off) of the prototype (test result) ...................................... 38
Figure 3-19: 2nd
mode (side-off) of the prototype (test result)................................... 38
Figure 3-20: 3rd
mode of the prototype (test result) ................................................... 39
Figure 3-21: Driving point input and response directions ......................................... 40
Figure 3-22: Coherence data obtained from the driving point ................................... 40
Figure 3-23: FRF data obtained from the driving point ............................................. 41
Figure 3-24: Test-analysis comparison for the 1st (tip-off) mode .............................. 42

xiv
Figure 3-25: Test-analysis comparison for the 2nd
(side-off) mode ........................... 42
Figure 3-26: Test-analysis comparison for the 3rd
mode ............................................ 43
Figure 3-27: MAC number matrix for the comparison of experimental and FEA
models ........................................................................................................................ 44
Figure 3-28: Location of the FRF measurement accelerometer ................................. 45
Figure 3-29: FRF comparison in x-axes ..................................................................... 46
Figure 3-30: FRF comparison in y-axes ..................................................................... 46
Figure 3-31: FRF comparison in z-axes ..................................................................... 47
Figure 4-1: Forcing location on the prototype model ................................................ 51
Figure 4-2: Harmonic displacement response at the tip of prototype (0-20 Hz) ........ 52
Figure 4-3: Harmonic displacement response at the tip of prototype (0-100 Hz) ...... 52
Figure 4-4: TVA modelling on the FEA model ......................................................... 53
Figure 4-5: Constraint between two points of the spring/dashpot feature ................. 54
Figure 4-6: Harmonic displacement reading point ..................................................... 56
Figure 4-7: Harmonic responses for different TVA masses (ωn= 9.3 Hz; ζ=0.3) ...... 57
Figure 4-8: Harmonic responses for different damping ratios (m=400 grams; ωn= 9.3
Hz) .............................................................................................................................. 57
Figure 4-9: Harmonic responses for different tuning frequencies (m=400 grams;
ζ=0.3) .......................................................................................................................... 58
Figure 4-10: Maximum harmonic response amplitudes with respect to different TVA
masses ......................................................................................................................... 58
Figure 4-11: Maximum harmonic response amplitudes with respect to different
tuning frequencies ...................................................................................................... 59
Figure 4-12: Maximum harmonic response amplitudes with respect to different
damping ratios ............................................................................................................ 59
Figure 4-13: Angular orientation of the TVA on the FEA model .............................. 60
Figure 4-14: Maximum harmonic response amplitudes for different angular
orientations of the TVA .............................................................................................. 61
Figure 4-15: Harmonic responses for different angular orientations of the TVA ...... 61
Figure 4-16: Additional mass part and its location on the FEA model ...................... 62
Figure 4-17: Harmonic responses for the unmodified cases ...................................... 63
Figure 4-18: Harmonic responses for the modified with optimized TVA cases ........ 63
xv
Figure 4-19: Harmonic responses obtained with the final TVA parameter
combination ................................................................................................................ 64
Figure 4-20: CAD model of the TVA assembly ........................................................ 65
Figure 4-21: Fabricated TVA assembly and components .......................................... 66
Figure 4-22: Slotted configuration of the magnet plates ............................................ 67
Figure 4-23: Measurement of the TVA mass ............................................................. 68
Figure 4-24: Modal shaker and accelerometer locations on the TVA assembly ....... 70
Figure 4-25: FRF results obtained for different magnet-copper plate distances ........ 71
Figure 4-26: Sample FRF comparison for the damping ratio identification .............. 72
Figure 5-1: TVA location on the physical structure................................................... 73
Figure 5-2: Fastening of the TVA assembly .............................................................. 74
Figure 5-3: Without mass case - Comparison of the test FRF results (x-direction) .. 75
Figure 5-4: Without mass case - Comparison of the test FRF results (y-direction) . 75
Figure 5-5: Without mass case - Comparison of the test FRF results (z-direction) ... 76
Figure 5-6: Analysis-test FRF comparison for the modified case (x-axes) ............... 76
Figure 5-7: Analysis-test FRF comparison for the modified case (y-axes) ............... 77
Figure 5-8: Analysis-test FRF comparison for the modified case (z-axes) ............... 77
Figure 5-9: Attachment of the additional mass on the physical structure .................. 78
Figure 5-10: Mass added case – Comparison of the test FRF results (x-direction) ... 78
Figure 5-11: Mass added case - Comparison of the test FRF results (y-direction).... 79
Figure 5-12: Mass added case - Comparison of the test FRF results (z-direction) .... 79
Figure 5-13: Total harmonic displacement comparison for the optimized TVA
(Analysis) ................................................................................................................... 81
Figure 5-14: Total harmonic displacement comparison for the realized TVA
(Analysis) ................................................................................................................... 81
Figure 5-15: Total harmonic displacement comparison (Experimental) ................... 82
Figure 5-16: Comparison of the harmonic displacements for unmodified case ........ 83
Figure 5-17: Comparison of the harmonic displacements for modified case ............ 83

xvi

xvii
NOMENCLATURE
TVA: tuned vibration absorber
DVA: dynamic vibration absorber
TMD: tuned mass damper
SDOF: single degree of freedom
MDOF: multiple degrees of freedom
g: gravity acceleration
Hz: hertz
dB: decibel
mm: milimeters
M: mass of the main system
m : mass of the vibration absorber
K: stiffness of the main system
k: stiffness of the vibration absorber
x1: response of the main system
x2: response of the tuned vibration absorber
a1: response amplitude of the main system
a2: response amplitude of the vibration absorber
P0: excitation amplitude
ω: excitation frequency
ωn: natural frequency

xviii
xst: static deflection
µ: mass ratio
ωa: natural frequency of the vibration absorber
Ωn: natural frequency of the main system
c: damping coefficient of the vibration absorber
j: square root of minus one
f: natural frequency ratio
g: forced frequency ratio
cc: critical damping coefficient
fopt: optimum natural frequency of the vibration absorber
ζ: damping ratio
MAC: modal assurance criteria
FFT: fast fourier Transform
FRF: frequency response function
PSD: power spectral density
FEA: finite element analysis

1
CHAPTER 1
1. INTRODUCTION
Tuned vibration absorbers (TVA) can be effectively used to suppress resonant and
forced vibration response in mechanical structures. However, each tuned vibration
absorber application will have to be handled as a standalone design project since
there is quite a bit of variation in the types of vibration problems. Besides, tuned
vibration absorbers have to be integrated to the structure of interest which does not
necessarily have standardized mechanical interfaces.
In this thesis study, design of a tuned vibration absorber to suppress the resonant
vibration response of a supported hollow cylinder structure is investigated. The
structure is a representative structure constructed to simulate a scenario where the
beam like structures tip response is dominated resonant vibrations with main
contribution coming from its lowest transverse vibration modes. The structure is
modeled in 3 dimensions and lowest structural modes are transverse bending modes
which are also very closely spaced. An SDOF tuned vibration absorber is designed to
suppress the vibration response around these two lowest modal frequencies. The two
modes are in fact transverse modes that are almost orthogonal and the single tuned
vibration absorber is to be integrated to be interacting with both modes which are one
of the several design challenges of the particular application. Other challenges
include the determination of the basic tuned vibration absorber parameters (mass,
stiffness and damping ratio) and orientation of the TVA system on the structure.
In the beginning of study, a literature survey is presented in the second chapter. This
literature survey is divided into four parts. In the first part, fundamentals of the tuned
vibration absorber theory are explained which is based on single degree of freedom
tuned vibration absorber application on a single degree of freedom system. Second
chapter is also divided into two sections. In the first section, the basic theory of
undamped tuned vibration absorber is explained and the damped vibration absorber
theory is presented in the second section. Second part of this chapter is allocated to
the guidelines for suppressing resonant vibration problems in mechanical structures.
2
In the third part, tuned vibration absorber design works for the transverse vibrations
of slender structures are presented. Various types of tuned vibration absorber
applications are explained in the final part of this chapter.
Third chapter is allocated for the description of the vibration control problem and this
chapter is divided into three parts. In the first part, physical structure is described and
analysis results are performed on the finite element model of this structure. The
vibration control problem is explained with details in the second part. In the third
part of this chapter, experimental verification of the finite element model of the
physical structure is explained.
In the fourth chapter, design of the tuned vibration absorber is clarified. This chapter
is also divided into three parts. In the first part, optimization study for the
identification of the tuned vibration absorber parameters is explained with details. In
the second part of the fifth chapter, the conceptual design solution for the realization
of the tuned vibration absorber parameters is presented. Characterization tests
performed to verify the tuned vibration absorber parameters are explained in the third
part.
In the fifth chapter, the tuned vibration absorber design is verified via experiments
carried out on a physical structure. Experiments and main results are explained
elaborately.
In the final chapter, main results of the study are evaluated and the conclusion is
presented. In addition, the predictions and suggestions about the future of this study
are established.
3
CHAPTER 2
2. LITERATURE SURVEY
Tuned vibration absorbers are frequently used systems for controlling and reducing
the vibration amplitudes of structures and machines. They can be designed for
absorption of vibrational energy at a single frequency. They can also be designed to
be effective in a frequency bandwidth.
A comprehensive literature research is performed in this thesis for the various types
of TVA designs and applications. Report of the literature survey conducted for this
thesis work is separated into four parts. In the first part of the literature survey report,
fundamentals of the tuned vibration absorber theory are presented. Secondly, sources
that give information about tuned vibration absorber design guidelines for the
resonant vibration problems are presented. In the third part, various tuned vibration
absorber design studies conducted for reducing the transverse vibrations of slender
structures are examined. Various types of tuned vibration absorber design
alternatives are presented with details in the final section of this chapter.
2.1. BASIC THEORY OF TUNED VIBRATION ABSORBERS
Machines and mechanical components are usually subjected to a steady alternating
force which acts at constant frequency. This forcing (excitation) may result in
excessive vibrations if the frequency of excitation is equal or close to a resonance
frequency of structure. These vibrations may cause to the machines’ or structures’
damage or sudden failure. In order to eliminate this problem, the stiffness or mass
properties of the systems’ can be altered. However, this is impractical for most cases.
Therefore, the usage of tuned (dynamic) vibration absorbers is proposed to prevent
the severe vibrations of the systems. The dynamic vibration absorber application is
invented by Frahm in 1909 [1].
Tuned vibration absorbers basically consist of stiffness (K) and mass (M) elements.
Depending on the requirement, damping element is introduced to the vibration

4
absorber. Especially, if the vibration absorption is required in a bandwidth, the
damping element should be used within the vibration absorber and the damping
amount is adjusted according to the bandwidth which vibration reduction is desired.
Fundamentals of the tuned vibration absorber theory are examined in two parts of
this section of literature survey. In the first part, undamped vibration absorber theory
is explained. The damped tuned vibration absorber theory is presented in the second
part.
2.1.1. The Undamped Tuned Vibration Absorbers
The simplest form of tuned vibration absorber is shown in Figure 2-1 and it consists
of a stiffness element which has a spring constant and a mass. Natural frequency of
the absorber is selected as equal to the excitation frequency ω. It will be proven that
the vibration of main system is reduced since the absorber functions in a way that the
spring force acts at opposite direction of excitation. In order to prove this statement,
the equations of motion are written as follows [1]:
𝑀�̈�1 + (𝐾 + 𝑘)𝑥1 − 𝑘𝑥2 = 𝑃0 sin(𝜔𝑡)
𝑚𝑥2̈ + 𝑘(𝑥2 − 𝑥1) = 0 (Eqn. 2.1)
where
M: mass of the main system
K: stiffness of the main system
m: mass of the tuned vibration absorber
k: stiffness of the tuned vibration absorber
x1: Response of the main system
x2: Response of the tuned vibration absorber
P0: Excitation amplitude
ω: Excitation frequency
t: Time
The forced vibration of the system is in the following form:
𝑥1 = 𝑎1 sin 𝜔𝑡
𝑥2 = 𝑎2 sin 𝜔𝑡 (Eqn. 2.2)

5
Where a1 is the amplitude of the response of main system and a2 is the amplitude of
the response of tuned vibration absorber.
Figure 2-1: Addition of small k-m vibration absorber to the main K-M system
[1]
Combining (Eqn. 2.1) and (Eqn. 2.2) and eliminating sinωt terms results in following
equations [1]:
𝑎1(−𝑀𝜔2 + 𝐾 + 𝑘) − 𝑘𝑎2 = 𝑃0
−𝑘𝑎1 + 𝑎2(−𝑚𝜔2 + 𝑘) = 0 (Eqn. 2.3)
By performing some simplifications, (Eqn. 2.3) is simplified as in (Eqn. 2.4) [1]
𝑎1
𝑥𝑠𝑡=
1−𝜔2
𝜔𝑎2
(1−𝜔2
𝜔𝑎2)(1+
𝑘
𝐾−
𝜔2
Ω𝑛2)−
𝑘
𝐾
𝑎2
𝑥𝑠𝑡=
1
(1−𝜔2
𝜔𝑎2)(1+
𝑘
𝐾−
𝜔2
Ω𝑛2)−
𝑘
𝐾
(Eqn. 2.4)
where
xst = P0/K : static deflection of main system
ωa2
= k/m : square of the natural frequency of the absorber
Ωn2 =
K/M : square of the natural frequency of the main system
µ = m/M : mass ratio
P0sinωt

6
From (Eqn. 2.4) it can be clearly seen that the amplitude of a1 becomes zero if the
absorber natural frequency (ωa) is equal to the excitation frequency (ω). It can also be
found that the amplitude of absorber response (a2) is equal to P0/k which implies the
fact that the absorber spring (k) applies a force equal and opposite to the excitation
forcing (P0).
If the natural frequency of the absorber is chosen as equal to the natural frequency of
the main system
i.e. (ωa= Ωn or 𝑘
𝑚=
𝐾
𝑀 or
𝑘
𝐾=
𝑚
𝑀), the (Eqn. 2.4) becomes [1]:
𝑎1
𝑥𝑠𝑡=
1−𝜔2
𝜔𝑎2
(1−𝜔2
𝜔𝑎2)(1+µ−
𝜔2
ω𝑎2)−µ
𝑎2
𝑥𝑠𝑡=
1
(1−𝜔2
𝜔𝑎2)(1+µ−
𝜔2
ω𝑎2)−µ
(Eqn. 2.5a, b)
It can be seen that the both of (Eqn 2.5a) and (Eqn. 2.5b) have the same denominator.
This denominator is in quadratic form and of course has two roots. These roots
represent the newly formed two resonance frequencies of the main system and can be
calculated the ω from the following equation [1]:
(𝜔
𝜔𝑎)
2
= (1 +𝜇
2) ∓ √𝜇 +
𝜇2
4 (Eqn. 2.6)
The relation between the mass ratio and the two resonance frequencies of the system
is represented in Figure 2-2. According to this graph, it can be seen that the
resonance frequencies shifts from the original natural frequency as the mass ratio
increases. It means that as the absorber mass increases the separation between the
two resonances also increases.

7
Figure 2-2: Change of the two resonance frequencies with respect to the mass
ratio
In Figure 2-3, the change in absolute vibration amplitude of main system is shown
for with and without absorber cases. The newly formed two resonances as a result of
absorber addition to the system can be clearly seen from the figure. These two peaks
should be controlled if the vibration absorption is sought for a wide frequency band
instead of a single target frequency.
Figure 2-3: Vibration amplitudes of the main system with respect to various
disturbing frequencies

8
2.1.2. The Damped Tuned Vibration Absorbers
If a dashpot is adapted to the system in Figure 2-1 by placing between the main mass
M and absorber mass m, the equations of motion become [1]:
𝑀�̈�1 + 𝐾𝑥1 + 𝑘(𝑥1 − 𝑥2) + 𝑐(�̇�1 − 𝑥2)̇ = 𝑃0 sin 𝜔𝑡
𝑚𝑥2̈ + 𝑘(𝑥2 − 𝑥1) + 𝑐(�̇�2 − �̇�1) = 0 (Eqn. 2.7)
where c is the damping coefficient of the tuned vibration absorber. The responses
would be in harmonic form with a phase difference and can be written as in Eqn. 2.8.
The equations of motion can be rewritten as in Eqn. 2.9 by assuming these responses:
𝑥1 = 𝑎1𝑒𝑗𝜔𝑡
𝑥2 = 𝑎2𝑒𝑗𝜔𝑡 (Eqn. 2.8)
−𝑀𝜔2�̈�1 + 𝐾𝑥1 + 𝑘(𝑎1 − 𝑎2) + 𝑗𝜔𝑐(�̇�1 − 𝑎2)̇ = 𝑃0
−𝑚𝜔2𝑎2̈ + 𝑘(𝑎2 − 𝑎1) + 𝑗𝜔𝑐(�̇�2 − �̇�1) = 0 (Eqn. 2.9)
The response of the main mass M, which we are interested in, can be derived from
Eqn. 2.9 as follows [1]:
𝑎1 = 𝑃0√(𝑘−𝑚𝜔2)2+𝜔2𝑐2
[(−𝑀𝜔2+𝐾)(−𝑚𝜔2+𝑘)−𝑚𝜔2𝑘]2+𝜔2𝑐2(−𝑀𝜔2+𝐾−𝑚𝜔2)2 (Eqn. 2.10)
It is logical to write the Eqn. 2.10 in dimensionless form in order to express the
response more easily. By making some simplifications, Eqn. 2.10 is written as
follows [1]:
𝑎1
𝑥𝑠𝑡= √
(2𝑐
𝑐𝑐)2+(𝑔2−𝑓2)2
(2𝑐
𝑐𝑐𝑔)2(𝑔2−1+𝜇𝑔2)2+[𝜇𝑓2𝑔2−(𝑔2−1)(𝑔2−𝑓2)]2
(Eqn. 2.11)

9
where
µ=m/M (the mass ratio)
Ωn2=K/M (natural frequency of the main system)
ωa2=k/m (natural frequency of the absorber)
g=ω/Ωn (forced frequency ratio)
f=ωa/Ωn (natural frequency ratio)
xst=P0/K (static deflection)
cc=2mΩn (critical damping)
Figure 2-4 represents the dimensionless amplitudes of the main mass response as a
function of the forced frequency ratio (g). In this plot, the mass ratio (µ) is taken as
1/20, the natural frequency ratio (f) is taken as 1. From this figure, it can be seen that
the response becomes as in Figure 2-3 when the damping ratio is zero and an SDOF
system response is obtained when the damping ratio becomes infinity. If the other
two values of damping (0.10 and 0.32) are examined, it is observed that the
maximum response increases with increasing damping. Moreover, the target
frequency which the response is desired to be minimized deviates from the resonance
frequency with damping addition. Therefore, it can be said that there should be an
optimum damping value between zero and infinity which is effective in a broad
frequency range.

10
Figure 2-4: Responses of the main mass with respect to various damping values
From Figure 2-4, it is also observed that all of the curves pass through the same two
points P and Q, regardless their damping values. Hence, the most effective response
curve should also pass through these points and make a horizontal tangent with the
higher one. Moreover, these points can be equalized by manipulating the target
natural frequency ratio (f), thus there is also an optimum value for f. Performing
some mathematical computations, this optimum value of the tuning can be found as a
function of mass ratio as follows [1]:
𝑓𝑜𝑝𝑡 =1
1+𝜇 (Eqn. 2.12)
Likewise, the optimum damping ratio is calculated in terms of the mass ratio µ as the
result of long calculations as follows [1]:
𝑐
𝑐𝑐= √
3𝜇
8(1+𝜇3) (Eqn. 2.13)
Eqn. 2.12 and Eqn. 2.13 which are given above are found by Den Hartog who is the
inventor of tuned vibration absorber theory and known as Den Hartog’s equations.
This theory is valid for an SDOF vibratory system. However, design of tuned
vibration absorbers for the vibrations of multi degree of freedom systems more

11
complicated studies and researches may be necessary. In Section 2.4, some examples
of these types of studies are presented.
2.2. TUNED VIBRATION ABSORBER DESIGN STUDIES FOR
RESONANT VIBRATION PROBLEMS
Resonant vibration problems are caused by the nature of the structure rather than the
external excitation. In this type of problems, vibration reduction is usually desired in
the natural frequencies or around the natural frequencies of the structure. In this
section of the literature survey, some examples of tuned vibration absorber design
studies that give information about the control of resonant vibration problems are
given.
In their studies, Özgüven and Çandır developed a method in order to find the
optimum parameters of two SDOF dynamic vibration absorbers to suppress the first
and second modes of a beam [2]. The main structure is taken as a cantilever beam
with structural damping and two viscously damped vibration absorbers are proposed
to minimize the vibration amplitudes of this beam which is excited by constant and
frequency-squared harmonic forcing. The assumed-modes method is used to find the
response of the beam.
At the beginning, the first absorber is tuned to the first resonance of the beam while
the second absorber is tuned to the second resonance of the beam, theoretically. Then
the parameters of the second absorber are kept as constant and parameters of the first
absorber are optimized so that the minimum response is obtained for the first
resonance. After that, the second absorber parameters are optimized to minimize the
second resonance while the first absorber parameters are kept fixed. This procedure
is repeated successively until the stable values are reached for both of the two
absorbers. The free end of the beam is determined as the location where the response
is to be minimized, thus the absorbers are to be attached. The results proved that the
first absorber parameters are affected by the existence of the second absorber
whereas the second absorber parameters are not affected from the existence of first
absorber so much. It is also observed that the effect of an absorber to the mode which
it is not tuned to becomes significant with decreasing mass ratio of that absorber.

12
In their studies, Zuo and Nayhef employed the descent-subgradient algorithm in
order to obtain the maximum minimal damping in a certain frequency range for a
structure with a MDOF tuned mass damper or multiple SDOF tuned mass dampers
[3]. Tuned mass damper parameters are calculated by using the minimax
optimization approach based on the descent-subgradient method for a 2DOF system.
Moreover, H2 and H∞ optimization methods, which require disturbance inputs on the
system and outputs from the system, are employed to solve the same problem and the
performances of these three methods are compared.
The minimax optimization method is also used by aiming to damp the first three
flexural modes of a free-free beam [3]. Parameters of 3 DOF viscously damped
TMD, 3 DOF hysteretically damped TMD and 3 SDOF viscously damped TMDs
that are applied on 39-DOF discretized free-free beam are optimized by minimax
method. Moreover, the three tuned mass damper parameters are calculated separately
for the first three modes by using the classical Den Hartog method. The
performances of these four methods are compared by considering the modal damping
ratios achieved. It is observed that the 3DOF TMD with viscous damping provided
the best damping performance.
An experiment is performed with a 2-DOF TMD designed by minimax optimization
in order to damp the first two flexural modes of a free-free steel beam which the
movement in the longitudinal direction is constrained. Optimized 2-DOF TMD is
realized by flexures whose stiffness and damping values are adjustable. Tension of
the blades is altered by adjusting screw to obtain the desired stiffness. Damping is
provided by the fluid between cup and plunger and the damping coefficient is
adjusted by moving the cup in vertical direction. The experiment is done by an
impact hammer and force to acceleration transfer function is derived from the
response at the tip of the beam. As a result of the experiment, the predicted damping
for the first modes of the beam is approximated sufficiently.
In their study, Snowdon et al. [4] proposed the use of cruciform dynamic vibration
absorber for vibrating structures and systems. The cruciform dynamic absorber
consists of two beams having masses at their free ends and connected from their
centers at right angles. It would be attached to the vibrating system from the junction

13
point of two beams. One of the branches is tuned to the first natural frequency of the
vibratory structure while the second branch can be tuned to the second or third
natural frequency or to the operating frequency of a machine exciting the vibratory
structure. As a result, the cruciform vibration absorber can be used for the cases
where the combined action of two absorbers is needed. Viscoelastic layer damping
treatment can be applied to the beams of the absorber, thus the usage of viscous fluid
damper is not necessary. This makes the absorber compatible for any orientation on
the vibratory structure.
The cruciform dynamic absorber is theoretically applied to a simple mounting
system, a centrally driven clamped-clamped beam and a clamped circular plate
driven from its midpoint. For the simple mounting system, firstly both branches of
the absorber are tuned to first resonance of the system and damped identically by
considering three absorber mass ratios. Then one of the branches is remained as
undamped and tuned to fourth, tenth and twenty-fifth multiples of the first resonance
for three different mass ratios. Transmissibility graphs of these two cases shown that
the resonance of the system is suppressed sufficiently, however new peaks arose in a
narrow frequency band for the second case. For the clamped-clamped beam excited
from its center, the absorber is proposed to be attached to the center of the clamped-
clamped beam. One of the branches of the absorber is tuned to the first resonance
while the other branch is tuned to second and tuned resonance respectively. It is seen
that the transmissibility values at tuned frequencies is decreased efficiently.
Moreover, the second branch is tuned to twice of the second resonance as the last
case of clamped-clamped beam analysis. As the result, the first beam resonance
again suppressed sufficiently and the newly formed peak due to the second tuning
frequency is not significant. For the clamped circular plate driven by a sinusoidal
excitation, the absorber is planned to attach to the excitation point since the
vibrations are expected to be the highest here. The two branches of the absorber are
damped and tuned to first and second, first and third, second and third resonances of
the circular plate respectively. Finally, one of the branches is damped and tuned to
the first resonance of the circular plate while the other branch is remained as
undamped and tuned to 1.5 times the second resonance.

14
Vakakis and Paipetis [5] examined the effect of a viscously damped dynamic
vibration absorber (VDDA) on a multi-degree of freedom vibratory system. They
used the method of Aq polynomials, which is developed by them, in order to
investigate the dynamic behavior of a multi-degree of freedom linear system which
the upper half is connected to a viscously damped dynamic vibration absorber.
The method of fixed points, which assumes that certain frequencies exist for which
the response of the system is independent of damping if the vibratory system has
only one damping element between two of its positions, is employed for the
optimization of VDDA and used within the expression derived for the force
transmitted to the ground when a harmonic excitation is applied on the upper mass of
the MDOF system. By means of this optimization procedure, the minimization of
transmissibility is aimed. For that purpose, the parameters of absorber’s natural
frequency ratio to the main system (α=ωa/ω0) and absorber damping ratio
(ζ=ca/2(Kama)1/2
) is used.
Firstly α parameter is optimized in the range of 0.1-1.5 for mass ratio of µ=0.5 and in
the paths followed by three fixed points. The optimum value of α is obtained as equal
to 0.463 for which the transmissibility ratios of three fixed points reach the possible
minimum values combination. Moreover it is derived that the optimum value of α
can be approximated by the relation of αopt=(6+5µ+ µ2)/(10+15 µ+7 µ
2+ µ
3) for a
two degrees of freedom system with one VDDA. Secondly, the damping ratio of
absorber (ζ) is determined for the mass ratio of µ=0.5 and absorber frequency ratio of
α=0.463. Optimization procedure of damping ratio results in two damping values.
First optimum damping ratio is ζ=0.326 and it targets the maximum values of first
two fixed points. The second appropriate damping ratio is found as ζ=0.5246 and this
ratio makes the maximums of the responses at low and high frequencies equal.
For the application of this analysis, an anti-vibration mounting is designed in order to
isolate the ground from the vibrations of the rotating machinery that are caused by its
potential unbalance. Due to symmetry reasons the dynamic absorber is split to two
parts with parameters of ma/2, Ka/2 and ca/2. Damping is provided by a silicone-filled
cylinder with a piston moving inside. The mass of absorber (ma) is connected to this
piston. The upper mass of the main system (m) is the mass of the machine and its

15
base, the lower mass is also equal to m. Lower and upper masses are connected with
springs with constant K and also the whole system is supported on the springs with
constant K via steel rods.
Pombo and Laura [6] investigated the usage of two dynamic vibration absorbers for a
laboratory model where the forcing excitation is in the form of F(t) =
∑ Fi cos ωit2i=1 . Here, the forcing frequencies ω1 and ω2 are almost equal to the
lowest natural frequencies of the system.
A gear mechanism driven by an electric motor produces sinusoidal forces with
frequencies of f1=5.45 Hz and f2=8.85 Hz. Two steel disks enable the variation of
two lowest natural frequencies of the system. This system yield in two modes; first is
the translational mode along y-axis with natural frequency of 5.45 Hz and the second
is the rotational mode around the vertical axis with a natural frequency of 8.85 Hz.
As a result of experiments, four new natural frequencies arise because of the DVAs.
In addition, two peak amplitudes of 1.2 mm and 0.53 mm decrease to 0.31 mm and
0.02 mm due to the presence of two dynamic vibration absorbers.
2.3. TVA DESIGN STUDIES FOR SLENDER STRUCTURES
Since their natural frequencies are quite low, slender structures exhibit vibratory
behavior under any type of excitation. Their oscillatory behavior is usually caused by
the transverse modes. In this part of the literature survey, TVA design studies
performed to overcome the transverse vibrations of the slender structures are
examined.
First study of this section is about the TVA application on a gun barrel which suffers
from the oscillatory behavior due to firing event. Kathe et al. [7] investigated the
effect of mounting a vibration absorber to a gun barrel’s muzzle brake. In this study,
a model is created via MATLAB©
software for the plain gun barrel, then it is verified
with the aid of modal impact testing that is performed on the real gun barrel.
MATLAB model and modal impact test results are summarized in Table 2-1:
16
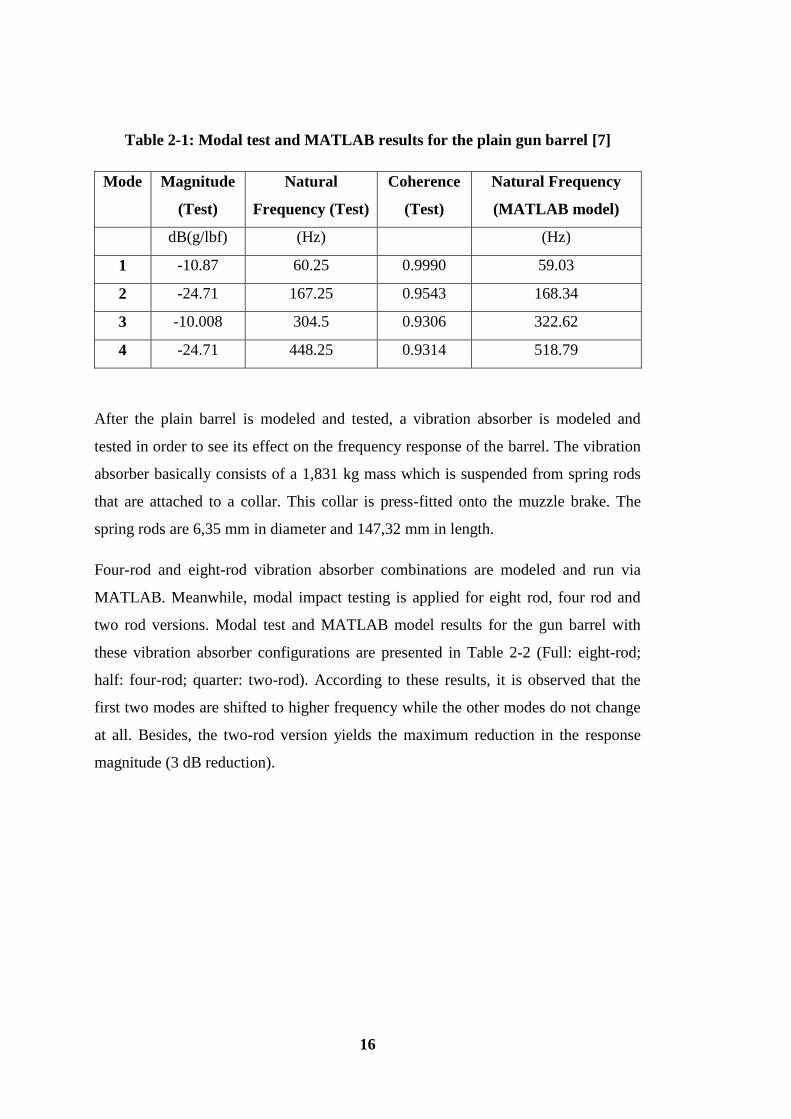
Table 2-1: Modal test and MATLAB results for the plain gun barrel [7]
Mode Magnitude
(Test)
Natural
Frequency (Test)
Coherence
(Test)
Natural Frequency
(MATLAB model)
dB(g/lbf) (Hz) (Hz)
1 -10.87 60.25 0.9990 59.03
2 -24.71 167.25 0.9543 168.34
3 -10.008 304.5 0.9306 322.62
4 -24.71 448.25 0.9314 518.79
After the plain barrel is modeled and tested, a vibration absorber is modeled and
tested in order to see its effect on the frequency response of the barrel. The vibration
absorber basically consists of a 1,831 kg mass which is suspended from spring rods
that are attached to a collar. This collar is press-fitted onto the muzzle brake. The
spring rods are 6,35 mm in diameter and 147,32 mm in length.
Four-rod and eight-rod vibration absorber combinations are modeled and run via
MATLAB. Meanwhile, modal impact testing is applied for eight rod, four rod and
two rod versions. Modal test and MATLAB model results for the gun barrel with
these vibration absorber configurations are presented in Table 2-2 (Full: eight-rod;
half: four-rod; quarter: two-rod). According to these results, it is observed that the
first two modes are shifted to higher frequency while the other modes do not change
at all. Besides, the two-rod version yields the maximum reduction in the response
magnitude (3 dB reduction).

17
Table 2-2: Modal impact testing results with vibration absorber [7]
Full Vibration Absorber
Mode Magnitude
(Test)
Natural
Frequency (Test)
Coherence
(Test)
Natural
Frequency
(MATLAB model)
dB(g/lbf) (Hz) (Hz)
1 -28.642 38.5 0.9937 35.19
2 -10.614 71.25 0.9991 72.64
3 -29.886 168.5 0.9887 169.95
4 -9.323 307.0 0.9139 319.01
5 -9.513 456.25 0.8915 499.48
Half Vibration Absorber
Mode Magnitude
(Test)
Natural
Frequency (Test)
Coherence
(Test)
Natural
Frequency
(MATLAB model)
dB(g/lbf) (Hz) (Hz)
1 -27.683 31.25 0.9998 29.28
2 -10.793 64.5 1.0000 65.04
3 -27.711 169.75 0.9993 169.27
4 -6.541 304.0 0.8724 322.43
5 -6.054 460.75 0.8821 516.28
Quarter Vibration Absorber
Mode Magnitude
(Test)
Natural
Frequency (Test)
Coherence
(Test)
dB(g/lbf) (Hz)
1 -29.94 25.5 0.9996
2 -13.033 62.5 0.9995
3 -24.251 169.5 0.9777
4 -8.395 304.75 0.8640
5 -6.412 458.5 0.8528

18
The US Patent 6167794 comprises two types of vibration absorber for gun barrels
[8]. First vibration absorber type simply consists of a mass-spring device and it is
attached to a location on the gun barrel where the vibration activity is the most
important. Here, the TVA is attached to the tip of the gun barrel since the vibration
amplitudes are the highest. Ground ended compression springs are used for this
vibration absorber which are at pre-compressed state. In the second type of TVA
discussed in US Patent 6167794 thermal shrouds of the gun barrel are used as the
inertia elements. Stiffness elements of the vibration absorber are the springs that
connect the free end of the thermal shroud to the gun barrel. The vibration absorber
includes a dynamically tunable spring collar which is fixed to the end of the shroud
and it enables the relative motion between the muzzle ends of the thermal shroud and
gun barrel. The springs are pre-compressed to provide the concentricity of thermal
shroud and gun barrel centerlines and maintain the contact between barrel muzzle
and spring collar.
In Büyükcivelek’s thesis study, gun barrel vibrations which are caused by the ground
excitation are taken into consideration [9]. In order to reduce the vibration levels of
the longer gun barrel to the short gun barrel, tuned vibration absorber design is
proposed. In the design process, verified finite element model of the gun barrel and
PSD data of the ground excitation are used as inputs and tip displacement of the gun
barrel is chosen as output. From the PSD data, it is found that the first resonance of
barrel dominates the response of gun barrel, thus the tuning frequency of the TVA is
chosen around the first mode of the barrel. Firstly, harmonic analyses are run on the
FE model of the gun barrel in order to examine the TVA mass effect. Then, spectrum
analyses are run by applying the input PSD data in order to optimize the mass and
damping parameters of TVA. After the identification of TVA parameters, conceptual
TVA design solutions are researched that would satisfy these parameters. A spring-
mass-damper type of TVA is selected as the best alternative solution. In this solution,
two helical springs are used as the stiffness elements and a dashpot is employed as
the damping element of TVA.
19
Bonsel, Fey and Nijmeijer [10] applied a linear dynamic vibration absorber (i.e.
tuned vibration absorber) to a piecewise linear beam system to suppress its first
resonance. This system consists of a steel beam which is supported by leaf springs
and a second beam at the middle of the beam. A pin is attached to this second beam
and it contacts with the main beam when it has a negative deflection. As a result it
behaves as one-sided spring. There exists rotating machinery at the middle of the
beam which produces an excitation at 60 Hz. The tuned vibration absorber which
consists of two cantilever beams and two masses of 0.5 kg at its ends is applied on
the beam system. By moving the masses along the beam the stiffness of TVA can be
tuned precisely. The eigenfrequency of TVA is tuned to 19 Hz which is the first
harmonic resonance of the beam system. Firstly, undamped TVA is applied to the
piecewise beam system and anti-resonance is observed at this resonance frequency
whereas new resonances arise around this anti-resonance. After that, certain amount
of damping is added to the TVA system and it is seen that the newly formed
resonances are also suppressed.
Gu, Chang and Xiang proposed the use of tuned mass dampers in their studies, in
order to increase the flutter wind speed of a long-span bridge [11]. They derived the
equations of motion of the bridge with TMDs and employed the Routh-Hurwitz
stability criterion to examine the aerodynamic instability of the bridge. For the
experimental study, a sectional model of Tiger Gate Bridge, which is a steel box
deck suspension bridge in China, is tested in a wind tunnel and the numerical results
are verified by this way. The effects of structural damping of the bridge, the
frequency and mass inertial moment inertia ratios of the tuned mass dampers to the
bridge are examined to see how they are effective on the flutter control of bridge.
Two identical tuned mass dampers are located at the two sides of the cross section at
the center of the bridge. In this way, the TMDs can yield counter moment to suppress
torsional vibrations. The TMD frequencies are tuned as very close to the flutter
frequency so that the critical flutter wind speed increase. TMDs consist of two
springs, two mass blocks and a pendulum-container system as the damping device.
The upper plates of TMDs are rigidly connected to the bridge.

20
Ten sets of TMD parameters (ratio of mass moment of inertia, frequency ratio and
damping ratio) are investigated. Moreover, three different structural damping ratios
(%0.7, %2.13 and %4.05) for the bridge are examined. It is seen that the TMDs
having the mass moment of inertia ratio between %5.6 and %10 can increase the
flutter speed significantly. It is also concluded that the tuned mass dampers are more
effective on flutter speed when the structural damping of the bridge is low. Finally, it
is found that the frequency ratio of TMDs to the bridge and the damping ratio of
TMDs affect the flutter speed control, however, the frequency ratio is more effective
than the damping ratio.
2.4. VARIOUS TYPES OF TVA APPLICATIONS
There are several types of tuned vibration absorber applications which have different
constructions, use various damping types, stiffness elements etc. In this section of the
literature survey of various types of TVA applications found from the field research
are presented.
In their studies, Hill, Snyder and Cazzolato designed a dogbone vibration absorber in
order to suppress several modes of vibration rather than single target frequency [12].
In other words, the vibration absorber is developed to facilitate the vibration
absorption at multiple resonance frequencies. This type of vibration absorber is also
called as “dual mass absorber”. It consists of two rods supporting two masses at the
ends. One of these rods is smooth and the other rod is threaded. The threaded rod is
rotated with a motor to move the masses, thus the TVA resonances are altered by this
movement.
The first six mode shapes of TVA are obtained via finite element analysis and it is
observed that the mode pairs 1-2, 3-4 and 5-6 have similar motion characteristics.
However, the masses move in phase in the modes 1,3,5 and out of phase in the
modes 2,4,6. The close proximity of these mode pairs are also seen from the modal
frequencies. This relation between the pairing modes is important for expanding the
bandwidth of the absorber.
In his study, Dr. Lamb [13] sought to design a tuned vibration absorber in order to
suppress the vibrations of the control room of a CaCl2 plant which the working staff

21
suffers. For this purpose, firstly the power spectrum of the vibration data is obtained
considering the sources of peak amplitudes. According to this power spectrum, the
main reason of discomfort is the motion occurring at around 3.5 Hz (sway mode) and
it should be reduced by %70. According to the frequency response for the motion of
control room, it is seen that the sway motion is magnified by factor of 85 relative to
foundation motion.
A cantilever type tuned vibration absorber is found as appropriate for this structure.
Three locations are selected on the columns of frame for the TVA application. In
order to achieve a desired mitigation in a narrow band of 1 Hz, the optimum tuned
vibration absorber mass found as 1500 lbm. This value is computed by considering
the optimum damping ratio. Various combinations of TMD flexure bar lengths and
constrained–layer viscoelastic damping materials are investigated in order to find the
best combination. SBR Rubber layers and a flexure bar of 950 mm are found as the
best combination which provides %12 damping ratio.
Vibration levels in the control room are measured and compared with the vibration
levels before TMD application. It is seen that the vibration amplitudes are reduced
below 0,005 g limit which results in a significant improvement of staff’s comfort.
Mirsanei et al. [14] developed an adaptive tuned dynamic vibration absorber (DVA)
based on a slider crank mechanism. This DVA design is applied to reduce the
vibration amplitudes of a vibratory resonant beam. The base structure is selected as a
simply supported beam including a motor with rotary disc. The beam is fixed with a
fixed joint from one end and a roller joint from another end. The motor is connected
to a speed control unit in order to change the speed of rotation so that the vibration
force can be varied. The masses attached to the links of mechanism are moved by
means of a servo motor until the system is tuned.
As a result of the experiments, it is seen that the adaptive tuned DVA could decrease
the rate of vibration in every forces acting by changing the speed of motor and rotary
disc. However with DVA which is not adaptive and tuned to one excitation
frequency, the primary system becomes two DOF. Therefore, if the machine operates

22
at other frequencies or if the forcing on the machine has several frequencies the
vibration amplitudes may become large.
Maly and Napolitano [15] proposed the design of a magnetic tuned-mass damper to
suppress the airfoil vibrations (i.e. buffet) of an aircraft which are caused by vortex
flow during the high angle-of-attack maneuvers. Buffeting of twin vertical tails of the
aircraft excites the bending and torsional modes. Therefore the TMD’s are decided to
place at the top of the vertical tails. Analysis shown that 10-pound TMD is required;
however, because of the space limitations due to the TMD motion, the TMD is
divided into ten parts each weighing one pound. For damping mechanism, rare-earth
magnet configuration is selected since the viscoelastic materials would not stand to
the dynamic environment of the aircraft and highly affected from the temperature
variations.
Fundamental natural frequencies of the structure are predicted via finite element
analysis as 15 Hz for the bending mode and 43 Hz for the torsion mode. It is seen
that the buffet pressure PSD peaks in the frequency range of 10-50 Hz. Therefore the
15-Hz bending mode is targeted for the design of TMD.
A prototype TMD is designed which consist of mechanical springs, a mass and
magnets moving relative to a conductor, thus provide damping. Firstly the
transmissibility of TMD is measured in order to measure the natural frequency and
damping of the TMD. Then a cantilever beam is employed as a base structure which
the bending mode frequency approxiately equal to the bending frequency of the
aircraft vertical tail and frequency responses are found for with and without TMD
cases. A 48”×4”×1” aluminum beam which has a bending frequency of 13,5 Hz at
cantilevered condition is used and the TMD is bolted to the beam. Random excitaton
is applied to the beam from the attachment point of TMD. It is seen that the original
13,5 Hz mode is separated into two modes at 10,9 Hz and 15,7 Hz. Moreover the
amplitude of the response is reduced by 20 times.
Sayyad and Gadhave [16] investigated the effect of a magnetic vibration absorber on
a cantilever beam which is subjected to harmonic excitation whose frequencies are
varying. The vibration suppression is tried to achieve by changing the position of

23
magnetic vibration absorber along the beam. Magnetic vibration absorber is made
from three magnets with two poles facing each other set in front of each other. The
intermediate magnet acts as mass element and the repelling forces acting on it acts as
the restoring force.
Stiffness and natural frequency of the absorber change according to the distance
between magnets. The main system which the absorber will be applied is a cantilever
beam whose the first natural frequency is 42,6 Hz. Therefore, magnetic absorber is
tuned to change the natural frequency from 0,8 fn (34,08 Hz) to 1,2 fn (51,12 Hz), so
the distance between magnets is chosen as 70 mm.
The experimental studies are performed with a cantilever beam which is clamped to a
rigid support and the absorber is clamped to the free side of the beam. The cantilever
beam is excited by means of an exciter and the excitation frequency is gradually
increased. For each frequency the vibration amplitude of the main system is
measured. Then the position of the absorber along the beam is changed and the
excitation frequency is increased again. This procedure is repeated for a number of
positions of absorber along the beam. As a result of these experiments, it is observed
that the amplitude of vibrations is reduced from 2390 microns to 260 microns with
the magnetic vibration absorber addition.
Harris F.A. investigated the use of one 2-DOF vibration absorber and two SDOF
vibration absorbers for the control of structural vibration of a mock payload cylinder
[17]. For this study, a scaled cylindrical model of a payload fairing is used. Target
frequencies are chosen as 62 Hz and 139 Hz by considering the frequency response
data obtained experimentally. A large separation between two target frequencies is
sought due to the high damping of the foam used in DVAs as stiffness and damping
elements.
Firstly two 1DOF DVA design parameters are specified in order to achieve the
closest resonance frequencies. Then stacked 2DOF DVA parameters are developed
so as to achieve the equal impedance with two SDOF design by considering the
limitations specified above. DVAs consist of foam blocks which are used as the
spring-damper elements and steel plates which are used as the mass elements.

24
Besides, small nuts are added to the top plate for tuning the DVAs to resonant
frequencies to within 2-3 Hz of the targeted frequencies.
After designing the DVAs as explained above, they are attached to interior of the
cylinder radially. Totally 4 kg of DVAs are added to the cylinder which is 1/20 of the
total mass of cylinder. A shaker is used to excite the system and totally 30
accelerometer are used to measure the structural vibrations. As a result of the
experiments, the average of the squared transfer functions of all 30 accelerometer
measurements in velocity per input force to the cylinder are obtained. According to
these results, it is observed that the peaks around the target frequencies 62 Hz and
139 Hz are reduced by 19 dB and 9 dB respectively.

25
CHAPTER 3
3. DESCRIPTION OF THE VIBRATION CONTROL PROBLEM
In this chapter, the representative physical structure under consideration which
involves a supported hollow cylindrical component is described and the dynamics of
this structure is explored.
In Section 3.1, the physical design and the finite element model constructed for this
structure are explained with details. Vibration problem of this structure and its main
causes are presented in Section 3.2. In the last section, experimental verification of
the finite element model is presented.
3.1. DESCRIPTION OF THE PHYSICAL STRUCTURE
A sample physical structure which includes a supported hollow cylindrical
component is designed as shown in Figure 3-1. In this model, supported hollow
cylindrical structure is called as the ‘tube’ part. Tube part stands on two legs and an
interface part is attached to tip of the tube in order to excite the structure from there.
Legs are connected to the foot plate parts which are fixed to the ground.

26
Figure 3-1: CAD model of the sample physical structure
Foot plates are made of thin metal sheets in order to make the structure flexible so
that it can be easily excited. Firstly, the back and front foot plates are estimated to
have the same dimensions. However, it is seen that the natural frequencies of the two
transverse modes are very close to each other. Therefore, the length of back foot
plate is increased so that a certain amount of difference between the two transverse
modes can be obtained and they can be suppressed together. Final optimized
dimensions of the back and foot plates are presented in Figure 3-2. As seen in this
figure, lengths of the back and front foot plates are different while the other
dimensions are the same. Thickness of the foot plates is adjusted to 1 mm and the
material of foot plates are selected as St-37 steel.

27
Figure 3-2: Optimized dimensions of the back and front foot plates
A prototype of the physical structure is fabricated as demonstrated in Figure 3-3.
Foot plates are shown in red boxes in this figure and they are fixed to the ground
with four M8x20 bolts. In the assembly, leg parts are welded to the foot plate and
clamp parts. Impact interface part is glued to the tube. Clamps are tightened on the
tube with two screws located on two sides of the clamps. Thin rubber layers are
placed between the clamps and tube in order to spread the tightening force. Details of
the connection between clamps and the tube are shown in Figure 3-4.
Figure 3-3: General view of the fabricated structure

28
Figure 3-4: Clamp-tube connection detail
Modal analyses are performed using the finite element model of the physical
structure prepared in ABAQUS©
software. These modal analyses are done with the
Lanczos eigensolver option of the ABAQUS. Lanczos method is the default
eigenvalue extraction method of the ABAQUS since it has the most general
capabilities [18]. The eigenvalue extraction problem for an undamped finite element
model can be stated as follows:
(−𝝎𝟐𝑴𝑴𝑵 + 𝑲𝑴𝑵)𝝋𝑵 = 𝟎 (Eqn. 3.1)
where MMN
denotes the mass matrix, KMN
denotes the stiffness matrix and φN is the
eigenvector. M and N denotes the degrees of freedom [18].
Finite element model of the physical structure consists of 47073 nodes, 38227
elements and a total of 230133 degrees of freedom. All parts are modelled using shell
elements since their thicknesses are small with respect to other dimensions. The S4
(four-node doubly curved general-purpose shell) elements in the ABAQUS element
library are used while the mesh structure is built. General mesh structure can be seen
in Figure 3-5.

29
Figure 3-5: General mesh structure of the physical structure
All mechanical connections between the different parts of the structure are modelled
with the ‘TIE CONSTRAINT’ option of the ABAQUS. With this option, the parts
are connected from all degrees of freedoms. These connections are shown in Figure
3-6. For simplicity, screws on the clamps and bolts on the foot plates are not in
involved in the finite element model. The model is fixed from the foot plates by
using the ‘ENCASTRE’ boundary condition option of ABAQUS as shown in Figure
3-7.
30
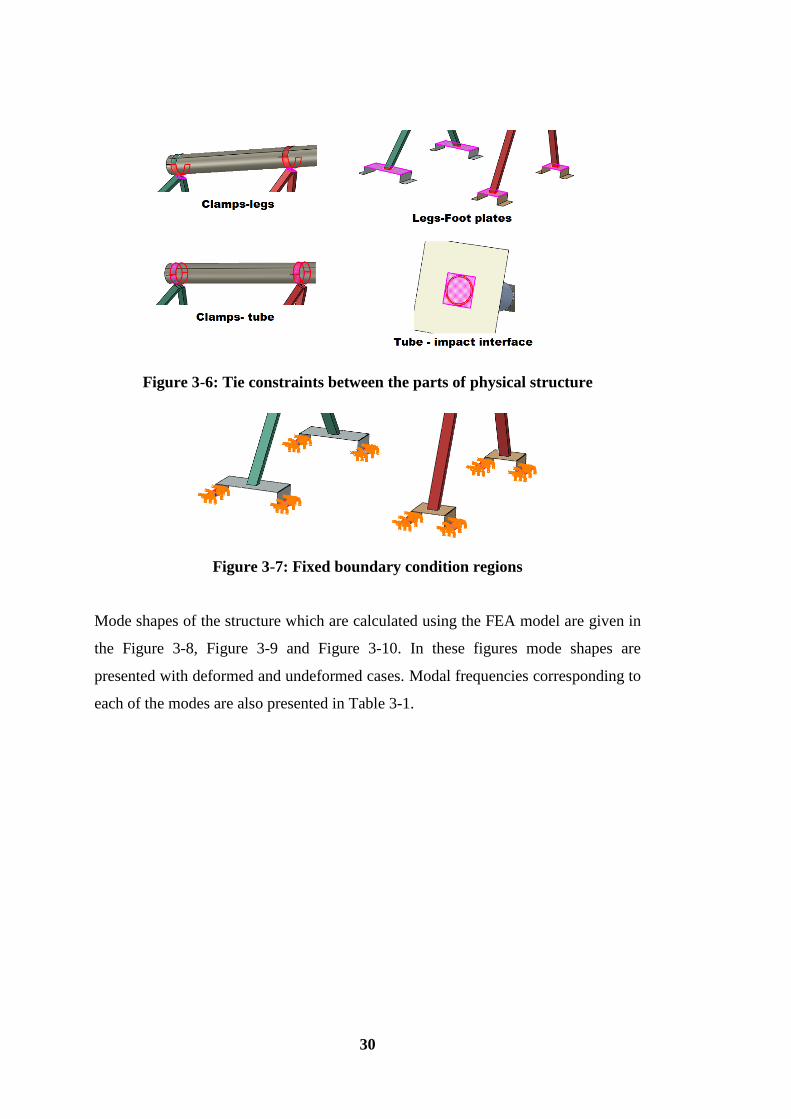
Figure 3-6: Tie constraints between the parts of physical structure
Figure 3-7: Fixed boundary condition regions
Mode shapes of the structure which are calculated using the FEA model are given in
the Figure 3-8, Figure 3-9 and Figure 3-10. In these figures mode shapes are
presented with deformed and undeformed cases. Modal frequencies corresponding to
each of the modes are also presented in Table 3-1.

31
Figure 3-8: 1st mode (tip-off) of the prototype (FEA result)
Figure 3-9: 2nd
mode (side-off) of the prototype (FEA result)

32
Figure 3-10: 3rd
mode of the prototype (FEA result)
Table 3-1: Modal analysis results obtained from FEA
Modal frequency (Hz)
Mode 1 (tip-off) 9,320
Mode 2 (side off) 10,860
Mode 3 18,026
3.2. DEFINITION OF THE VIBRATION PROBLEM
The vibration response of the physical structure which are targeted to be reduced, are
expected to be caused by an impulsive loading applied in normal direction through
the impact interface. Due to the impulsive loading, the system is excited over a wide
range of frequencies up to a certain frequency level. For that reason, vibratory
response of the cylindrical component of the structure is expected to be dominated by
the response around the natural frequencies of system; and the vibration problem
under consideration is essentially a resonant vibration problem. As a result, two
dominant transverse modes of the physical structure are targeted for vibration
suppression using a tuned vibration absorber.

33
For this structure, main contribution to vibrational deformation pattern of the two
transverse vibration modes is the flexibility of the supporting foot plates rather than
the bending of the tube. Therefore, rigid body-like motion of the tube is more
dominant on these two transverse modes rather than the structural (bending) motion.
From the modal analysis results, it is observed that these two transverse modes are
almost perpendicular to each other (See Figure 3-8 and Figure 3-9). Moreover, modal
displacements are at their maximum at the tip of the structure for both modes.
Therefore, tuned vibration absorber design is performed by aiming to minimize the
tip response of the structure for each the two transverse modes. Target vibration
reduction metric is chosen as the magnitude of harmonic displacement value at the
tip of the structure. This value will be computed from the resultant of harmonic
displacement results obtained in three degrees of freedoms.
3.3. VALIDATION OF THE FINITE ELEMENT MODEL OF THE
STRUCTURE
In order to validate the finite element model of the physical structure, experimental
frequency response measurements are carried out on the physical prototype and
modal parameters are identified experimentally to be compared with analysis results.
These tests are performed in laboratory environment. Accelerometers used during
modal tests are numbered and located on the physical structure as shown in Figure
3-11. As it can be seen from this figure, a total of 13 accelerometers are used during
modal tests.

34
Figure 3-11: Accelerometer locations on the physical structure
Modal tests are performed by means of an impact hammer using a suitable tip which
is capable of applying an excitation force up to 500 Hz (See Figure 3-12). Technical
specifications of this impact hammer are presented in Appendix B: Technical
Specifications of the Impact Hammer [20]. Hammer strikes are applied from the tip of
the physical structure as shown in Figure 3-13. Sample force-time data obtained
during the modal tests is shown in Figure 3-14.

35
Figure 3-12: Impact hammer used in the modal tests
Figure 3-13: Excitation location

36
Figure 3-14: Sample force-time data obtained during modal tests
LMS hardware is used during the tests and ‘IMPACT TESTING’ module of the
LMS Test LAB software is employed. The LMS equipment used during the test is
shown in Figure 3-15.
Figure 3-15: LMS hardware used in the modal tests

37
Triaxial ICP®
type accelerometers produced by the PCB Piezotronics company are
used. Technical specifications of these accelerometers are presented in Appendix A:
Technical Specifications of the Accelerometers [21]. An example of these accelerometers
can be seen in Figure 3-16. A sample acceleration-time data obtained from the
accelerometer located at driving point is demonstrated in Figure 3-17.
Figure 3-16: PCB accelerometers
Figure 3-17: Sample acceleration-time data obtained during modal tests
Modal tests are performed with 400 Hz sampling frequency and 0.097656 Hz
frequency resolution. As a result of the modal tests, the mode shapes shown in Figure
3-18, Figure 3-19 and Figure 3-20 are identified. Modal frequencies are presented in
red boxes of the figures.

38
Figure 3-18: 1st mode (tip-off) of the prototype (test result)
Figure 3-19: 2nd
mode (side-off) of the prototype (test result)

39
Figure 3-20: 3rd
mode of the prototype (test result)
Sample coherence function and the corresponding frequency response function
obtained from the driving point accelerometer (See Figure 3-21) are shown in Figure
3-22 and Figure 3-23, respectively. According to Figure 3-22, it can be concluded
that the spectral data is reliable since the coherence values are very close to unity.

40
Figure 3-21: Driving point input and response directions
Figure 3-22: Coherence data obtained from the driving point
13

41
Figure 3-23: FRF data obtained from the driving point
In Table 3-2, modal test results are presented for the first three modes which have
been clearly identified at the end of the tests. By examining the participation factors
given in Table 3-2, it can also be said that the first two modes are the dominant
modes for the dynamics of physical structure.
Table 3-2: Results for the first three modes of the physical structure
Mode
number
Modal
frequency
(Hz)
Damping
ratio
(%)
Coherence
(%)
Modal participation
factors (%)
1 9.26 1,77 99.23 40.64
2 10.78 1,06 99.90 38.24
3 16.24 4,05 96.16 8.89
In order to verify the finite element model of the physical structure, modal test and
analysis results are correlated via LMS Virtual.LAB 13©
software. In Figure 3-24,
Figure 3-25 and Figure 3-26, first three mode shapes obtained from test and analysis
models are compared visually. From these figures, it can be observed that the first
three mode shape results are compatible.

42
Figure 3-24: Test-analysis comparison for the 1st (tip-off) mode
Figure 3-25: Test-analysis comparison for the 2nd
(side-off) mode
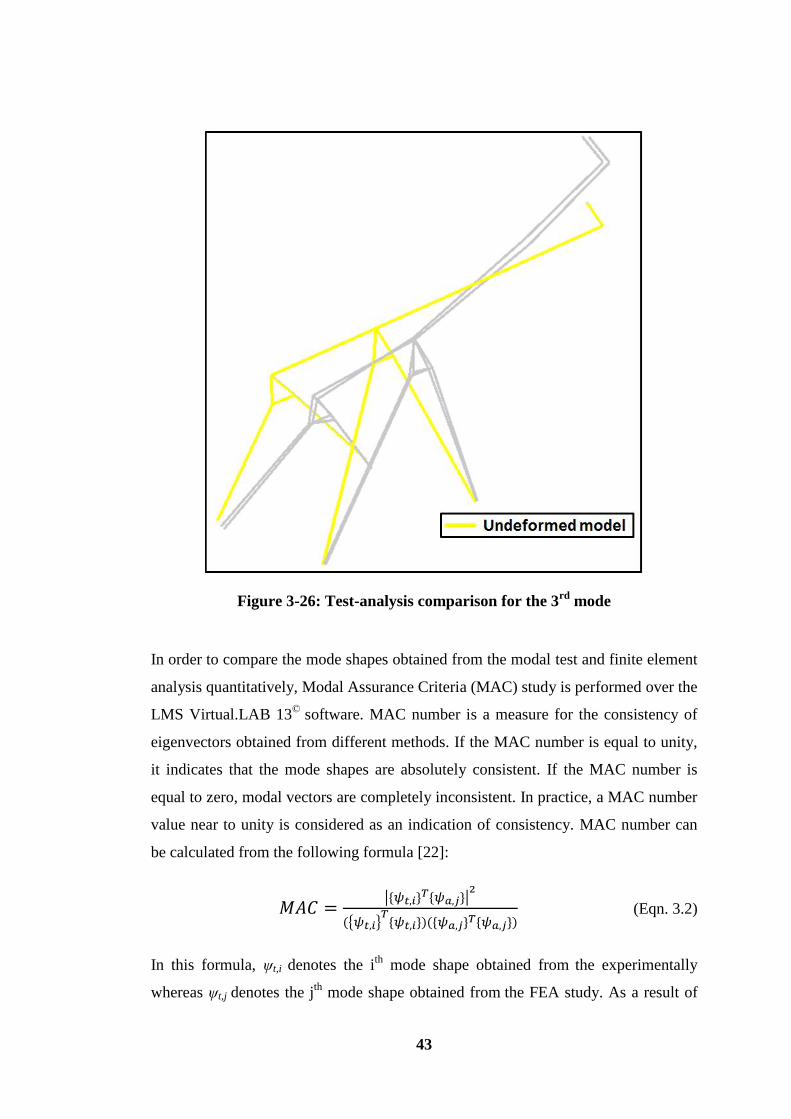
43
Figure 3-26: Test-analysis comparison for the 3rd
mode
In order to compare the mode shapes obtained from the modal test and finite element
analysis quantitatively, Modal Assurance Criteria (MAC) study is performed over the
LMS Virtual.LAB 13©
software. MAC number is a measure for the consistency of
eigenvectors obtained from different methods. If the MAC number is equal to unity,
it indicates that the mode shapes are absolutely consistent. If the MAC number is
equal to zero, modal vectors are completely inconsistent. In practice, a MAC number
value near to unity is considered as an indication of consistency. MAC number can
be calculated from the following formula [22]:
𝑀𝐴𝐶 =|{𝜓𝑡,𝑖}𝑇{𝜓𝑎,𝑗}|
2
({𝜓𝑡,𝑖}𝑇
{𝜓𝑡,𝑖})({𝜓𝑎,𝑗}𝑇{𝜓𝑎,𝑗}) (Eqn. 3.2)
In this formula, ψt,i denotes the ith
mode shape obtained from the experimentally
whereas ψt,j denotes the jth
mode shape obtained from the FEA study. As a result of
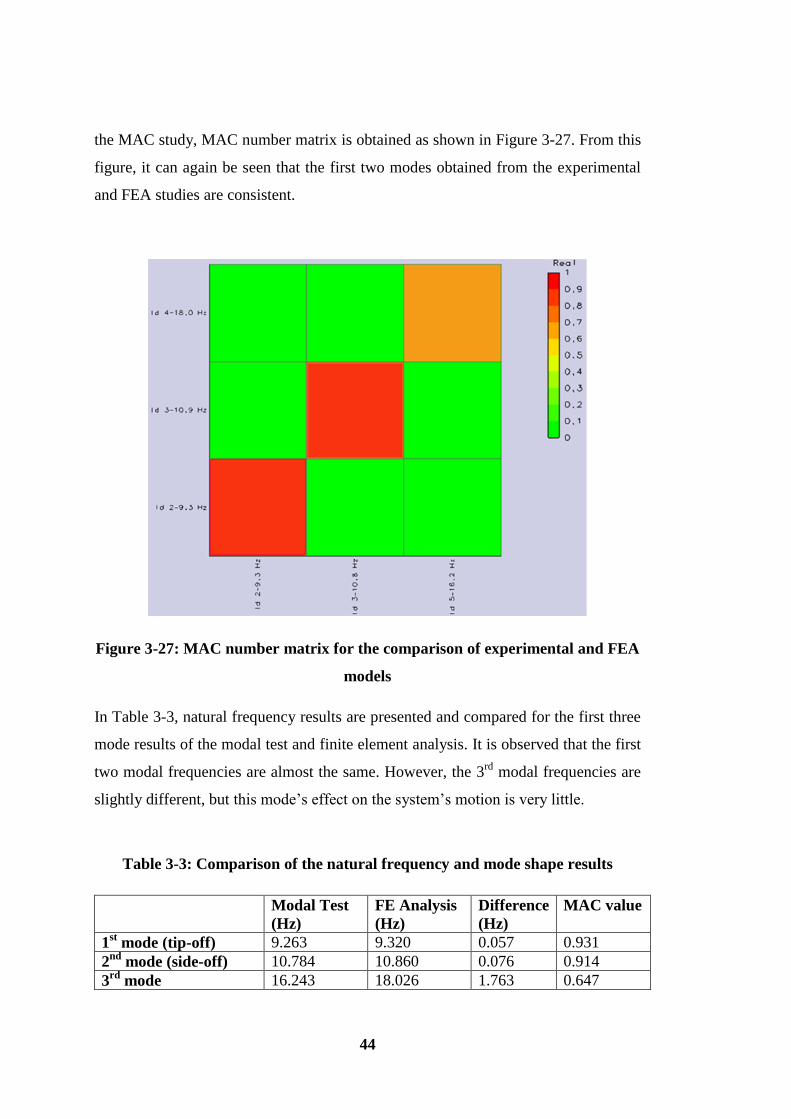
44
the MAC study, MAC number matrix is obtained as shown in Figure 3-27. From this
figure, it can again be seen that the first two modes obtained from the experimental
and FEA studies are consistent.
Figure 3-27: MAC number matrix for the comparison of experimental and FEA
models
In Table 3-3, natural frequency results are presented and compared for the first three
mode results of the modal test and finite element analysis. It is observed that the first
two modal frequencies are almost the same. However, the 3rd
modal frequencies are
slightly different, but this mode’s effect on the system’s motion is very little.
Table 3-3: Comparison of the natural frequency and mode shape results
Modal Test
(Hz)
FE Analysis
(Hz)
Difference
(Hz)
MAC value
1st mode (tip-off) 9.263 9.320 0.057 0.931
2nd
mode (side-off) 10.784 10.860 0.076 0.914
3rd
mode 16.243 18.026 1.763 0.647

45
In addition to the modal frequency and mode shape comparisons, FRF results
obtained using finite element analysis and experimental works are also compared.
For comparison purposes, accelerance FRF’s are in three axes from the
accelerometer shown in Figure 3-28 are used.
Figure 3-28: Location of the FRF measurement accelerometer
Accelerance FRF results obtained from the experiments and finite element analysis
are plotted together in Figure 3-29, Figure 3-30 and Figure 3-31. From these figures,
it can be observed that the peaks at the first two modes are comparable whereas the
third mode peaks slightly deviate from each other. This is probably caused by the
fact that the rubber layers between the clamps and tube are not precisely modelled
since their material properties are not exactly known. In addition, leakage problem
may arise due to the time data used during the modal data extraction (See Figure
3-17). This may also be a reason for the imprecise determination of the damping
values from the experimental data.

46
Figure 3-29: FRF comparison in x-axes
Figure 3-30: FRF comparison in y-axes
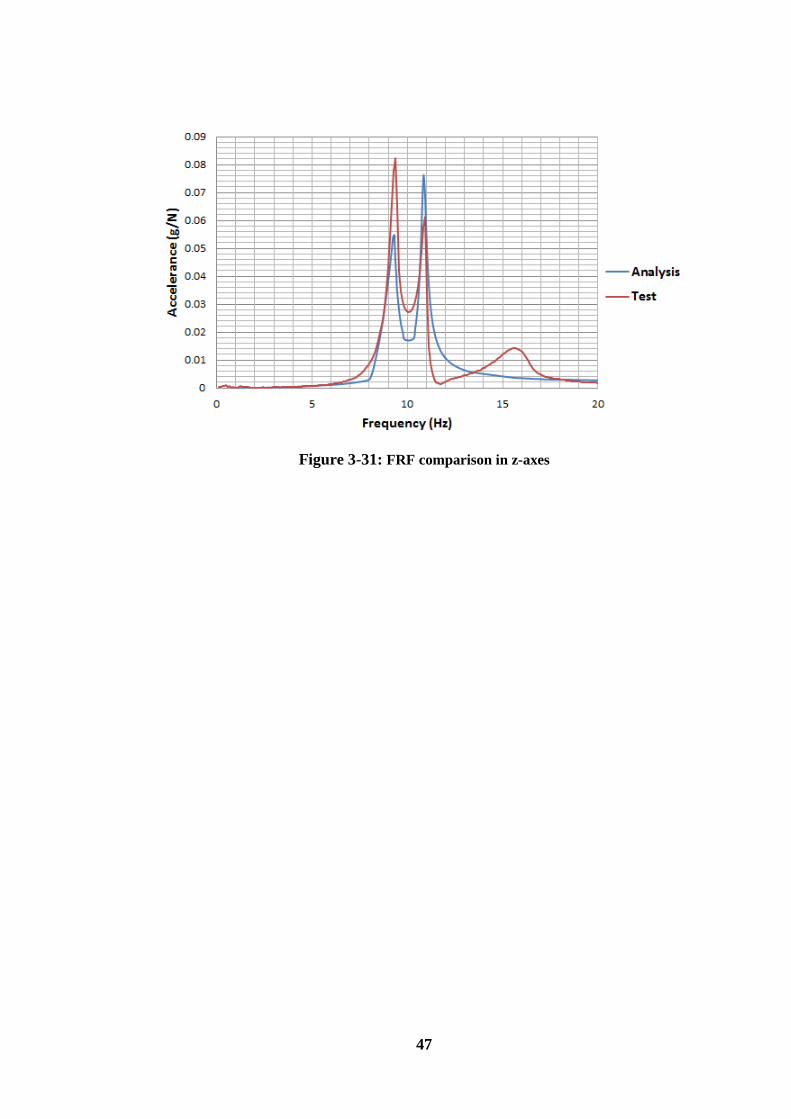
47
Figure 3-31: FRF comparison in z-axes

48

49
CHAPTER 4
4. DESIGN OF TVA
Tuned vibration absorber design process can be divided into three steps:
I. Identification of the TVA parameters
II. Realization of the TVA design
III. Experimental characterization of the TVA parameters
In the first step, mass, stiffness and damping of the TVA are identified. FEA method
is employed in order to compute these TVA parameters as in the case of physical
structure design instead of using the analytical expressions. That’s why the physical
structure is a complex system, thus the equations given for the TVA design in
Chapter 2.1 may be insufficient since they are valid for an SDOF system. Therefore
the TVA parameters are optimized with finite element analysis method on ABAQUS
software.
Next, the TVA parameters specified in Section 4.1 are sought to be materialized in
Section 4.2. Several design solutions are investigated and the most appropriate
design for the physical structure is selected in such a way that the specified TVA
parameters can be satisfied. In Section 4.3, realized and fabricated TVA system is
characterized experimentally in order to see whether it satisfies the optimized TVA
parameters.
4.1. DETERMINATION OF THE TVA PARAMETERS
Determination of the TVA parameters involves the identification of the mass,
stiffness and damping coefficient values of the TVA. If the mass of TVA is defined,
the stiffness determination can be replaced by the tuning frequency determination.
Likewise, determination of the damping coefficient can be replaced by the
determination of damping ratio if the mass and stiffness (or tuning frequency) values
of the TVA are defined. If the TVA is supposed to be designed as multi degree of

50
freedom or multiple TVA design is desired, these parameters are identified as
multiple.
For a TVA design, vibration reduction can be targeted for either the resonance
frequencies of main system or the excitation frequency. If the forcing acting on the
system is in random excitation type, PSD graph of the excitation is extracted and the
dominant frequency on this PSD graph can be chosen as target frequency. In this
study, excitation is impulsive which resembles to a half-sine pulse. Therefore, there
is no dominant excitation frequency and this type of forcing excites a spectrum up to
a certain frequency level [23]. Hence, the response of the system is shaped by the
nature of the system. As a result, the dominant resonance frequencies of the physical
structure are targeted for vibration suppression.
TVA design process is conducted via finite element analysis method as mentioned
before. For that purpose, harmonic analyses are run on the physical structure FEA
model. Harmonic analyses are performed with the subspace based steady-state
dynamics analysis option of the ABAQUS software which is a mode-based analysis
procedure. In other words, modal analysis is required prior to this analysis. In this
procedure, harmonic response is calculated based on the system’s eigenfrequencies
and modes [18]. Subspace based steady-state dynamics procedure allows the usage
of dashpot type damping while the other steady-state dynamics procedure does not.
For that reason, this type of procedure is selected so that the damping of TVA could
be modelled. Beside this, the damping of main system is modelled with Rayleigh
damping. Coefficients of Rayleigh damping are determined by depending on the
damping results obtained from the modal tests. Rayleigh damping includes the mass
proportional and stiffness proportional terms. The damping ratio is expressed in
terms of frequency as [18]:
𝜁 =𝛼
2𝜔+
𝛽𝜔
2 (Eqn. 4.1)
Since the impulsive excitation on the prototype is effective on a certain frequency
range as mentioned before, this situation is reflected via harmonic analysis by
sweeping a certain frequency range. In the harmonic analyses, forcing is applied
from the impact interface part as shown in the Figure 4-1. This forcing is applied as a

51
point load at unit magnitude and in the direction perpendicular to the impact
interface. From the Figure 4-1, it can be seen that the forcing location has an offset
between the axes of the tube. By this way of forcing, the case causing to the
maximum vibration amplitudes could be simulated.
Figure 4-1: Forcing location on the prototype model
For the harmonic analyses, frequency range is selected between 1-20 Hz. The forcing
shown in the Figure 4-1 is applied in unit magnitude and the total harmonic
displacement response is read from the location shown in Figure 4-6. Total harmonic
displacement value is calculated as a resultant of the harmonic displacements in three
degrees of freedoms. After that, the frequency range is adjusted as between 1-100 Hz
and the harmonic response is obtained as shown in Figure 4-3. It is seen that the
peaks in the harmonic responses are distinct in 1-20 Hz frequency range. Therefore,
this frequency range is found as sufficient in harmonic analyses in order to save the
computation time and effort.

52
Figure 4-2: Harmonic displacement response at the tip of prototype (0-20 Hz)
Figure 4-3: Harmonic displacement response at the tip of prototype (0-100 Hz)
From the modal analyses results presented in Section 3.1, the difference between first
and second modal frequency (side-off) is calculated as about 1.56 Hz. It means that
there is an about %16.7 difference between the first two dominating modal
frequencies of the prototype. Therefore, it is concluded that the natural frequencies of

53
the dominating first two modes of the physical structure are very close to each other.
By considering this situation, an SDOF tuned vibration absorber design is approved
rather than the MDOF or multiple tuned vibration absorber design. That’s why, an
SDOF tuned vibration absorber would satisfy the vibration suppression requirement
with an appropriate selection of the TVA parameters (mass, stiffness and damping) if
the difference between the two modes are sufficiently low.
TVA parameters are identified through the ABAQUS finite element analysis
software. For that purpose, the SDOF tuned vibration absorber is modelled as a
combination of discrete mass, stiffness and damping elements and attached on the
FEA model of the physical structure as shown in Figure 4-4. As seen in the Figure
4-4, two reference points are created and one of these points are connected to the
tube with continuum distributing coupling (RBE3) option of the ABAQUS.
Concentrated mass is located to the second reference point and the spring/dashpot
feature of the ABAQUS is assigned to the line between these reference points in
order to reflect the stiffness and damping properties of the TVA. These two reference
points are constrained with the kinematic coupling (RBE2) option as shown in Figure
4-5. With this constraint, motion of the concentrated mass is allowed in only axial
direction of the spring/dashpot feature while the other degrees of freedoms are
restrained.
Figure 4-4: TVA modelling on the FEA model
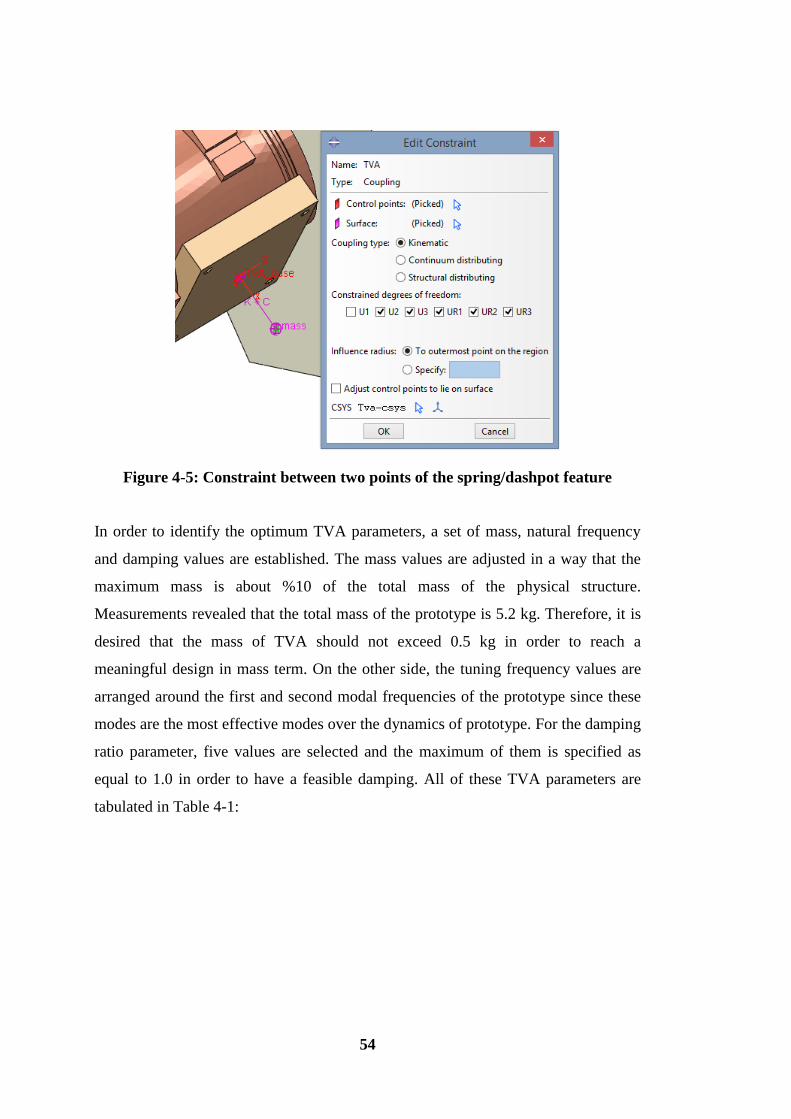
54
Figure 4-5: Constraint between two points of the spring/dashpot feature
In order to identify the optimum TVA parameters, a set of mass, natural frequency
and damping values are established. The mass values are adjusted in a way that the
maximum mass is about %10 of the total mass of the physical structure.
Measurements revealed that the total mass of the prototype is 5.2 kg. Therefore, it is
desired that the mass of TVA should not exceed 0.5 kg in order to reach a
meaningful design in mass term. On the other side, the tuning frequency values are
arranged around the first and second modal frequencies of the prototype since these
modes are the most effective modes over the dynamics of prototype. For the damping
ratio parameter, five values are selected and the maximum of them is specified as
equal to 1.0 in order to have a feasible damping. All of these TVA parameters are
tabulated in Table 4-1:

55
Table 4-1: Selected TVA Parameters
Mass (grams) Tuning Frequency (Hz) Damping Ratio
100 8.5 0.1
200 8.7 0.3
300 8.9 0.5
400 9.1 0.7
500 9.3 1.0
9.5
9.7
9.9
10.1
10.3
As observed in Table 4-1, 5 values for the mass parameter, 10 values for the tuning
frequency parameter and 5 values for the damping ratio parameter are selected.
Therefore, totally 250 harmonic analyses (5x10x5=250) are run in order to sweep the
combination of these parameters entirely.
In the analyses, stiffness parameters of the TVA are calculated from the undamped
natural frequency values presented in Table 4-1 by using the Eqn. 4.2a. Similarly the
damping coefficient parameters are calculated from the damping ratio values in the
Table 4-1 by using the Eqn. 4.2b:
𝑘 = 𝑚. 𝜔𝑛2 (Eqn. 4.2a)
𝑐 = (2√𝑘. 𝑚). 𝜁 (Eqn. 4.2b)
The main motivation behind the TVA design is to minimize the response of the
prototype. For that purpose, a point is selected from the tip of the prototype as shown
in Figure 4-6 and the harmonic displacement of this point is read from the harmonic
analysis results. Then the TVA parameter set is searched among the combination of
parameters given in Table 4-1 that would minimize this harmonic displacement
value.

56
Figure 4-6: Harmonic displacement reading point
As a result of the harmonic analyses those are run with 200 different combinations,
the best combination of parameters is found as follows:
Mass: m=400 grams
Tuning frequency: ωn=9.3 Hz
Damping ratio: ζ=0.3
Variation of the harmonic responses with respect to different TVA masses, damping
ratios and tuning frequencies are presented in Figure 4-7, Figure 4-8 and Figure 4-9,
respectively. In these figures, results are shown for the optimum combination of the
parameters except the variable parameter. By observing these figures, it can be said
that the mass and damping ratio parameters significantly affect the harmonic
response magnitudes whereas the tuning frequency parameter is not so effective.
This situation can also be observed from the Figure 4-10, Figure 4-11 and Figure
4-12 which show the variation of maximum harmonic response amplitudes with
respect to TVA mass, tuning frequency and damping ratio, respectively.

57
Figure 4-7: Harmonic responses for different TVA masses (ωn= 9.3 Hz; ζ=0.3)
Figure 4-8: Harmonic responses for different damping ratios (m=400 grams;
ωn= 9.3 Hz)

58
Figure 4-9: Harmonic responses for different tuning frequencies (m=400 grams;
ζ=0.3)
Figure 4-10: Maximum harmonic response amplitudes with respect to different
TVA masses

59
Figure 4-11: Maximum harmonic response amplitudes with respect to different
tuning frequencies
Figure 4-12: Maximum harmonic response amplitudes with respect to different
damping ratios

60
After the optimization of TVA parameters, orientation of the TVA is sought to be
determined. In order to determine the angular orientation of the TVA, 5 different
values are selected for the angle α shown in the Figure 4-13 and harmonic analyses
are run with the optimum parameter combination for these 5 different angular
orientations. The maximum harmonic response amplitudes obtained from these 5
analyses are presented in Table 4-2 and Figure 4-14 and the harmonic responses are
shown in Figure 4-15. From Table 4-2 and Figure 4-14, it can easily be observed that
the minimum response is obtained from 30° angle orientation.
Figure 4-13: Angular orientation of the TVA on the FEA model
Table 4-2: Maximum harmonic response amplitudes for different angular
orientations of the TVA
Angle Displacement
(mm)
25° 4.496
30° 3.965
35° 4.179
40° 4.727
45° 5.535

61
Figure 4-14: Maximum harmonic response amplitudes for different angular
orientations of the TVA
Figure 4-15: Harmonic responses for different angular orientations of the TVA
Another issue that should be considered in the TVA design process is the additional
mass effect. This effect causes some amount of deviation in the modal frequencies of
the structure. For that purpose, a simple part is designed which has a total mass equal

62
to 1/5 of the prototype mass. After then, this part is attached to the tube of the
prototype model in such a way that the mass center would be on the mass center of
the tube (See Figure 4-16). The harmonic analyses are run on this mass added FEA
model for the unmodified case and modified with the optimized TVA case. The
unmodified harmonic displacement responses are shown in Figure 4-17 and modified
harmonic displacement responses are presented in Figure 4-18. In these figures, the
results can be compared for the mass added and without mass cases.
Figure 4-16: Additional mass part and its location on the FEA model

63
Figure 4-17: Harmonic responses for the unmodified cases
Figure 4-18: Harmonic responses for the modified with optimized TVA cases
From the Figure 4-17 and Figure 4-18, it can be seen that the mass part cause a slight
difference in the harmonic responses. In order to obtain a feasible TVA design, peaks
of the harmonic responses shown in Figure 4-18 is tried to be equalized. For that
purpose, iterations are carried out by playing with the optimized TVA parameter
combination. At the end of several iterations the TVA parameter combination given
in the Table 4-3 is obtained. The harmonic displacement responses obtained for the

64
mass added and without mass cases with this TVA parameter combination are
presented in Figure 4-19.
Table 4-3: The final TVA parameter combination
m (grams) 380
ωn (Hz) 8.7
ζ 0.32
Figure 4-19: Harmonic responses obtained with the final TVA parameter
combination
4.2. REALIZATION OF THE TVA DESIGN
After the determination of TVA parameters, the design solutions which realize these
TVA parameters are investigated. The most appropriate TVA alternative is selected
as a magnetically damped spring-mass system. This system is similar to the TVA
proposed for gun barrels in US Patent 6167794 [8]. From the available damping
types, magnetic damping is chosen since the damping ratio can be easily adjusted.
Moreover, magnetic damping is not affected by temperature effects.

65
By considering the matters mentioned above, TVA system is designed as
demonstrated in Figure 4-20. As observed from this figure, TVA mass consist of an
aluminum block (60*40*15 mm) and two copper plates (60*50*5 mm). In TVA
assembly, two helical springs are used to operate as the stiffness elements. In order to
constrain the motion of TVA to one degree of freedom, two linear bearings are
placed into the aluminum block and two shafts are passed through these bearings and
helical springs. Rare-earth magnets are placed in parallel to the copper plates. The
motivation behind this positioning is to satisfy the damping requirements of the TVA
with the eddy-current effect that is induced within the copper plates. Copper material
is selected due to its low resistivity so that the damping ratio can be enhanced.
Figure 4-20: CAD model of the TVA assembly
The TVA design is fabricated as shown in Figure 4-21. Linear bearings of LME8 UU
type are selected and fastened to the aluminum block from the holes drilled on the
block. Two shafts (Ø8 mm) were passed through these bearings and welded to the
TVA interface. Helical springs are glued to the linear bearings and TVA interface.
Copper plates are attached to two sides of the aluminum block symmetrically.

66
Magnets are attached to the L shaped magnet plates which are made off 1 mm
thickness steel plates and these plates are fastened to the TVA interface by means of
bolts fixed over the slots under the magnet plates.
Figure 4-21: Fabricated TVA assembly and components
According to the experiments, eddy-current damping is similar to viscous damping
and results in a dissipating force proportional to the velocity. The damping
coefficient induced because of the eddy-current damping cannot be calculated by
analytical methods easily; however, the following relation is estimated for this type
of damping [24]:
𝑐 = 𝑘𝐵2𝜗
𝜌 (Eqn. 4.3)
In this relation, B represents the magnetic flux density, ϑ is the conductor volume
inside the magnetic flux, ρ is the resistivity of the conductor and k is a dimensionless
constant. Copper is a suitable material for this purpose since its resistivity is too low.
According to this relation, it can be stated that the only variable is the magnetic flux

67
density (B) in order to manipulate the damping coefficient. This can be done by
adjusting the distance between the copper plates and magnets or putting additional
magnets under the main magnet. For that purpose, the plates which the magnets are
attached on are designed with slots as can be seen in Figure 4-22. The distance
between the magnets and copper plates can be adjusted by sliding the magnet plates
on the slots and these plates are fixed by means of bolts at the desired position.
Figure 4-22: Slotted configuration of the magnet plates
As a result of the optimization study performed with finite element analysis, the
optimum TVA parameters are determined as presented in Table 4-3. Firstly the mass
requirement of the TVA is verified by weighing on a scale as inspected in Figure
4-23.

68
Figure 4-23: Measurement of the TVA mass
Having known the target tuning frequency and the mass of TVA, stiffness of the
TVA is calculated and the appropriate helical spring dimensions is determined via
following equation [25]:
𝑘 =𝐺.𝑑4
8.𝑁.𝐷3 (Eqn. 4.4)
where
G: Modulus of rigidity of the spring material
d: Wire diameter of the spring
D: Outer diameter of the spring
N: Number of active coils of the spring
From the available helical spring options of the catalogues, a helical spring made of
steel and having the following properties is chosen as appropriate:
d = 1 mm; D = 12 mm; N = 10; G =78000 MPa

69
By inserting these values into the Eqn. 4.4, stiffness of the springs is found as
follows:
𝑘 =(78000). (14)
8. (10). (123)= 0,5704 𝑁/𝑚𝑚
Since two helical springs are used in parallel, this value should be multiplied by two:
𝑘 = 2. (0,5704) = 1,1407𝑁
𝑚𝑚
Then the tuning frequency of TVA is calculated as follows:
𝜔𝑎 = √𝑘
𝑚= √
(1,1407 𝑁𝑚𝑚⁄ )
(0,382 𝑘𝑔)= 54,79
𝑟𝑎𝑑
𝑠= 𝟖, 𝟕𝟐 𝑯𝒛
After the target mass and target tuning frequency of the TVA is verified, target
damping ratio of the TVA should be satisfied. Since there is no available analytical
solution to calculate the damping ratio that would be induced due to the eddy-current
effect, the damping ratio is verified experimentally.
4.3. EXPERIMENTAL VERIFICATION OF THE TVA PARAMETERS
In order to characterize the TVA design, sine-sweep tests performed by means of a
modal shaker on the TVA assembly as demonstrated in Figure 4-24. Technical
specifications of the modal shaker are given in Appendix C: Technical Specifications of
the Modal Shaker [26]. Sine sweep tests are performed with 0.01 Hz/s sine sweep rate
and totally 501 frequency lines are extracted from the frequency range between 5-10
Hz. Experiments are carried out by manipulating the distance between the copper
plates and the magnets in order to provide the target damping ratio. Two averages are
taken for each case. As a result of the sine-sweep tests, frequency response functions
are extracted from the accelerometers shown in Figure 4-24, by selecting the 1st
accelerometer as the reference channel.

70
Figure 4-24: Modal shaker and accelerometer locations on the TVA assembly
Sine-sweep tests are carried out on the TVA assembly for 4 different distances and
no magnet case. Frequency response functions obtained for these 5 different cases
are plotted in logarithmic scale in Figure 4-25. From these FRF results, it can easily
be observed that the damping of TVA increases as the distance between the magnets
and copper plates decrease. Moreover, resonance of the TVA is found as 8,4 Hz
which is 0,3 Hz lower than the target tuning frequency (8,7 Hz). This difference is
probably caused by the uncertainty of spring stiffness.

71
Figure 4-25: FRF results obtained for different magnet-copper plate distances
In order to calculate the damping from the FRF results, the analytical expression
given below is used [27]:
(Eqn. 4.5)
In this expression, r represents the frequency ratio (ω/ωn) and ζ denotes the damping
ratio. This equation is inserted into the MATLAB©
software and the FRF graphs are
obtained. Then, these FRFs are plotted with the FRFs obtained from the test results.
Damping ratio in the Equation 5.5 is adjusted so that the theoretical (MATLAB
result) and experimental FRF results agree with each other visually. As an example,
theoretical and experimental FRF’s are plotted in Figure 4-26 for the no magnet case.
𝑋
𝑌=
√1+(2𝜁𝑟)2
√(1−(𝑟)2)2+(2𝜁𝑟)2

72
Figure 4-26: Sample FRF comparison for the damping ratio identification
By using the method mentioned above, damping ratios are determined as in Table
4-4. By observing these damping values, 3 mm magnet-copper plate distance is
selected as the most appropriate position since the target damping ratio (ζ = 0,32) is
almost achieved with this condition.
Table 4-4: Damping ratios with respect to various magnet positions
Damping ratio (ζ)
No magnet 0,018
5 mm 0,091
4 mm 0,18
3 mm 0,35
2 mm 0,41

73
CHAPTER 5
5. CHARACTERIZATION OF THE VIBRATION CONTROL
PERFORMANCE OF TVA
In order to verify the performance of TVA system on the physical structure, modal
tests are carried out on the prototype for the unmodified (without TVA) and modified
(with TVA) cases. During modal tests, prototype is excited from the location
demonstrated in Figure 3-13 such that the forcing in the analysis model is replicated.
TVA is attached on the prototype at an inclined position as shown in Figure 5-1.
TVA assembly is settled to the main structure from the interface part which has a
cylindrical groove conforming to the outer face of the tube. This interface part is
fastened to the structure by means of two threaded U-shaped rods and tightening
them with the aid of four M4 nuts as demonstrated in Figure 5-2.
Figure 5-1: TVA location on the physical structure
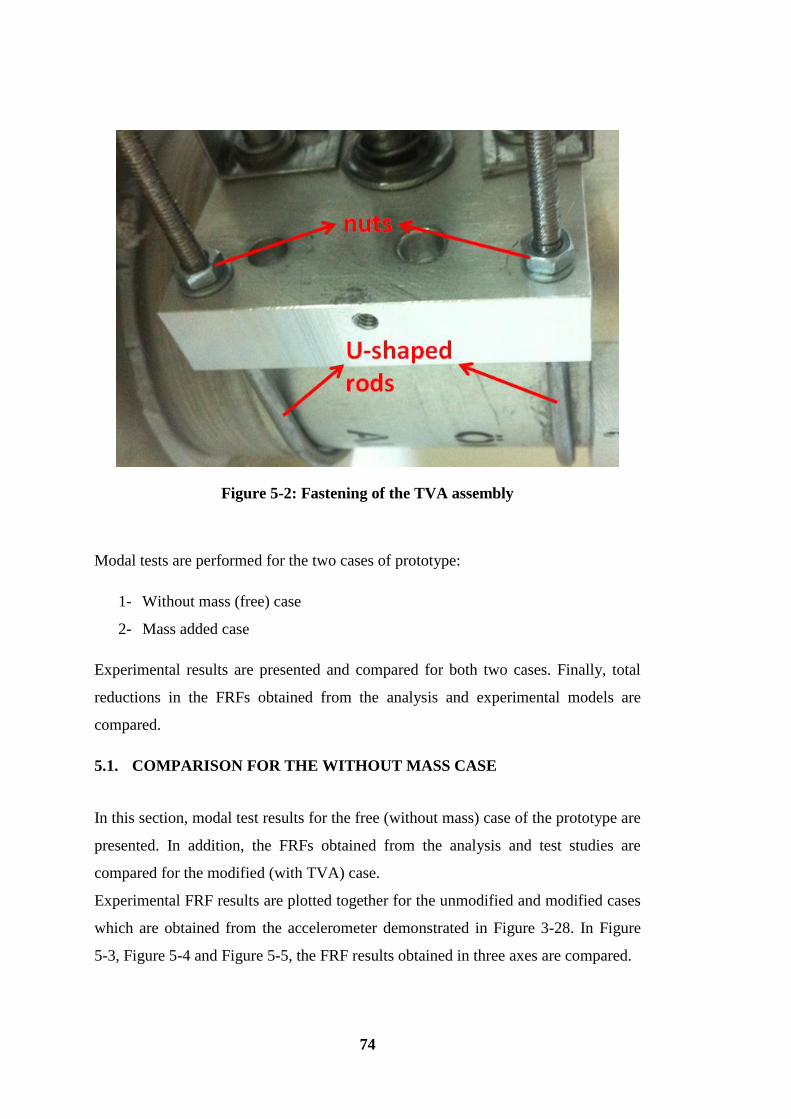
74
Figure 5-2: Fastening of the TVA assembly
Modal tests are performed for the two cases of prototype:
1- Without mass (free) case
2- Mass added case
Experimental results are presented and compared for both two cases. Finally, total
reductions in the FRFs obtained from the analysis and experimental models are
compared.
5.1. COMPARISON FOR THE WITHOUT MASS CASE
In this section, modal test results for the free (without mass) case of the prototype are
presented. In addition, the FRFs obtained from the analysis and test studies are
compared for the modified (with TVA) case.
Experimental FRF results are plotted together for the unmodified and modified cases
which are obtained from the accelerometer demonstrated in Figure 3-28. In Figure
5-3, Figure 5-4 and Figure 5-5, the FRF results obtained in three axes are compared.

75
Figure 5-3: Without mass case - Comparison of the test FRF results (x-direction)
Figure 5-4: Without mass case - Comparison of the test FRF results (y-direction)

76
Figure 5-5: Without mass case - Comparison of the test FRF results (z-direction)
Between Figure 5-6 and Figure 5-8, experimental and analysis FRF results are
compared which are obtained for the modified case. It can be observed that the peak
values are compatible; however, there is a little amount of deviation between the
peak frequencies.
Figure 5-6: Analysis-test FRF comparison for the modified case (x-axes)

77
Figure 5-7: Analysis-test FRF comparison for the modified case (y-axes)
Figure 5-8: Analysis-test FRF comparison for the modified case (z-axes)
5.2. COMPARISON FOR THE MASS ADDED CASE
Experiments are repeated by adopting a mass to the structure which is equal to 1/5 to
the total mass of the structure as mentioned in Section 4.1. In this section,
experimental results for the mass added case of the prototype are presented.
Additional mass is attached to the tube as revealed in Figure 5-9. Verification tests

78
are repeated with this mass added case and the obtained FRF results for the
unmodified and modified cases are compared between Figure 5-10 and Figure 5-12.
Figure 5-9: Attachment of the additional mass on the physical structure
Figure 5-10: Mass added case – Comparison of the test FRF results (x-direction)

79
Figure 5-11: Mass added case - Comparison of the test FRF results (y-direction)
Figure 5-12: Mass added case - Comparison of the test FRF results (z-direction)
As a result of the FRF comparisons, it is observed that the vibration amplitudes again
reduced; however, FRFs are slightly different than the without mass case.

80
5.3. TOTAL ANALYSIS-TEST COMPARISON
In order to evaluate the TVA design study which is performed over the finite element
analysis, total vibration reductions obtained from the analysis and experiment are
compared. Since the optimized and realized TVA parameters are different, total
vibration reductions obtained from the analysis for the realized and optimum TVA
parameters are presented separately. In Table 5-1, optimized and realized TVA
parameters are compared.
Table 5-1: Comparison of the optimum and realized TVA parameters
Optimized Realized Difference (%)
Mass (g) 380 382 0,5
Tuning frequency (Hz) 8,7 8,4 3,4
Damping ratio 0,32 0,35 8,6
Comparisons of the total harmonic displacement results obtained via finite element
analysis for the unit load are presented in Figure 5-13 and Figure 5-14. If the Figure
5-13 and Figure 5-14 are compared, it can be seen that the realized TVA results in
some amount of mistuning.

81
Figure 5-13: Total harmonic displacement comparison for the optimized TVA
(Analysis)
Figure 5-14: Total harmonic displacement comparison for the realized TVA
(Analysis)
Since the experimental results are in terms of acceleration, they should be converted
to displacement. Therefore, following expression is used to convert the accelerance
FRF to the receptance FRF [28]:

82
|𝛼(𝜔)| = |𝐴(𝜔)
𝜔2| (Eqn. 5.1)
In this expression, α(ω) denotes the receptance and A(ω) denotes the accelerance
FRFs. By making this conversion, experimental total harmonic displacement results
are obtained as in Figure 5-15.
Figure 5-15: Total harmonic displacement comparison (Experimental)
Finally, peak values of the total harmonic displacements and the reductions in the
peak values are presented in Table 5-2. From this table, it can be seen that the target
reduction for the optimum TVA design is reached with % 85,8 success in realized
TVA design. Experimentally, total reduction is achieved by % 68,3 rate with respect
to the realized TVA design. As a result, target reduction is satisfied by %58,6 rate
with the experiments. This rate can be considered as low. However, there is some
amount of difference between the peaks of the FEA and experimental model results
for the unmodified case as shown in Figure 5-16 which can account for this low
achievement. This difference can be explained with the insufficient estimation of the
damping of main structure. Another reason can be considered as the mistuning
caused by the difference between the realized and optimum TVA parameters.

83
Table 5-2: Comparison of the maximum harmonic displacements and total
reductions
Unmodified (mm) Modified (mm) Reduction (dB)
FEA-optimized 14,01 3,96 10,96
FEA-realized 14,01 4,74 9,40
Experimental 10,87 5,19 6,42
Figure 5-16: Comparison of the harmonic displacements for unmodified case
Figure 5-17: Comparison of the harmonic displacements for modified case

84

85
CHAPTER 6
6. CONCLUSION AND FUTURE WORK
Supported hollow cylinder structures exhibit oscillatory behavior due to any
excitation. In this thesis work, a representative structure that includes a supported
hollow cylinder structure is constructed. Main contribution to this structure’s
dynamics comes from the two transverse modes of the supported hollow cylinder
structure. These modes are mainly caused by the rigid body movement rather than
the structural modes. In case of impulsive excitation, dynamics of this structure is
shaped by its two dominant vibration modes. In order to reduce the vibration levels
of the structure, a TVA design is proposed by targeting the first two dominant
transverse modes simultaneously.
A physical structure is fabricated and finite element model of the structure is
constructed on ABAQUS software. This finite element model is verified by
experiments. TVA design is carried out on this verified finite element model.
Since the excitation on the system is impulsive, vibration control problem is a
resonant vibration problem. Therefore, vibration reduction is desired around the
resonances of the structure. Experiments show that the first two transverse modes are
dominant in the dynamics of system for the excitation under consideration; thus,
TVA is designed by targeting these two modes. Since two target modal frequencies
are close to each other, an SDOF TVA design is proposed. Basic dynamic parameters
(mass, tuning frequency, damping ratio) of the TVA that would minimize the
harmonic response of the structure are determined over the verified model of the
structure. TVA is designed and fabricated according to these optimum dynamic
parameters. Characterization tests are performed on this realized TVA system in
order to verify the dynamic parameters of TVA.
TVA system is tested on the physical structure in order to characterize the vibration
reduction performance. Experiments are repeated by adding an equivalent mass to
the structure in order to investigate the mass effect on the vibration reduction levels

86
due to the TVA modification. Analysis and test results are compared in terms of
accelerance FRFs. It is observed that the first two mode results are compatible;
however, there is a little amount of shift between the third mode results. Besides,
peak values of the FRFs obtained from the analysis and test models are somewhat
different. These differences arise due to the insufficient damping estimation obtained
from experiments for the finite element model of the physical structure. They can
also be caused by the reason that the connections between parts of the prototype are
not elaborately detailed in the finite element model and some simplifications are
made. Modified case (with TVA) results have shown that there is a shift between the
peaks of the analysis and test results. This can be interpreted with the mistuning
effect of the TVA due to the fact that there is a little amount of difference between
the designed and measured parameters (target damping ratio and target tuning
frequency) of the TVA. For the mass added case test results, it is observed that the
FRF’s are again reduced. However, the vibration reduction levels are somewhat
different than the without mass case.
As a future work, application of the tuned vibration absorber system at different
angular orientations is suggested. By this way, the optimum orientation that would
minimize the response of the structure can be detected. Furthermore, reductions of
the oscillations should be examined in the time domain in order to measure the TVA
performance in a more realistic way.

87
REFERENCES
[1] Den Hartog J.P. Mechanical Vibrations. McGraw-Hill Book Company, Inc.
1956. Fourth Edition. New York Toronto London.
[2] Özgüven, H., & Çandır, B. (1986). Suppressing the First and Second
Resonances of beams by Dynamic Vibration Absorbers. Journal of Sound and
Vibration, 111(3), 377-390.
[3] Zuo, L., & Nayhef, S. (2004). Minimax optimization of multi-degree-of-
freedom tuned-mass dampers. Journal of Sound and Vibration, 272, 893-908.
[4] Snowdon, J., Wolfe, A., & Kerlin, R. (1984). The Cruciform Dynamic
Vibration Absorber.
[5] Vakakis, A., & Paipetis, S. (1986). The Effect of a Viscously Damped
Dynamic Absorber on a Linear Multi-Degree-of-Freedom System. Journal of Sound
and Vibration, 105(1), 49-60.
[6] Pombo, J., & Laura, P. (1986). Use of Two Dynamic Vibration Absorbers in
the Case of Machinery Operating at Two Frequencies which Coincide with Two
Natural Frequencies of the System. Applied Acoustics, 19, 41-45
[7] Kathe, E., & Littlefield, A. (2002). Adaptive Gun Barrel Vibration Absorber
[8] Eric L. Kathe. Gun Barrel Vibration Absorber. U.S. Patent No. 6,167,794 B1,
1998.
[9] Büyükcivelek, F. (2011). Analysis and Control of Gun Barrel Vibrations
(M.s. Thesis).
[10] Bonsel, J., Fey, R., & Nijmeijer, H. (2004). Application of a Dynamic
Vibration Absorber to a Piecewise Linear Beam System. Nonlinear Dynamics, (37),
227-243.

88
[11] Gu, M., Chang, C., Wu, W., & Xiang, H. (1998). Increase of critical flutter
wind speed of long-span bridges using tuned mass dampers. Journal of Wind
Engineering and Industrial Aerodynamic, 73, 111-123.
[12] Hill, S., Synder, S., & Cazzolato, B. (2002). An Adaptive Vibration
Absorber. Acoustics 2002 - Innovation in Acoustics and Vibration.
[13] Lamb, J. (n.d.). Tuned-Mass Damper Design: A Case Study. Structural
Engenuity, Inc.Retrieved from www.structuralengenuity.com
[14] Mirsanei, R., Hajikhani, A., Peykari, B., & Hamedi, J. (2012). Developing a
New Design for Adaptive Tuned Dynamic Vibration Absorber (ATDVA) Based on
Smart Slider-Crank Mechanism to Control of Undesirable Vibrations. International
Journal of Mechanical Engineering and Mechatronics, 1(1).
[15] Maly, J., & Napolitano, K. (1993). A Magnetic Tuned-Mass Damper For
Buffet Induced Airfoil Vibration.
[16] Sayyad, F., & Gadhave, N. (2013). Study of Magnetic Vibration Absorber
with Permanent Magnets along Vibrating Beam Structure. Journal of
Structures, 2013.
[17] Harris, A. (2003). Multi-Degree of Freedom Passive and Active Vibration
Absorbers for the Control of Structural Vibration (M.S. Thesis).
[18] ABAQUS 6.12 Analysis User’s Manual (2012). Providence, USA.
[19] LMS Test Lab12A Documentation (2012). Leuven, Belgium.
[20] PCB 086C41 Model ICP Impact Hammer Specification Sheet, 2010.
[21] PCB 356B21 Model Triaxial ICP Accelerometer Specification Sheet, 2013.
[22] J. Allemang, R. (n.d.). The Modal Assurance Criterion (MAC): Twenty Years of
Use and Abuse. Mechanical, Industrial and Nuclear Engineering University of
Cincinnati, USA.

89
[23] Lalanne, C. (2009). Fourier transform of simple shocks. In Mechanical Shock
and Vibration Analysis (2nd ed., Vol. 2, pp. 14-25). London, United Kingdom:
Wiley.
[24] Kienholtz, D., & Pendleton, S. (1994). Demonstration of solar array vibration
suppression. Smart Structures and Materials, 2193.
[25] Budynass, R.G., Nisbett, J.K., (2008) Mechanical Springs. In Shigley’s
Mechanical Engineering Design (8th ed., pp. 501-550). USA: McGraw-Hill.
[26] TMS Modal Shop Model 2110E 110 LBF Electrodynamic Exciter Specification
Sheet, 2013.
[27] Kelly, S.G., (2012). Response due to harmonic excitation of support. In
Mechanical Vibrations Theory and Applications (SI ed., pp. 228-234). Stamford,
USA: Cengage Learning.
[28] Irvine, T. (2000). An Introduction to Frequency Response Functions.

90

91
APPENDICES
Appendix A: Technical Specifications of the Accelerometers
Figure 0-1

92
Appendix B: Technical Specifications of the Impact Hammer
Figure 0-2

93
Appendix C: Technical Specifications of the Modal Shaker
Figure 0-3