
Tunable Narrow-Band Filter For LWIR Hyperspectral Imagingsci-sol.com/3948-8.pdf · Tunable...
12
Tunable Narrow-Band Filter For LWIR Hyperspectral Imaging James T. Da1y', Andrew Bodkinh, William Schnellerc, Robert Kerrc, John Notoc, Raymond Haren", Michael Eismann", and Barry Karch" aJon Optics, Inc., Waltham, MA 02452 bBodkfl Design, PUB 8 1 1 76, Wellesley, MA 02181 cScientific Solutions, mc, North Chelmsford, MA 01863 C/EU Targeting Branch, AFRL/WPAFB, Dayton, OH 45433 ABSTRACT Infrared (IR) sensing has been a key enabling tecimology in military systems providing advantages in night vision, surveillance, and ever more accurate targeting. Passive hyperspectral imaging, the ability to gather and process infrared spectral information from each pixel of an infrared image, can ultimately provide two-dimensional composition maps of a scene under study. Finding applications such as atmospheric, and geophysical remote sensing, camouflaged target recognition, and defense against chemical weapons. We are developing a new, compact, high resolution hyperspectral long wave infrared (LWIR) imager concept based on an electronically-tunable, compact, solid state, interferometric Fabry-Pérot étalon filter. By controlling an externally applied electric field, the filter can be rapidly tuned (50-100 Hz) over a broad spectral range (>1.5 m at 10 tm wavelength). Careful design and fabrication ensures high peak transmission (80%) and narrow-band width (0.15 tm). Alternatives such as piezoelectric and opto-acoustic filters can operate at higher frequencies but have a much more limited tuning range (<0.01 pm). We will compare experimental results with theoretical predictions for the transmission bandwidth, peak transmission intensity, spectral tuning range, on-off contrast ratio, off-axis and hysteresis effects of one such tunable filter operating at 9 pm. 1. ThTRODUCTION Infrared (IR) imagers or focal plane arrays have been key elements in military systems for day/night reconnaissance, surveillance, imaging through smoke and/or camouflage, target recognition and identification, and even identifying and mapping the extent of a release of chemical warfare agents. Most IR cameras are panchromatic, that is they sense radiation over a wide band of the spectrum. For example a thermal imager will integrate all the IR radiation spanning the wavelengths from 7 to 14 urn or 8 to 12 urn, and present it as a grayscale (black and white intensity) image on a video screen. This works great for picking out tanks on the sands of the desert (a low thermal clutter background) but it does not work so well for picking out camouflaged or concealed targets in moderate to high thermal clutter backgrounds. There has been a lot of recent interest in the potential for exploiting IR spectral information for enhancing target detection performance and reducing false alarm rates.1'2'3'4 Early analysis of measurements of the spectral signatures of military and test targets in desert and vegetated backgrounds showed that it is possible to obtain good target to background spectral contrast even when the panchromatic (broadband) contrast is low.3'4 This is because the background correlation exceeds 0.999 for many conditions and it is therefore possible to mathematically filter out the background from the image. The key to accurate target detection will be the choice of spectral bands. Previous analysis has shown that the optimal bands tend to fall in the 8.5 — 10.5 m range.' One approach to capture this spectral information is to use a filter wheel and individual bandpass filters in front of an LWIR camera. This approach is already available from a commercial supplier but its implementation is expensive and inflexible.5 The passbands are fixed and space limits the number of filters to 5 or 6 at most. What's more, the rotation mechanism for the filter wheel can be a source of failure in deployed systems. Another approach is to use multiple spectral (bandpass) filters integrated right onto the focal plane array in order to simultaneously collect multiple images of the same scene.6 An example of this technique is a color television camera. The 104 In Photodetectors: Materials and Devices V, Gail J. Brown, Manijeh Razeghi, Editors, Proceedings of SPIE Vol. 3948 (2000) • 0277-786X1001$1 5.00
Transcript of Tunable Narrow-Band Filter For LWIR Hyperspectral Imagingsci-sol.com/3948-8.pdf · Tunable...

Tunable Narrow-Band Filter For LWIR Hyperspectral Imaging
James T. Da1y', Andrew Bodkinh, William Schnellerc, Robert Kerrc, John Notoc, Raymond Haren", Michael Eismann", andBarry Karch"
aJon Optics, Inc., Waltham, MA 02452bBodkfl Design, PUB 8 1 1 76, Wellesley, MA 02181
cScientific Solutions, mc, North Chelmsford, MA 01863C/EU Targeting Branch, AFRL/WPAFB, Dayton, OH 45433
ABSTRACT
Infrared (IR) sensing has been a key enabling tecimology in military systems providing advantages in night vision,surveillance, and ever more accurate targeting. Passive hyperspectral imaging, the ability to gather and process infraredspectral information from each pixel of an infrared image, can ultimately provide two-dimensional composition maps of ascene under study. Finding applications such as atmospheric, and geophysical remote sensing, camouflaged targetrecognition, and defense against chemical weapons.
We are developing a new, compact, high resolution hyperspectral long wave infrared (LWIR) imager concept based on anelectronically-tunable, compact, solid state, interferometric Fabry-Pérot étalon filter. By controlling an externally appliedelectric field, the filter can be rapidly tuned (50-100 Hz) over a broad spectral range (>1.5 m at 10 tm wavelength). Carefuldesign and fabrication ensures high peak transmission (80%) and narrow-band width (0.15 tm). Alternatives such aspiezoelectric and opto-acoustic filters can operate at higher frequencies but have a much more limited tuning range (<0.01pm).
We will compare experimental results with theoretical predictions for the transmission bandwidth, peak transmissionintensity, spectral tuning range, on-off contrast ratio, off-axis and hysteresis effects of one such tunable filter operating at 9pm.
1. ThTRODUCTION
Infrared (IR) imagers or focal plane arrays have been key elements in military systems for day/night reconnaissance,surveillance, imaging through smoke and/or camouflage, target recognition and identification, and even identifying andmapping the extent of a release of chemical warfare agents. Most IR cameras are panchromatic, that is they sense radiationover a wide band of the spectrum. For example a thermal imager will integrate all the IR radiation spanning the wavelengthsfrom 7 to 14 urn or 8 to 12 urn, and present it as a grayscale (black and white intensity) image on a video screen.This worksgreat for picking out tanks on the sands of the desert (a low thermal clutter background) but it does not work so well forpicking out camouflaged or concealed targets in moderate to high thermal clutter backgrounds.
There has been a lot of recent interest in the potential for exploiting IR spectral information for enhancing target detectionperformance and reducing false alarm rates.1'2'3'4 Early analysis of measurements of the spectral signatures of military andtest targets in desert and vegetated backgrounds showed that it is possible to obtain good target to background spectralcontrast even when the panchromatic (broadband) contrast is low.3'4 This is because the background correlation exceeds0.999 for many conditions and it is therefore possible to mathematically filter out the background from the image.
The key to accurate target detection will be the choice of spectral bands. Previous analysis has shown that the optimal bandstend to fall in the 8.5 — 10.5 m range.'
One approach to capture this spectral information is to use a filter wheel and individual bandpass filters in front of an LWIRcamera. This approach is already available from a commercial supplier but its implementation is expensive and inflexible.5The passbands are fixed and space limits the number of filters to 5 or 6 at most. What's more, the rotation mechanism for thefilter wheel can be a source of failure in deployed systems.
Another approach is to use multiple spectral (bandpass) filters integrated right onto the focal plane array in order tosimultaneously collect multiple images of the same scene.6 An example of this technique is a color television camera. The
104 In Photodetectors: Materials and Devices V, Gail J. Brown, Manijeh Razeghi,Editors, Proceedings of SPIE Vol. 3948 (2000) • 0277-786X1001$1 5.00

TV camera has three narrow band filters: red, green and blue, in front of three detector arrays. Each array/filter combinationlooks through the same lens, simultaneously. The collected imagery is then presented as color images on the televisionscreen. Each filtered image is represented by a different colored phosphor and overlapped. While this is a high yield processfor silicon CCD array video cameras made by the millions each year, no one has demonstrated it more than once or twice forLWIR imagers.
We chose instead to use a widely tunable, narrow-bandpassfilter in front of an LWIR camera. The filter is designed tobe tunable over 1 .5 — 2 microns at 8.5-10 tm wavelength.The filter is based on the principle of the Fabry-Perot etalon(figure 1) in which two closely spaced, parallel mirrors willonly transmit a narrow band of wavelengths when there is aconstructive interference condition. That is, when the opticalpath difference between successive bounces is equal to someintegral number of wavelengths. Put another way, brightfringes occur whenever the distance light travels between themirrors is some integral number of half wavelengths:
2d . cos 9= rn —
where X is the incident wavelength, d is the separationbetween the mirrors, and m is an integer: 0, 1,
(1) that we can get a relatively large tuning range &/x—
0.1-0.2 since the difference between ordinary, n0, andextraordinary, n, indexes can be as high as lO%-20%,
(2) there are no moving parts, making this an inherentlyrugged and reliable device that is unlikely to fail orrequire re-calibration in the field, and
(3) tuning the device requires little power; the etalon worksby applying an electric field (voltage) but draws nocurrent.
The index of refraction of the liquid crystal varies withapplied voltage because the molecules of the LC becomepolarized and tend to line up with the resultant electric field.Figure 2 illustrates how the molecules of the liquid crystalrotate (tilt) in response to the applied electric field, thuschanging the apparent index of refraction. However, thischange will only affect light linearly polarized in thedirection of the extraordinary axis. Light polarized parallelto the ordinary axis will not see any change in response tothe applied electric field. It will therefore be necessary toinclude a linear polarizer into any hyperspectral imagingsystem in order to select the polarization parallel to theextraordinary axis of the liquid crystal.
Figure 1 Ray-trace showing optical path through theFabry-Perot etalon for some arbitrary angleof incidence, 9
E0t2r4
E0t2r3
E0t2r
E0r
(1)
E0t2
E0d
Most Fabry-Pérot (FP) etalons are used as filters with onlyair between the mirrors (n=l) and are "tuned" by changingthe spacing d between the mirrors. In fact, a hyperspectralLWTR camera based on this principle has been demonstrated. In that case however, the FP etalon was tuned by changing theplate separation, d. This will require extreme mechanical precision to maintain parallelism as the gap is varied. Ourapproach is to place a nematic liquid crystal (LC) between the mirrors and tune the etalon by applying an electric field tochange the index n. This is equivalent to replacing d by n d in (1), where n is the index of refraction of the mediumbetweenthe mirrors. The advantages to this approach are:
LigM
Figure 2 Illustration of tilting of the liquid crystalmolecules in response to applied electric field.The result is a change in index ofrefraction. Notethe polarization dependence.
105

2. FABRY-PEROT ETALON TRANSMISSION MODEL
The liquid crystal etalon (LCE) transmission model is derived from a mathematical treatment for air spaced etalons.8 In thismodel, transmitted and reflected radiation sum to nearly 1 , with allowance made for a small portion absorbed by the mirrorcoatings. The model does not include absorption or scattering by the liquid crystal layer.
The LCE transmission is described by:
T =[i
_A]2
.[ + (11•2 Sfl
2 • n(V) .dcos(9) + 8(2)] (2)
where A is the mirror absorbance, R is the mirror reflectance, n(V) is the liquid crystal index of refraction and is a ftinction ofapplied voltage, d is the mirror spacing or liquid crystal thickness, 2 is the free space wavelength ofthe incident light, Z) isthe phase shift upon reflection at the mirrors, and 8 is the incident angle of rays entering the etalon. From this expression, itis clear that the transmittance reaches a maximum whenever
2,r.n(V).d .cos(O) + 6(2) = m • ,r (3)
for m = 0, 1, 2, .. . The equation described by (2) is an Airy function and is shown in figure 3 . Here the plate separation d isset at 1 1 .25 im, the mirror reflectance R varies from 0.2 to 0.9, the index n of the liquid crystal is set at1 .72, the angle ofincidence is O, and the phase shift Supon reflection from the dielectric mirrors is t.
1.c, ' ,ir' I jo.c I,
ill I j0.8 i' I I :,:t I , •:,:i6 I I :0.7 Il 'I
> 0 6\ iii \R = 0 2 ,,i: O.5j ,/ I k ' I
; %- .-.G) 0.4 I :— :
j I— 0.3/ \ I \R=O.5
o.. / \ ;f \0.1
••• ••••
I \R=O.9O.G— ; ; —; I 3
wavelength (sam)
Figure 3 Calculated transmittancefor a liquid crystal-filled Fabry-Perot etalon with plate separation of 11.25 jim andmirror reflectivity ofO.2, 0.5, and 0.9, respectively. The number next to the transmittance peak represents anorder index, m, from equation 3.
The separation between orders is called the "free spectral range" and is given by 11(2 n ci). If we change the plate separationd or the index of refraction n, then the wavelength of each peak will also shift. Specifically, if we adjust the index of the LCfrom n at zero applied bias to (a lower) n0 at some maximum applied voltage, then the peaks in figure 3 will shift to shorterwavelengths.
The model in equation (2) was used to calculate the transmission versus wavelength of the LCE. From our LC supplier, weobtained index values of 1.572 for n0 and 1.857 for n, respectively. Figure 4 illustrates the shift in peak transmittance
106
14

wavelength we should therefore expect in response to an applied voltage. Here we can see the tuning range is predicted to be1.6 jm over the range 8.9 to 10.5 rim.
C0U,U)
EU)CU)
I—
12
Figure 4 Transmission curves for LCE with an 1 125am layer thickness. The transmission peak is at 10.47 am whenthe index is at 1.857, as the index is increased by applying a voltage to the etalon, the transmission peak willmove to shorter wavelengths, thru 9. 7 ,um at the mid value, to 8.87 at the minimum index of 1.572. Themaximum transmission is 80%, but this isfor linearly polarized lightparallel to the liquid crystal's slow axis,and does not include scattering. For randomly polarized light we expect better then 30% peak transmission,after accounting for the polarization state loss and scattering. The bandpass is roughly 0. 10 pm at FullWidth HalfMax (FWHM). Note that another transmission order is shown in the curvefor the 1.857 index.This (fIfth) order is peaked at 8.37 pm, or onefree spectral range (roughly 2. 1 pm) away.
3. LCE/CAMERA SYSTEM MODELS
We also examined how the liquid crystal etalon can be expected to perform when combined with a LWIR camera to form ahyperspectral imaging system. A critical element in the functioning of the tunable filter in such a system is the angle of
incidence, 8 , that light travels through the etalon (figure 1). Depending on placement of the etalon in the system, the rayangle could have two important limiting characteristics for the hyperspectral imaging system: either a broadening of thespectral bandpass, or a shift in bandpass with image location.
When the LCE is placed in front of the lens of the JR camera (figure 5), different ray angles correspond to different imagelocations or pixels on the array. From the etalon model (eq. 2) it is shown that transmission is a function of angle; as theangle of incidence deviates from normal, the optical path length within the etalon increases. This increase causes awavelength shift in the transmission peak. In practice, the range of incidence angles that are present is limited only bywhatever field stop (field of view) is in the system. This results in a shifting in the transmission bandpass across the imageplane (figure 6). This results in the characteristic ring pattern in the etalon image. In our system design, the etalon is gappedso it uses only the central ring, and the models indicate a bandpass shift towards the edge of the image. We intend to correctfor this spectral discrepancy with a calibration table and image processing software.
When the LCE is placed between the lens and the array (figure 7), the ray angles are determined by the F-cone. Each pixelwill be exposed to multiple rays that have traversed the LCE at different angles. Therefore each ray will see a differentbandpass through the LCE, resulting in a broadening of the bandpass (figure 8). The degree of spectral broadening isdependent on the maximum angle of the F-cone.
107
8 9 10 11
wavelength (gm)

Figure 5 Diagram of a cooled camera assembly that incorporates the LCE before the camera lens at the aperture. Thislocation results in spectral shift across the focal plane. This can be corrected by software. However, thisposition increases veiling glare and narcissus caused by the reflected heat off the back of the LCE.
Shift in spectral pass of filter whenlocated on object side of lens
U)U)CD
C
U)
DETECTOR
3.0% -
2.5% -
2.0% -
1.5% -
1.0% -
0.5% -
0.0% TTTTTTT1TTT'0% 20% 40% 60% 80% 100
% of field from center of image plane
Figure 6 illustration of the wavelength shfl caused by placement of the LCE between the camera lens and the object.With a wide field of view system this can result in a spectral shift as much as 2.5%.
DETECTOR
Figure 7 Diagram of a cooled camera assembly that incorporates the LCE between the camera lens and the cold shieldof the focal plane array. This location reduces veiling glare from the warm camera reflected off the back of theLCE, however it causes spectral broadening due to the cone of rays traversing the LCE arriving at each pixel.
108

Figure 8 Effect of increasing the f-number (reducing the angles of incidence on the LCE). The transmission peakbecomes broader and contrast is reduced. Both graphs have been calculatedfor a 10 pm center wavelength.
There are also secondary effects due to the passing of light through the liquid crystal at angles other than normal. The indexof refraction of the liquid crystal varies with applied voltage because the liquid crystal consists of elongated molecules whichline up (or tilt) according to the local electric field. However, this only affects one polarization axis, but does not affect theother. This is why a linear polarizer is an integral part of the LCE filter. Only light polarized parallel to the axis of the liquidcrystal is affected by changing the voltage. Light polarized perpendicular sees the same index of refraction regardless ofapplied voltage. The wavelength for perpendicularly polarized light is therefore unaffected by applied voltage.
Combining therefore this angular (or FOV) dependence of transmission wavelength with the polarization effect of the liquidcrystal molecule, we see that as we move from center to edge of the focal plane array, the degree of wavelength shift willdepend on whether we are moving parallel to the axis of the molecules (e.g. north-south) or perpendicular to axis of themolecules (e.g. east-west). That is, the distortion of the image is slightly different top-to-bottom than it is left to right asshown in figure 9.
FIELD FLATNESS
Figure 9 LCE transmitted wavelength across the image plane for several fixed values of LC index of refraction. Theétalon bandpass shfls for off-axis pixels. However the degree of the shift depends on whether we move off-axis parallel to or perpendicular to the alignment direction of the liquid crystal. This can be measured andcorrected in an image processing operation to yield unform spectral channels in the hyperspectral image.
1.00.90.8
o 0.70.6• 0.50.40.30.20.10.0
:rf=1JL.5%
Cl) AOlCl) 0Cu
1:- 1%
0%
wavelength (pm)8 9 10 11 12 1 1.5 2 2.5 3 3.
F-number
I-15.00 -10.00 -5.00 0.C)0 5.00 10.00 15.00
FIELD ANGLE II
109

4. EXPERIMENTAL
Based upon the predictions of our model and the desire to have a single LCE that could tune across the entire range 8.5-10.5tm, a prototype etalon was built with the following specifications:
Substratematerial: ZnSe
thickness: 10mmwedge: 0.5 degrees
diamter: 2.0 inflatness: ambdall0 633 nm
Systemetalon gap: 8.5 im
index range: 1.57-1.86mirror reflectivity: > 90%
clear aperture: I .0 in
Figure 10 shows the structure of the filter. The ZnSe substrates were first coated with a transparent conducting layerfollowed by a thin (<10 tm) dielectric stack mirror with >90% reflectivity over the range 8-11 tm. Then an anti-reflectioncoating was placed on the etalon's external surfaces to reduce the typical 17% Fresnel loss for ZnSe to less than 5%. The lastpreparatory step for the etalon plates was to coat the internal surfaces with a polymer alignement layer and to brush the layerto align the liquid crystal.
Figure 10 Schematic depiction ofliquid crystal-filled Fabry-Perot etalon. The dielectric stack mirrors are deposited on theZnSe windows;followed by a conducting coating; then apolymer alignment layer to orient the liquid crystal.
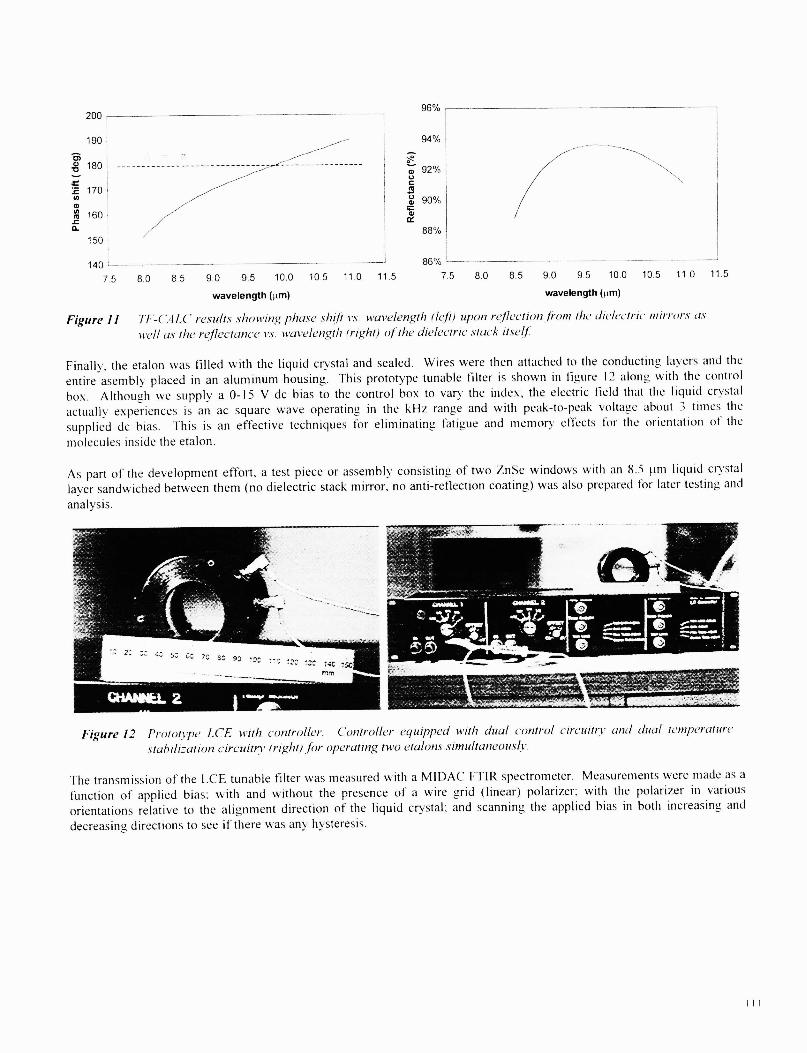
The mirrors we used on this system are made from layers of dielectric thin film, so there is a variation as a function ofwavelength for phase shift upon reflection and for reflectance, as shown in figure 1 1 . The phase shift and reflectance for thedielectric mirrors were calculated using TF-CALC software. The results of these calculations were incorporated into thetransmission model. Fortuitously, the variable shift in phase has effectively widened the tuning range for the LCE (from 1.67tm to just over 2 nm), so depending on the order selected, we can cover the entire 8.5-10.5 tm range.
Once the etalon mirrors were prepared, they were aligned and the gap set using spacers designed especially for this purpose(a standard liquid crystal assembly technique). However, these spacers are only available in 0.25 .tm increments, thuslimiting the exact mirror spacing or liquid crystal layer thickness.
110
________ 96%200 —-—- - - ______
190i 94%
4::: ) :::c 160 C,
15088%
140 86%
75 80 8.5 90 9.5 10.0 10.5 11.0 11.5 75 8.0 8.5 90 95 100 105 11.0 11 5
wavelength (tm) wavelength (tni)
Figure 11 TF—('.lL( results showing phase shill vs. wavelength (left) upon reflection from the dielectric mirrors aswell as the reflectance vs. wavelength (ri'ht) of the dielectric stack itself.
Finally, the etalon was filled with the liquid crystal and sealed. Wires were then attached to the conducting layers and theentire asemb1 placed in an aluminum housing. This prototype tunable filter is shown in figure 12 along with the controlbox. Although we supply a 0-15 V dc bias to tile control box to vary the index, tile electric field that the liquid crystalactually experiences is an ac square wave operating in tile kflz range and with peak-to-peak voltage about 3 timestile
supplied dc bias. This is an effective techniques for eliminating fatigue and memory effects for the orientation of the
molecules inside the etalon.
As part of tile development effort, a test piece or assembly consisting of two ZnSe windows with an 8.5 im liquid crystallayer sandwiched between them (no dielectric stack mirror, no anti-reflection coating) was also prepared for later testing and
analysis.
Figure 12 Prototype LCE with controller. Controller equipped with dual control circuitry ziicl dual tenperaturcstabilization circuitry (right) for operating two etalons simultaneous/v.
Tile transmission of the LCE tunable filter was measured with a MlE)AC FTIR spectrometer. Measurements were made as afunction of applied bias: with and without the presence of a wire grid (linear) polarizer: with the polarizer in variousorientations relative to the alignment direction of the liquid crystal: and scanning the applied bias in both increasing anddecreasing directions to see if there was any hysteresis.

5. EXPERIMENTAL RESULTS
We measured the transmission of the uncoated ZnSe window and the ZnSe/LC/ZnSe sandwich (figure 13). The 7O%transmittance of the uncoated window is expected due to Fresnel losses for a transparent material of index 2.4 in air andillustrates the importance of adding anti-reflection coatings for the air/ZnSe interface to the design.
When we measured the liquid crystal, we noted several strong absorption lines located just outside our target operating rangeof 8.5-10.5 im along with one or two much weaker ones inside this range. We also noted a generalized 5-10% decrease inbroadband (8-12 tim) transmittance. This is probably due to additional Fresnel losses at the interface between the liquidcrystal and the ZnSe.
'I
Figure 13 Measured transmittancefor ZnSe window (uncoated) and 8. 5 um ofliquid crystal sandwiched between twoZnSe windows. There are several strong absorption lines in 7-8. 5 pm range and again at 12 m. In the range8. 6-1 1. 4 ,um however, the absorption lines are somewhat weaker.
The LCE transmission was measured on a MIDAC Fourier transform infrared spectrometer without any applied voltage. TheLCE was fitted with a linear polarizing grid, and the transmission curves from the MIDAC used to determine the properalignment of the polarizer to the etalon. Without the polarizer, the etalon has dual transmission peaks, one for the ordinaryand one for the extraordinary index (figure 14). To eliminate the ordinary peak, the wire grid polarizer is used. The ratio ofthe wavelengths at the transmission peaks for the two polarizations (?e/Xo)S equivalent to the ne/no ratio. In this case, theratio is 0.9, not 0.84 as predicted by the expected indices. There are two compounding factors; either n and n0 are not asadvertised in the manufacturer's literature, or the phase shift upon reflection is different than predicted by the TF-CALCmodel.
Figure 14 also shows the edges ofthe dielectric mirror reflectance at about 7.6 sm and 12.5 sm. We also see that two nearbyorders exhibit etalon transmission peaks one near 8.5 sm and another near 1 1 .2 .tm.
We then measured the LCE transmission curves as a function of applied voltage (figure 1 5). As the voltage is increased onthe etalon, the extraordinary peak moves to over lap the ordinary peak. The bandpass peak tunes from 9.35 urn to 8.55 urn.However there is a variation in peak transmittance over this shift. This is seen more clearly in figure 1 6, which was takenwith smaller voltage steps. Here we see an absorbance peak around 8.9 .tm which corresponds to the weak absorbance peakat 8.93 .tm in figure 13. There also appears to be an absorbance peak on the short wavelength edge of the 30-50V curvesnear 8.5 rim. This also corresponds to an LC absorption peak at 8.47 .trn seen in figure 13.
We plot the peak transmission wavelength for both the order at 8.55-9.3 5 sm and the order at 11.2-12.5 .tm in figure 17. Wecan see that over the range of 5-16 V, the peak wavelength varies linearly with applied voltage.
112
7 8 9 10 11 1 13
vdength(piT$

0Cl)Cl)
ECl)
C',
Figure 14 Transmission of the liquid crystal-filled etalon with and without a polarizer. Polarizer is aligned withextraordinary axis ofliquid crystal to allow only onepeak to come through.
0C,)U)
EU)CC',
F-
Figure15 Transmsion bandpass movesfrom 9.35 to 8.55 urn as peak to peak voltage across the LCE is incresedfrom 0to 50 v. The bandpasss is 0. 15 urn as predicted. Note that the are distorted around 8. 5 ,wn and that themaximum transmission is only 14% (for randomlypolarized light).
6. DISCUSSION & CONCLUSIONS
The tunable liquid crystal etalon exhibited many of the characteristics predicted in our model, including a bandpass of 0.15
pm , transmsiion in the 8 to 10 urn range, and sensitivity to polarization. Additionally, tuning was demonstrated over the 8.5to 9.4 sm range. However total transmision was lower then expected by a factor of 3, and anornoulous absorption spikeswere detected in the transmission.
Our model indicate that the peak transmission ought to be near 80% for the polarization parallel to the extraordinary axis ofthe liquid crystal. That corresponds to 3 5-40% for unpolarized light. We believe that our measured peak transmission of 7-14%, depending upon applied voltage, may be due to absorption in the dielectric minors, the conducting layer, and the liquidcrystal itself. Another possible loss mechanism is scattering in the liquid crystal.
113
wavelength (tim)
wavelength (,am)

C0U)U)
EU)CC',
F-
Figure 16 Transmission ofprototype LCE tunablefilter with applied voltagesfrom I to 15V in 2V increments. Note thepresence ofan absorbance peak near 8. 9 ,um.
9.8 __________________________________ 12.8
1 9.6 :i E 12.619.4 .L 12.4
) 9.2% 12.2C T •&. C. 9.0 I .! 12.0C) .
8.8 _ !. 11.8
. 8.6 .---- 11.6
8.4 - 11.4
Q. 8.2 . 11.20 10 20 30 40 50 0 10 20 30 40 50
dc bias (V) dc bias (V)
Figure 17 Tuning ofthe peak transmission wavelength in response to applied bias: m = 5th order (left) and m= 4ih order
(right). • 0-15 Vscan, M O-5OVscan.
That the tuning range is only 0.9 tm instead of the 2 .tm predicted by our model suggests that the index of refractiondifference between ne d n0 at these wavelengths is not as large as predicted by the manufacturer. If we accept that theetalon mirrors are exactly 8.5 sm apart as designed, then the measured transmission spectra of figures 14-16 indicate that theordinary index n0 must be 1 .55 and the extraordinary index n must be 1.67.
Follow on work will include thoroughly characterizing all the loss mechanisms in the LCE. Performing high resolutionspectral measurements of the conducting layer absorption, alignment layer abosrption, substrate transmission and the liquidcrystal absorption. Additionally, measurements of the ordinary and extraordinary index of the LC in our bands of interest,and the mirror spectral phase shift are required. Once these components are characterized the best operating parameters canbe selected and the etalon redesigned and rebuilt to maximize tunability and transmission.
7. ACKNOWLEDGEMENTS
This work was supported by the United States Air Force Research Laboratory under SBIR contract no.: F33615-99-C-1427.
114
8.8
wavelength (jim)
I I.. 11111111111111111111
a
REFERENCES
1 MT. Eismann, C.R. Schwartz, J.N. Cederquist, J.A. Flackwell, R.J. Huppi, "Comparison oflnfrared ImagingHyperspectral Sensors for Military Target Detection Applications", Proc. SPIE, 2819, 91-101 (1996).
2 MT. Eismann, et al., "Infrared Multispectral Target/Background Field Measurements", Proc. SPIE, 2235-09,Orlando, FL (April 1994).
3 MT. Eismann, et al., "Target Detection in Desert Backgrounds: Infrared Hyperspectral Measurements andAnalysis", Proc. SPIE, 2561, San Diego, CA (July 1995).
4 C.R. Schwartz, et al., "Thermal Multispectral Detection of Military Vehicles in Vegetated and DesertEnvironments", Proc. SPIE, 2742-30, Orlando, FL (April 1996).
5 Cedip Corp., France, private communication.6 N.S. Gluck, R.B. Bailey, R. de la Rosa, and R.L. Hall, "Two-color imaging by the use of patterned optical filters
bonded to focal-plane-array detectors", Appi. Opt., 35, 5520 (1996).7 C. Gittins and W. Marinelli, "AIRIS multispectral imaging chemical sensor", Proc. SPIE, 3383, 65-74, (1998).8 Born, M., Wolf, E. Principle of Optics, 5th edition, Pergamon Press, New York, pp. 323-333 (1975).
115