Tuna Resources1 - hubrural.org fileTuna Resources – de Leiva and Majkowski - Text 2 Mostly on the...
59
Tuna Resources – de Leiva and Majkowski - Text 1 Tuna Resources 1 JUAN IGNACIO DE LEIVA MORENO ([email protected] ) & JACEK MAJKOWSKI ([email protected] ) Marine Resources Service (FIRM) Fishery Resources Division (FIR) Fisheries Department (FI) Food and Agriculture Organization of the United Nations (FAO) Viale delle Terme di Caracalla 00100 Rome, Italy Abstract Tuna and tuna-like species are very important economically, and a significant source of food. Albacore, bigeye , Atlantic bluefin, Pacific bluefin, skipjack, southern bluefin and yellowfin are frequently referred to as the principal market tuna species. In 2002 their catch was approximately 4 million t, which represents almost 65% of the total catch of all the tunas and tuna-like species. The objective of this paper is to provide information on the status of 23 stocks of the principal market tuna species. This information was obtained mostly from publications and web sites, but also from direct communications with the tuna fishery bodies and other organizations significantly involved in research on tunas.
Transcript of Tuna Resources1 - hubrural.org fileTuna Resources – de Leiva and Majkowski - Text 2 Mostly on the...

Tuna Resources – de Leiva and Majkowski - Text
1
Tuna Resources1
JUAN IGNACIO DE LEIVA MORENO ([email protected])
&
JACEK MAJKOWSKI ([email protected])
Marine Resources Service (FIRM)
Fishery Resources Division (FIR)
Fisheries Department (FI)
Food and Agriculture Organization of the United Nations (FAO)
Viale delle Terme di Caracalla
00100 Rome, Italy
Abstract
Tuna and tuna-like species are very important economically, and a significant source of food.
Albacore, bigeye , Atlantic bluefin, Pacific bluefin, skipjack, southern bluefin and yellowfin
are frequently referred to as the principal market tuna species. In 2002 their catch was
approximately 4 million t, which represents almost 65% of the total catch of all the tunas and
tuna-like species.
The objective of this paper is to provide information on the status of 23 stocks of the principal
market tuna species. This information was obtained mostly from publications and web sites,
but also from direct communications with the tuna fishery bodies and other organizations
significantly involved in research on tunas.

Tuna Resources – de Leiva and Majkowski - Text
2
Mostly on the basis of reference points, the sizes and the fishing mortalities of the tuna stocks
were classified into the following categories to summarize their status on the global scale in a
simple way:
? Stock size: above its reference point, near its reference point, below its reference point,
unknown.
? Fishing mortality: below its reference point, near its reference point, above its reference
point, unknown.
If we consider only stock size, 7 of the 13 stocks of tropical tunas are regarded to be within
their safe limits (above or near their reference points). Only 3 out of 10 stocks of temperate
tunas are considered to be safe.
If we consider only fishing mortality, the situation is quite similar. The present fishing
mortality of only 3 of the tropical stocks cannot be regarded as sustainable. For temperate
stocks the corresponding number is 6.
Little, if anything, is known about the stock sizes and fishing mortalities of 8 of the 23 stocks.
This proportion is slightly higher for the tropical stocks than for the temperate stocks. There is
significant uncertainty for 4 other stocks, and if these are combined with the first 8 stocks it
can be said that information for more than half the stocks is considerably less than adequate.
The status of the tuna stocks was presented across a bivariate system of references related to
the stock size and fishing mortality. 7 stocks could be considered to be within safe limits from
the conservation perspective. For another 8 stocks, the fishing mortality should be reduced, the
stock size increased, or both, if they are to be brought to within safe limits.

Tuna Resources – de Leiva and Majkowski - Text
3
Future large increases in the catches of the principal market tunas are neither expected nor
recommended. In fact, the catches of the stocks that are fully exploited or overexploited may
decline in a long-term unless they are properly managed. There are only 4 stocks for which
there are indications that there is still potential for increases in their catches. For skipjack,
these increases should be accomplished in a way that would not lead to increases in the
catches of stocks of other species, such as bigeye and yellowfin, which are currently fully
exploited or overexploited. That would require development of methods to catch skipjack, but
avoid small bigeye and yellowfin.

Tuna Resources – de Leiva and Majkowski - Text
4
Abbreviations
ALB - Albacore
AMSY - Average Maximum Sustainable Yield
AO - Atlantic Ocean
BET - Bigeye tuna
BFT - Atlantic bluefin tuna
BAMSY - Biomass at AMSY
BMSY - Biomass at MSY
CCSBT - Commission for the Conservation of Southern Bluefin Tuna
EAO - Eastern Atlantic Ocean
EPO - Eastern Pacific Ocean
F - Fishing mortality
FAMSY - Fishing mortality at AMSY
FMSY - Fishing mortality at MSY
FAD - Fish-Aggregating Device
FAO - Food and Agriculture Organization of the United Nations
FIGIS - FAO’s Fisheries Global Information System
IATTC - Inter-American Tropical Tuna Commission
ICCAT - International Commission for the Conservation of Atlantic Tunas
IO - Indian Ocean
IOTC - Indian Ocean Tuna Commission
ISC - Interim Scientific Committee for Tuna and Tuna-like Species in the North Pacific
Ocean
LL - Longline
MED - Mediterranean Sea
MSY - Maximum Sustainable Yield
NAO - North Atlantic Ocean
NPO - North Pacific Ocean
PBF - Pacific bluefin tuna
Tuna Resources – de Leiva and Majkowski - Text
5
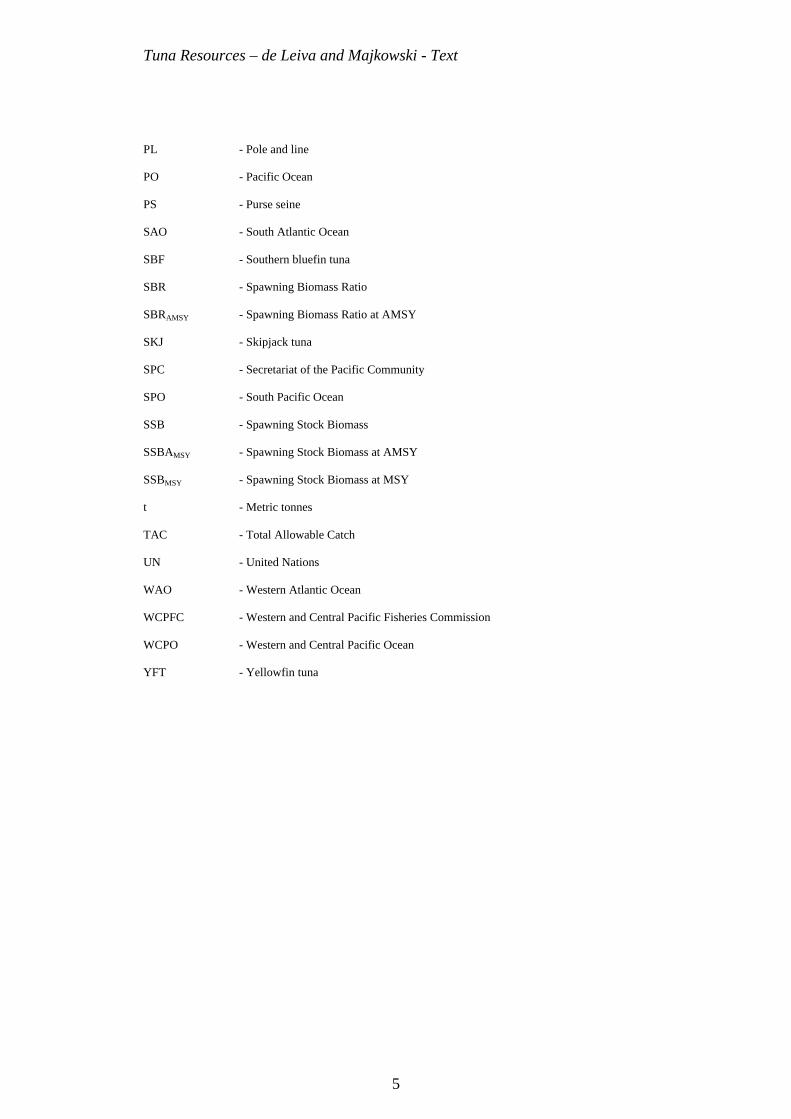
PL - Pole and line
PO - Pacific Ocean
PS - Purse seine
SAO - South Atlantic Ocean
SBF - Southern bluefin tuna
SBR - Spawning Biomass Ratio
SBRAMSY - Spawning Biomass Ratio at AMSY
SKJ - Skipjack tuna
SPC - Secretariat of the Pacific Community
SPO - South Pacific Ocean
SSB - Spawning Stock Biomass
SSBAMSY - Spawning Stock Biomass at AMSY
SSBMSY - Spawning Stock Biomass at MSY
t - Metric tonnes
TAC - Total Allowable Catch
UN - United Nations
WAO - Western Atlantic Ocean
WCPFC - Western and Central Pacific Fisheries Commission
WCPO - Western and Central Pacific Ocean
YFT - Yellowfin tuna

Tuna Resources – de Leiva and Majkowski - Text
6
Introduction
The subfamily Scombrinae includes the tunas, bonitos, mackerels, seerfishes, and billfishes
(Klawe, 1977; Collette and Nauen, 1983; Nakamura, 1985; Collette, 1999). These are among
the largest and fastest fishes in the sea.
The tribe Thunnini, consisting of the genera Thunnus, Euthynnus, Katsuwonus, Auxis and
Allothunnus, and a total of 15 species, includes the most economically important species,
referred to as the principal market tunas because of their global economic importance and the
extensive international trade in them for canning and for sashimi.
The principal market tunas are albacore (ALB, Thunnus alalunga), bigeye tuna (BET, T.
obesus), Atlantic bluefin tuna (BFT, T. thynnus), Pacific bluefin tuna (PBF, T. orientalis),
southern bluefin tuna (SBF, T. maccoyii), yellowfin tuna (YFT, T. albacares) and skipjack
tuna (SKJ, Katsuwonus pelamis). They occur in all oceans (see the Stock Structure section),
and are capable of long migrations or movements.
To manage tuna fisheries, the following tuna fishery bodies have been created:
? Commission for the Conservation of Southern Bluefin Tuna (CCSBT), Canberra,
Australia (http://www.ccsbt.org),
? Indian Ocean Tuna Commission (IOTC), Victoria, Seychelles
(http://www.seychelles.net/iotc),
? Inter-American Tropical Tuna Commission (IATTC), La Jolla, USA
(http://www.iattc.org),
? International Commission for the Conservation of Atlantic Tunas (ICCAT), Madrid,
Spain (http://www.iccat.es), and
? Western and Central Pacific Fisheries Commission (WCPFC), Ponepei, Federated
States of Micronesia (http://www.ocean-affairs.com).

Tuna Resources – de Leiva and Majkowski - Text
7
In addition the following organizations:
? Interim Scientific Committee for Tuna and Tuna-like Species in the North Pacific
Ocean (ISC, Shimizu, Japan, http://isc.ac.affrc.go.jp/home.html) and
? Secretariat of the Pacific Community (SPC, Noumea, New Caledonia,
http://www.spc.int)
also carry out or facilitate in the assessment of tuna stocks in the North Pacific and South
Pacific respectively, but they do not manage them.
The principal market tunas are commonly classified as tropical and temperate species. In this
paper, SKJ, YFT and BET are considered to be tropical species, and ALB, BFT, PBF and SBF
to be temperate species. The principal market tunas are divided into 23 stocks, based on their
treatment for stock assessment purposes by the CCSBT, IATTC, ICCAT, IOTC, ISC and
SPC. There are one, two or three stocks of ALB, BET, SKJ and YFT in each ocean, and these
represent effective management units. BFT and PBF are each restricted to a single ocean, and
SBF consists of a single stock occurring in the Atlantic, Indian, and Pacific Oceans.
Further information on tunas and their fisheries, trade and management on the global scale can
be found in Allen (2002), Catarci (in press), Joseph (in press), Joseph (2003), Majkowski
(1997, 2004), Miyake et al. (2004) and Miyake (in press).
The objective of this paper is to provide information on the status of tuna stocks on the global
scale. The information in this paper was collated for FAO’s Project on the Management of
Tuna Fishing Capacity, particularly for consideration at the 2nd Meeting of its Technical
Advisory Committee (TAC), which was held in Madrid on 15-18 March 2004 (Anonymous, in
press).
Tuna Resources – de Leiva and Majkowski - Text
8
Information Sources and Methods
Information on the annual tuna catches in this paper is taken from the data base constructed
for its public release through FAO’s Fisheries Global Information System (FIGIS)2. 2002 was
the last year for which the data were available at the time of preparing this paper. Particularly,
for this year the data may be reviewed in the future. The institutions from which these data
were obtained are the CCSBT (December 2003), IATTC (November 2003), ICCAT (February
2004), IOTC (December 2003), ISC (December 2003) and SPC (November 2003). The dates
in brackets indicate when the data were obtained. We provide data on the catches by longline,
trolling, pole-and–line, purse-seine and “other” gears. Catches for which the gears are
unknown are also included into the “other” category.
The maps in this paper were generated from another data base constructed for its public
release through FAO’s Fisheries Global Information System (FIGIS)3. The organizations from
which these data have been obtained are the Australian Fisheries Management Authority
(AFMA, http://www.afma.gov.au, June 2003), IATTC (August 2002), ICCAT (February
2003), IOTC (May 2003), the U.S. National Marine Fisheries Service (NMFS,
http://www.nmfs.noaa.gov, October 2002) and SPC (June 2003). Further information on the
data available from FIGIS at the time of preparing this paper can be obtained from Carocci et
al., in press.
The information on the structure and status of the stocks and the outlook for future catches
was obtained mostly from publications and the web sites of the tuna fishery bodies, ISC and
SPC, and from direct communications with some of them. The exception is the classification
of stock size of and fishing mortality for each stock into categories defined later in this
section. All this information applies to the beginning of 2004.

Tuna Resources – de Leiva and Majkowski - Text
9
The information compiled by us on the structure and status of the stocks and the outlook for
their catches is uncertain and that this uncertainty varies among the stocks. These uncertainties
are the result of deficiencies in the data and the methods applied to analyze the data, but it is
very difficult to realistically evaluate these uncertainties.
Various reference points for the fishing mortality and the stock size are used by tuna fishery
bodies, ISC and SPC. They include FMSY, FAMSY, Fmax, F30%, F40%, SSBMSY, BMSY, SBR (see the
abbreviations section), ratio of exploited to unexploited total biomass and slight modifications
of the last reference point. In some cases, however, only qualitative information on the fishing
mortality and the stock size is available (for example “the fishing mortality is low to
moderate”).
To summarize the status of stocks on the global scale in a simple way, on the basis of the
information mentioned in the previous paragraphs, particularly the reference points, the sizes
of and the fishing mortality for each tuna stock were classified into the following categories.
? Stock size: above its reference point, near its reference point, below its reference
point, unknown.
? Fishing mortality: below its reference point, near its reference point, above its
reference point, unknown.
In cases for which the information on the stock status has been considered as substantially
uncertain, the term “possibly” was added in front of categories (e.g. possibly above its
reference point). The stock size and fishing mortality “near its reference point”, depends on
the age-composition of the catches, which is determined by the current combination of fishing
gears and their current patterns of fishing.
When only qualitative information is available (i.e. BFT-EAO, BFT-WAO, ALB-SPO, PBF-
PO, SKJ-WCPO, YFT-WCPO and SBF (see the abbreviations section)), the assignment of

Tuna Resources – de Leiva and Majkowski - Text
10
categories to the stock size and fishing mortality requires intuitive and subjective judgment. If
the current fishing mortality or stock size is close to a reference point, also some subjectivity
is involved into classifying them as “near its reference point”. Due to significant uncertainties
associated with the fishing mortality for ALB-NAO and SBF, we have created an “in-
between” category (“near to above its reference point”).

Tuna Resources – de Leiva and Majkowski - Text
11
Stock Structure
Albacore (ALB)
In the Atlantic Ocean and for the stock assessment purposes, the existence of three stocks is
assumed (northern and southern Atlantic stocks (separated at 5º N) and a Mediterranean
stock). A single stock of ALB is assumed to occur in the Indian Ocean. There are two ALB
stocks in the Pacific Ocean, one in the northern hemisphere and the other in the southern
hemisphere. The South Pacific stock appears to be homogeneous, but there seem to be two
subgroups of the North Pacific stock.
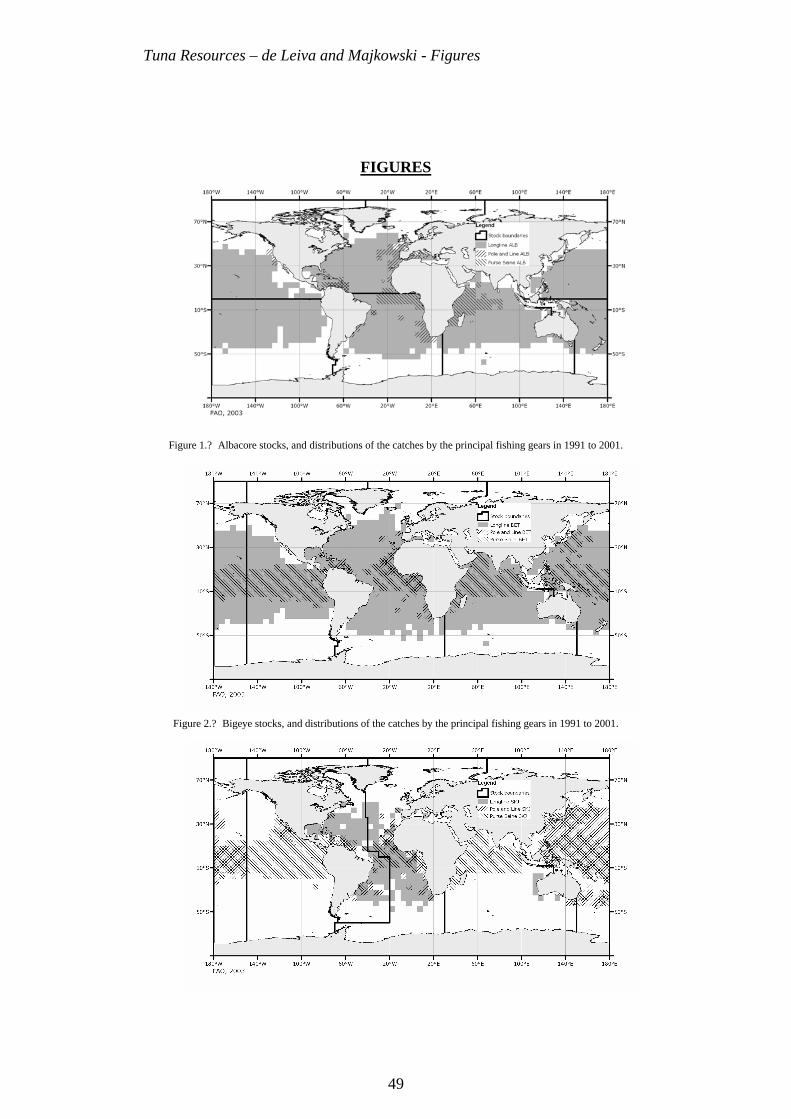
Figure 1.? Albacore stocks, and distributions of the catches by the principal fishing gears in 1991 to 2001.
Bigeye (BET)
BET are distributed over almost the entire Atlantic Ocean between 50°N and 45°S. It is
assumed that there is a single stock in the Atlantic Ocean, but the possibility of other
scenarios, such as northern and southern stocks, should not be disregarded. A single stock of
BET is assumed to occur in the Indian Ocean.
In the Pacific Ocean, BET are distributed continuously from the Americas to Asia between
40°N and 40°S. In the absence of adequate information on the stock structure of BET in the
Pacific Ocean, it has been assumed that there are two stocks (one in the eastern Pacific and the
other in the western and central Pacific). However, scientists of the IATTC and the SPC have
also performed assessments based on the assumption that there is a single stock of BET in the
Pacific Ocean.
Figure 2.? Bigeye stocks, and distributions of the catches by the principal fishing gears in 1991 to 2001.
Tuna Resources – de Leiva and Majkowski - Text
12
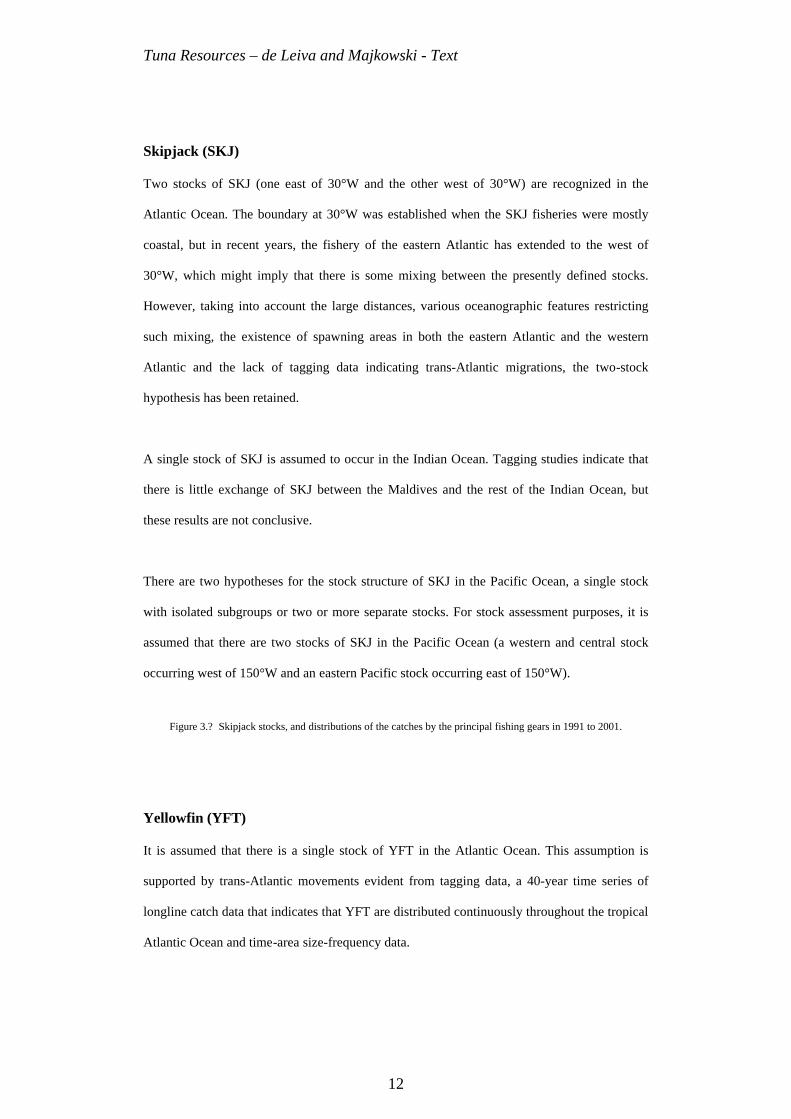
Skipjack (SKJ)
Two stocks of SKJ (one east of 30°W and the other west of 30°W) are recognized in the
Atlantic Ocean. The boundary at 30°W was established when the SKJ fisheries were mostly
coastal, but in recent years, the fishery of the eastern Atlantic has extended to the west of
30°W, which might imply that there is some mixing between the presently defined stocks.
However, taking into account the large distances, various oceanographic features restricting
such mixing, the existence of spawning areas in both the eastern Atlantic and the western
Atlantic and the lack of tagging data indicating trans-Atlantic migrations, the two-stock
hypothesis has been retained.
A single stock of SKJ is assumed to occur in the Indian Ocean. Tagging studies indicate that
there is little exchange of SKJ between the Maldives and the rest of the Indian Ocean, but
these results are not conclusive.
There are two hypotheses for the stock structure of SKJ in the Pacific Ocean, a single stock
with isolated subgroups or two or more separate stocks. For stock assessment purposes, it is
assumed that there are two stocks of SKJ in the Pacific Ocean (a western and central stock
occurring west of 150°W and an eastern Pacific stock occurring east of 150°W).
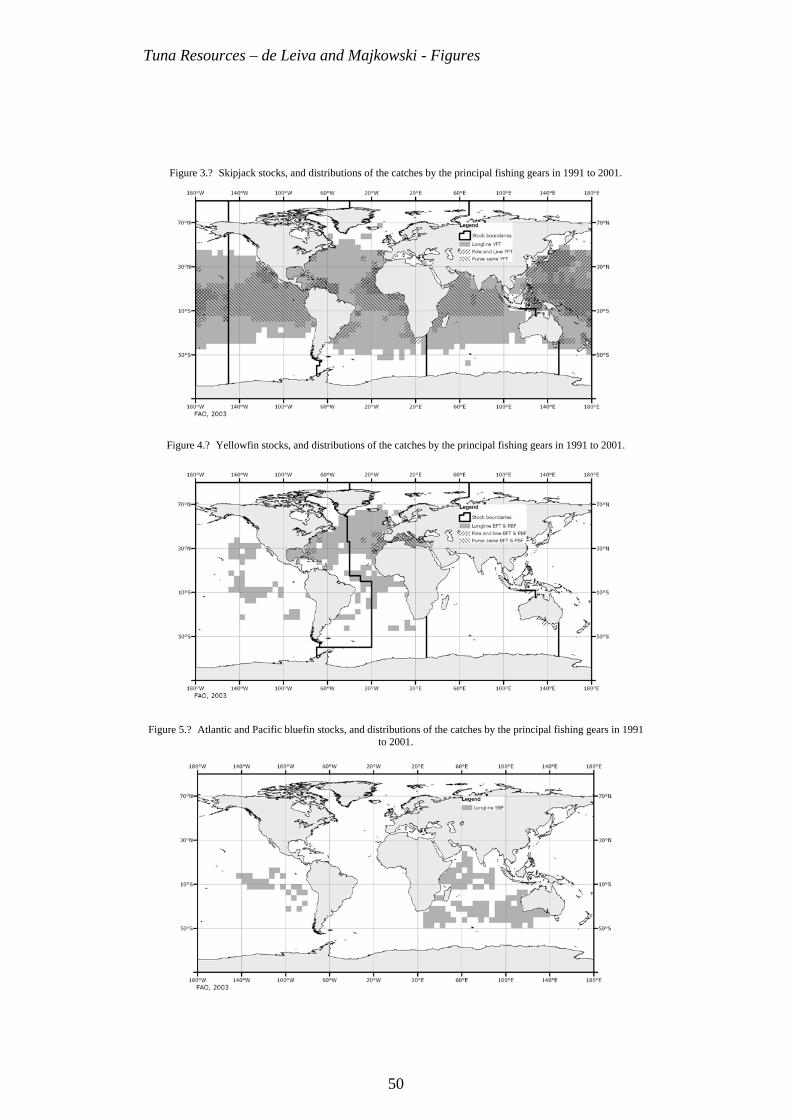
Figure 3.? Skipjack stocks, and distributions of the catches by the principal fishing gears in 1991 to 2001.
Yellowfin (YFT)
It is assumed that there is a single stock of YFT in the Atlantic Ocean. This assumption is
supported by trans-Atlantic movements evident from tagging data, a 40-year time series of
longline catch data that indicates that YFT are distributed continuously throughout the tropical
Atlantic Ocean and time-area size-frequency data.

Tuna Resources – de Leiva and Majkowski - Text
13
The stock structure of YFT in the Indian Ocean is uncertain, but it is assumed for stock
assessment purposes that there is a single stock. Longline catch data indicate that YFT are
distributed continuously throughout the tropical Indian Ocean, but there are indications, from
more detailed analyses of fisheries data, that the stock structure is more complex.
The exchange of YFT between the eastern Pacific Ocean and the western and central Pacific
Ocean has been studied by examination of data from tagging, morphometric characteristics of
the fish, catch-per-unit-of-effort data, sizes of fish caught, etc. The mixing of fish between the
eastern Pacific and the western and central Pacific is not extensive, so, for purposes of stock
assessment, it has been assumed that there are two stocks, separated at 150° W longitude.
Figure 4.? Yellowfin stocks, and distributions of the catches by the principal fishing gears in 1991 to 2001.
Atlantic bluefin (BFT) and Pacific bluefin (PBF)
ICCAT established two management units for BFT in 1982. This decision was based on
discontinuities in the distributions of the catches at that time and on the assumption that
mixing of western and eastern BFT was limited. The two management units are separated at
45° W north of 10° N and at 25° W south of the equator, with an eastward shift in the boundary
between those parallels. Later, however, it appeared that the distribution of catches across the
North Atlantic is nearly continuous. Also, evidence has accumulated that there is more mixing
between the two units than previously thought, so research on the stock structure (including
modeling) has continued.
It has been assumed that there is a single stock of PBF in the Pacific Ocean. Tagging studies
have shown that there is considerable exchange of fish between the eastern Pacific and the
western and central Pacific.

Tuna Resources – de Leiva and Majkowski - Text
14
Figure 5.? Atlantic and Pacific bluefin stocks, and distributions of the catches by the principal fishing gears in 1991
to 2001.
Southern bluefin (SBF)
SBF are found throughout the southern hemisphere, mainly in waters between 30° and 50°S,
but only rarely in the Atlantic Ocean and the eastern Pacific Ocean. As SBF spawn in only one
area (south of Java, Indonesia), they are managed as a single stock.
Figure 6.? Southern bluefin stock, and distributions of the catches by the principal fishing gears in 1991 to 2001.
Tuna Resources – de Leiva and Majkowski - Text
15
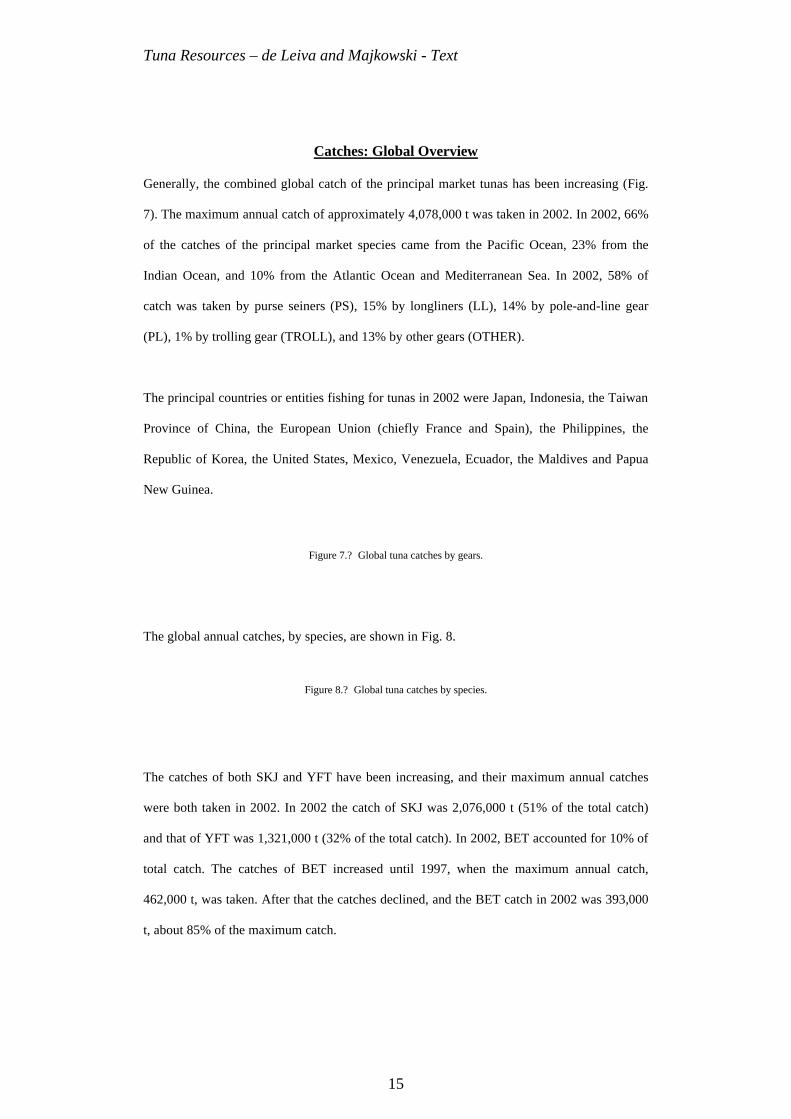
Catches: Global Overview
Generally, the combined global catch of the principal market tunas has been increasing (Fig.
7). The maximum annual catch of approximately 4,078,000 t was taken in 2002. In 2002, 66%
of the catches of the principal market species came from the Pacific Ocean, 23% from the
Indian Ocean, and 10% from the Atlantic Ocean and Mediterranean Sea. In 2002, 58% of
catch was taken by purse seiners (PS), 15% by longliners (LL), 14% by pole-and-line gear
(PL), 1% by trolling gear (TROLL), and 13% by other gears (OTHER).
The principal countries or entities fishing for tunas in 2002 were Japan, Indonesia, the Taiwan
Province of China, the European Union (chiefly France and Spain), the Philippines, the
Republic of Korea, the United States, Mexico, Venezuela, Ecuador, the Maldives and Papua
New Guinea.
Figure 7.? Global tuna catches by gears.
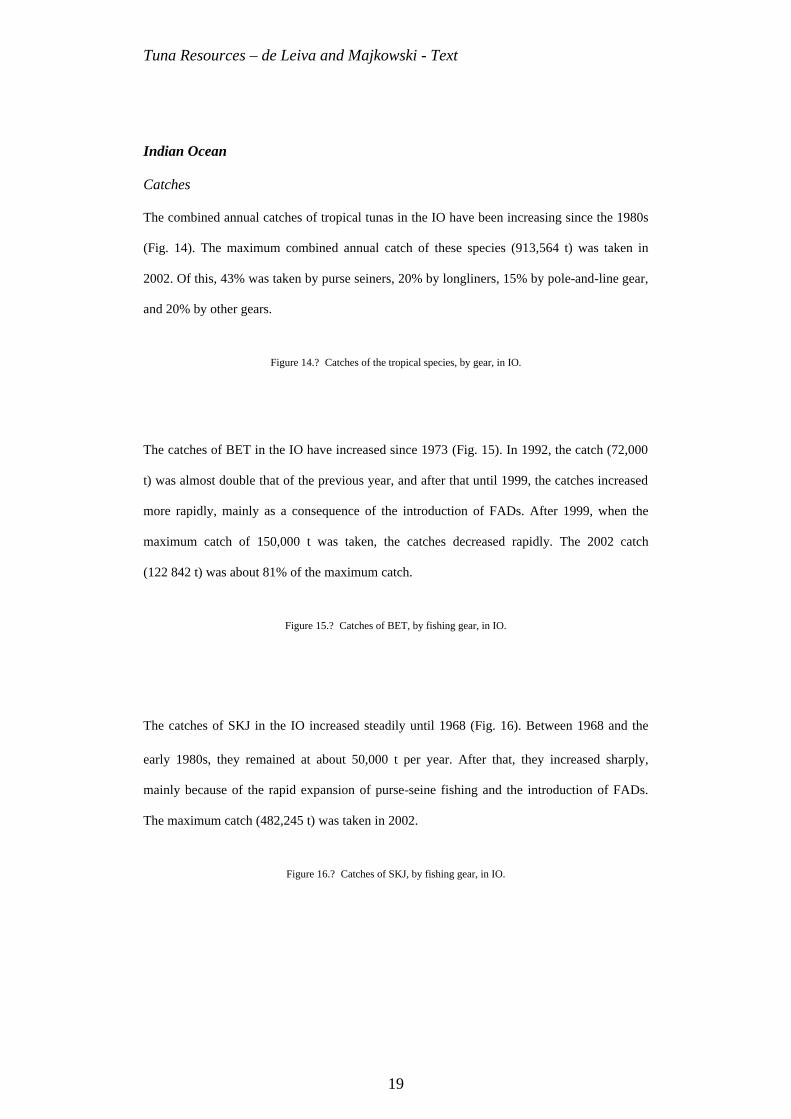
The global annual catches, by species, are shown in Fig. 8.
Figure 8.? Global tuna catches by species.
The catches of both SKJ and YFT have been increasing, and their maximum annual catches
were both taken in 2002. In 2002 the catch of SKJ was 2,076,000 t (51% of the total catch)
and that of YFT was 1,321,000 t (32% of the total catch). In 2002, BET accounted for 10% of
total catch. The catches of BET increased until 1997, when the maximum annual catch,
462,000 t, was taken. After that the catches declined, and the BET catch in 2002 was 393,000
t, about 85% of the maximum catch.

Tuna Resources – de Leiva and Majkowski - Text
16
In 2002, ALB accounted for 6% of total catch. The ALB catches were approximately constant
from the mid-1960s to the late 1990s. The maximum annual catch of ALB, 265,000 t, was
taken in 1999. In 2002, 235,000 t of ALB were caught (89% of the 1999 catch). The estimate
for the 2002 catch of ALB should be interpreted with caution, however, since the catch data
for the North Pacific are still preliminary.
The catches of BFT, PBF and SBF have been stable or decreasing, at much lower levels than
those of the other principal tunas. The maximum annual catch of BFT, 53,200 t, was taken in
1996. The 2002 catch (36,300 t) was 68% of 1996 catch.
The maximum annual catch of PBF (32,700 t) was taken in 1981. The 2002 catch (15,600 t)
was 48% of the 1981 catch. However, as is the case for ALB, the 2002 catch data are
preliminary.
The maximum annual catch of SBF (81,600 t) was taken in 1961. After that, the catches
declined precipitously until 1990. During 1990-2001, the catches fluctuated between 13,500
and 19,500 t. The 2002 catch (16,000 t) was approximately 20% of the maximum annual
catch.
The combined catches of BFT, PBF and SBF account for only slightly more than 1% of the
total catches of the principal market species.

Tuna Resources – de Leiva and Majkowski - Text
17
Catches and Resource Status: Stock by Stock
Tropical Tunas
Atlantic Ocean
Catches
The maximum combined annual catch of tropical tunas in the AO (462,109 t) was taken in
1994 (Fig. 9). Since then, with some fluctuations, the catches have been decreasing, and in
2002, the catch was 324,923 (70% of that obtained in 1994). In 2002, most of the catches of
tropical tunas in the AO were taken by purse-seine (56%), pole-and-line (23%) and longline
(19%) gear.
Figure 9.? Catches of the tropical species, by gear, in AO.
The catches of BET in the AO increased, with some fluctuations, from 1950 to 1994, when the
maximum catch of 129,506 t was taken (Fig. 10). From 1994 to 1999, the catches fluctuated
between 100,000 and 120,000 t. Since then the catches of BET have sharply decreased. The
2002 catch (73,110 t) was approximately 56% of the maximum catch.
Figure 10.? Catches of BET, by fishing gear, in AO.
The catches of SKJ in the EAO (including the MED) increased until 1974 (Fig. 11). From
1974 to 1990, the catches fluctuated widely. In 1991, with the introduction of FADs, the
catches increased sharply, attaining a maximum of 169,771 t in 1991. Since then the catches
have declined to the level of those taken prior to the introduction of FADs. The 2002 catch
(92,945 t) was about 55% of the maximum catch.
Figure 11.? Catches of SKJ, by fishing gear, in EAO.

Tuna Resources – de Leiva and Majkowski - Text
18
The catches of SKJ in the WAO were at low levels until 1979 (Fig. 12). From 1979 to 1985
(the year in which the maximum catch of 40,272 t was taken) the catches increased by six-
fold. Then, they decreased sharply, and since 1988 the catches have fluctuated between 24,000
and 33,000 t. The 2002 catch (21,428 t) the lowest catch since 1981, was about 53% of the
maximum catch.
Figure 12.? Catches of SKJ, by fishing gear, in WAO.
The catches of YFT in the AO increased steadily from 1950 to 1984 (Fig. 13). After that, the
catches fluctuated, without a clear trend, until 1990, when the maximum catch of 192,456 t
was taken. The catches have decreased since 1990. The 2002 catch was approximately
140,000 t, about 71% of the maximum catch.
Figure 13.? Catches of YFT, by fishing gear, in AO.
Stock Status
Table 1.? Summary information on the stock status and outlook of tropical tuna stocks in the
Atlantic Ocean.
Table 1.? Continued.
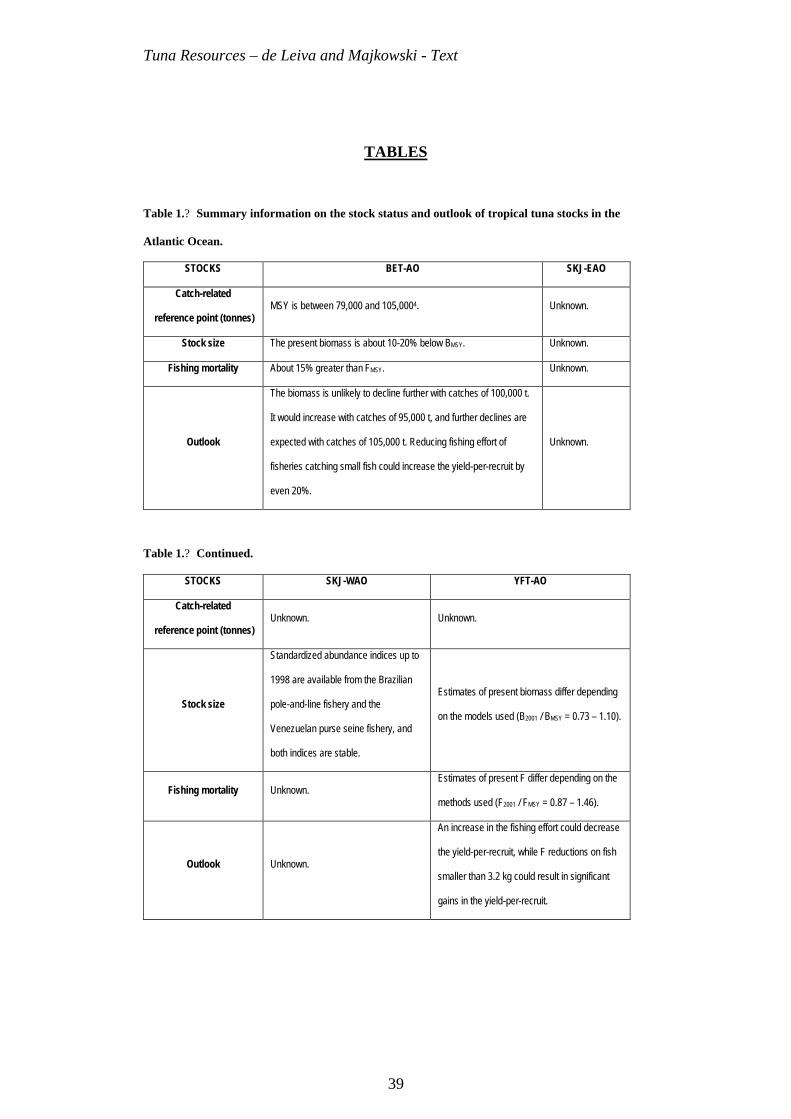
Based on the information from Table 1, the stock size of BET-AO is below its reference point
and the fishing mortality is above its reference point. Reliable information on the stock size
and fishing mortality is missing for two of the four stocks (SKJ-EAO and SKJ-WAO). For
YFT-AO, both the stock size and fishing mortality are near its reference points.
Tuna Resources – de Leiva and Majkowski - Text
19
Indian Ocean
Catches
The combined annual catches of tropical tunas in the IO have been increasing since the 1980s
(Fig. 14). The maximum combined annual catch of these species (913,564 t) was taken in
2002. Of this, 43% was taken by purse seiners, 20% by longliners, 15% by pole-and-line gear,
and 20% by other gears.
Figure 14.? Catches of the tropical species, by gear, in IO.
The catches of BET in the IO have increased since 1973 (Fig. 15). In 1992, the catch (72,000
t) was almost double that of the previous year, and after that until 1999, the catches increased
more rapidly, mainly as a consequence of the introduction of FADs. After 1999, when the
maximum catch of 150,000 t was taken, the catches decreased rapidly. The 2002 catch
(122 842 t) was about 81% of the maximum catch.
Figure 15.? Catches of BET, by fishing gear, in IO.
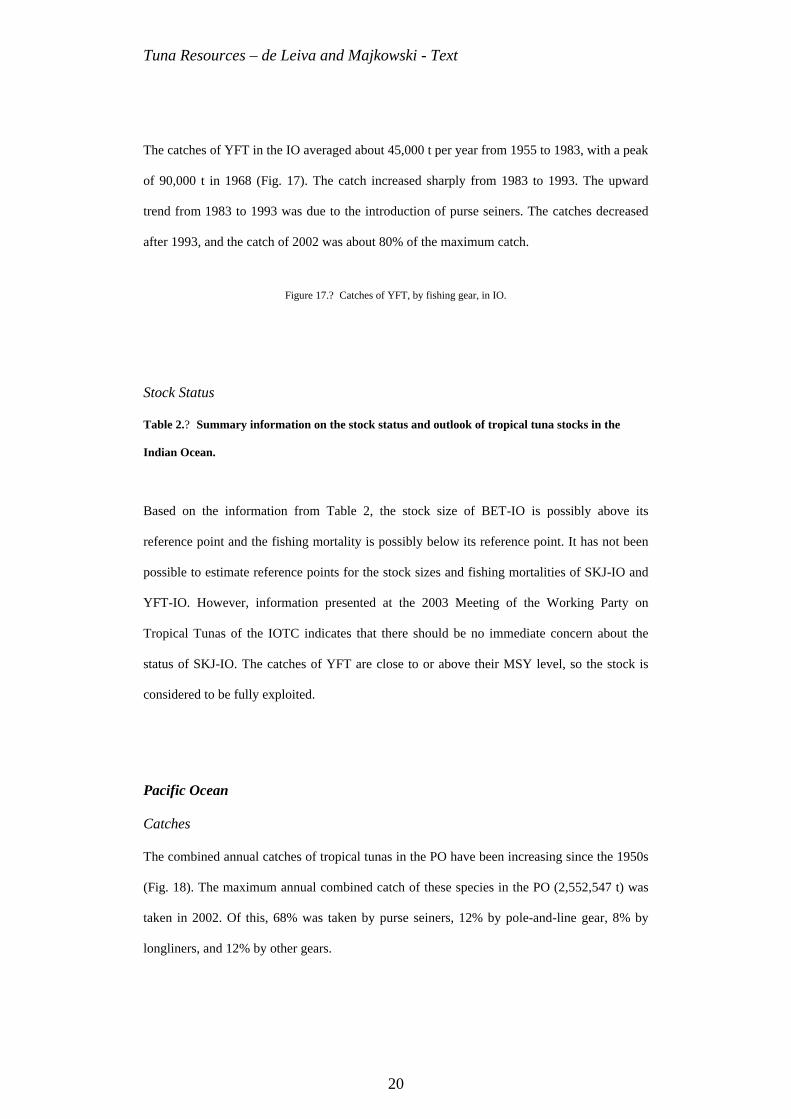
The catches of SKJ in the IO increased steadily until 1968 (Fig. 16). Between 1968 and the
early 1980s, they remained at about 50,000 t per year. After that, they increased sharply,
mainly because of the rapid expansion of purse-seine fishing and the introduction of FADs.
The maximum catch (482,245 t) was taken in 2002.
Figure 16.? Catches of SKJ, by fishing gear, in IO.
Tuna Resources – de Leiva and Majkowski - Text
20
The catches of YFT in the IO averaged about 45,000 t per year from 1955 to 1983, with a peak
of 90,000 t in 1968 (Fig. 17). The catch increased sharply from 1983 to 1993. The upward
trend from 1983 to 1993 was due to the introduction of purse seiners. The catches decreased
after 1993, and the catch of 2002 was about 80% of the maximum catch.
Figure 17.? Catches of YFT, by fishing gear, in IO.
Stock Status
Table 2.? Summary information on the stock status and outlook of tropical tuna stocks in the
Indian Ocean.
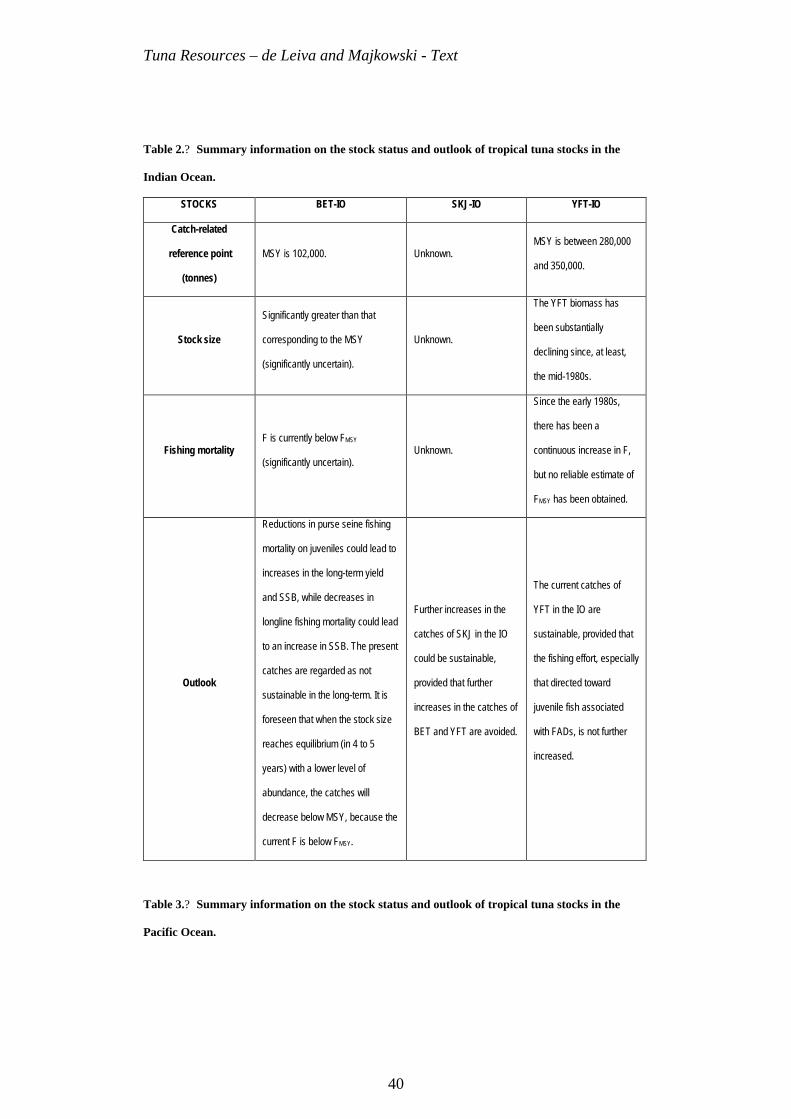
Based on the information from Table 2, the stock size of BET-IO is possibly above its
reference point and the fishing mortality is possibly below its reference point. It has not been
possible to estimate reference points for the stock sizes and fishing mortalities of SKJ-IO and
YFT-IO. However, information presented at the 2003 Meeting of the Working Party on
Tropical Tunas of the IOTC indicates that there should be no immediate concern about the
status of SKJ-IO. The catches of YFT are close to or above their MSY level, so the stock is
considered to be fully exploited.
Pacific Ocean
Catches
The combined annual catches of tropical tunas in the PO have been increasing since the 1950s
(Fig. 18). The maximum annual combined catch of these species in the PO (2,552,547 t) was
taken in 2002. Of this, 68% was taken by purse seiners, 12% by pole-and-line gear, 8% by
longliners, and 12% by other gears.

Tuna Resources – de Leiva and Majkowski - Text
21
Figure 18.? Catches of the tropical species, by gear, in PO.
The catches of BET in the EPO increased until 1978, showing quite wide fluctuations (Fig.
19). After a period of decreasing catches from 1978 to 1984, the catches almost doubled
during the next two years, exceeding 100,000 t in 1986. Since then the catches have fluctuated
widely, without a clear trend. The 2002 catch, 73,000 t, was about 67% of the maximum catch
of 110,000 t in 2000.
Figure 19.? Catches of BET, by fishing gear, in EPO.
The catches of BET in the WCPO averaged 35,000 t until 1974, after which they increased
considerably, reaching a maximum of more than 124,000 t in 2002 (Fig. 20).
Figure 20.? Catches of BET, by fishing gear, in WCPO.
SKJ catches have been fluctuating without a clear trend until 1994, when they increased
largely (Fig. 21). Since 1999, the catches of SKJ have decreased, and the 2002 catch (158,911
t) is about 60% of its maximum of 265,598 t taken in 1999.
Figure 21.? Catches of SKJ, by fishing gear, in EPO.
The catches of SKJ in the WCPO increased greatly from 1950 to 2002 (Fig. 22). The upward
trend became much more pronounced during the early 1980s, when the expansion of the

Tuna Resources – de Leiva and Majkowski - Text
22
purse-seine fleet began. The average annual catch during the last decade has been more than
1,000,000 t. The maximum catch to date was taken in 2002.
Figure 22.? Catches of SKJ, by fishing gear, in WCPO.
The catches of YFT in the EPO increased from the early 1960s to 1976 (Fig. 23). The catch
rates were low during 1978 to 1983. The catches increased from 1983 to 1988, decreased from
1988 to 1994, and then increased again to a maximum of 420,000 t in 2002.
Figure 23.? Catches of YFT, by fishing gear, in EPO.
The catches of YFT in the WCPO clearly increased from 1950 to 2002 (Fig. 24). Due to the
expansion of the purse-seine fleet, this upward trend accelerated during the late 1970s, with
the exception of 1996, when the catches dropped to a relatively low level. The 2002 catch
(446,000 t) is about 89% of the maximum catch (501,000 t) taken in 1998.
Figure 24.? Cumulative catches of YFT, by fishing gear, in WCPO.
Stock Status
Table 3.? Summary information on the stock status and outlook of tropical tuna stocks in the
Pacific Ocean.
Table 3.? Continued.
The stock size of the BET-EPO and its fishing mortality (Table 3) are above their reference
points. However, it was forecast that its size will soon decrease to below its reference point.
The stock size of the BET-WCPO is possibly near its reference point and the fishing mortality
Tuna Resources – de Leiva and Majkowski - Text
23
is possibly above its reference point. No reference points were estimated for the stock size and
fishing mortality of the SKJ-EPO stock, but other general information suggests that the stock
is well within its safe limits. The stock size of the SKJ-WCPO is above its reference point and
its fishing mortality is below its reference point. The stock size of the YFT-EPO and its
fishing mortality are both near their reference points. The stock size of the YFT-WCPO is
above its reference point, and the fishing mortality is near its reference point.
Temperate Tunas
Atlantic Ocean
Catches
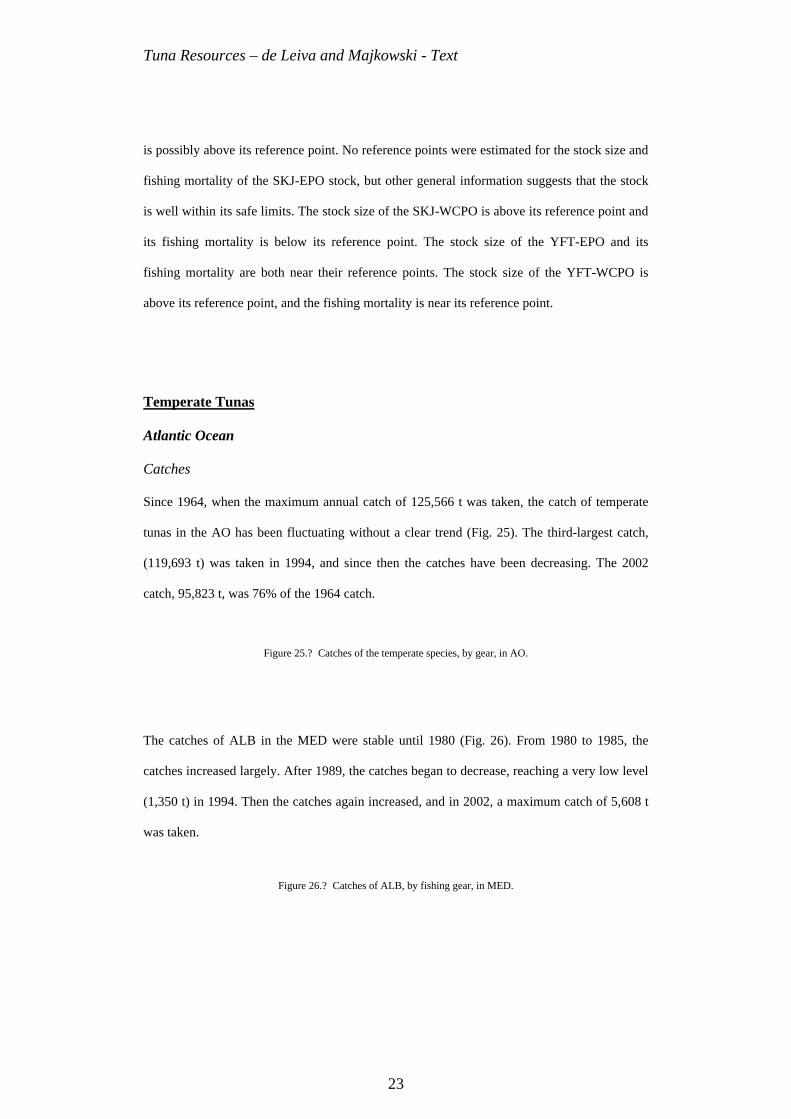
Since 1964, when the maximum annual catch of 125,566 t was taken, the catch of temperate
tunas in the AO has been fluctuating without a clear trend (Fig. 25). The third-largest catch,
(119,693 t) was taken in 1994, and since then the catches have been decreasing. The 2002
catch, 95,823 t, was 76% of the 1964 catch.
Figure 25.? Catches of the temperate species, by gear, in AO.
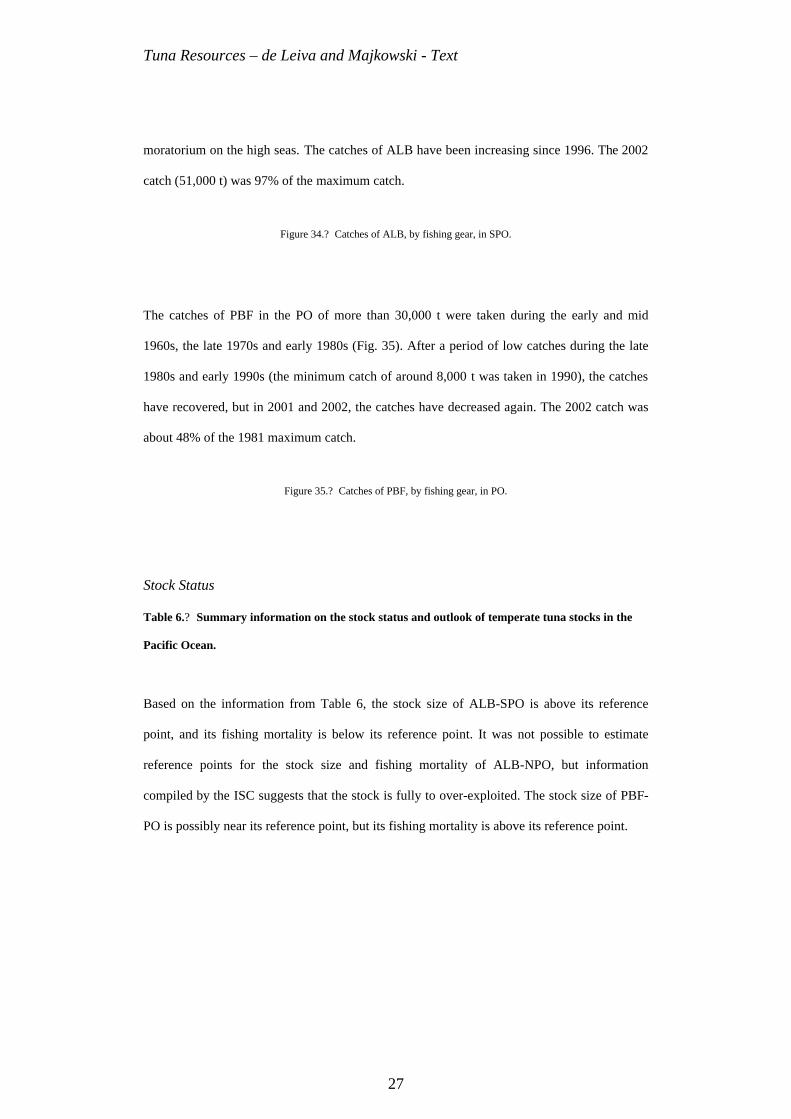
The catches of ALB in the MED were stable until 1980 (Fig. 26). From 1980 to 1985, the
catches increased largely. After 1989, the catches began to decrease, reaching a very low level
(1,350 t) in 1994. Then the catches again increased, and in 2002, a maximum catch of 5,608 t
was taken.
Figure 26.? Catches of ALB, by fishing gear, in MED.

Tuna Resources – de Leiva and Majkowski - Text
24
Until 1964, when the maximum catch of 64,354 t was taken (Fig. 27), catches of ALB in the
NAO tended to increase, although with major fluctuations. Since then, the catches have
decreased with large fluctuations. The 2002 catch of 22,500 t is the lowest on record. This
catch represents only about 35% of the maximum catch.
Figure 27.? Catches of ALB, by fishing gear, in NAO.
The total catches of ALB in the SAO increased sharply during the first years of the fishery
(Fig. 28). Since then, the ALB catches have fluctuated widely, with the minimum of 14,600 t
in 1984 and the maximum of 40,000 t in 1987, without a clear trend. The 2002 catch of 31,406
t was about 77% of the maximum catch.
Figure 28.? Catches of ALB, by fishing gear, in SAO.
The catches of BFT in the EAO (including the MED) increased from 1950 to 1955 (Fig. 29).
After that, the catches declined to the minimum of 10,458 t in 1970. The catches then
increased until 1996, when the maximum catch of 50,762 t was taken. After that, the catches
decreased to 33,093 t in 2002 (65% of the maximum catch).
Figure 29.? Catches of BFT, by fishing gear, in EAO.
The catches of BFT in the WAO increased by 20-fold from 1960 to 1964, when the maximum
catch of 18,679 t was taken (Fig. 30). The catches subsequently decreased sharply, and
oscillated between 3,200 and 6,700 t between 1968 and 1981. The catch decreased to 1,400 t
in 1982 as a result of a catch limit imposed by ICCAT. The 2002 catch (3,220 t) was about
17% of the maximum catch.

Tuna Resources – de Leiva and Majkowski - Text
25
Figure 30.? Catches of BFT, by fishing gear, in WAO.
Stock Status
Table 4.? Summary information on the stock status and outlook of temperate tuna stocks in the
Atlantic Ocean.
Table 4.? Continued.
Based on the information from Table 4, the stock size of ALB-NAO is below its reference
point, and the fishing mortality is near or above its reference point, but there are significant
uncertainties in regard to these conclusions. No information on the stock size and fishing
mortality is available for ALB-MED. The stock size of ALB-SAO is above its reference point,
and its fishing mortality is below its reference point. For both BFT-EAO and BFT-WAO, their
stock sizes are below the reference points, and their fishing mortalities are above the reference
points.
Indian Ocean
Catches
The ALB catches fluctuated between 11,000 and 31,000 t between 1962 and 1997,
without showing a clear trend (Fig. 31). Since then, the catches have been increasing.
The maximum annual catch (42,749 t) was taken in 2002.
Figure 31.? Catches of ALB, by fishing gear, in IO.
Stock Status

Tuna Resources – de Leiva and Majkowski - Text
26
Table 5.? Summary information on the stock status and outlook of temperate tuna stocks in the
Indian Ocean.
As it is shown in Table 5, there is no information about the status of ALB-IO.
Pacific Ocean
Catches
The combined annual catch of temperate tunas in the PO increased greatly from 1991 to 1999
(Fig. 32), and the maximum annual catch of 183,397 t was taken in 1999. The annual catches
have decreased since then, and 148,712 t (81% of the 1999 catch) were caught in 2002. The
estimates of the 2001 and 2002 catches are still very preliminary.
Figure 32.? Catches of the temperate species, by gear, in PO.
The catches of ALB in the NPO peaked in 1976 at 125,000 t, and then declined to 38,000 t in
1991 (Fig. 33). The catches increased later in the 1990s, and reached 120,000 t in 1999. Since
then, the catches have oscillated between about 80,000 and 90,000 t. The 2002 catch was
about 65% of the maximum catch.
Figure 33.? Catches of ALB, by fishing gear, in NPO.
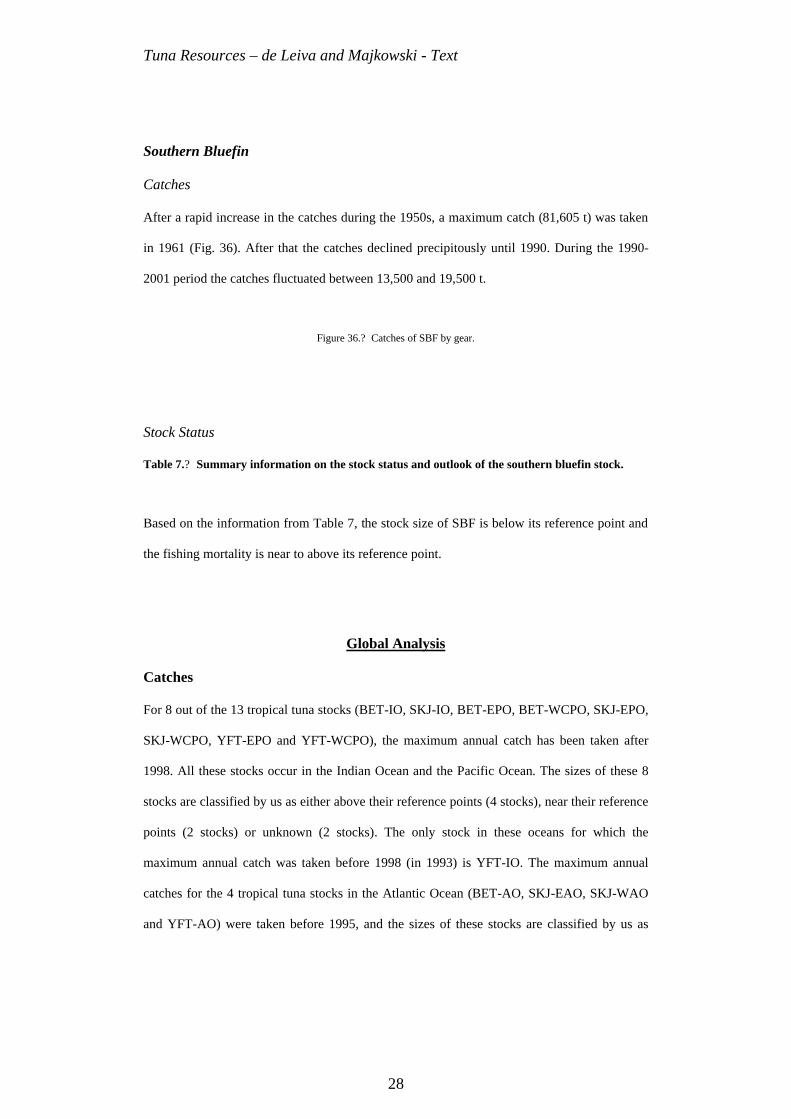
The catches of ALB in the SPO have been relatively constant since early 1960s (Fig. 34). The
maximum catch (53,000 t) was taken in 1989, mainly due to a sharp increase in catches by
drift gillnets. In 1992, the General Assembly of the UN imposed a global drift gillnets
Tuna Resources – de Leiva and Majkowski - Text
27
moratorium on the high seas. The catches of ALB have been increasing since 1996. The 2002
catch (51,000 t) was 97% of the maximum catch.
Figure 34.? Catches of ALB, by fishing gear, in SPO.
The catches of PBF in the PO of more than 30,000 t were taken during the early and mid
1960s, the late 1970s and early 1980s (Fig. 35). After a period of low catches during the late
1980s and early 1990s (the minimum catch of around 8,000 t was taken in 1990), the catches
have recovered, but in 2001 and 2002, the catches have decreased again. The 2002 catch was
about 48% of the 1981 maximum catch.
Figure 35.? Catches of PBF, by fishing gear, in PO.
Stock Status
Table 6.? Summary information on the stock status and outlook of temperate tuna stocks in the
Pacific Ocean.
Based on the information from Table 6, the stock size of ALB-SPO is above its reference
point, and its fishing mortality is below its reference point. It was not possible to estimate
reference points for the stock size and fishing mortality of ALB-NPO, but information
compiled by the ISC suggests that the stock is fully to over-exploited. The stock size of PBF-
PO is possibly near its reference point, but its fishing mortality is above its reference point.
Tuna Resources – de Leiva and Majkowski - Text
28
Southern Bluefin
Catches
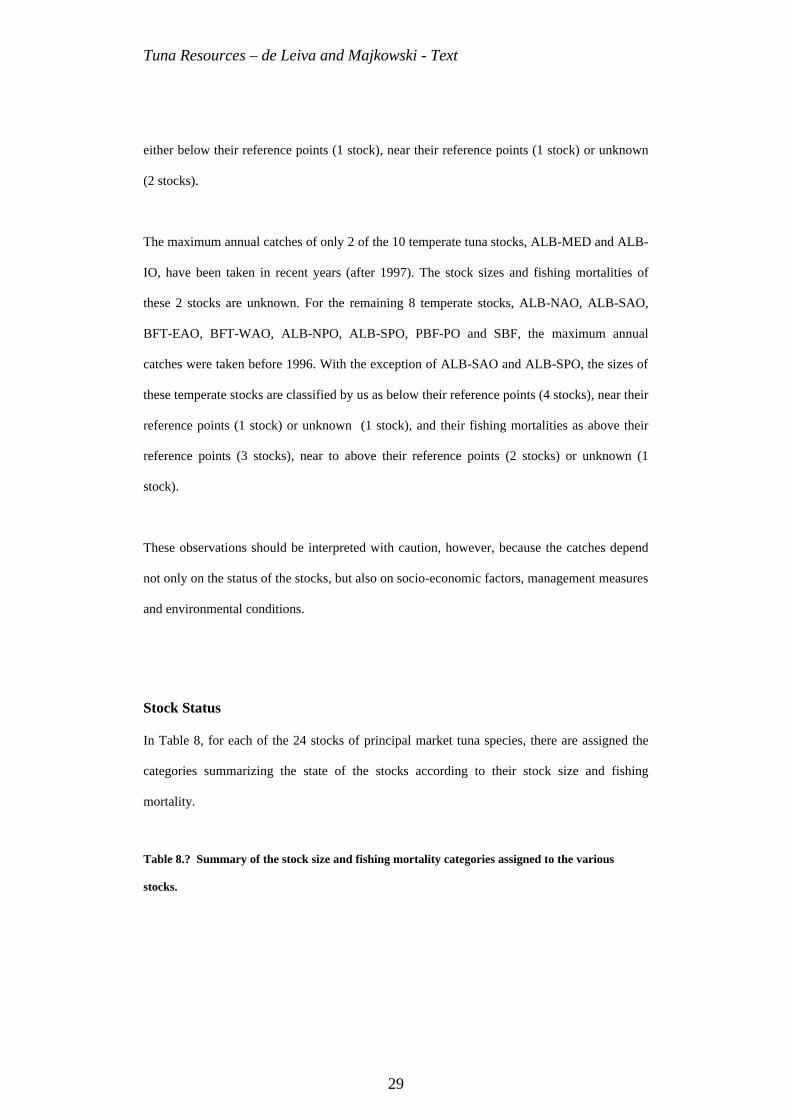
After a rapid increase in the catches during the 1950s, a maximum catch (81,605 t) was taken
in 1961 (Fig. 36). After that the catches declined precipitously until 1990. During the 1990-
2001 period the catches fluctuated between 13,500 and 19,500 t.
Figure 36.? Catches of SBF by gear.
Stock Status
Table 7.? Summary information on the stock status and outlook of the southern bluefin stock.
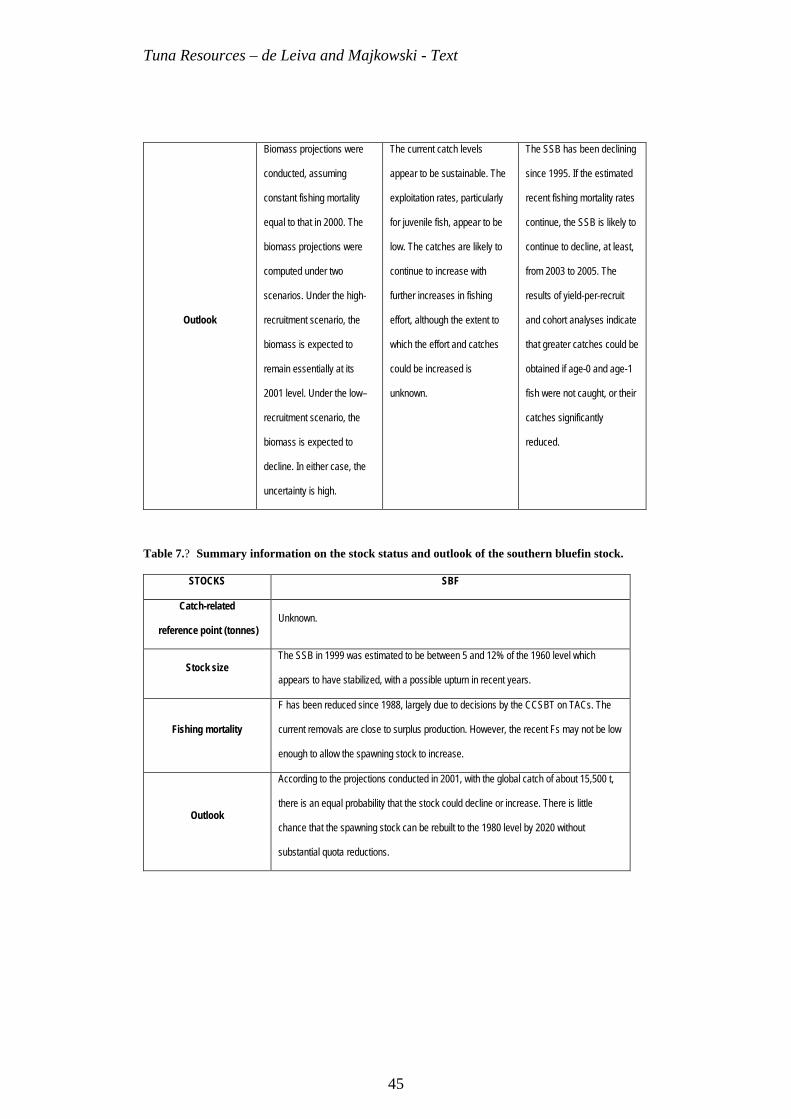
Based on the information from Table 7, the stock size of SBF is below its reference point and
the fishing mortality is near to above its reference point.
Global Analysis
Catches
For 8 out of the 13 tropical tuna stocks (BET-IO, SKJ-IO, BET-EPO, BET-WCPO, SKJ-EPO,
SKJ-WCPO, YFT-EPO and YFT-WCPO), the maximum annual catch has been taken after
1998. All these stocks occur in the Indian Ocean and the Pacific Ocean. The sizes of these 8
stocks are classified by us as either above their reference points (4 stocks), near their reference
points (2 stocks) or unknown (2 stocks). The only stock in these oceans for which the
maximum annual catch was taken before 1998 (in 1993) is YFT-IO. The maximum annual
catches for the 4 tropical tuna stocks in the Atlantic Ocean (BET-AO, SKJ-EAO, SKJ-WAO
and YFT-AO) were taken before 1995, and the sizes of these stocks are classified by us as
Tuna Resources – de Leiva and Majkowski - Text
29
either below their reference points (1 stock), near their reference points (1 stock) or unknown
(2 stocks).
The maximum annual catches of only 2 of the 10 temperate tuna stocks, ALB-MED and ALB-
IO, have been taken in recent years (after 1997). The stock sizes and fishing mortalities of
these 2 stocks are unknown. For the remaining 8 temperate stocks, ALB-NAO, ALB-SAO,
BFT-EAO, BFT-WAO, ALB-NPO, ALB-SPO, PBF-PO and SBF, the maximum annual
catches were taken before 1996. With the exception of ALB-SAO and ALB-SPO, the sizes of
these temperate stocks are classified by us as below their reference points (4 stocks), near their
reference points (1 stock) or unknown (1 stock), and their fishing mortalities as above their
reference points (3 stocks), near to above their reference points (2 stocks) or unknown (1
stock).
These observations should be interpreted with caution, however, because the catches depend
not only on the status of the stocks, but also on socio-economic factors, management measures
and environmental conditions.
Stock Status
In Table 8, for each of the 24 stocks of principal market tuna species, there are assigned the
categories summarizing the state of the stocks according to their stock size and fishing
mortality.
Table 8.? Summary of the stock size and fishing mortality categories assigned to the various
stocks.

Tuna Resources – de Leiva and Majkowski - Text
30
The numbers of stocks assigned to various stock size and fishing mortality categories are
shown in Table 9.
Table 9.? Numbers of stocks assigned to the various stock size and fishing mortality categories.
The numbers in brackets indicate the numbers of stocks for which there is substantial uncertainty
(e.g. the stock sizes of 4 tropical stocks are considered to be above the reference points, but there is
substantial uncertainty about one of them).
The information in Table 9 suggests that the tropical stocks are, in general, in a better
condition than the temperate stocks. If we consider only the stock size, 7 of the 13 tuna
tropical stocks (BET-IO, BET-EPO, BET-WCPO, YFT-AO, SKJ-WCPO, YFT-EPO and
YFT-WCPO) are within their safe limits (above or near their reference points), and only one
of them (BET-AO) is below its safe limit. However, only 3 of the 10 temperate tuna stocks
(ALB-SAO, ALB-SPO and PBF-PO) are within their safe limits, and 4 of them (ALB-NAO,
BFT-EAO, BFT-WAO and SBF) are below their safe limits. For the fishing mortality, the
situation is similar. 5 of the 13 tropical stocks (YFT-AO, BET-IO, SKJ-WCPO, YFT-EPO and
YFT-WCPO) are within their safe limits, and only 3 of them (BET-AO, BET-EPO and BET-
WCPO) are above their safe limits. Only 2 of the 10 temperate stocks (ALB-SAO and ALB-
SPO) are within their safe limits, and 6 of them (ALB-NAO, ALB-NPO, BFT-EAO, BFT-
WAO, PBF-PO and SBF) above those limits.
No estimates of either the stock size or fishing mortality have been obtained for 5 of the 13
tropical stocks (SKJ-EAO, SKJ-EPO, SKJ-IO, SKJ-WAO and YFT-IO) and 3 of the 10
temperate stocks (ALB-IO, ALB-MED, ALB-NPO). This proportion of the stocks for which
this information is lacking is slightly higher for the tropical stocks than for the temperate
stocks. If the number of stocks for which their status is significantly uncertain is added (ALB-
NAO, BET-IO, BET-WCPO and PBF-PO), information is lacking for 7 of the 13 tropical

Tuna Resources – de Leiva and Majkowski - Text
31
stocks and 5 of the 10 temperate stocks. ALB and SKJ are the species for which the stock
status is least known.
The status of the tuna stocks across a bivariate system of references related to the stock size
and fishing mortality is presented in Fig. 37. The representation is qualitative, since not
enough information is available for a quantitative presentation. In accordance with the
precautionary approach (FAO, 1995), when the stock size or fishing mortality category
assigned to the stock was uncertain the more conservative category has been adopted in the
figure.
7 of the stocks (ALB-SAO, ALB-SPO, BET-IO, SKJ-WCPO, YFT-AO, YFT-EPO and YFT-
WCPO) could be considered within safe limits from the conservation perspective (white area).
However, the 3 stocks for which the levels of fishing mortality are near the reference points
(YFT-AO, YFT-EPO and YFT-WCPO) should be and are closely monitored, so that, if
necessary, management action can be undertaken.
Figure 37.? Status of tuna stocks across a bivariate system of references.
The case of the BET-IO requires a further clarification. Despite the stock size and fishing
mortality categories suggesting that the stock is within safe limits, the present level of catches
is regarded as not sustainable in the long-term. This is a consequence of the stock not being in
equilibrium. In addition, the estimates for both BMSY and FMSY were considered to be
substantially uncertain by the Working Party on Tropical Tunas of the IOTC.
The remaining 8 stocks (ALB-NAO, BET-AO, BET-EPO, BET-WCPO, BFT-EAO, BFT-
WAO, PBF-PO and SBF) in the upper row of Fig. 37 may be overfished (grey area). Their
fishing mortalities should be reduced and their stock sizes should be increased, or both, if
Tuna Resources – de Leiva and Majkowski - Text
32
these stocks are to be brought to within safe limits. Of these stocks, the stock size of only one,
BET-EPO, was above its reference point in 2002 (the last year for which stock size estimates
were available at the time that this paper was prepared). However, assessments by the IATTC
staff indicate that its stock size will decrease below its reference point.
The 8 principal market tuna stocks for which the stock size and fishing mortality categories
were not assigned (ALB-IO, ALB-MED, ALB-NPO, SKJ-EAO, SKJ-EPO, SKJ-IO, SKJ-
WAO and YFT-IO) are not included in Fig. 37.
Outlook
Future large increases in the catches of the principal market tunas are neither expected nor
recommended. Several stocks are already fully exploited, overexploited (or depleted), and
their catches should be limited to their current levels, or even decreased to permit the stock
sizes to increase toward the levels corresponding to their MSYs. If this is not done, the catches
may, in fact, decrease over the long-term. The information for several stocks is very limited
and/or uncertain, so, in accordance with the precautionary approach, further research should
be carried out before increases in catches are allowed.
SKJ-EPO, SKJ-IO, SKJ-WCPO and ALB-SPO are the only stocks for which there are
indications that there is still potential for some increase in their catches. SKJ are caught mostly
by purse seining, and sets that include SKJ usually and also include small BET and YFT.
Accordingly, increased fishing effort for SKJ should not be encouraged unless methods can be
found for reducing the incidental catches of BET and YFT. Increases in the catches of ALB-
SPO should be allowed only in small increments, as there is insufficient knowledge of the
status of this stock to know to what extent they can be allowed.

Tuna Resources – de Leiva and Majkowski - Text
33
It appears, from the information in Fig. 37, that increases in the catches for BET-IO and ALB-
SAO could be also be sustainable. This is not the case with BET-IO, however, for reasons
stated before. For ALB-SAO, the stock size is currently above its reference point, and the
fishing mortality is currently below its reference point. However, the catches have been above
or close to those corresponding to the MSY since 1988, so ICCAT has adopted TACs to
prevent overfishing.
The catches of some stocks other than SKJ-EPO, SKJ-IO, SKJ-WCPO and ALB-SPO could
be increased if the catches of small fish could be reduced. This applies particularly to all
stocks of BET, all stocks of YFT, BFT and PBF. The increased catches of some of these
stocks might not be significant, but their SSBs would definitely increase. Also, the total
market value of the fish would increase, because the market value per kilogram is greater for
larger fish.
Discussion
The tuna fishery bodies, ISC and SPC and their member countries carry out substantial
research to evaluate the status of stocks of principal market species of tunas. These evaluations
are difficult for many reasons. In some cases, the stock structure is uncertain. For example, the
degree of independence of the BFT of the eastern Atlantic from those in the western Atlantic
has been under investigation for many years. Each stock, especially PBF and SBF, has a very
wide geographical distribution, so different individuals from the same stock are affected
differently by oceanographic conditions in different parts of these areas. Fishing is carried out
by vessels of many nations, with many different types of gear, and different species of fish are
caught by the same gear. This makes collection of catch and fishing effort data, sampling of
the catches, and analysis of the data very difficult. In some cases, data that are needed are not

Tuna Resources – de Leiva and Majkowski - Text
34
available or not made available to scientists. Surveys by research vessels are, for the most part,
impractical because of the wide distributions of even single stocks.
Regardless of the difficulties and uncertainties described in the previous paragraph, substantial
information has been obtained on the status of the tuna stocks. However, a uniform and
consistent classification of tuna stocks in accordance with some simple, pre-determined
criteria is quite difficult on the global scale because reference points for many of the stocks
have not been determined. For some stocks for which reference points have not been
determined, only qualitative information on the stock sizes and fishing mortality exists.
Regardless of the problems with such information, we believe that it should be included in a
review such as this one, as it indicates what further research should be conducted.
Different methods have been used to estimate the reference points for the different stocks,
which makes it difficult to compare their statuses, particularly when the assessments have
been carried out by different organizations. Consultations among these organizations might
reduce or eliminate this problem. According to the United Nations Agreement for the
Implementation of the Provisions of the United Nations Convention on the Law of the Sea of
10 December 1982 Relating to the Conservation and Management of Straddling Fish Stocks
and Highly Migratory Fish Stocks (1995), both target and limit reference points should be
established and estimated for each stock. At presently, there is no distinction between these
two types of reference points.
Even if the types of reference points were standardized, comparisons of the different stocks
would be difficult because estimates of the reference points are based on the age compositions
of the catches, and these may differ for different stocks of the same species. Nevertheless, we
regard the classification presented in this paper as a useful summary of the status of the tuna
stocks of the world on the global scale.

Tuna Resources – de Leiva and Majkowski - Text
35
There is insufficient information to evaluate the status of some tuna stocks, and other
evaluations are highly uncertain. For these stocks, further research is required. For some other
stocks, the uncertainties as to their status may appear to be less serious, but nevertheless it is
important that additional data be collected and further analyses be made.
Acknowledgments
The information on the structure and status of the tuna stocks and the outlook for their catches
was obtained mostly from publications and web sites of, and from direct communications
from, the following tuna bodies and international organizations:
? Commission for the Conservation of Southern Bluefin Tuna (CCSBT),
? Indian Ocean Tuna Commission (IOTC),
? Inter-American Tropical Tuna Commission (IATTC),
? Interim Scientific Committee for Tuna and Tuna-like Species in the North Pacific
Ocean (ISC),
? International Commission for the Conservation of Atlantic Tunas (ICCAT) and
? Secretariat of the Pacific Community (SPC).
The authors thank these institutions for their assistance in the preparation of this paper.
Particularly, the authors are grateful to Robin Allen (IATTC), Alejandro Anganuzzi (IOTC),
John Annala (Ministry of Fisheries, New Zealand), William Bayliff (IATTC), John Hampton
(SPC), Shelton Harley (IATTC), Brian MacDonald (CCSBT), Mark Maunder (IATTC),
Talbot Murray (Ministry of Fisheries, New Zealand), Miki Ogura (National Research Institute
of Far Seas Fisheries, NRIFSF, Japan), Victor Restrepo (ICCAT) and Ziro Suzuki (NRIFSF)
for their assistance and valuable comments on an earlier version of this paper. We have tried

Tuna Resources – de Leiva and Majkowski - Text
36
to account for them, but we take the full responsibility for the content of the paper, remaining
grateful for their suggestions.
Also, we would like to thank Fabio Carocci (FAO) for the preparation of the maps.
Literature Cited
Anonymous. (in press). Report of the Technical Advisory Committee of the FAO Project on
the Management of tuna fishing capacity: conservation and socio-economics. In Proceedings
of the Second Meeting of the Technical Advisory Committee of the FAO Project on the
Management of tuna fishing capacity: conservation and socio-economics. 15-18 March 2004.
Madrid (Spain).
Allen, R. L. 2002. Global tuna resources: limits to growth and sustainability. Pap. 7th World
Tuna Trade Conference, Kuala Lumpur, Malaysia: 3-12.
Carocci, F., Crispoldi, A., de Leiva, J.I. & Majkowski, J. (in press). Tuna Catch Data in
FAO’s Fisheries Global Information System (FIGIS). In Proceedings of the Second Meeting
of the Technical Advisory Committee of the FAO Project on the Management of tuna fishing
capacity: conservation and socio-economics. 15-18 March 2004. Madrid (Spain).
Catarci, C. (in press). The world tuna industry (An analysis of international demand, prices
and their combined impact on catches and tuna fishing capacity). In Proceedings of the Second
Meeting of the Technical Advisory Committee of the FAO Project on the Management of tuna
fishing capacity: conservation and socio-economics. 15-18 March 2004. Madrid (Spain).

Tuna Resources – de Leiva and Majkowski - Text
37
Collette, B. B. 1999. Mackerels, molecules, and morphology. Soc. Fr. Ichtyol: 149-164. Paris.
Collette, B. B. and Nauen, C. E. 1983. Scombrids of the world. An annotated and illustrated
catalogue of tunas, mackerels, bonitos and related species known to date. FAO Fish. Synop.
125 (2):137 pp. Rome.
FAO. 1995. Precautionary approach to fisheries. Part 1: Guidelines on the precautionary
approach to capture fisheries and species introductions. FAO Fisheries Technical Paper 350,
Part 1. Rome. 52 pp.
(also available at http://www.fao.org/DOCREP/003/V8045E/V8045E00.HTM)
Joseph, J. 2003. Managing fishing capacity of the world tuna fleet. FAO Fisheries Circular
982: 67 pp. Rome.
Joseph, J. (in press). Past developments and future options for managing tuna fishing capacity
with special emphasis on purse-seine fleets. In Proceedings of the Second Meeting of the
Technical Advisory Committee of the FAO Project on the Management of tuna fishing
capacity: conservation and socio-economics. 15-18 March 2004. Madrid (Spain).
Klawe, W. L. 1977. What is a tuna? Marine Fisheries Review, 39 (11): 1-5.
Majkowski, J. 1997. Global resources of tuna and tuna-like species. In Review of the state of
world fishery resources: marine fisheries. FAO Fisheries Circular 920: 173 pp. Rome.
(also available at http://www.fao.org/docrep/003/w4248e/w4248e00.htm)
Majkowsky, J. 2004. Tuna resources, fisheries and their management. (available at
ftp://ftp.fao.org/FI/excerpt/tuna_resources/tuna_resources.pdf)

Tuna Resources – de Leiva and Majkowski - Text
38
Miyake, P. M., Miyabe, N. and Nakano, H. 2004. Historical trends of tuna catches in the
world. FAO Tech.Pap. No. 467. Rome, FAO. 80 pp.
Miyake, P.M. (in press). Historical developments of tuna fisheries and their catches. In
Proceedings of the Second Meeting of the Technical Advisory Committee of the FAO Project
on the Management of tuna fishing capacity: conservation and socio-economics. 15-18 March
2004. Madrid (Spain).
Nakamura, I. 1985. Billfishes of the world. An annotated and illustrated catalogue of marlins,
sailfishes, spearfishes and swordfishes known to date. FAO Fish. Synop. 125.(5): 65 pp.
Rome.
Tuna Resources – de Leiva and Majkowski - Text
39
TABLES
Table 1.? Summary information on the stock status and outlook of tropical tuna stocks in the
Atlantic Ocean.
STOCKS BET-AO SKJ-EAO
Catch-related
reference point (tonnes) MSY is between 79,000 and 105,0004. Unknown.
Stock size The present biomass is about 10-20% below BMSY. Unknown.
Fishing mortality About 15% greater than FMSY. Unknown.
Outlook
The biomass is unlikely to decline further with catches of 100,000 t.
It would increase with catches of 95,000 t, and further declines are
expected with catches of 105,000 t. Reducing fishing effort of
fisheries catching small fish could increase the yield-per-recruit by
even 20%.
Unknown.
Table 1.? Continued.
STOCKS SKJ-WAO YFT-AO
Catch-related
reference point (tonnes) Unknown. Unknown.
Stock size
Standardized abundance indices up to
1998 are available from the Brazilian
pole-and-line fishery and the
Venezuelan purse seine fishery, and
both indices are stable.
Estimates of present biomass differ depending
on the models used (B2001 / BMSY = 0.73 – 1.10).
Fishing mortality Unknown. Estimates of present F differ depending on the
methods used (F2001 / FMSY = 0.87 – 1.46).
Outlook Unknown.
An increase in the fishing effort could decrease
the yield-per-recruit, while F reductions on fish
smaller than 3.2 kg could result in significant
gains in the yield-per-recruit.
Tuna Resources – de Leiva and Majkowski - Text
40
Table 2.? Summary information on the stock status and outlook of tropical tuna stocks in the
Indian Ocean.
STOCKS BET-IO SKJ-IO YFT-IO
Catch-related
reference point
(tonnes)
MSY is 102,000. Unknown. MSY is between 280,000
and 350,000.
Stock size
Significantly greater than that
corresponding to the MSY
(significantly uncertain).
Unknown.
The YFT biomass has
been substantially
declining since, at least,
the mid-1980s.
Fishing mortality F is currently below FMSY
(significantly uncertain). Unknown.
Since the early 1980s,
there has been a
continuous increase in F,
but no reliable estimate of
FMSY has been obtained.
Outlook
Reductions in purse seine fishing
mortality on juveniles could lead to
increases in the long-term yield
and SSB, while decreases in
longline fishing mortality could lead
to an increase in SSB. The present
catches are regarded as not
sustainable in the long-term. It is
foreseen that when the stock size
reaches equilibrium (in 4 to 5
years) with a lower level of
abundance, the catches will
decrease below MSY, because the
current F is below FMSY.
Further increases in the
catches of SKJ in the IO
could be sustainable,
provided that further
increases in the catches of
BET and YFT are avoided.
The current catches of
YFT in the IO are
sustainable, provided that
the fishing effort, especially
that directed toward
juvenile fish associated
with FADs, is not further
increased.
Table 3.? Summary information on the stock status and outlook of tropical tuna stocks in the
Pacific Ocean.

Tuna Resources – de Leiva and Majkowski - Text
41
STOCKS BET-EPO BET-WCPO SKJ-EPO
Catch-related
reference point
(tonnes)
AMSY is 77 000 (PS = 48,000
and LL = 29 000).
MSY5 is between 40 000 and
80 000, depending on
recruitment regime.
The maximum yield would be
achieved with infinite fishing
mortality.
Stock size
In January 2003, the SSB of
BET was greater than SSBAMSY,
but it was forecast that it would
be below that level by the end of
2003. The SSB is predicted to
decline below SSBAMSY.
The present biomass level is
above BMSY. The ratio of
exploited to unexploited total
biomass has been
decreasing since 1950, and
has approached 0.3 in
recent years. The equilibrium
BMSY is estimated to be 35%
of the equilibrium
unexploited biomass.
The biomass of SKJ has been
highly variable between 1975
and 2001. The SSB was
considerably reduced at the
beginning of 2002. The
variation in the biomass is
attributable mostly to changes
in recruitment. The absolute
biomass and the SBR6 are
unknown.
Fishing mortality
Since 1993, on average, F for
BET younger than about 5 years
old has increased substantially
due to the expansion of the
purse-seine fisheries that catch
BET in association with floating
objects. F for fish older than
about 6 years old has remained
relatively constant.
F was formerly greater for
adults than for juveniles, but
during recent years, they
have been at about the
same level. F is greater than
FMSY (significantly uncertain).
The current levels of F are
unknown. According to a yield-
per-recruit analysis, FMSY would
be infinite.
Outlook
If the fishing mortality is
proportional to the fishing effort,
and the current patterns of age-
specific selectivity are
maintained, the level of fishing
effort corresponding to the
AMSY is estimated to be about
80% of the 2000-2001 effort.
Such a reduction in the effort
would increase the long-term
The present fishing mortality
rates for both juveniles and
adults may not be
sustainable in the long-term.
According to the projections,
the equilibrium biomass was
most sensitive to changes of
the fishing mortality by the
purse-seine fishery.
Further increases in the
catches of SKJ in the EPO
could be sustainable, provided
that further increases in the
catches of BET and YFT are
avoided.

Tuna Resources – de Leiva and Majkowski - Text
42
average yield slightly, but it
would significantly increase the
spawning potential7 of the stock.
Table 3.? Continued.
STOCKS SKJ-WCPO YFT-EPO YFT-WCPO
Catch-related
reference point
(tonnes)
MSY is 1,600,0008. AMSY is 250,0009. MSY is between 381,000 and
554,000.
Stock size
The biomass has increased
since 1972. The present
biomass is well above BMSY.
Currently, SBR is slightly
less than the SBRAMSY
(significantly uncertain).
The biomass has been
declining over time, but remains
above BMSY. The present
biomass is 20 to 35% less than
that in the absence of fishing.
Fishing mortality
F is on average smaller for
juveniles than for adults. F is
currently about 0.20 to 0.25 per
year.
F has been stable in recent
years (slightly below FAMSY),
and is greatest for 3 and 4
year old fish.
F/FMSY is still below 1.
Outlook
Increases in fishing mortality
would likely result in increases in
the catches. However, because
SKJ is being fished together with
YFT and BET, fisheries
management measures for
these species may have an
impact on the future catches of
SKJ.
Increasing the effort would
probably not produce
noticeable increases in the
catches.
The present fishing pattern and
intensity is sustainable. Yield
projections indicate that
increases in the fishing
mortality would not result in
long-term increases in the
catches, and might result in
overexploitation. The extent to
which the use of FADs could
affect the sustainability of the
stock in the long-term should be
studied further.
Table 4.? Summary information on the stock status and outlook of temperate tuna stocks in the
Atlantic Ocean.

Tuna Resources – de Leiva and Majkowski - Text
43
STOCKS ALB-
MED ALB-NAO ALB-SAO
Catch-related
reference point
(tonnes)
Unknown. MSY is 32,600. MSY is 30,915.
Stock size Unknown.
The present SSB is probably about 30% below
SSBMSY. However, due to the great uncertainty
in this estimate, it is possible that the stock
biomass is greater than the BMSY.
In 2002, SSB was well above
the SSBMSY.
Fishing mortality Unknown.
The stock is not being growth-overfished
(F<Fmax). However, estimates of FMSY indicate
that F in 2000 was about 10% above FMSY.
F was estimated to be about
60% of FMSY in both 2001 and
2003.
Outlook Unknown.
According to the last assessment done in 2000,
to increase SSB towards SSBMSY, the catches
in 2001 and 2002 should not exceed 31,000 t
(actual catches are much smaller).
To maintain SSB in a near
future, the catch should not
exceed 31,000 t for the next
three to five years.
Table 4.? Continued.
STOCKS BFT-EAO BFT-WAO
Catch-related
reference point
(tonnes)
Unknown. MSY is 3,500 and 7,200 for a low and high
recruitment scenario, respectively.
Stock size
SSB in 2000 was about 86% of its level
in 1970 (the first year for which was
known).
In 2001, SSB was at 13% of its 1975 level (lowest
since 1970).
Fishing mortality In 2000, F was almost 2.5 times higher
than that maximizing the yield per recruit.
In 2001, F for adults was at its highest level since
1970.
Outlook
If the biomass is recovered to the level of
the early 1970s, annual yields of possibly
more then 50,000 t could be sustainable.
If the recent level of catch is maintained, (i) SSBMSY
will unlikely be reached by 2018 for the high
recruitment scenario and (ii) the SSBMSY could be
reached by 2018 even with an increase of the
present catch for the low recruitment scenario.

Tuna Resources – de Leiva and Majkowski - Text
44
Table 5.? Summary information on the stock status and outlook of temperate tuna stocks in the
Indian Ocean.
STOCKS ALB-IO
Catch-related
reference point (tonnes) Unknown.
Stock size Unknown.
Fishing mortality Unknown.
Outlook Unknown.
Table 6.? Summary information on the stock status and outlook of temperate tuna stocks in the
Pacific Ocean.
STOCKS ALB-NPO ALB-SPO PBF-PO
Catch-related
reference point
(tonnes)
Unknown. Unknown. Unknown.
Stock size
The present biomass is
almost 40% greater than
that estimated for 1975 (the
first year for which such
estimates are available).
However, it is uncertain
whether this biomass is
above or below BMSY.
The biomass has been
declining since the late 1970s,
reaching historic low levels
during recent years. The
current biomass is about 60%
of that during the early 1950s.
The biomass appears to
have recovered from a
record low level during the
late 1980s to intermediate
levels, largely as a result of
better-than-average
recruitment during the
1990s.
Fishing mortality The estimates of F exceed
F30% and F40%10.
As longlining is the
predominant method of fishing,
F is greater for adult than for
juvenile ALB. F has increased
strongly, especially during
recent years, but it is still
probably low to moderate.
F is greater than Fmax. In
particular, the high F for
young fish (ages 0-2) and
older fish (ages 6+) may be
of concern for the
sustainability of the fishery.
Tuna Resources – de Leiva and Majkowski - Text
45
Outlook
Biomass projections were
conducted, assuming
constant fishing mortality
equal to that in 2000. The
biomass projections were
computed under two
scenarios. Under the high-
recruitment scenario, the
biomass is expected to
remain essentially at its
2001 level. Under the low–
recruitment scenario, the
biomass is expected to
decline. In either case, the
uncertainty is high.
The current catch levels
appear to be sustainable. The
exploitation rates, particularly
for juvenile fish, appear to be
low. The catches are likely to
continue to increase with
further increases in fishing
effort, although the extent to
which the effort and catches
could be increased is
unknown.
The SSB has been declining
since 1995. If the estimated
recent fishing mortality rates
continue, the SSB is likely to
continue to decline, at least,
from 2003 to 2005. The
results of yield-per-recruit
and cohort analyses indicate
that greater catches could be
obtained if age-0 and age-1
fish were not caught, or their
catches significantly
reduced.
Table 7.? Summary information on the stock status and outlook of the southern bluefin stock.
STOCKS SBF
Catch-related
reference point (tonnes) Unknown.
Stock size The SSB in 1999 was estimated to be between 5 and 12% of the 1960 level which
appears to have stabilized, with a possible upturn in recent years.
Fishing mortality
F has been reduced since 1988, largely due to decisions by the CCSBT on TACs. The
current removals are close to surplus production. However, the recent Fs may not be low
enough to allow the spawning stock to increase.
Outlook
According to the projections conducted in 2001, with the global catch of about 15,500 t,
there is an equal probability that the stock could decline or increase. There is little
chance that the spawning stock can be rebuilt to the 1980 level by 2020 without
substantial quota reductions.

Tuna Resources – de Leiva and Majkowski - Text
46
Table 8.? Summary of the stock size and fishing mortality categories assigned to the principal
market tunas stocks.
Stock size Fishing mortality
ATLANTIC OCEAN
ALB-MED Unknown. Unknown.
ALB-NAO Possibly below its reference point. Possibly near or above its reference point.
ALB-SAO Above its reference point. Below its reference point.
BFT-EAO Below its reference point. Above its reference point.
BFT-WAO Below its reference point. Above its reference point.
BET-AO Below its reference point. Above its reference point.
SKJ-EAO Unknown. Unknown.
SKJ-WAO Unknown. Unknown.
YFT-AO Near its reference point. Near its reference point.
INDIAN OCEAN
ALB-IO Unknown. Unknown.
BET-IO Possibly above its reference point. Possibly below its reference point.
SKJ-IO Unknown. Unknown.
YFT-IO Unknown. Unknown.
PACIFIC OCEAN
ALB-NPO Unknown. Possibly above its reference point.
ALB-SPO Above its reference point. Below its reference point.
PBF-PO Possibly near its reference point. Above its reference point.
BET-EPO Above its reference point. Above its reference point.
BET-WCPO Possibly near its reference point. Possibly above its reference point.
SKJ-EPO Unknown. Unknown.
SKJ-WCPO Above its reference point. Below its reference point.
YFT-EPO Near its reference point. Near its reference point.

Tuna Resources – de Leiva and Majkowski - Text
47
YFT-WCPO Above its reference point. Near its reference point.
SOUTHERN BLUEFIN
SBF Below its reference point. Near to above its reference point.
Table 9.? Numbers of stocks assigned to the various stock size and fishing mortality categories.
The numbers in brackets indicate the numbers of stocks for which there is substantial uncertainty
(e.g. the stock sizes of four tropical stocks are considered to be above the reference points, but
there is substantial uncertainty about one of them).
STOCK STATUS
Stock size
Above Above-Near Near Near-Below Below Unknown
Tropical stocks 4(1) - 3 (1) - 1 5
Temperate stocks 2 - 1(1) - 4 (1) 3
Total 6 (1) - 4 (2) - 5 (1) 8
Fishing mortality
Below Below-Near Near Near-Above Above Unknown
Tropical stocks 2 (1) - 3 - 3 (1) 5
Temperate stocks 2 - 0 2 (1) 4 (1) 2
Total 4 (1) - 3 2 (1) 7 (2) 7

Tuna Resources – de Leiva and Majkowski - Figures
48
FOOTNOTES
1 The views expressed in this paper are those of the authors and not of the Food and Agriculture Organization of the United nations (FAO). 2 These data or their updates can be obtained presently from: http://www.fao.org/figis/servlet/FiRefServlet?ds=staticXML&xml=webapps/figis/wwwroot/fi/figis/tseries/index.xml&xsl=webapps/figis/staticXML/format/webpage.xsl 3 These data or their updates and information about their collation and processing can be obtained presently from: http://www.fao.org/figis/servlet/TabSelector?tb_ds=TunaAtlas&tb_act=ACTION&tb_grp=RESET&tb_mode=MAP 4 Range of estimates based on various production models. 5 The estimates of MSY are based on equilibrium recruitment obtained from a Beverton and Holt stock-recruitment relationship. Recent recruitment has been much greater than the equilibrium levels, and MSY would be greater if based on the greater recent recruitment. 6 The ratio of spawning biomass during a period of harvest to that which might accumulate in the absence of fishing. 7 The spawning potential is based on the biomass of mature fish. The age at 50% maturity is approximately five. 8 MSY estimate is based on equilibrium recruitment obtained from a Beverton and Holt stock-recruitment relationship. Recent recruitment has been much higher than the equilibrium level, and MSY would be higher if based on the higher recent recruitment. 9 This is based on average recruitment, the recent size-composition of catches. 10 The fishing mortality that will reduce the equilibrium spawning potential per recruit to 30 and 40%, respectively, of what it would be without any fishing. F35% has been recommended as a proxy for FMSY.
Tuna Resources – de Leiva and Majkowski - Figures
49
FIGURES
Figure 1.? Albacore stocks, and distributions of the catches by the principal fishing gears in 1991 to 2001.
Figure 2.? Bigeye stocks, and distributions of the catches by the principal fishing gears in 1991 to 2001.
Tuna Resources – de Leiva and Majkowski - Figures
50
Figure 3.? Skipjack stocks, and distributions of the catches by the principal fishing gears in 1991 to 2001.
Figure 4.? Yellowfin stocks, and distributions of the catches by the principal fishing gears in 1991 to 2001.
Figure 5.? Atlantic and Pacific bluefin stocks, and distributions of the catches by the principal fishing gears in 1991 to 2001.

Tuna Resources – de Leiva and Majkowski - Figures
51
Figure 6.? Southern bluefin stock, and distributions of the catches by the principal fishing gears in 1991 to 2001.

Tuna Resources – de Leiva and Majkowski - Figures
52
0
500,000
1,000,000
1,500,000
2,000,000
2,500,000
3,000,000
3,500,000
4,000,000
4,500,000
1950
1953
1956
1959
1962
1965
1968
1971
1974
1977
1980
1983
1986
1989
1992
1995
1998
2001
Cat
ch (
t)
LL PL PS TROLL OTHER
0
500,000
1,000,000
1,500,000
2,000,000
2,500,000
1950
1953
1956
1959
1962
1965
1968
1971
1974
1977
1980
1983
1986
1989
1992
1995
1998
2001
Cat
ch (
t)
ALB BET BFT PBF SKJ YFT SBF
0
50,000
100,000
150,000
200,000
250,000
300,000
350,000
400,000
450,000
500,000
1950
1953
1956
1959
1962
1965
1968
1971
1974
1977
1980
1983
1986
1989
1992
1995
1998
2001
Cat
ch (
t)
LL PL PS TROLL OTHER
0
20,000
40,000
60,000
80,000
100,000
120,000
140,000
1950
1953
1956
1959
1962
1965
1968
1971
1974
1977
1980
1983
1986
1989
1992
1995
1998
2001
Cat
ch (
t)
LL PL PS
0
20,000
40,000
60,000
80,000
100,000
120,000
140,000
160,000
180,000
1950
1953
1956
1959
1962
1965
1968
1971
1974
1977
1980
1983
1986
1989
1992
1995
1998
2001
Cat
ch (
t)
PL PS OTHER
Figure 7.? Global tuna catches by gears. Figure 8.? Global tuna catches by species.
Figure 9.? Catches of the tropical species, by gear, in AO.
Figure 10.? Catches of BET, by fishing gear, in AO.
.
Figure 11.? Catches of SKJ, by fishing gear, in EAO.
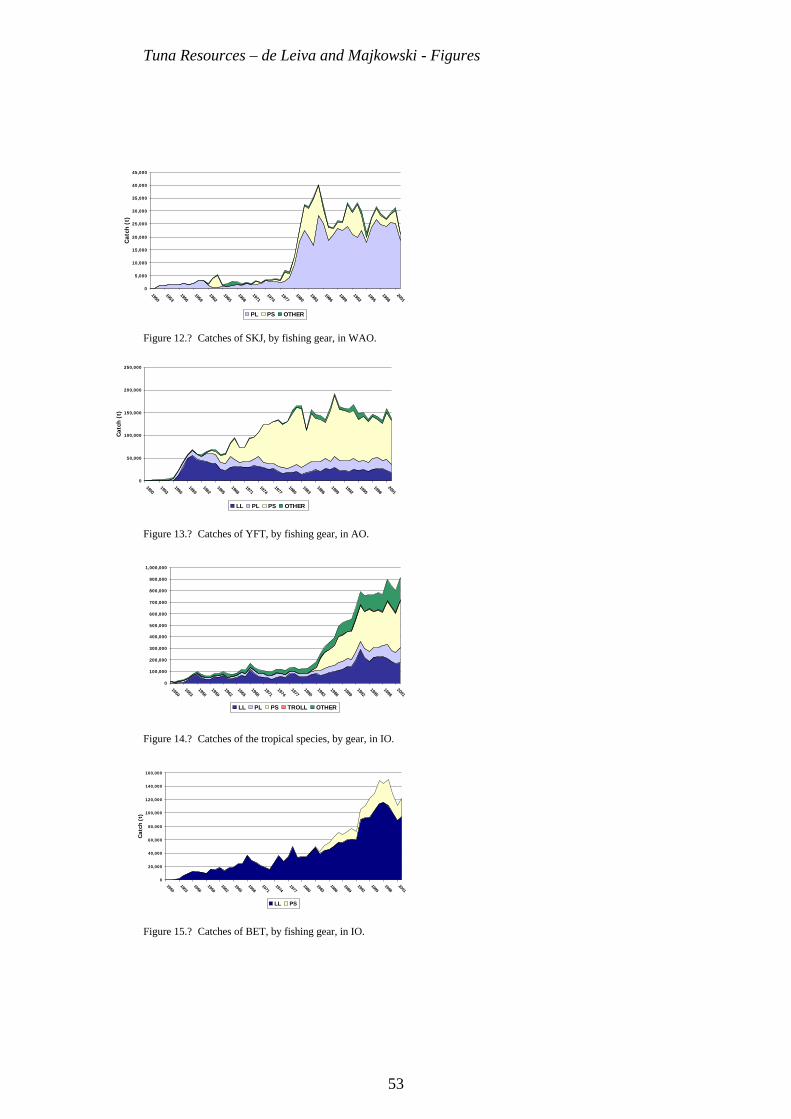
Tuna Resources – de Leiva and Majkowski - Figures
53
0
100,000
200,000
300,000
400,000
500,000
600,000
700,000
800,000
900,000
1,000,000
1950
1953
1956
1959
1962
1965
1968
1971
1974
1977
1980
1983
1986
1989
1992
1995
1998
2001
LL PL PS TROLL OTHER
0
5,000
10,000
15,000
20,000
25,000
30,000
35,000
40,000
45,000
1950
1953
1956
1959
1962
1965
1968
1971
1974
1977
1980
1983
1986
1989
1992
1995
1998
2001
Cat
ch (
t)
PL PS OTHER
0
50,000
100,000
150,000
200,000
250,000
1950
1953
1956
1959
1962
1965
1968
1971
1974
1977
1980
1983
1986
1989
1992
1995
1998
2001
Cat
ch (
t)
LL PL PS OTHER
0
20,000
40,000
60,000
80,000
100,000
120,000
140,000
160,000
1950
1953
1956
1959
1962
1965
1968
1971
1974
1977
1980
1983
1986
1989
1992
1995
1998
2001
Cat
ch (
t)
LL PS
Figure 12.? Catches of SKJ, by fishing gear, in WAO.
Figure 13.? Catches of YFT, by fishing gear, in AO.
Figure 14.? Catches of the tropical species, by gear, in IO.
Figure 15.? Catches of BET, by fishing gear, in IO.

Tuna Resources – de Leiva and Majkowski - Figures
54
0
500,000
1,000,000
1,500,000
2,000,000
2,500,000
3,000,000
1950
1953
1956
1959
1962
1965
1968
1971
1974
1977
1980
1983
1986
1989
1992
1995
1998
2001
Cat
ch (
t)
LL PL PS TROLL OTHER
0
100,000
200,000
300,000
400,000
500,000
600,000
1950
1953
1956
1959
1962
1965
1968
1971
1974
1977
1980
1983
1986
1989
1992
1995
1998
2001
Cat
ch (
t)
PL PS OTHER
0
50,000
100,000
150,000
200,000
250,000
300,000
350,000
400,000
450,000
1950
1953
1956
1959
1962
1965
1968
1971
1974
1977
1980
1983
1986
1989
1992
1995
1998
2001
Cat
ch (
t)
LL PL PS TROLL OTHER
0
20,000
40,000
60,000
80,000
100,000
120,000
1954
1957
1960
1963
1966
1969
1972
1975
1978
1981
1984
1987
1990
1993
1996
1999
2002
Cat
ch (
t)
LL PS
Figure 16.? Catches of SKJ, by fishing gear, in IO.
Figure 17.? Catches of YFT, by fishing gear, in IO.
Figure 18.? Catches of the tropical species, by gear, in PO.
Figure 19.? Catches of BET, by fishing gear, in EPO.
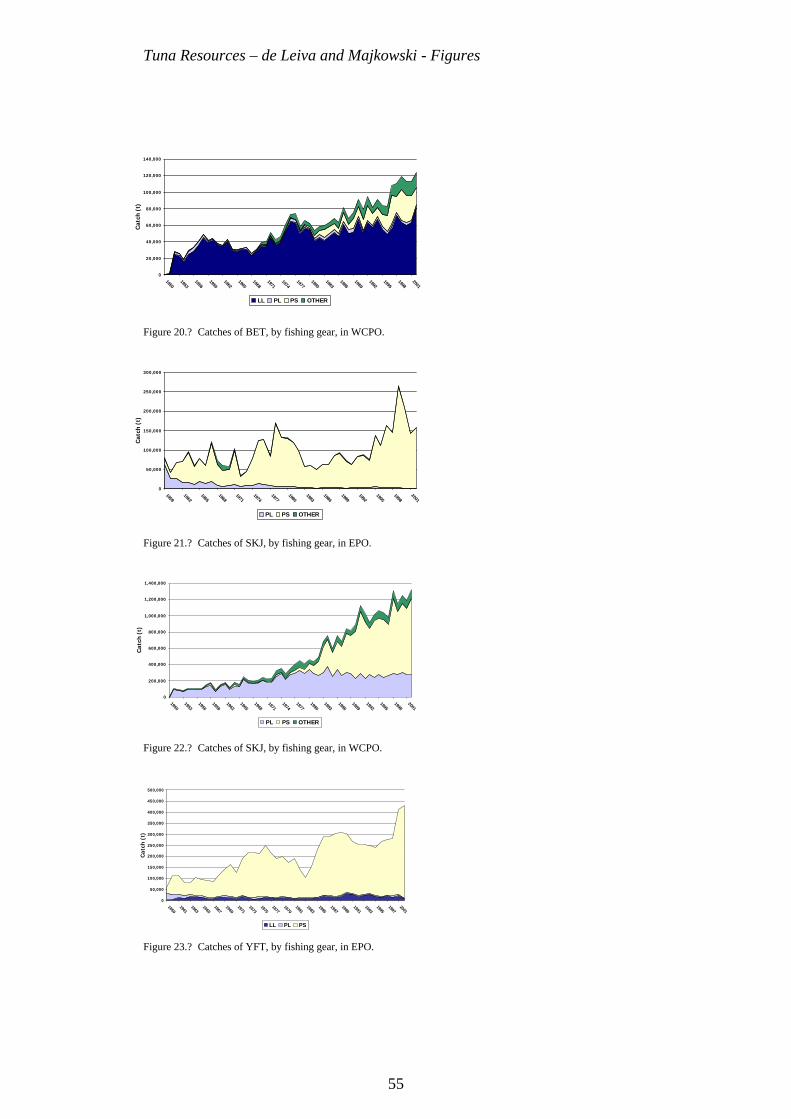
Tuna Resources – de Leiva and Majkowski - Figures
55
0
50,000
100,000
150,000
200,000
250,000
300,000
1959
1962
1965
1968
1971
1974
1977
1980
1983
1986
1989
1992
1995
1998
2001
Cat
ch (
t)
PL PS OTHER
0
200,000
400,000
600,000
800,000
1,000,000
1,200,000
1,400,000
1950
1953
1956
1959
1962
1965
1968
1971
1974
1977
1980
1983
1986
1989
1992
1995
1998
2001
Ca
tch
(t)
PL PS OTHER
0
50,000
100,000
150,000
200,000
250,000
300,000
350,000
400,000
450,000
500,000
1959
1961
1963
1965
1967
1969
1971
1973
1975
1977
1979
1981
1983
1985
1987
1989
1991
1993
1995
1997
2001
Cat
ch (
t)
LL PL PS
0
20,000
40,000
60,000
80,000
100,000
120,000
140,000
1950
1953
1956
1959
1962
1965
1968
1971
1974
1977
1980
1983
1986
1989
1992
1995
1998
2001
Cat
ch (
t)
LL PL PS OTHER
Figure 20.? Catches of BET, by fishing gear, in WCPO.
Figure 21.? Catches of SKJ, by fishing gear, in EPO.
Figure 22.? Catches of SKJ, by fishing gear, in WCPO.
Figure 23.? Catches of YFT, by fishing gear, in EPO.
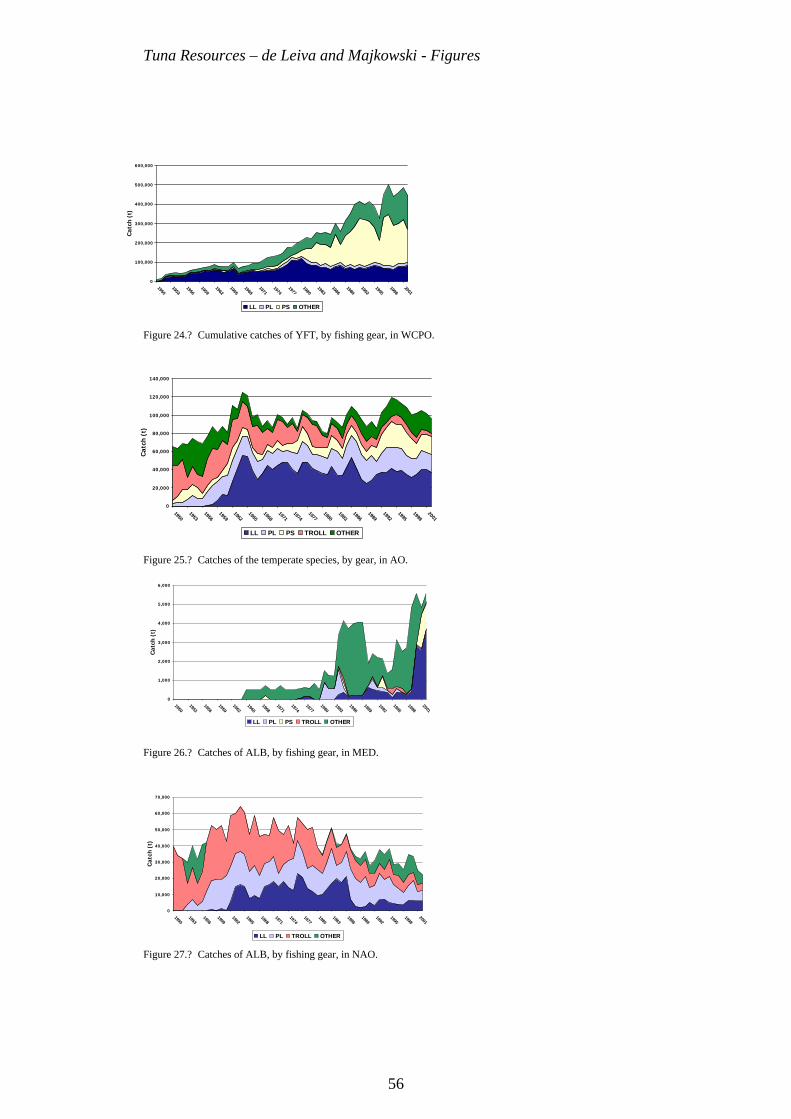
Tuna Resources – de Leiva and Majkowski - Figures
56
0
20,000
40,000
60,000
80,000
100,000
120,000
140,000
1950
1953
1956
1959
1962
1965
1968
1971
1974
1977
1980
1983
1986
1989
1992
1995
1998
2001
Cat
ch (
t)
LL PL PS TROLL OTHER
0
10,000
20,000
30,000
40,000
50,000
60,000
70,000
1950
1953
1956
1959
1962
1965
1968
1971
1974
1977
1980
1983
1986
1989
1992
1995
1998
2001
Cat
ch (
t)
LL PL TROLL OTHER
0
100,000
200,000
300,000
400,000
500,000
600,000
1950
1953
1956
1959
1962
1965
1968
1971
1974
1977
1980
1983
1986
1989
1992
1995
1998
2001
Cat
ch (
t)
LL PL PS OTHER
0
1,000
2,000
3,000
4,000
5,000
6,000
1950
1953
1956
1959
1962
1965
1968
1971
1974
1977
1980
1983
1986
1989
1992
1995
1998
2001
Cat
ch (
t)
LL PL PS TROLL OTHER
Figure 24.? Cumulative catches of YFT, by fishing gear, in WCPO.
Figure 25.? Catches of the temperate species, by gear, in AO.
Figure 26.? Catches of ALB, by fishing gear, in MED.
Figure 27.? Catches of ALB, by fishing gear, in NAO.

Tuna Resources – de Leiva and Majkowski - Figures
57
0
5,000
10,000
15,000
20,000
25,000
30,000
35,000
40,000
45,000
1950
1953
1956
1959
1962
1965
1968
1971
1974
1977
1980
1983
1986
1989
1992
1995
1998
2001
Cat
ch (
t)
LL PL PS TROLL OTHER
0
5,000
10,000
15,000
20,000
25,000
30,000
35,000
40,000
45,000
1950
1953
1956
1959
1962
1965
1968
1971
1974
1977
1980
1983
1986
1989
1992
1995
1998
2001
Cat
ch (
t)
LL PL PS
0
10,000
20,000
30,000
40,000
50,000
60,000
1950
1953
1956
1959
1962
1965
1968
1971
1974
1977
1980
1983
1986
1989
1992
1995
1998
2001
Cat
ch (
t)
LL PL PS OTHER
0
2,000
4,000
6,000
8,000
10,000
12,000
14,000
16,000
18,000
20,000
1950
1953
1956
1959
1962
1965
1968
1971
1974
1977
1980
1983
1986
1989
1992
1995
1998
2001
Cat
ch (
t)
LL PS OTHER
Figure 28.? Catches of ALB, by fishing gear, in SAO.
Figure 29.? Catches of BFT, by fishing gear, in EAO.
Figure 30.? Catches of BFT, by fishing gear, in WAO.
Figure 31.? Catches of ALB, by fishing gear, in IO.
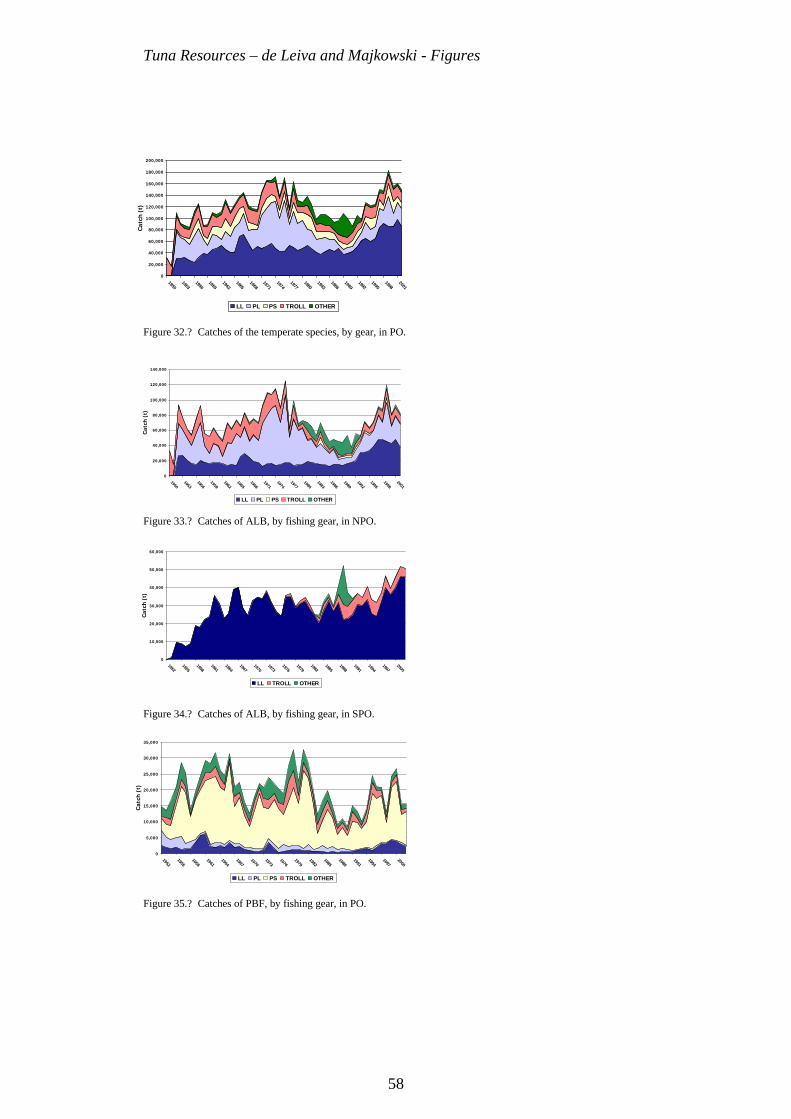
Tuna Resources – de Leiva and Majkowski - Figures
58
0
20,000
40,000
60,000
80,000
100,000
120,000
140,000
160,000
180,000
200,000
1950
1953
1956
1959
1962
1965
1968
1971
1974
1977
1980
1983
1986
1989
1992
1995
1998
2001
Cat
ch (
t)
LL PL PS TROLL OTHER
0
10,000
20,000
30,000
40,000
50,000
60,000
1952
1955
1958
1961
1964
1967
1970
1973
1976
1979
1982
1985
1988
1991
1994
1997
2000
Cat
ch (
t)
LL TROLL OTHER
0
20,000
40,000
60,000
80,000
100,000
120,000
140,000
1950
1953
1956
1959
1962
1965
1968
1971
1974
1977
1980
1983
1986
1989
1992
1995
1998
2001
Cat
ch (
t)
LL PL PS TROLL OTHER
0
5,000
10,000
15,000
20,000
25,000
30,000
35,000
1952
1955
1958
1961
1964
1967
1970
1973
1976
1979
1982
1985
1988
1991
1994
1997
2000
Cat
ch (
t)
LL PL PS TROLL OTHER
Figure 32.? Catches of the temperate species, by gear, in PO.
Figure 33.? Catches of ALB, by fishing gear, in NPO.
Figure 34.? Catches of ALB, by fishing gear, in SPO.
Figure 35.? Catches of PBF, by fishing gear, in PO.

Tuna Resources – de Leiva and Majkowski - Figures
59
0
10,000
20,000
30,000
40,000
50,000
60,000
70,000
80,000
90,000
19521954195619581960196219641966196819701972197419761978198019821984198619881990199219941996199820002002
Cat
ch (
t)
LL SURF OTHER
Below Near Above
Above
Below
Fis
hin
g M
ort
alit
y
BFT-EAO
SBFBFT-WAO
BET-AOALB-NAO
YFT-AO
BET-EPO
BET-WCPO
SKJ-WCPO
ALB-SPO
YFT-WCPO
BET-IO
ALB-SAO
YFT-EPO
Stock Size
PBF-PO
Near
Below Near Above
Above
Below
Fis
hin
g M
ort
alit
y
BFT-EAO
SBFBFT-WAO
BET-AOALB-NAO
YFT-AO
BET-EPO
BET-WCPO
SKJ-WCPO
ALB-SPO
YFT-WCPO
BET-IO
ALB-SAO
YFT-EPO
Stock Size
PBF-PO
Near
Figure 36.? Catches of SBF by gear.
Figure 37.? Status of tuna stocks across a bivariate system of references.