Tuna longline conducted on the training Ship “Tenyo maru...
16
Mathematical and Physical Fisheries Science Vol.14(2017) 1 Tuna longline conducted on the training Ship “Tenyo maru” (Voyage No. 235) using satellite altimetry sea surface height data as an indicator to search for fishing grounds. Hideaki Tanoue *, Masahiko Mohri *, Takafumi Itoh **, Masataka Kokatsu **, Hiroshi Gotoh **, Taketomo Enoshima **, Kazuhiro Hata **, Yuuka Kawato ***, Makoto Niitani ***, Yukio Okita ***, Satoshi Omi ***, Kiyohiko Fukami ***, Tadashi Kamano ***, Yoichi Gotoh ****, Tomozumi Kawashita * *National Fisheries University, Dept. of Fisheries Science and Technology, Japan ** National Fisheries University, Tenyo Maru, Japan *** National Fisheries University, Koyo Maru, Japan **** Marine Science High School, Kanagawa, Japan Abstract A total of 2200 hooks of tuna longlines were carried out by training ship “Tenyo maru” in the South Pacific Ocean from November 27 to December 2, 2015. For each operation, sea surface heights provided by altimeter satellites were detected for the location where the line was cast and for locations in the eight cardinal directions 0.2 degrees away from the casting location. The mean sea surface height and standard deviation were calculated using a total of nine data figures. The catch for six days (total six times) of operation was seven fish from four species. In waters where sea surface height was -9.2±4.0 cm (mean±standard deviation), one wahoo, Acanthocybium solandri was caught. At sea surface height -0.4±6.3 cm, one wahoo and one shortnose spearfish, Tetrapturus angustirostris were caught. At mean sea surface height 0.7±5.2 cm, one wahoo was caught. At sea surface height -18.4±5.8 cm, one wahoo, one swordfish, Xiphias gladius were caught. At sea surface height -0.4±5.7 cm, one bigeye tuna, Thunnus obesus was caught. There was no catch at sea surface height 4.9±1.2 cm, the area with the least variation. 1 Introduction A satellite sea surface altimeter is a technology to measure sea surface height
Transcript of Tuna longline conducted on the training Ship “Tenyo maru...

Mathematical and Physical Fisheries Science Vol.14(2017)
1
Tuna longline conducted on the training Ship “Tenyo maru” (Voyage No. 235) using satellite altimetry sea surface height data as an indicator to
search for fishing grounds. Hideaki Tanoue *, Masahiko Mohri *, Takafumi Itoh **, Masataka Kokatsu **,
Hiroshi Gotoh **, Taketomo Enoshima **, Kazuhiro Hata **, Yuuka Kawato ***, Makoto Niitani ***, Yukio Okita ***, Satoshi Omi ***, Kiyohiko Fukami ***,
Tadashi Kamano ***, Yoichi Gotoh ****, Tomozumi Kawashita *
*National Fisheries University, Dept. of Fisheries Science and Technology, Japan ** National Fisheries University, Tenyo Maru, Japan *** National Fisheries University, Koyo Maru, Japan **** Marine Science High School, Kanagawa, Japan
Abstract A total of 2200 hooks of tuna longlines were carried out by training ship “Tenyo maru” in the
South Pacific Ocean from November 27 to December 2, 2015. For each operation, sea surface
heights provided by altimeter satellites were detected for the location where the line was cast
and for locations in the eight cardinal directions 0.2 degrees away from the casting location. The
mean sea surface height and standard deviation were calculated using a total of nine data
figures. The catch for six days (total six times) of operation was seven fish from four species. In
waters where sea surface height was -9.2±4.0 cm (mean±standard deviation), one wahoo,
Acanthocybium solandri was caught. At sea surface height -0.4±6.3 cm, one wahoo and one
shortnose spearfish, Tetrapturus angustirostris were caught. At mean sea surface height 0.7±5.2
cm, one wahoo was caught. At sea surface height -18.4±5.8 cm, one wahoo, one swordfish,
Xiphias gladius were caught. At sea surface height -0.4±5.7 cm, one bigeye tuna, Thunnus
obesus was caught. There was no catch at sea surface height 4.9±1.2 cm, the area with the
least variation.
1 Introduction
A satellite sea surface altimeter is a technology to measure sea surface height
Mathematical and Physical Fisheries Science Vol.14(2017)
2
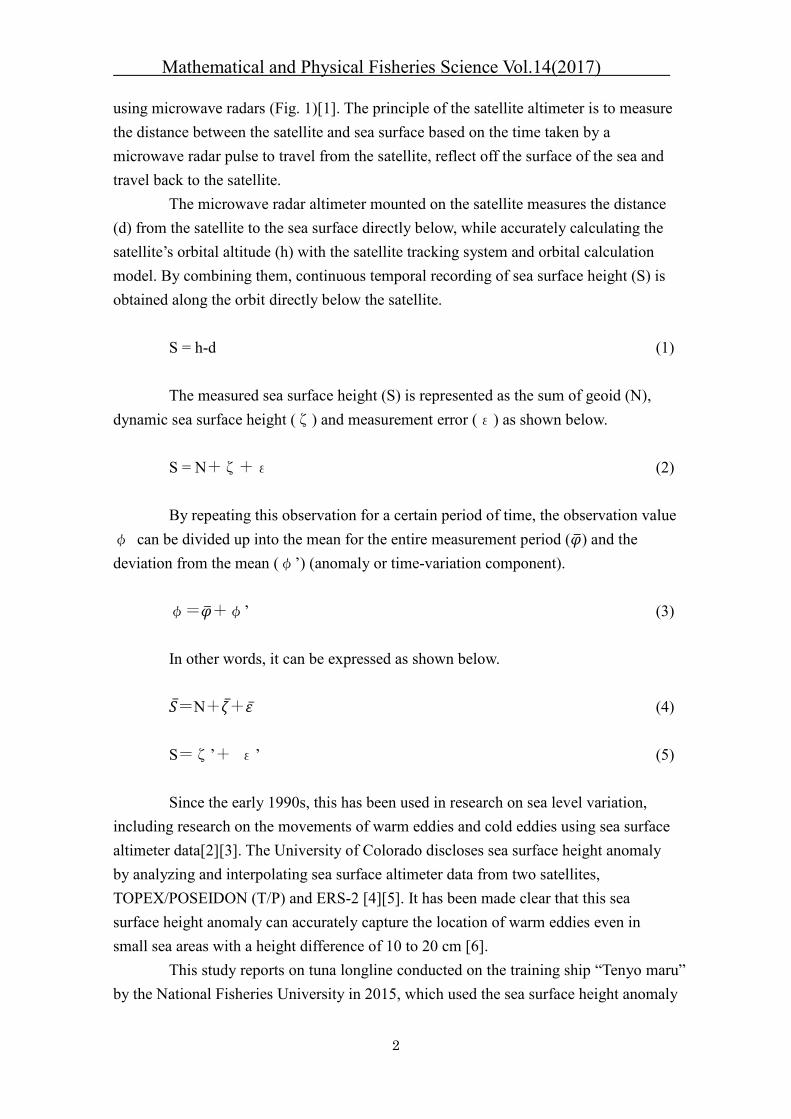
using microwave radars (Fig. 1)[1]. The principle of the satellite altimeter is to measure the distance between the satellite and sea surface based on the time taken by a microwave radar pulse to travel from the satellite, reflect off the surface of the sea and travel back to the satellite.
The microwave radar altimeter mounted on the satellite measures the distance (d) from the satellite to the sea surface directly below, while accurately calculating the satellite’s orbital altitude (h) with the satellite tracking system and orbital calculation model. By combining them, continuous temporal recording of sea surface height (S) is obtained along the orbit directly below the satellite.
S = h-d (1) The measured sea surface height (S) is represented as the sum of geoid (N),
dynamic sea surface height (ζ) and measurement error (ε) as shown below. S = N+ζ+ε (2) By repeating this observation for a certain period of time, the observation value
φ can be divided up into the mean for the entire measurement period ( ) and the deviation from the mean (φ’) (anomaly or time-variation component).
φ= +φ’ (3) In other words, it can be expressed as shown below. ̅=N+ +̅ ̅ (4) S=ζ’+ ε’ (5) Since the early 1990s, this has been used in research on sea level variation,
including research on the movements of warm eddies and cold eddies using sea surface altimeter data[2][3]. The University of Colorado discloses sea surface height anomaly by analyzing and interpolating sea surface altimeter data from two satellites, TOPEX/POSEIDON (T/P) and ERS-2 [4][5]. It has been made clear that this sea surface height anomaly can accurately capture the location of warm eddies even in small sea areas with a height difference of 10 to 20 cm [6].
This study reports on tuna longline conducted on the training ship “Tenyo maru” by the National Fisheries University in 2015, which used the sea surface height anomaly

Mathematical and Physical Fisheries Science Vol.14(2017)
3
as an indicator to search for fishing grounds.
2 Materials and methods The National Fisheries University’s training ship “Tenyo maru” conducted tuna
longline training in the low-latitude waters of the North Pacific Ocean from November 27 to December 2, 2015. The training used two types of lines: shallow lines (main line length: 300 m) and deep lines (main line length: 550 m). Furthermore, observations of vertical distribution for water temperature and salinity were conducted after each operation using CTD (Sea Bird Electronics) (Table 1). In addition, sea surface height (altimetry) charts for the waters permitted for training were obtained from the University of Colorado to grasp the deviation state. This was done from approximately one month prior to the date of the longline training, to use the information as an indicator to search for fishing grounds. Also, after the operation, the sea surface heights were detected for the location where the line was cast and for locations in the eight cardinal directions 0.2 degrees away from the casting location. The mean sea surface height and standard deviation were calculated using a total of nine data figures.
3 Results and Discussion The catch for six operations included a total of seven fish from four species:
three wahoo, Acanthocybium solandri, two shortnose spearfish, Tetrapturus angustirostris, one swordfish, Xiphias gladius and one bigeye tuna, Thunnus obesus (Table 2). In waters with sea surface height -9.2±4.0 cm (mean±standard deviation) (Fig. 2), one wahoo was caught (Table 2). The sea surface height anomaly chart for each operation is shown in Figures 2 to 7. At sea surface height -0.4±6.3 cm (Fig. 4), one wahoo and one shortnose spearfish were caught (Table 2). At mean sea surface height 0.7±5.2 cm (Fig. 5), one wahoo was caught (Table 2). At sea surface height -18.4±5.8 cm (Fig. 6), one wahoo and one swordfish were caught (Table 2). At sea surface height -0.4±5.7 cm (Fig. 7), one bigeye tuna was caught (Table 2). There was no catch at sea surface height 4.9±1.2 cm (Fig. 3), the area with the least variation in sea surface height between the operation location and surrounding waters (Table 2).
The observation results for CTD showed a difference in water temperature and salinity in north to south waters with depths of 0 to 100 meters, from the border near 13.6°N with the largest variation in sea surface height. In particular, salinity was low in the water layer with water depths of 0 to 50 meters in the northern area of the sea. In waters south of this area, in the water layer with water depths of 50 to 100 meters, salinity concentration tended to be higher (Fig. 8). It was verified that the sea surface

Mathematical and Physical Fisheries Science Vol.14(2017)
4
height anomaly charts were effective methods to predict the location and movement of warm eddies [6]. However, further research is needed to clarify whether tuna gather near the front of the warm water mass and cold water mass. In this study, the findings of the tuna longline training in 2015 were presented, but the data was insufficient to derive the relationship between water mass and fish catch. The research will be continued for training to be conducted in 2016 and after.
5 Acknowledgements We thank the crew of the training vessel “Tenyomaru” from National Fisheries University.
References [1] Measurement of ocean flow using a satellite sea surface altimeter
(http://www.esst.kyushu-u.ac.jp/~dmp/study/reserch/altimeter.html) (Search date: August 15, 2016) .
[2] K. Ichikawa (1998): Movement of warm water mass off Tohoku as seen by sea surface altimetry, Kaiyo Monthly, 13, 64−69.
[3] K. Ichikawa (2002): Research on sea-surface variations using satellite sea surface altimetry data, Oceanography in Japan, 11 (2), 305−319.
[4] R.R.Leben,G.H. Born, B.R. Engebreth(2002): Operational Altimeter Data Processing for Mesoscale Monitoring.Marine Geodesy,25,3−18.
[5] Y. Maekawa, M. Uchida, Y. Nagata (2001): Utilization of the near-real-time altimeter data given by Colorado Center for Astrodynamics Research of University of Colorado, The bulletin of the Faculty of Bioresources, Mie University, 27, 1-15.
[6] K. Yoshinaga,S. Masumitsu,M. Hidaka,M. Uchiyama,T. Azuma, R. Hukuda(2004) A basic study on the prediction method of tuna abundant regions using satellite altimetry sea surface height data. Mem.Fac,Fish.Kagoshima University,53,1-5.
Received September 2, 2016 Accepted January 4, 2017

Mathematical and Physical Fisheries Science Vol.14(2017)
5
Academic backgrounds: Hideaki Tanoue: 04/1997 – 03/2001 Undergraduate course of Department of Fishery Science
and Technology of National Fisheries University, Shimonoseki, Japan
04/2002 – 03/2004 Master’s course of Graduate School of National Fisheries University, Shimonoseki, Japan
04/2005 – 03/2009 Doctor’s course of Graduate School of The University of Tokyo, Tokyo, Japan
04/2009 – 03/2010 Ocean Research Institute, The University of Tokyo, Japan
04/2010 – 03/2011 Atmosphere and Ocean Research Institute, The University of Tokyo, Kashiwa, Japan
04/2011 – 03/2013 Policy Research, Ocean Policy Research Foundation ,Tokyo, Japan
04/2013 – present Department of Fishery Science and Technology, National Fisheries University, Shimonoseki, Japan
Research field: Behaviour, Ecology and Observation systems, Fisheries resources management, Integrated Costal Management
Masahiko Mohri: 04/1983 – 03/1987 Undergraduate course of Department of Fishery Science
and Technology of National Fisheries University, Shimonoseki, Japan
04/1987 – 03/1988 Advanced course of Fishery Science and Technology of National Fisheries University, Shimonoseki, Japan
04/1988 – 03/1990 Master’s course of Graduate School of Tokyo University of Fisheries, Tokyo, Japan
04/1990 – 03/1991 Doctor’s course of Graduate School of Tokyo University of Fisheries, Tokyo, Japan
04/1991 – present Department of Fishery Science and Technology, National Fisheries University, Shimonoseki, Japan
Research field: Fisheries information analysis Takafumi Itoh: 04/2006-03/2010 Undergraduate course of Department of Fishery Science
and Technology of National Fisheries University, Shimonoseki, Japan
04/2010-03/2011 Advanced course of Fishery Science and Technology of National Fisheries University, Shimonoseki, Japan
04/2011-present Crew of Fisheries Agency Research field: Navigation Masataka Kokatsu: 04/2002-03/2006 Undergraduate course of Department of Fishery Science

Mathematical and Physical Fisheries Science Vol.14(2017)
6
and Technology of National Fisheries University, Shimonoseki, Japan
04/2006-03/2007 Advanced course of Fishery Science and Technology of National Fisheries University, Shimonoseki, Japan
04/2007-present Crew of Fisheries Agency Research field: Navigation Hiroshi Gotoh: 04/1998-03/2002 Undergraduate course of Department of Fishery Science
and Technology of National Fisheries University, Shimonoseki, Japan
04/2002-03/2004 Advanced course of Fishery Science and Technology of National Fisheries University, Shimonoseki, Japan
04/2004-present Crew of Fisheries Agency Research field: Navigation Taketomo Enoshima: 04/1990-03/1994 Undergraduate course of Department of Fishery Science
and Technology of National Fisheries University, Shimonoseki, Japan
04/1995-03/1996 Advanced course of Fishery Science and Technology of National Fisheries University, Shimonoseki, Japan
04/1996-present Crew of Fisheries Agency Research field: Navigation Kazuhiro Hata: 04/1980-03/1985 Undergraduate course of Department of Fishery Science
and Technology of National Fisheries University, Shimonoseki, Japan
04/1985-03/1986 Advanced course of Fishery Science and Technology of National Fisheries University, Shimonoseki, Japan
04/1996-present Crew of Fisheries Agency Research field: Navigatio Yuuka Kawato: 04/2007-03/2011 Undergraduate course of Department of Fishery Science
and Technology of National Fisheries University, Shimonoseki, Japan
04/2011-03/2012 Advanced course of Fishery Science and Technology of National Fisheries University, Shimonoseki, Japan
04/2012-present Crew of Fisheries Agency Research field: Navigation Makoto Niitani: 04/1996-03/2000 Undergraduate course of Department of Fishery Science
and Technology of National Fisheries University, Shimonoseki, Japan
04/2000-03/2001 Advanced course of Fishery Science and Technology of

Mathematical and Physical Fisheries Science Vol.14(2017)
7
National Fisheries University, Shimonoseki, Japan 04/2001-present Crew of Fisheries Agency Research field: Navigation Yukio Okita: 04/1995-03/1999 Undergraduate course of Department of Fishery Science
and Technology of National Fisheries University, Shimonoseki, Japan
04/1999-03/2000 Advanced course of Fishery Science and Technology of National Fisheries University, Shimonoseki, Japan
04/2000-present Crew of Fisheries Agency Research field: Navigation Satoshi Omi: 04/1989-03/1993 Undergraduate course of Department of Fishery Science
and Technology of National Fisheries University, Shimonoseki, Japan
04/1993-03/1994 Advanced course of Fishery Science and Technology of National Fisheries University, Shimonoseki, Japan
04/1994-present Crew of Fisheries Agency Research field: Navigation Kiyohiko Fukami: 04/1986-03/1990 Undergraduate course of Department of Fishery Science
and Technology of National Fisheries University, Shimonoseki, Japan
04/1990-03/1991 Advanced course of Fishery Science and Technology of National Fisheries University, Shimonoseki, Japan
04/1991-present Crew of Fisheries Agency Research field: Navigation Tadashi Kamano: 04/1980-03/1984 Undergraduate course of Department of Fishery Science
and Technology of National Fisheries University, Shimonoseki, Japan
04/1984-03/1985 Advanced course of Fishery Science and Technology of National Fisheries University, Shimonoseki, Japan
04/1996-present Crew of Fisheries Agency Research field: Navigation Yoichi Gotoh: 04/1993 – 03/1997 Undergraduate course of Department of Fishery Science
and Technology of Shimonoseki University of Fisheries, Shimonoseki, Japan
04/1997 – 03/1998 Advanced course of Fishery Science and Technology of Shimonoseki University of Fisheries, Shimonoseki, Japan
04/1998 -present Marine Science High School, Kanagawa, Japan

Mathematical and Physical Fisheries Science Vol.14(2017)
8
Research field: Navigation Tomozumi Kawashita: 04/2013 – present Undergraduate course of Department of Fishery Science
and Technology of National Fisheries University, Shimonoseki, Japan
Research field: Navigation
Fig. 1 Measurement principle of satellite sea surface altimeter [1]. (http://www.esst.kyushu-u.ac.jp/~dmp/study/reserch/altimeter.html)
Mathematical and Physical Fisheries Science Vol.14(2017)
9
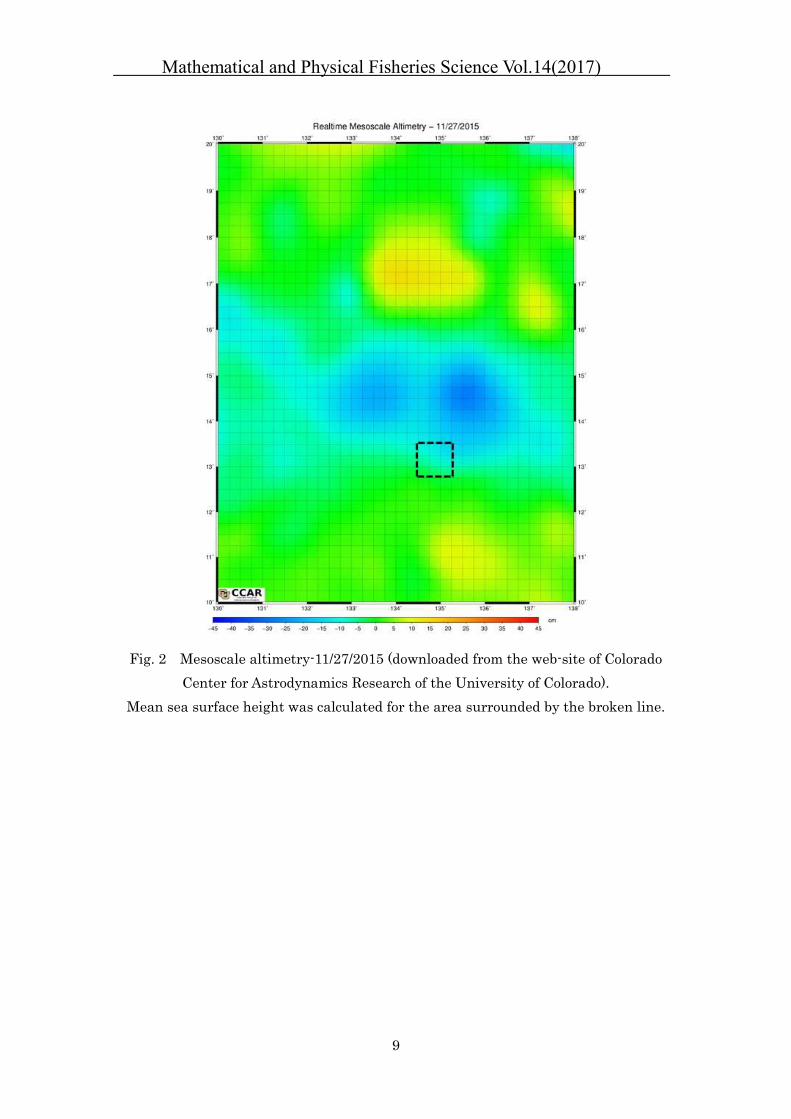
Fig. 2 Mesoscale altimetry-11/27/2015 (downloaded from the web-site of Colorado Center for Astrodynamics Research of the University of Colorado).
Mean sea surface height was calculated for the area surrounded by the broken line.

Mathematical and Physical Fisheries Science Vol.14(2017)
10
Fig. 3 Mesoscale altimetry-11/28/2015 (downloaded from the web-site of Colorado Center for Astrodynamics Research of the University of Colorado).
Mean sea surface height was calculated for the area surrounded by the broken line.

Mathematical and Physical Fisheries Science Vol.14(2017)
11
Fig. 4 Mesoscale altimetry-11/29/2015 (downloaded from the web-site of Colorado Center for Astrodynamics Research of the University of Colorado).
Mean sea surface height was calculated for the area surrounded by the broken line.

Mathematical and Physical Fisheries Science Vol.14(2017)
12
Fig. 5 Mesoscale altimetry-11/30/2015 (downloaded from the web-site of Colorado Center for Astrodynamics Research of the University of Colorado).
Mean sea surface height was calculated for the area surrounded by the broken line.

Mathematical and Physical Fisheries Science Vol.14(2017)
13
Fig. 6 Mesoscale altimetry-12/01/2015 (downloaded from the web-site of Colorado Center for Astrodynamics Research of the University of Colorado).
Mean sea surface height was calculated for the area surrounded by the broken line.

Mathematical and Physical Fisheries Science Vol.14(2017)
14
Fig. 7 Mesoscale altimetry-12/02/2015 (downloaded from the web-site of Colorado Center for Astrodynamics Research of the University of Colorado).
Mean sea surface height was calculated for the area surrounded by the broken line.

Mathematical and Physical Fisheries Science Vol.14(2017)
15
Fig. 8 Cross section of temperature and salinity by CTD from 13°N to 14°N, 11/27-12/02/2015.

Mathematical and Physical Fisheries Science Vol.14(2017)
16
Table 1. Locations of CTD observation.
Table 2. Fishes caught and environmental conditions (Depth of hook and altimetry sea. surface height).
(min.) (min.)1 2015/11/27 13 - 04.6 N 135 - 00.4 E2 2015/11/28 12 - 23.3 N 133 - 49.2 E3 2015/11/29 13 - 09.6 N 133 - 12.7 E4 2015/11/30 13 - 08.6 N 134 - 05.6 E5 2015/12/1 14 - 00.6 N 134 - 17.2 E6 2015/12/2 13 - 39.5 N 135 - 04.4 E
Latitude LongitudeDateSt. No.
(deg.) - (deg.) -
Date Fishes caught Depth of hook (m)* Sea surface height (cm) (Ave.±SD)
2015/11/27 Wahoo 105 -9.2 ± 4.0
2015/11/28 - - 4.9 ± 1.2
2015/11/29 Wahoo 147
Shortnose spearfish 104
2015/11/30 Wahoo 105 0.7 ± 5.2
2015/12/1 Shortnose spearfish 104
Swordfish 150
2015/12/2 Bigeye 219 -0.4 ± 5.7
*: Depeh of hook is calculated using shortening rates
-18.4 ± 5.8
-0.4 ± 6.3