TUNA FISHERY REPORT CARD 2017 - Pacific Islands … · This Tuna Fishery Report Card provides...
4
Photo: Lisa Williams-Lahari Introduction This Tuna Fishery Report Card provides high-level advice on the current status of Pacific tuna fisheries in relation to the goals, indicators and strategies adopted by Forum Leaders in the Regional Roadmap for Sustainable Pacific Fisheries. The report card has been modified from the first version to take account of the work of the Taskforce on Increasing Economic Returns from Fisheries, which was established by the Forum Leaders to develop a programme that will deliver real results within 5 years. This was agreed by Leaders in 2016, so the economic indicators now reflect Taskforce-agreed targets. All data for 2016 at this point should be considered preliminary. TUNA FISHERY REPORT CARD 2017 tuna fishery report card 2017.indd 1 30/08/2017 15:45
Transcript of TUNA FISHERY REPORT CARD 2017 - Pacific Islands … · This Tuna Fishery Report Card provides...
Phot
o: L
isa W
illia
ms-
Laha
ri
IntroductionThis Tuna Fishery Report Card provides high-level advice on the current status of Pacific tuna fisheries in relation to the goals, indicators and strategies adopted by Forum Leaders in the Regional Roadmap for Sustainable Pacific Fisheries. The report card has been modified from the first version to take account of the work of the Taskforce on Increasing Economic Returns from Fisheries, which was established by the Forum Leaders to develop a programme that will deliver real results within 5 years. This was agreed by Leaders in 2016, so the economic indicators now reflect Taskforce-agreed targets.
All data for 2016 at this point should be considered preliminary.
TUNA FISHERY REPORT CARD 2017
tuna fishery report card 2017.indd 1 30/08/2017 15:45
Goal 1 – Sustainability
This Report Card does not cover Pacific bluefin tuna as that stock is not caught by FFA fleets or in FFA EEZs. As such FFA members have no control over its exploitation and limited influence on the design of management measures.
2.0
1.5
1.0
0.5
0.0
80%60%40%20%0 100%
Skipjack
SP albacore
Bigeye
Committee; lines crossing on each point indicate the range of uncertainty.
Stock size index
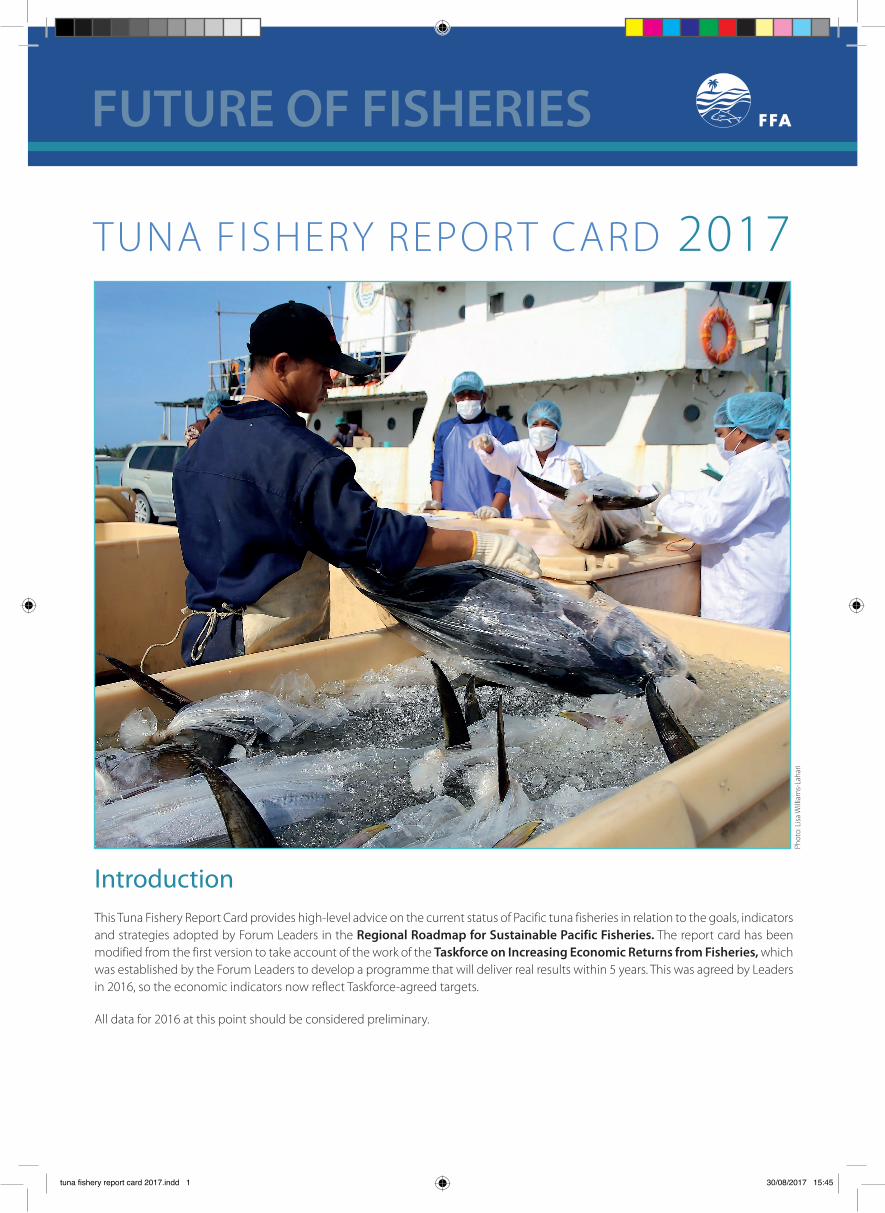
"Majuro" Plot
Skipjack tuna is not overfished and overfishing is not occurring. An assessment in 2016 showed an improvement in the stock status relative to previous years, and this is reflected in the plot which shows the stock is above the TRP.
Other species for which stocks have been assessed and require management action include:
– Southwest Pacific striped marlin – Western and central north Pacific
striped marlin– Silky shark– Oceanic whitetip shark
Scientific advice is to reduce catches and/or fishing effort on all of these stocks.
Yellowfin tuna according to the 2017 assessment is not overfished and overfishing is not occurring. The stock is however approaching the ‘cross hairs’, particularly when the uncertainty of the assessment is taken into account. This plot only shows status against the biological Limit Reference Point. No work has been undertaken yet as to where a Target Reference Point indicative of an economically viable fishery would be placed.
South Pacific albacore tuna is not overfished and overfishing is not occurring. However the fishery is facing serious economic challenges. Parties to the Tokelau Arrangement have made some progress towards agreement on measures to reduce effort in their own waters in order to maintain economically viable catch rates.
Bigeye tuna stock, according to the latest assessment undertaken in 2017, is NOT overfished and overfishing is NOT occurring. The change in stock status is a result of the incorporation of a new growth curve and spatial structure into the model and recent high recruitment. Attribution of the improve stock status to management measures or environmental conditions is not possible at this time with the WCPFC Science Committee recommending that fishing mortality not be increased from current levels, especially noting the range of uncertainties. The science committee initiated work to address some of this uncertainty.
tuna fishery report card 2017.indd 2 30/08/2017 15:45

Goal 2 – Value
The Roadmap originally set a goal of doubling the value of the region’s tuna catch by 2024. While some increase in value can be expected as prices recover and increase, this target is probably not realistic and does not reflect the returns to Pacific Island countries.
Increasing the share of the catch by the FFA fleets by 25% over 5 years is the agreed Taskforce Programme objective, both to increase returns and to strengthen coastal state control of the fishery. It will, however, require FFA members to discharge their flag state responsibilities under international law and ensure that new arrangements deliver real economic benefits.
The share of the catch value by FFA fleets increased from 29% in 2010 to 38% in 2015 and to 40% in 2016, mainly due to increased participation in the purse seine fishery. The target for 2020 is 47%, over the period with the foreign fleet share reducing from its current level of 60% to 53%.
Economic returnsThe real economic returns to FFA member countries are measured through two components: access fees show government revenues from foreign fleets while value added to GDP captures the benefits from domestic fleets. The 5 year goal is to increase each by 25%.
Access fees: The figure at right shows very large growth in the overall value of access. However, almost all of this growth has been achieved from foreign flagged purse seine vessels operating under the Vessel Day Scheme. These two figures demonstrate that there are clear challenges and opportunities to increase returns from the longline fishery. Returns from the FSM arrangement show only payments to another party.
GDP contribution (value added): The contribution to GDP of the harvest sector of the tuna fishery (that is, fishing by domestic and locally-based fleets in all waters) increased between 2010 and 2012 reflecting increases in output and prices, especially for the purse seine fishery. With falling prices through to 2015, value added has decreased. This trend has reversed in 2016, however, as prices have recovered.
0
100
200
300
400
500
600
2010
2011
2012
2013
2014
2015
2016
2017
2018
2019
2020
Value of foreign access fees by Arrangement, 2010-2016 and 2020 target (US$)
Longline
Purse seine bilaterals
UST
FSMA
million
Value of foreign access fees by Arrangement, 2010-2016 and 2020 target (US$)
0
100
200
300
400
500
600
2010
2011
2012
2013
2014
2015
2016
2017
2018
2019
2020
Value addedbyfishery2010-2016 and2020 target(US$)
LonglinePurseseinePole&lineOther
million
Value added by fishery 2010-2016 and 2020 target (US$)
0%
25%
50%
75%
100%
2010
2011
2012
2013
2014
2015
2016
2017
2018
2019
2020
Fleet shares of value of tuna caught in FFA EEZs 2010-2016 and 2020 target
FFAfleet Foreignfleets
Fleet shares of value of tuna caught in FFA EEZs 2010-2016 and 2020 target
tuna fishery report card 2017.indd 3 30/08/2017 15:45
Goal 3 – Employment
Trade and investment
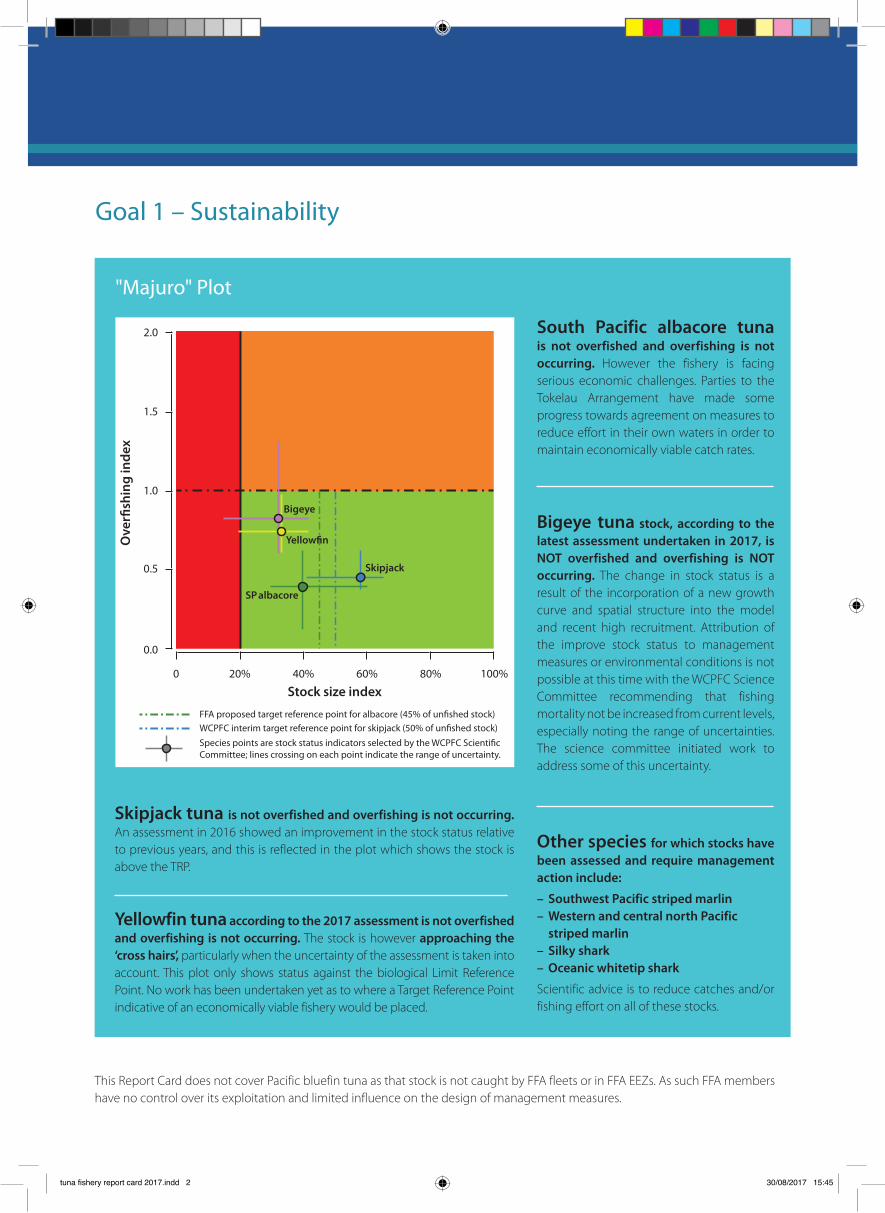
Total direct employment in the fishing industry (FFA Pacific Island members public and private sector) continues to grow, providing nearly 25,000 jobs in 2016. The Roadmap anticipated an increase of 18,000 jobs from the 2013 total, with 9,000 new jobs created in the first 5 years. Importantly, the Roadmap also focuses on ways to increase the spread of employment across FFA members, noting that it is very concentrated at present around the processing industry in Melanesia.
There has been some growth in crew employment and new initiatives will seek to build on this trend.
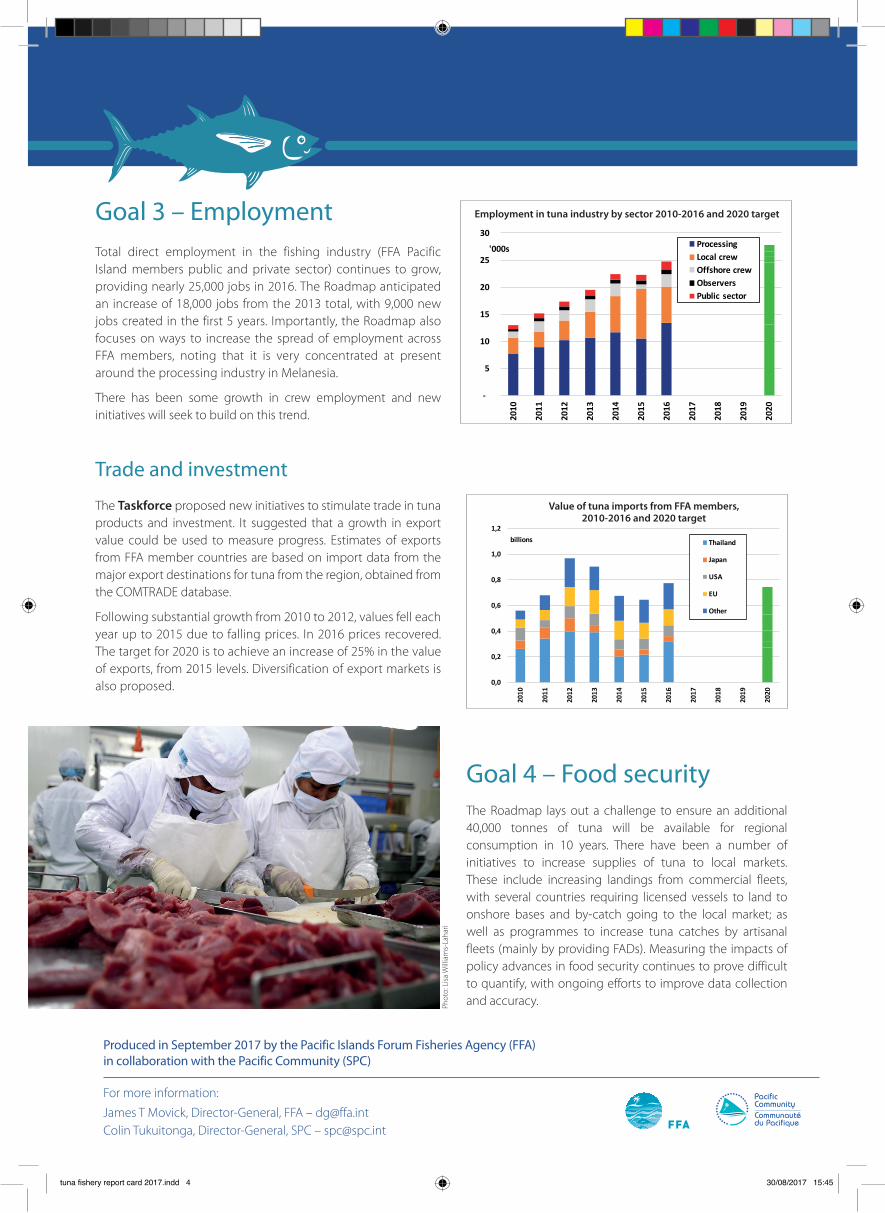
The Taskforce proposed new initiatives to stimulate trade in tuna products and investment. It suggested that a growth in export value could be used to measure progress. Estimates of exports from FFA member countries are based on import data from the major export destinations for tuna from the region, obtained from the COMTRADE database.
Following substantial growth from 2010 to 2012, values fell each year up to 2015 due to falling prices. In 2016 prices recovered. The target for 2020 is to achieve an increase of 25% in the value of exports, from 2015 levels. Diversification of export markets is also proposed.
-
5
10
15
20
25
30
2010
2011
2012
2013
2014
2015
2016
2017
2018
2019
2020
Employmentintuna industrybysector2010-2016and2020target
ProcessingLocalcrewOffshorecrewObserversPublic sector
'000s
Employment in tuna industry by sector 2010-2016 and 2020 target
0,0
0,2
0,4
0,6
0,8
1,0
1,22010
2011
2012
2013
2014
2015
2016
2017
2018
2019
2020
billions
ValueoftunaimportsfromFFAmembers, 2010-2016 and2020target
Thailand
Japan
USA
EU
Other
Value of tuna imports from FFA members, 2010-2016 and 2020 target
Goal 4 – Food securityThe Roadmap lays out a challenge to ensure an additional 40,000 tonnes of tuna will be available for regional consumption in 10 years. There have been a number of initiatives to increase supplies of tuna to local markets. These include increasing landings from commercial fleets, with several countries requiring licensed vessels to land to onshore bases and by-catch going to the local market; as well as programmes to increase tuna catches by artisanal fleets (mainly by providing FADs). Measuring the impacts of policy advances in food security continues to prove difficult to quantify, with ongoing efforts to improve data collection and accuracy.
Produced in September 2017 by the Pacific Islands Forum Fisheries Agency (FFA) in collaboration with the Pacific Community (SPC)
For more information:
James T Movick, Director-General, FFA – [email protected] Tukuitonga, Director-General, SPC – [email protected]
Phot
o: L
isa W
illia
ms-
Laha
ri
tuna fishery report card 2017.indd 4 30/08/2017 15:45