Tuna Fisheries Report – Papua New Guinea · the tuna longline fishery are also accounted for...
12
1st Meeting of the Scientific Committee of the Western and Central Pacific Fisheries Commission WCPFC–SC1 Noumea, New Caledonia 8–19 August 2005 Tuna Fisheries Report – Papua New Guinea (Prepared for the Science Committee Meeting Noumea, New Caledonia 8 th –19 th August, 2005) L. Kumoru Papua New Guinea National Fisheries Authority, Port Moresby, PNG August 2005 WCPFC–SC1 FR WP–10
Transcript of Tuna Fisheries Report – Papua New Guinea · the tuna longline fishery are also accounted for...

1st Meeting of the Scientific Committee of the Western and Central Pacific Fisheries Commission
WCPFC–SC1 Noumea, New Caledonia
8–19 August 2005
Tuna Fisheries Report – Papua New Guinea
(Prepared for the Science Committee Meeting Noumea, New Caledonia 8th –19th August, 2005)
L. Kumoru
Papua New Guinea National Fisheries Authority, Port Moresby, PNG
August 2005
WCPFC–SC1 FR WP–10

1
1. Background to the fishery Papua New Guinea’s Exclusive Economic Zone, 2.4 million km2 in extent, is one of the largest and more productive in the Western and Central Pacific Ocean. Industrial scale fisheries for tuna and associated species have operated since the 1950s, and in certain years, around 10% of the global catch of the main market species of tuna has been taken within the Papua New Guinea Exclusive Economic Zone (PNG EEZ). The tuna fishery is the largest of Papua New Guinea’s fisheries and represents a balance of both domestic industry development and foreign (DWFN) access arrangements. Currently, domestic longline vessels and purse seine vessels - domestic, locally-based foreign and foreign access - operate under various arrangements. A large domestic pole-and-line fishery operated in the past but has not been active since 1986. Since 1999, the development of the tuna fishery has been guided by a National Tuna Fishery Management Plan which establishes an overall management structure, and an application framework for the longline, purse seine and pole-and-line fisheries, including licence limits and total allowable catches (TACs). The PNG purse seine fishery operates within the guidelines of several important regional and sub-regional arrangements eg PNA, Palau, and FSM Arrangements. The entry into force of the Western and Central Pacific Fisheries Convention, with many implications for regional and national tuna management, is anticipated. Under the present Government’s export-driven economic growth strategy, onshore investment in tuna processing for export is being actively encouraged. Foreign and domestic access by purse seine vessels is, as a result, increasingly linked to commitment to onshore investment, especially in the form of tuna processing. 2. National and Foreign Fleet structure 2.1 National Fleet structure Domestic longline Since 1995, participation in the PNG longline fishery, under a domestication policy, has been restricted to national or citizen companies, with limited allowance for dry charter of additional foreign vessels. Although the fishery began primarily as a fresh chilled tuna fishery, some vessels with freezer capacity increasingly targeted shark, beginning on a large scale in 1997. Since 2002, a distinct shark longline fishery has been recognized, with separate statistical arrangements and monitoring activity assigned to this fishery. Under the Shark Longline Management Plan, effort limits (vessel numbers and hook numbers) and a TAC have been established. Shark catches by the tuna longline fishery are also accounted for under the Plan. During 2004, 42 tuna longline and 9 shark longline licences were issued, though only 39 tuna longline vessels were active. One tuna longline vessel was licensed under a charter arrangement. During 2005, total tuna longline vessel numbers have remained stable, with a limit of 9 on shark vessels, although individual tuna longline vessels continue to enter and leave the fishery. A trial handline fishery involving two Philippine vessels (bancas or pump boats) was carried out for a year commencing in December 2002; interest in this fishing method, considered part of the longline/midwater fishery, is growing. This fishing method is now recognised as a fishery and is guided by a management guideline under the National Tuna Fishery Management Plan as well.
2
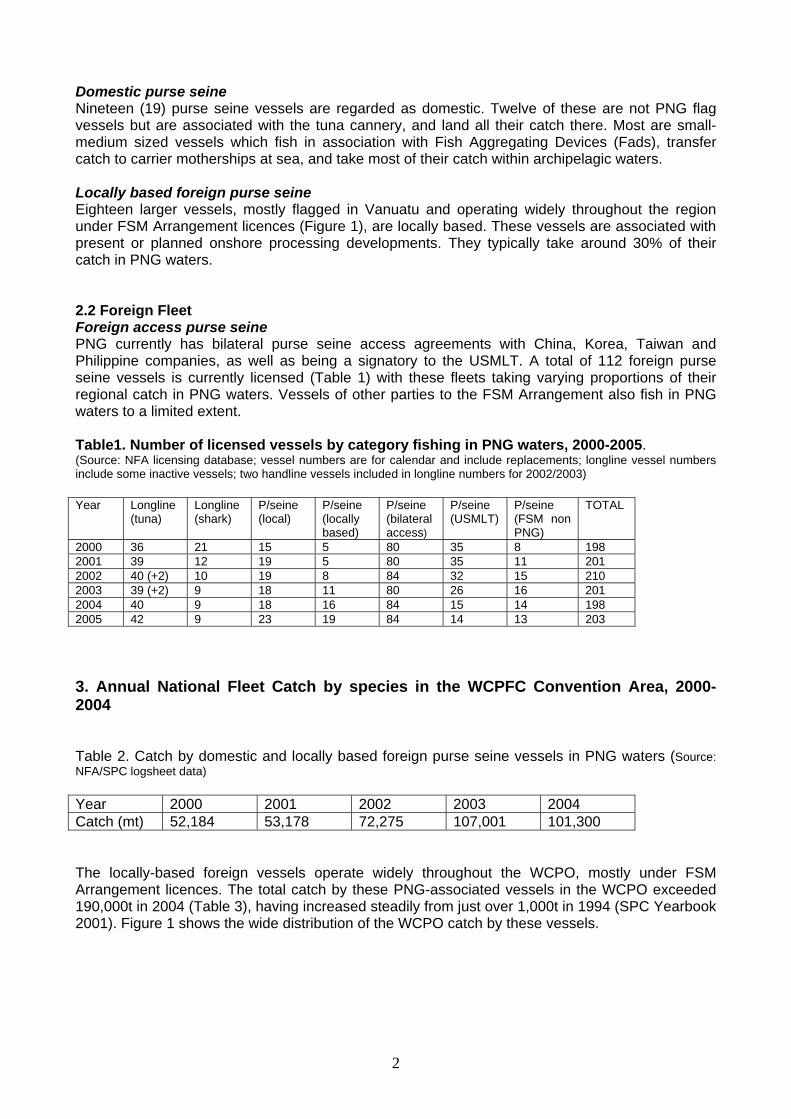
Domestic purse seine Nineteen (19) purse seine vessels are regarded as domestic. Twelve of these are not PNG flag vessels but are associated with the tuna cannery, and land all their catch there. Most are small-medium sized vessels which fish in association with Fish Aggregating Devices (Fads), transfer catch to carrier motherships at sea, and take most of their catch within archipelagic waters. Locally based foreign purse seine Eighteen larger vessels, mostly flagged in Vanuatu and operating widely throughout the region under FSM Arrangement licences (Figure 1), are locally based. These vessels are associated with present or planned onshore processing developments. They typically take around 30% of their catch in PNG waters. 2.2 Foreign Fleet Foreign access purse seine PNG currently has bilateral purse seine access agreements with China, Korea, Taiwan and Philippine companies, as well as being a signatory to the USMLT. A total of 112 foreign purse seine vessels is currently licensed (Table 1) with these fleets taking varying proportions of their regional catch in PNG waters. Vessels of other parties to the FSM Arrangement also fish in PNG waters to a limited extent. Table1. Number of licensed vessels by category fishing in PNG waters, 2000-2005. (Source: NFA licensing database; vessel numbers are for calendar and include replacements; longline vessel numbers include some inactive vessels; two handline vessels included in longline numbers for 2002/2003) Year Longline
(tuna) Longline (shark)
P/seine (local)
P/seine (locally based)
P/seine (bilateral access)
P/seine (USMLT)
P/seine (FSM non PNG)
TOTAL
2000 36 21 15 5 80 35 8 198 2001 39 12 19 5 80 35 11 201 2002 40 (+2) 10 19 8 84 32 15 210 2003 39 (+2) 9 18 11 80 26 16 201 2004 40 9 18 16 84 15 14 198 2005 42 9 23 19 84 14 13 203 3. Annual National Fleet Catch by species in the WCPFC Convention Area, 2000-2004 Table 2. Catch by domestic and locally based foreign purse seine vessels in PNG waters (Source: NFA/SPC logsheet data) Year 2000 2001 2002 2003 2004 Catch (mt) 52,184 53,178 72,275 107,001 101,300 The locally-based foreign vessels operate widely throughout the WCPO, mostly under FSM Arrangement licences. The total catch by these PNG-associated vessels in the WCPO exceeded 190,000t in 2004 (Table 3), having increased steadily from just over 1,000t in 1994 (SPC Yearbook 2001). Figure 1 shows the wide distribution of the WCPO catch by these vessels.

3
Table 3. Catch by domestic and locally-based foreign purse seine vessels in the region (Source: SPC 2005) Year 2000 2001 2002 2003 2004 Catch (mt) 69,299 90,697 122,793 153,367 194,939 Vessels 20 24 27 33 35 CPUE 23.7 20.8 25.5 23.5 26.5 *Cpue in mt per day
140E 150E
10S
0
140E 150E 160E 170E 180
160E 170E 180
10S0
Figure1. Distribution of regional catch by PNG-associated purse seine vessels, 2004 4. Annual Home EEZ Catch by gear, fleet and species, 2000-2004 Longline (tuna) There has been no licensed access by DWFN longline vessels to PNG waters since 1987, with a peak historical catch of nearly 20,000t (1978) achieved by Japanese vessels during this earlier period. Domestic longline activity started in 1995, following the introduction of the domestication policy. Prior to 2001, logsheet coverage of the domestic fishery has been poor and catches are difficult to estimate with any confidence. Whilst this situation is improving, coverage has remained seriously incomplete until recently. Table 5 summarizes logsheet data held for all longline vessels (tuna and shark), since they were not separated until 2002. Estimates of the tuna longline catch for 2004 from available logsheet data indicate a total catch of 3,918t (all species), of which 1,854.t yellowfin, 324t bigeye and 1,536t albacore and 203t of other fish. The catch is thus dominated by yellowfin (47.3% of the total catch and 50% of the tuna catch) with lesser catches of bigeye. Quantities of albacore have increased in recent years as a result of increasing effort mostly in the Coral Sea. With tuna comprising close to 85% of the catch by number and weight, levels of by-catch are low, based on observer data, with shark around 6% or less, and billfish 9%. Other species typically comprise less than 1% of the catch.

4
Catch rates have generally been much lower than the Japanese historical catch rates. Most of the catch in 2004 was taken in the Coral and Solomon Seas. The optimal fishing areas, in terms of catch rates and bigeye proportion in the catch, are in the north of the EEZ. Distant from the principal ports of Port Moresby and Lae, these waters remain lightly fished. The lack of activity there contrasts with the large catches in directly adjacent waters by foreign vessels. Table 4. Domestic longline catches (Source: Logsheet data held by NFA, known to be incomplete for 2004; shark and minor quantities of by-catch are included in the total)
* Cpue in numbers per 100 hooks
145E 150E
15S
10S
5S
145E 150E 155E
00
155E
15S10S
5S
Figure 2. Distribution of catch by PNG tuna longline vessels, 2004
Comparisons of logsheet and export data (Table 5) suggest that the logsheet coverage has been complete since 2002, although not all the tuna catch is exported. Longline (shark) The fishery started on a significant scale in 1997, when vessels licensed as tuna vessels and with freezer capacity began targeting shark. This quickly expanded to over 20 vessels, although many of these did not fish for lengthy periods of time. Data coverage prior to 2002 is sparse (less than 30%) with poor facility on the existing tuna logsheets to record shark catch. Shark and tuna
Effort Albacore Bigeye Yellowfin Others Total Year hhooks # vls mt cpue mt cpue mt cpue mt cpue mt cpue2000 29556 45 89.5 0.2 116.3 0.2 609.1 0.8 1253.6 1.5 2068.5 2.72001 48384 44 98.5 0.1 199.2 0.2 1466.0 1.1 809.4 0.7 2573.1 2.02002 57396 49 136.0 0.1 306.9 0.2 1675.7 1.1 1229.6 0.8 3348.3 2.32003 66336 50 855.1 0.8 387.9 0.2 1736.6 1.0 361.0 0.2 3340.5 2.22004 76022 44 1536.8 1.2 323.5 0.1 1854.4 0.9 202.9 0.1 3917.6 2.3

5
catches taken by longline vessels targeting shark, now limited to nine, have been included in Table 5. Estimates of the shark longline catch for 2004 from the available logsheet and landings data, indicate a total catch (all species) of 1,474t, with 1,240t of dressed shark (84%), and 71t of G&G tuna (5%). Dressed Marlin is 46t (3%), Swordfish is 57t (4%), sailfish18t (1%), and various other fish species 42t (3%) make up the remainder of the catch. The main shark species taken, based on extensive observer data, are silky shark, silvertip, grey reef, black tip and oceanic white-tip, although species composition of the catch varies considerably by area. Based on available export data, 1,240t of frozen shark meat (more than 1,000t whole weight of shark) was exported in 2004(Table 5), suggesting that considerable and increasing quantities of shark are being processed and consumed locally. Table 5. Comparison of declared catch (logsheet data) and exports for tuna and shark taken in the longline fishery (Source : NFA data; tuna and shark catch dressed weight; shark whole weight equivalents are bracketed in export figures; 2004 figures are incomplete)
TUNA SHARK Year
Declared l’sheet catch
Chilled exports
Coverage as % of exports
Logsheet /landings catch
Frozen exports
Coverage as % of exports
2000 749 1,196 63% 585 1,747 (2,864) 33% 2001 1,504 1,857 81% 391 1,618 (2,697) 24% 2002 2,141 2,106 102% 1,531 1,330 (2,217) 115% 2003 2,920 2,092 140% 907.2 1,274 (2,123) 71% 2004 3,918 2,111 186% 1,240 756 (1260) 164% Purse seine (local and locally based foreign) The catch by local licensed and locally based foreign vessels in PNG waters continues to increase (Table 7), and exceeded 100,000t in 2004 as was in 2003. It now makes up over 30% of the total purse seine tuna catch in the EEZ. Skipjack contributes around 80% of the declared catch by species, with yellowfin most of the remainder. The proportion of yellowfin in the declared catch has exceeded 30% in 2001 and 2002 but has dropped in the most recent two years. Observer data suggest that the percentage of yellowfin and bigeye in the catch in associated sets may be even higher, as much as 60% of the total by weight from these sets. Most of the catch by the locally licensed vessels has been taken in association with anchored Fads; recent adoption of an FAD Management policy now see restrictions placed on FAD numbers and operations, due to resource and gear conflict concerns.
6
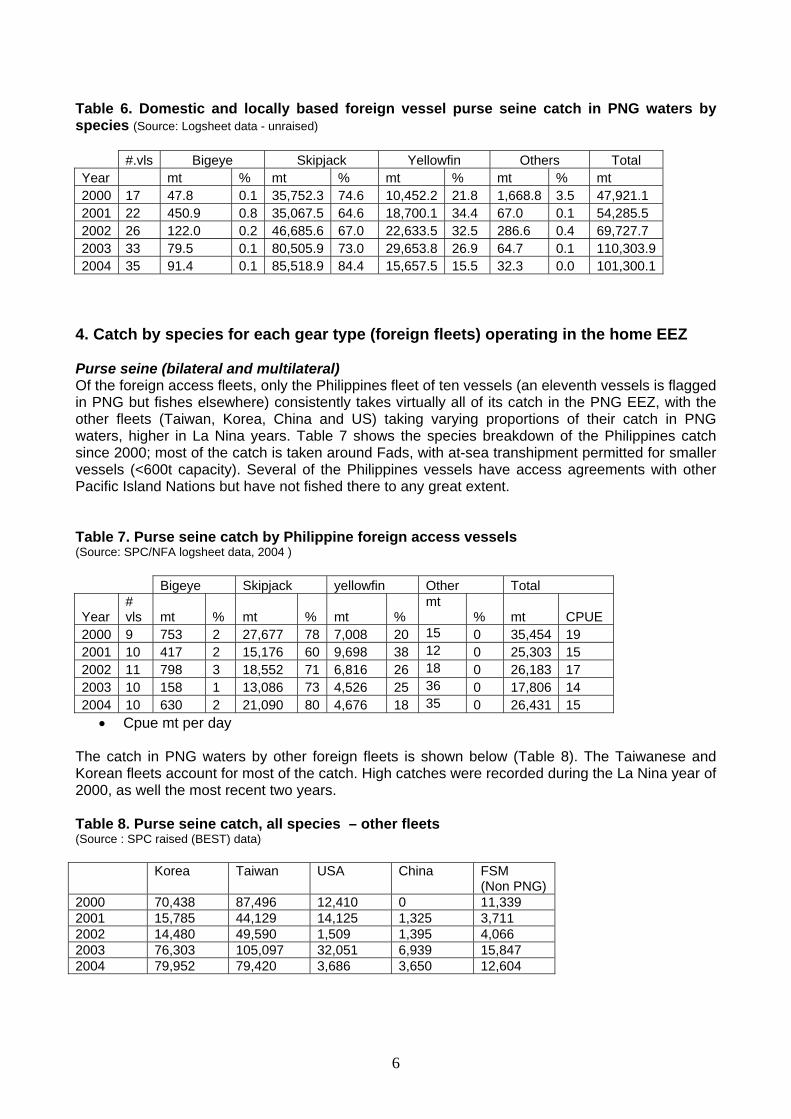
Table 6. Domestic and locally based foreign vessel purse seine catch in PNG waters by species (Source: Logsheet data - unraised) #.vls Bigeye Skipjack Yellowfin Others Total Year mt % mt % mt % mt % mt 2000 17 47.8 0.1 35,752.3 74.6 10,452.2 21.8 1,668.8 3.5 47,921.1 2001 22 450.9 0.8 35,067.5 64.6 18,700.1 34.4 67.0 0.1 54,285.5 2002 26 122.0 0.2 46,685.6 67.0 22,633.5 32.5 286.6 0.4 69,727.7 2003 33 79.5 0.1 80,505.9 73.0 29,653.8 26.9 64.7 0.1 110,303.92004 35 91.4 0.1 85,518.9 84.4 15,657.5 15.5 32.3 0.0 101,300.1
4. Catch by species for each gear type (foreign fleets) operating in the home EEZ Purse seine (bilateral and multilateral) Of the foreign access fleets, only the Philippines fleet of ten vessels (an eleventh vessels is flagged in PNG but fishes elsewhere) consistently takes virtually all of its catch in the PNG EEZ, with the other fleets (Taiwan, Korea, China and US) taking varying proportions of their catch in PNG waters, higher in La Nina years. Table 7 shows the species breakdown of the Philippines catch since 2000; most of the catch is taken around Fads, with at-sea transhipment permitted for smaller vessels (<600t capacity). Several of the Philippines vessels have access agreements with other Pacific Island Nations but have not fished there to any great extent. Table 7. Purse seine catch by Philippine foreign access vessels (Source: SPC/NFA logsheet data, 2004 ) Bigeye Skipjack yellowfin Other Total
Year # vls mt % mt % mt %
mt % mt CPUE
2000 9 753 2 27,677 78 7,008 20 15 0 35,454 19 2001 10 417 2 15,176 60 9,698 38 12 0 25,303 15 2002 11 798 3 18,552 71 6,816 26 18 0 26,183 17 2003 10 158 1 13,086 73 4,526 25 36 0 17,806 14 2004 10 630 2 21,090 80 4,676 18 35 0 26,431 15
• Cpue mt per day
The catch in PNG waters by other foreign fleets is shown below (Table 8). The Taiwanese and Korean fleets account for most of the catch. High catches were recorded during the La Nina year of 2000, as well the most recent two years. Table 8. Purse seine catch, all species – other fleets (Source : SPC raised (BEST) data) Korea Taiwan USA China FSM
(Non PNG) 2000 70,438 87,496 12,410 0 11,339 2001 15,785 44,129 14,125 1,325 3,711 2002 14,480 49,590 1,509 1,395 4,066 2003 76,303 105,097 32,051 6,939 15,847 2004 79,952 79,420 3,686 3,650 12,604

7
5. Total Home EEZ catch, for all species, all gears and all fleets combined-2000-2004 The estimated total catch by all vessels fishing in the PNG EEZ for the past five years (2000-2004 inclusive) is shown in Table 9, and is comprised for the most part of purse seine catches (99% of the total catch). The considerable inter-annual variations seen in these catches is the result of both large-scale environmental events (ENSO) affecting surface tuna availability in the PNG EEZ (higher in La Nina years). The average annual purse seine catch in the EEZ has been around 260,000t during this recent five-year period, roughly 20% of the regional purse seine catch. Table 9 Total catch by all vessels fishing in PNG waters (Source: Purse seine - SPC raised data (BEST) from logsheets and landings data; longline - NFA logsheet data; incomplete but including catches by tuna and shark longliners; some by-catch included) Year 2000 2001 2002 2003 2004 Historical
high Purse seine
280,444 160,710 166,356 370,153 309,109 370,153 (2003)
Longline 1,561 2,289 3,819 4,389 3,918 19,584 (1978)
Pole&line 0 0 0 0 0 74,649 (1974)
TOTAL 282,005 162,999 170,175 374,542 313,027 The purse seine catch in the EEZ by domestic vessels, and foreign vessels based in PNG, the latter now numbering over 37 in total, has increased steadily since the establishment of the Madang cannery in 1997, and through more recent association with onshore commitments (Table 2). It is now about 30% of the total purse seine catch in the EEZ and is expected to increase further as new onshore developments come on stream and concurrently, bilateral access arrangements are accorded lower priority. 5.1 Catch rates in PNG waters Catch rates by the various fleets in fishing in the waters of PNG is variable with those fishing mainly on free schools having a higher catch per day than those fishing predominantly on Anchored Fads.
CATCH RATES BY THE VARIOUS FLEETS IN PNG WATERS
05
1015202530354045
1996 1997 1998 1999 2000 2001 2002 2003 2004
YEAR
CPU
E (m
t/day
)
PNG LBF
PNG
PH
OTH
Fig 3. Catch rates in PNG waters by the different fleet licensed to fish in PNG

8
6. Tuna Research and Development Observer programme PNG operates a significant observer programme with monitoring and compliance functions, and funded by a combination of access agreement levies and direct cost recovery. Observers are stationed at major ports and landing points in the country, under the supervision of senior observers, and provide coverage of the purse seine fishery (domestic and foreign), the longline fishery (tuna and shark), as well as transhipment of purse seine catch to carrier vessels/mother ships, and FAD deployments. Non-tuna fisheries (prawn) and trial fishing operations also receive observer coverage. Eigty-seven (87) trained observers are currently available for deployment and made 168 trips, totalling 6,407sea days, in 2004. Purse seine trips account for 77% of this coverage. Table 11 summarizes details of the observer coverage achieved during 2000-2004. Early in 2002, the decision was taken to reduce observer coverage on mothership operations and alternatively target 100% coverage of purse seine vessels involved in the mothership operations. The implementation of this decision began in late 2003. Incident reports are filed by observers where compliance infractions occur and may lead to enforcement action. The biological data collected are sent to SPC/OFP for entry and verification for incorporation into regional databases. Biannual summaries for national application will be produced in the near future with SPC assistance. Table 11. Observer activity summary for 2002-2004 (Source: NFA observer data) Fishery/activity Target
coverage # vessels 2004
Number of trips- (Sea days in brackets)
2000 2001 2002 2003 2004 PNG Purse-seine1 100% 7 1 (28) 2 (143) 16 (763) 27 (1142) 20 (1030) Phils purse-seine2 100% 23 2 (99) 17 (489) 55 (2470) 57 (2886) 90 (3921) Foreign p/seine3 05% 3 (73) 10 (330) 10 (329) 14 (475) 19 (719) Phils reefer4 31 (1200) 44 (1477) 7 (252) 0 0 PNG reefer/m’ship5 4 (148) 1 (7) 2 (63) 0 0 Tuna longline 05% 44 9 (157) 16 (299) 13 (270) 22 (469) Shark longline 20% 9 1 (46) 12 (417) 3 (138) 3 (119) 2 (66) FAD deployment 100% 1 (104) 1 (39) 2 (17) 10 (133) 12 (124) Other fisheries (including trial fishing)
100% 7 (167) 24 (651) 23 (454) 18 (563) 3 (78)
TOTAL 50 (1865) 120 (3710) 134 (4785) 142 (5588) 168 (6407) Port sampling activity was re-established during 2002, to gather information primarily on size and species composition of landed catches. The information is send to SPC. There are 22 port samplers stationed in ports throughout the country. In 2004, these Port samplers sampled 45 purse seine and 379 longline unloadings. 1 Vessels flagged in PNG and operated by PNG companies 2 Philippine-flagged vessels operated by PNG or Philippine companies 3 Include Locally based foreign vessels under FSM Arrangement 4 Philippine-flagged reefer carriers operated by PNG or Philippine companies 5 Reefer carriers/Motherships flagged in PNG and operated by PNG companies

9
6. Final market destination of catches/disposal of catch Domestic longline (tuna) The majority of the fresh chilled tuna catch (yellowfin and bigeye) is exported by airfreight to markets in Australia and Japan. Exports have increased steadily since 1994 and based on available records, exceeded 2,000t dressed weight (est. 2,400t whole weight), valued at over USD 8 million, for the first time in 2002 (Table 12). Frozen tuna (mostly albacore, around one hundred tonnes per year) is also exported. Smaller amounts of lower grade tuna and by-catch species (Wahoo, mahi, some shark) are sold on local markets, and some sharkfin is (mostly frozen) exported. Domestic longline (shark) Shark meat has been exported since the fishery moved to a significant scale in 1998, with over 2,000t whole weight equivalent exported each year since then. During 2004, increasing amounts of shark meat were processed in PNG for sale to local food outlets. Frozen sharkfin export has been in excess of 100t since 2000 but has dropped to less than 100t in the most recent two years. Tuna caught by the shark longline vessels (approx. 6% of the catch by weight) is also exported frozen (several hundred tonnes per year). Local licensed purse seine In each of 2000, 2001 and 2002, over 30,000t of frozen tuna was exported by the three local companies, representing around 50% of the total catch taken by these vessels. Figures for frozen tuna have dropped as more tuna is now being processed in country. In 2004 only 10,000t was exported. Figures will further drop as the other plants come into production. Limited quantities of by-catch species and small fish are sold locally. The local market for canned tuna, in addition to exports, has expanded rapidly Locally based foreign purse seine catch The 200mt/day loining plant in Wewak is in operation as of March 2003, and currently operating at a capacity of 60mt/day. It is hoped that the out put will increase to 100t/day sometimes this year. All of the catch by these vessels is currently transhipped and exported, apart from small quantities unloaded to the RD cannery from time to time (< 1,000t in 2002). Much of the transhipment occurs in non-PNG ports. Foreign purse seine vessels All of the catch taken by foreign bilateral and multilateral access vessels is transhipped, some from PNG designated ports, and exported. Unloading of by-catch during transhipment is encouraged. 6.1 Exports Table 12 lists tuna fishery exports by main category and value for the period 2000-2004. The total value of tuna fishery related exports has dropped in the last two years by about 10% from a high of USD64 million in 2002; these figures may still be incomplete. The export figures do not include the value of tuna transhipped by PNG-based vessels. Chilled tuna, as noted, is mostly exported to Japan and Australia, frozen tuna to Philippines, Japan and Taiwan, canned tuna mainly to the European markets (Germany, Great Britain), with small quantities to MSG countries, tuna loins to Europe and US and fish meal to Australia and Japan. Shark products are mostly exported to Taiwan.

10
Table 12. Tuna fishery product exports by volume and value (Source: NFA records; values in USD; frozen shark and frozen tuna weights are dressed; the 2004 figures may be incomplete; dried shark fins are not included)
Product Year
Chilled tuna Frozen tuna Canned tuna Loins tuna
Fish meal Shark meat (frozen)
Shark fins (frozen)
TOTAL (USD Million)
Mt value Mt Value Mt Value Mt Value Mt Value Mt Value Mt Value 2000 1,196 5.1 33,004 13.5 10,298 18.1 - - 1,690 0.4 1,747 0.9 110 1.0 40.0 2001 1,857 8.2 34,656 22.2 9,858 17.6 - - 1,438 0.5 1,618 0.8 151 1.2 50.5 2002 2,106 8.4 33,908 30.4 12,214 23.4 - - 1,670 0.6 1,330 0.5 112 0.8 64.1 2003 2,092 9.3 31,275 16.5 13,753 28.0 - - 1,791 0.7 1,274 0.4 86 0.5 55.4 2004 2,111 9.6 10,968 7.0 15,252 35.3 1,724 0.9 2,973 1.2 756 0.3 68 0.4 54.7
7. Onshore developments Infrastructure Under the ADB Fisheries Development Project, two wharves to primarily support longline fishery development were built in Kavieng and Lombrum (Manus) respectively. The former with an associated fish processing facility also completed. The Manus wharf was completed and opened in December 2003. A net mending facility is under construction which is associated with the wharf. Manus is well placed with respect to access to Guam, a primary entrepot for fresh tuna to Japan. Further wharves are planned under forthcoming fishery development projects in three other locations. An airport chillier facility (60t capacity), to allow consolidation and storage of chilled fish prior to export, was completed at the end of 2003 and is now in operation in Port Moresby. Net repair facilities are available in Lae and Madang (Vidar) and have been proposed for at least one other location. Processing The RD tuna cannery, established in Madang in 1997, continues to enhance production capacity with daily throughput of 130t now being achieved. Plans have been announced for the construction of a second larger cannery/loining plant at Vidar, north of Madang (200t/day), in association with a 2,000t cold storage facility. The South Seas Tuna Wewak loining plant (200t/day capacity), was completed in early 2004 and is currently operating at 60mt/day.. The proposed Frabelle cannery (100t/day) in Lae, with the associated 600t cold storage and ice plant is nearing completion. Two other smaller fish processing plants in lae and Madang are complete and ready for operation. 8. Future prospects and developments Under the Government’s export driven economic growth and recovery strategy, further onshore development is being encouraged, as a condition of access. Approval for the construction of a second loining plant (60t/day) in Madang is in the final stages, and interest has been expressed in additional smaller plants in at least two other locations. Proximity to the resource seems to be becoming a major factor influencing investment in onshore processing facilities in PNG, along with the prospect of improved access to key markets. Should all of these plants come to fruition, up to 175,000t of raw material per annum might be required. Assuming that at least one third of this might be sourced outside PNG waters, locally sourced material (125,000t) would still represent only about half of the projected sustainable yield

11
from PNG waters, assuring sustainability of supply and leaving room for further expansion. Some projections see tuna export values reaching USD 250 million (K one billion) within the next five years. Further development of the longline fishery is currently constrained by logistical factors, particularly freight availability, high freight costs and high fuel cost, and growth in this industry is now stagnant. Access to foreign longline vessels is likely to be allowed on a limited basis if the domestic longline industry continues to be stagnant. The nominal longline TAC of 10,000t (yellowfin and bigeye) remains some distance off. The future development of the handline fishery (which has attracted considerable interest) will be closely monitored and regulated, whereas artisanal tuna fishery development will be encouraged under forthcoming projects and as an adjunct to onshore developments. The planned development of “frozen smoked” processing plants is seen as a positive development for the longline and handline sector, as it will preclude in part the need for increasingly expensive airfreight. Other opportunities for value-adding to tuna products exist, and landing of by-catch by all vessels landing or transhipping is being encouraged. Prospects for continued development of the sector seem bright.