Tumor cell resistance to antiangiogenic receptor … UNIVERSITEIT Tumor cell resistance to...
153
Tumor cell resistance to antiangiogenic receptor tyrosine kinase inhibitors Kristy J. Gotink
Transcript of Tumor cell resistance to antiangiogenic receptor … UNIVERSITEIT Tumor cell resistance to...

Tumor cell resistance to antiangiogenic
receptor tyrosine kinase inhibitors
Kristy J. Gotink

The research described in this thesis was performed at the Department of Medical
Oncology, VU University Medical Center, Amsterdam, The Netherlands, and the
Department of Medicine, Genitourinary Section, Roswell Park Cancer Institute (RPCI),
Buffalo, NY, USA.
Parts of these studies were financially supported by a research grant of Pfizer Global
Pharmaceuticals, an AEGON Research Fellowship Program, a research grant from
Vitromics Healthcare Services, and a travel grant from the Dutch Cancer Society (KWF
Kankerbestrijding).
Cover design: Wendy Schoneveld (www.wenziD.nl)
Lay-out: Martijn Kornegoor
Printed by: Ipskamp Printing, The Netherlands
ISBN: 978-94-6259-994-9
© Copyright: Kristy J. Gotink
All rights reserved. No part of this book may be reproduced, stored in a retrieval
system, or transmitted, in any form or by any means, electronic, mechanical,
photocopying, recording, or otherwise, without prior written permission of the
author.

VRIJE UNIVERSITEIT
Tumor cell resistance to antiangiogenic
receptor tyrosine kinase inhibitors
ACADEMISCH PROEFSCHRIFT
ter verkrijging van de graad Doctor aan
de Vrije Universiteit Amsterdam,
op gezag van de rector magnificus
prof.dr. V. Subramaniam,
in het openbaar te verdedigen
ten overstaan van de promotiecommissie
van de Faculteit der Geneeskunde
op donderdag 18 februari 2016 om 11.45 uur
in de aula van de universiteit,
De Boelelaan 1105
door
Kristiane Johanne Gotink
geboren te Warnsveld

promotoren: prof.dr. H.M.W. Verheul
prof.dr. G.J. Peters

Contents
Chapter 1
Chapter 2
Chapter 3
Chapter 4
Chapter 5
Chapter 6
Chapter 7
General introduction and outline of the thesis
Anti-angiogenic tyrosine kinase inhibitors: what is their
mechanism of action?
Angiogenesis. 2010;13:1-14
Lysosomal sequestration of sunitinib: a novel mechanism
of drug resistance
Clin Cancer Res. 2011;17:7337-46
Acquired tumor cell resistance to sunitinib causes
resistance in a HT-29 human colon cancer xenograft
mouse model without affecting sunitinib biodistribution
or the tumor microvasculature
Oncoscience. 2014;1:844-53
Cross-resistance to clinically used tyrosine kinase
inhibitors sunitinib, sorafenib and pazopanib
Cell Oncol. 2015;38:119-29
Evaluation of a tyrosine kinase peptide microarray for
TKI therapy selection in cancer
Submitted
Summarizing discussion and future perspectives
Summary
Nederlandse samenvatting
Dankwoord
Curriculum Vitae
List of publications
7
15
43
63
83
103
129
140
144
148
152
153


Chapter 1
General introduction

Chapter 1
8
Renal cell carcinoma
Kidney cancer is one of the fastest rising cancers worldwide. Currently, it is the 9th
most common cancer type in men and the 14th most common cancer type in
women, with approximately 214.000 and 124.000 new patients each year,
respectively.1 Renal cell carcinoma (RCC), accounting for 90% of all renal cancer
cases, can be divided in four subtypes: clear cell (75%); papillary (15%); cromophobic
(5%) and collecting duct carcinoma (2%).2,3 In addition to the four main types of RCC,
there are rare ever expanding RCC subtypes that do not fit in any of these mentioned
categories. In general, RCC is highly resistant to traditional cancer treatments such as
radiation therapy and chemotherapy.4 Interestingly, RCCs are highly vascularized
tumor types, which are often associated with inactivated mutations in the Von
Hippel-Lindau (VHL) gene that drives pro-angiogenic signaling pathways. As such, new
therapies for the treatment of RCC have largely been focused on blocking
angiogenesis.
Angiogenesis in RCC
In RCC the VHL tumor suppressor gene is inactivated in 50-75% of the cases either
through mutations, hyper-methylations or loss of heterozygosity.5 As a consequence
the production of pVHL, the functional protein of the VHL gene, is inhibited or
decreased. pVHL plays a crucial role in the downregulation of the hypoxia inducible
factor 1 (HIF1) transcription factor, which subsequently decreases angiogenesis.
Upon pVHL downregulation, HIF1 is accumulated and an increase in transcription of
HIF1 target genes, such as vascular endothelial growth factor (VEGF) and platelet-
derived growth factor (PDGF), is released. Receptors for VEGF (VEGFR) and PDGF
(PDGFR) are key players in angiogenesis. VEGF mediates VEGFR regulation of vessel
permeability, endothelial cell activation, survival, proliferation, invasion and
migration.6 For the maintenance and stabilization of newly formed vessels, VEGF
alone is not sufficient and it requires support from surrounding peri-endothelial cells
such as vascular smooth muscles cells (VSMC) and pericytes. Multiple receptor
tyrosine kinases, for example PDGFR located on e.g. VSMC and pericytes, are involved
in this crosstalk with VEGFR.
Antiangiogenic tyrosine kinase inhibitors
Protein kinases phosphorylate proteins, resulting in functional changes of target
proteins. Of the approximately 500 protein kinases encoded in the human genome,7
90 kinases belong to the group of tyrosine kinases. The tyrosine kinase group consists
of approximately 30 families, for example the VEGFR family, the PDGFR family and
Introduction
9
1
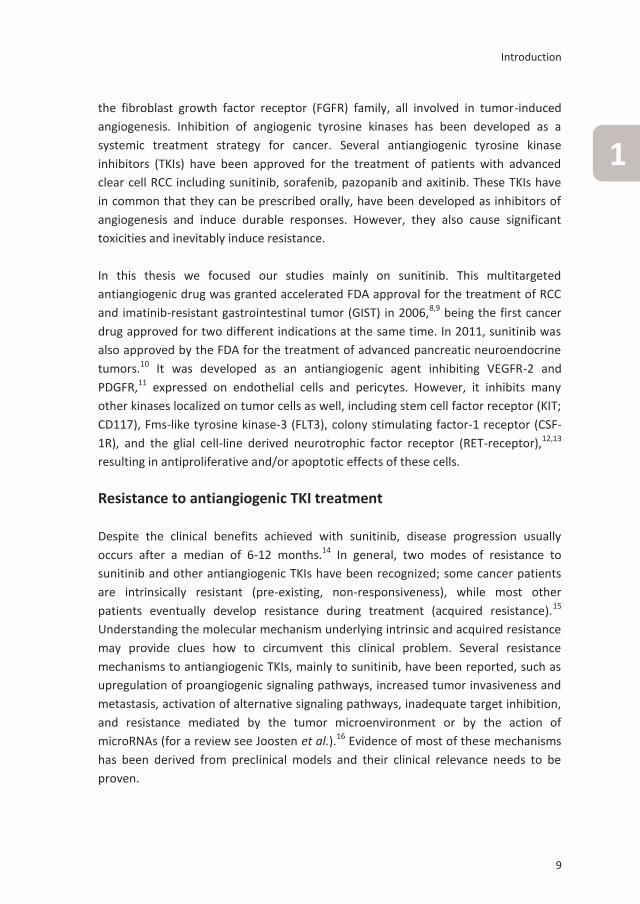
the fibroblast growth factor receptor (FGFR) family, all involved in tumor-induced
angiogenesis. Inhibition of angiogenic tyrosine kinases has been developed as a
systemic treatment strategy for cancer. Several antiangiogenic tyrosine kinase
inhibitors (TKIs) have been approved for the treatment of patients with advanced
clear cell RCC including sunitinib, sorafenib, pazopanib and axitinib. These TKIs have
in common that they can be prescribed orally, have been developed as inhibitors of
angiogenesis and induce durable responses. However, they also cause significant
toxicities and inevitably induce resistance.
In this thesis we focused our studies mainly on sunitinib. This multitargeted
antiangiogenic drug was granted accelerated FDA approval for the treatment of RCC
and imatinib-resistant gastrointestinal tumor (GIST) in 2006,8,9 being the first cancer
drug approved for two different indications at the same time. In 2011, sunitinib was
also approved by the FDA for the treatment of advanced pancreatic neuroendocrine
tumors.10 It was developed as an antiangiogenic agent inhibiting VEGFR-2 and
PDGFR,11 expressed on endothelial cells and pericytes. However, it inhibits many
other kinases localized on tumor cells as well, including stem cell factor receptor (KIT;
CD117), Fms-like tyrosine kinase-3 (FLT3), colony stimulating factor-1 receptor (CSF-
1R), and the glial cell-line derived neurotrophic factor receptor (RET-receptor),12,13
resulting in antiproliferative and/or apoptotic effects of these cells.
Resistance to antiangiogenic TKI treatment
Despite the clinical benefits achieved with sunitinib, disease progression usually
occurs after a median of 6-12 months.14 In general, two modes of resistance to
sunitinib and other antiangiogenic TKIs have been recognized; some cancer patients
are intrinsically resistant (pre-existing, non-responsiveness), while most other
patients eventually develop resistance during treatment (acquired resistance).15
Understanding the molecular mechanism underlying intrinsic and acquired resistance
may provide clues how to circumvent this clinical problem. Several resistance
mechanisms to antiangiogenic TKIs, mainly to sunitinib, have been reported, such as
upregulation of proangiogenic signaling pathways, increased tumor invasiveness and
metastasis, activation of alternative signaling pathways, inadequate target inhibition,
and resistance mediated by the tumor microenvironment or by the action of
microRNAs (for a review see Joosten et al.).16 Evidence of most of these mechanisms
has been derived from preclinical models and their clinical relevance needs to be
proven.

Chapter 1
10
Treatment selection strategies
Most of the targeted agents, including antiangiogenic TKIs, induce responses only in a
subgroup of cancer patients. Most patients with metastasized RCC have clinical
benefit, but in approximately 25% of the patients, intrinsic resistance to treatment is
observed.17 Therefore, it would be of great benefit when a pretreatment test could
predict whether a patient will benefit from treatment.18 Up till now, adequate
diagnostic tools to predict whether a patient will respond to targeted treatments are
sparsely available.19 In order to select patients for targeted therapies, several
profiling approaches have been explored, but to date no adequate and reliable test
to predict for response is available for most patients. Each patient has a unique
genomic and proteomic tumor profile. It is assumed that responses to targeted
agents depend on specific receptor and protein signaling activities in tumor tissues.
Therefore, new methods and techniques are being developed and evaluated for their
potential clinical usefulness.20-22 Some have been already implemented in daily
clinical practice, including evaluation of RAS-mutations for colorectal cancer to select
for anti-epidermal growth factor (EGF) treatment, evaluation of B-RAF-mutations for
melanoma’s to select for B-RAF inhibitors, or evaluation of EGF receptor (EGFR)
mutation status in non-small cell lung cancer to select for EGFR-TKIs. However, for
most of the targeted agents no treatment selection tool is available.

Introduction
11
1
Outline of this thesis
Although multitargeted antiangiogenic TKI treatment of patients with advanced or
metastatic clear cell RCC improves progression free and overall survival, (acquired)
resistance emerges in almost all cases. Thus far, the underlying (molecular)
mechanisms to fully explain and overcome resistance to TKIs remain unclear. In this
thesis, we have studied the potential mechanisms of resistance to TKIs, especially
sunitinib, by evaluating direct activity of TKIs on tumor cells. These studies are
important to further improve our understanding of therapy resistance to
antiangiogenic TKIs and thereby we hope to improve life expectancy of patients with
RCC.
In chapter 2 we have described the potential and established mechanisms of action
of multitargeted TKIs. In chapter 3 we studied the activity of sunitinib on tumor cells
directly, we generated resistant tumor cell lines and we analyzed their resistance
mechanism in vitro. In chapter 4 we evaluated tumor cell resistance in an in vivo
tumor model in order to discriminate between the role of tumor cells versus host
factors in sunitinib resistance. In chapter 5 we induced resistance to other currently
approved TKIs and studied overlapping cross-resistance in vitro. In chapter 6 we
evaluated multiple technical conditions in a kinase activity array to determine its
potential for clinical use, since one of the major efforts of current clinical practice is
to adequately define upfront which patient will benefit from targeted treatments.
Finally, we have integrated our results in a summarizing discussion and perspectives
outlined in chapter 7

Chapter 1
12
References
1. Stewart BW, Wild CP. World cancer report 2014. International Agency for Research on
Cancer of the World Health Organization. ISBN 978-92-832-0429-9
2. Lopez-Beltran A, Scarpelli M, Montironi R, Kirkali Z. 2004 WHO classification of the renal
tumors of the adults. Eur Urol 2006;49(5):798-805.
3. Dall’Oglio MF, Antunes AA, Pompeo AC, Mosconi A, Leite KR, Srougi M. Prognostic relevance
of the histological subtype of renal cell carcinoma. Int Braz J Urol. 2008;34(1):3-8
4. Rini BI, Rathmell WK, Godley P. Renal cell carcinoma. Curr Opin Oncol 2008;20(3):300-306.
5. Gnarra JR, Tory K, Weng Y et al. Mutations of the VHL tumour suppressor gene in renal
carcinoma. Nat Genet 1994;7(1):85-90.
6. Donalisio da Silva R, Gustafson D, Nogueira L, Werahera PN, Molina WR, Kim FJ. Targeted
therapy for metastatic renal carcinoma: an update. J of Kidney Cancer and VHL 2014;1(6):63-
73
7. Manning G, Whyte DB, Martinez R, Hunter T, Sudarsanam S. The protein kinase complement
of the human genome. Science 2002;298(5600):1912-1934.
8. Motzer RJ, Hutson TE, Tomczak P et al. Overall survival and updated results for sunitinib
compared with interferon alfa in patients with metastatic renal cell carcinoma. J Clin Oncol
2009;27(22):3584-3590.
9. Goodman VL, Rock EP, Dagher R et al. Approval summary: sunitinib for the treatment of
imatinib refractory or intolerant gastrointestinal stromal tumors and advanced renal cell
carcinoma. Clin Cancer Res 2007;13(5):1367-1373.
10. Raymond E, Dahan L, Raoul JL et al. Sunitinib malate for the treatment of pancreatic
neuroendocrine tumors. N Engl J Med 2011;364(6):501-513.
11. Faivre S, Demetri G, Sargent W, Raymond E. Molecular basis for sunitinib efficacy and future
clinical development. Nat Rev Drug Discov 2007;6(9):734-745.
12. Fabian MA, Biggs WH, III, Treiber DK et al. A small molecule-kinase interaction map for
clinical kinase inhibitors. Nat Biotechnol 2005;23(3):329-336.
13. Karaman MW, Herrgard S, Treiber DK et al. A quantitative analysis of kinase inhibitor
selectivity. Nat Biotechnol 2008;26(1):127-132.
14. Rini BI, Atkins MB. Resistance to targeted therapy in renal-cell carcinoma. Lancet Oncol
2009;10(10):992-1000.
15. Bergers G, Hanahan D. Modes of resistance to anti-angiogenic therapy. Nat Rev Cancer
2008;8(8):592-603.
16. Joosten SC, Hamming L, Soetekouw PM et al. Resistance to sunitinib in renal cell carcinoma:
From molecular mechanisms to predictive markers and future perspectives. Biochim Biophys
Acta 2015;1855(1):1-16.

Introduction
13
1
17. Heng DY, Mackenzie MJ, Vaishampayan UN et al. Primary anti-vascular endothelial growth
factor (VEGF)-refractory metastatic renal cell carcinoma: clinical characteristics, risk factors,
and subsequent therapy. Ann Oncol 2012;23(6):1549-1555.
18. Van der Mijn JC, Mier JW, Broxterman HJ, Verheul HM. Predictive biomarkers in renal cell
cancer: insights in drug resistance mechanisms. Drug Resist Updat 2014;17(4-6):77-88.
19. Labots M, Schutte LM, Van der Mijn JC et al. Mass spectrometry-based serum and plasma
peptidome profiling for prediction of treatment outcome in patients with solid malignancies.
Oncologist 2014;19(10):1028-39.
20. Van der Mijn JC, Labots M, Piersma SR et al. Evaluation of different phospho-tyrosine
antibodies for label-free phosphoproteomics. J Proteomics 2015;127(Pt B):259-63.
21. Von Hoff DD, Stephenson Jr JJ, Rosen P et al. Pilot study using molecular profiling of patients’
tumors to find potential targets and select treatments for their refractory cancers. J Clin Oncol
2010;28(33):4877-83
22. Versele M, Talloen W, Rockx C et al. Response prediction to a multitargeted kinase inhibitor
in cancer cell lines and xenograft tumors using high-content tyrosine peptide arrays with a
kinetic readout. Mol Cancer Ther 2009;8(7):1846-55


Chapter 2
Anti-angiogenic tyrosine kinase inhibitors:
what is their mechanism of action?
Kristy J. Gotink and Henk M.W. Verheul
Angiogenesis 2010;13(1):1-14

Chapter 2
16
Abstract
Tyrosine kinases are important cellular signaling proteins that have a variety of
biological activities including cell proliferation and migration. Multiple kinases are
involved in angiogenesis, including receptor tyrosine kinases such as the vascular
endothelial growth factor receptor. Inhibition of angiogenic tyrosine kinases has been
developed as a systemic treatment strategy for cancer. Three anti-angiogenic
tyrosine kinase inhibitors (TKIs), sunitinib, sorafenib and pazopanib, with differential
binding capacities to angiogenic kinases were recently approved for treatment of
patients with advanced cancer (renal cell cancer, gastro-intestinal stromal tumors
and hepatocellular cancer). Many other anti-angiogenic TKIs are being studied in
phase I-III clinical trials. In addition to their beneficial anti-tumor activity, clinical
resistance and toxicities have also been observed with these agents.
In this manuscript we will give an overview of the design and development of anti-
angiogenic TKIs. We describe their molecular structure and classification, their
mechanism of action and their inhibitory activity against specific kinase signaling
pathways. In addition, we provide insight to what extent selective targeting of
angiogenic kinases by TKIs may contribute to the clinically observed anti-tumor
activity, resistance and toxicity. We feel that it is of crucial important to increase our
understanding of the clinical mechanism of action of anti-angiogenic TKIs in order to
further optimize their clinical efficacy.

Anti-angiogenic TKIs: what is their mechanism of action?
17
2
Introduction
Cancer development is characterized by uncontrolled cell growth and proceeds via
genetic changes resulting in numerous biological alterations. Essential hallmarks that
drive tumorigenesis as described by Hanahan and Weinberg include: self-sufficiency
in growth signals; insensitivity to growth-inhibitory (antigrowth) factors; evasion of
programmed cell death (apoptosis); limitless replicative potential; sustained
angiogenesis; and tissue evasion and metastasis.1
Angiogenesis, the growth of new vessels from pre-existing vasculature, is a critical
step in tumor progression.2 New blood vessels are required to support the growth of
a tumor beyond the size of about 1-2mm3, to supply oxygen and nutrients to
proliferating tumor cells and for metastasis formation.3,4 Research in angiogenesis
inhibition as a therapeutic strategy against cancer started around 1971, when
Folkman postulated that tumor growth is dependent on angiogenesis.5 In the past
two decades, inhibitors of angiogenesis have been developed for clinical use.6 Most
notable angiogenesis inhibitors target the vascular endothelial growth factor (VEGF)
signaling pathway, such as the monoclonal antibody bevacizumab (Avastin,
Genentech/ Roche) and two kinase inhibitors sunitinib (SU11248, Sutent, Pfizer) and
sorafenib (BAY43-9006, Nexavar, Bayer). Bevacizumab was the first angiogenesis
inhibitor that was clinically approved, initially for treatment of colorectal cancer and
recently also for breast cancer and lung cancer. The small-molecule tyrosine kinase
inhibitors sunitinib and sorafenib target the VEGF receptor (VEGFR), primarily VEGFR-
2, and have shown clinical efficacy in diverse cancer types.7,8 Both drugs have shown
benefit in patients with renal cell cancer.9,10 In addition, sunitinib has been approved
for treatment of gastro-intestinal stromal tumors (GISTs). Sorafenib inhibits Raf
serine kinase as well and has been approved for treatment of hepatocellular cancer
as well.11 Numerous clinical trials are ongoing with these and other angiogenesis
inhibitors in various cancer types.
Two major problems have been noticed during the clinical development of
angiogenesis inhibitors. In both preclinical and clinical settings, resistance to
angiogenesis inhibitors occurs. In some patients, treatment with an angiogenesis
inhibitor results in an initial response, followed by tumor progression (acquired
resistance). In other patients intrinsic resistance is being observed.12 Secondly, in
contrast to initial expectations, significant clinical toxicities are observed during anti-
angiogenic treatment. These toxicities include severe bleeding, disturbed wound
healing, gastro-intestinal perforation, hypertension and fatigue.13
Insight into the underlying mechanisms of resistance and toxicities of angiogenesis
inhibitors will help to further improve treatment strategies of angiogenesis inhibition.
This review highlights important tyrosine kinases and their mediated signaling

Chapter 2
18
pathways in angiogenesis. We describe the molecular structure and classification of
tyrosine kinase inhibitors, their mechanism of action and their inhibitory activity
against specific kinase signaling pathways. In addition, we provide insight to what
extent selective targeting of angiogenic kinases by tyrosine kinase inhibitors may
contribute to the clinically observed anti-tumor activity, resistance and toxicity.
Tyrosine kinases
Kinases, also called phosphotransferases, are enzymes that transfer a phosphate
group from high-energy donor molecules, for example adenosine triphosphate (ATP),
to specific substrates. Protein kinases phosphorylate proteins, resulting in functional
changes of target proteins. Of the 518 protein kinases encoded in the human
genome,14 90 kinases belong to the group of tyrosine kinases. Six other groups have
been identified whose kinases primarily phosphorylate serine and threonine residues
(Fig. 1). The tyrosine kinase group consists of approximately 30 families, for example
the VEGFR family and the fibroblast growth factor receptor (FGFR) family. Apart from
classification in families, tyrosine kinases can also be classified in receptor tyrosine
kinases and non-receptor (cytoplasmic) tyrosine kinases. Receptor tyrosine kinases
are essential for the transduction of extracellular signals into the cell, while non-
receptor tyrosine kinases accomplish intracellular communication. A receptor
tyrosine kinase monomer consists of an N-terminal extracellular ligand-binding
domain, a transmembrane domain and a C-terminal intracellular domain with
tyrosine kinase activity (Fig. 2). The kinase domain has a bi-lobar structure, with an
ATP-binding cleft located between the N- and C-terminal lobes. The ATP binding site
can be divided in three subregions: the adenine region, the sugar region and the
phosphate-binding region.15 The C-terminal lobe of kinases contains an activation
loop and is marked by a specific amino acid combination at the start of the loop. This
combination exists of the amino acids aspartic acid, phenylalanine and glycine,
abbreviated as D, F and G respectively and is therefore called ‘DFG motif’. The
activation loop can adopt numerous conformations. In the ‘out’ conformation, the
activation loop creates a hydrophobic pocket, nearby the ATP binding cleft (Fig. 2).
This hydrophobic pocket is important for a subgroup of tyrosine kinase inhibitors, as
described below.
Ligand binding to the extracellular domain of the receptor promotes receptor
dimerization, resulting in autophosphorylation of specific tyrosine residues of the
cytoplasmic kinase domain.16 Besides these phosphorylation sites for regulation of
their own kinase activity, other phosphorylation sites of kinases are being used to
control protein interactions. The activated receptor recruits interacting proteins that
bind to certain phosphorylation sites.17 Recruited and phosphorylated signaling

Anti-angiogenic TKIs: what is their mechanism of action?
19
2
proteins are subsequently able to phosphorylate other proteins. Activation of
(multiple) signaling pathways eventually leads to biological responses.18 Biological
responses include cell activation, proliferation, differentiation, migration, survival and
vascular permeability. We provide here more insight in signaling pathways and
biological responses of cells involved in angiogenesis, but every cell uses signaling
pathways for their survival, proliferation and other activities.
serine/ threonine kinases388
CK112
tyrosine kinases90
atypical kinases40
protein kinases518
CAMK74
AGC63
14 families e.g. AktPKC
17 families e.g. CAMK1
3 families e.g. CK1
8 families e.g. CDKMAPK
3 families e.g. STE7
7 families e.g. MLK
CMGC61
TKL43
STE47
30 families e.g. VEGFRFGFRPDGFREGFRABLTIE
Other 88
Figure 1. Classification of protein kinases of the human kinome.
Protein kinases can be divided in tyrosine kinases and serine/ threonine kinases. Tyrosine kinases
can be subdivided in approximately 30 families, which mediate a variety of biological responses. The
kinases in six other groups mostly phosphorylate serine/ threonine residues. These groups include:
AGC, containing protein kinase A (PKA)/ protein kinase G (PKG)/ protein kinase C (PKC) families;
CAMK, calcium/calmodulin-dependent kinase; CK1, casein kinase 1; CMGC, containing cyclin-
dependent kinase (CDK)/ mitogen-activated protein kinase (MAPK)/ glycogen synthase kinase (GSK)/
CDK-like kinase (CLK) families; STE, homologues of yeast sterile 7, sterile 11, sterile 20 kinases; TKL,
tyrosine kinase-like kinase. Each of these groups can also be classified into families, of which at least
one example per group is shown.
ABL, Abelson kinase; Akt, Akt/ protein kinase B (PKB); EGFR, epidermal growth factor receptor; FGFR,
fibroblast growth factor receptor; MLK, mixed-lineage kinase; PDGFR, platelet derived growth factor
receptor; TIE, tyrosine kinase with immunoglobulin-like and EGF-like domain; VEGFR, vascular endo-
thelial growth factor receptor.

Chapter 2
20
Tumor angiogenesis
In normal physiological circumstances, angiogenesis is well-controlled by pro- and
anti-angiogenic factors and is only promoted during the menstrual cycle, pregnancy
and during wound healing and repair.19 Though, in cancer this balance of pro- and
anti-angiogenic factors is disturbed, resulting in the so called ‘angiogenic switch’.
Tumor cells secrete a number of pro-angiogenic factors that stimulate the
proliferation and migration of endothelial cells, resulting in the outgrowth of new
capillaries into the tumor. VEGF signaling through its receptor is the major inducer of
angiogenesis.20 Therefore, special attention has been paid on inhibition of this
receptor tyrosine kinase to block formation of new blood vessels in cancer.6 Anti-
angiogenic tyrosine kinase inhibitors that have shown clinical activity in phase I/II
clinical trials are shown in table 1.
Tyrosine kinases and growth factors involved in angiogenesis
The tyrosine kinase VEGFR is a crucial mediator in angiogenesis. The VEGFR family
comprises three related receptor tyrosine kinases, known as VEGFR-1, -2 and -3,
which mediate the angiogenic effect of VEGF ligands.21 The VEGF family encoded in
Figure 2. Structure of a receptor tyrosine kinase.
The extracellular domain of a receptor tyrosine kinase can bind specific ligands such as growth
factors, while the intracellular domain achieves (auto)phosphorylation of the kinase. The extra- and
intracellular domain are parted by the transmembrane region that is anchored in the cell
membrane. The ATP binding cleft is located between the two lobes of the intracellular domain. A
schematic representation of the ATP binding cleft, with its different regions, is shown on the right
side of the figure. The binding regions of type I and type II tyrosine kinase inhibitors are indicated.
Extracellular domain(ligand binding domain)
Intracellular domain(kinase domain)
Transmembrane domain
Cell membrane
Activation loop
ATP binding cleft
Type I tyrosinekinase inhibitors
Type II tyrosinekinase inhibitors
Hydrophobic region
Sugar region
Adenineregion
Phosphate-binding region
N-terminal lobe
C-terminal lobe

Anti-angiogenic TKIs: what is their mechanism of action?
21
2
the mammalian genome includes five members: VEGF-A, VEGF-B, VEGF-C, VEGF-D
and placental growth factor (PlGF). VEGFs are important stimulators of proliferation
and migration of endothelial cells. VEGF-A (commonly referred to as VEGF) is the
major mediator of tumor angiogenesis and signals through VEGFR-2, the major VEGF
Agent Target Clinical activity and/or study Phase of development
Refs
Sunitinib (SU11248; Sutent)
VEGFR-1, -2, -3, PDGFR, KIT, FLT3, CSF-1R, RET
Kidney, breast, prostate, lung, liver, ovarian, colorectal, thyroid, head and neck, gastric, bladder, cervical and pancreatic cancer, GIST, melanoma, glioblastoma, myeloma, lymphoma
Approved for kidney cancer and GIST, phase II or III for other cancers
7, 9
Sorafenib (BAY439006; Nexavar)
VEGFR-2, -3, PDGFR, Raf, KIT
Kidney, liver, breast, prostate, lung, ovarian, colorectal, thyroid, head and neck, gastric and pancreatic cancer, GIST, melanoma, glioblastoma, lymphoma, leukemia
Approved for kidney and liver cancer, phase II or III for other cancers
8, 11
Pazopanib (GW786034; Votrient)
VEGFR-1, -2, -3, PDGFR, KIT
Kidney, breast, lung, cervical, liver, thyroid, prostate and colorectal cancer, melanoma, glioblastoma
Approved for kidney cancer, phase II or III for other cancers
99, 100
Vandetanib (ZD6474; Zactima)
VEGFR-2, EGFR, KIT, RET
Lung, kidney, thyroid, head and neck, prostate, ovarian, breast and colorectal cancer, glioma, neuroblastoma
Phase II or III 53, 101, 102
Axitinib (AG013736)
VEGFR-1, -2, -3, PDGFR-β, KIT
Kidney, lung, thyroid, pancreatic, colorectal and breast cancer, melanoma
Phase II or III 103, 104
Cediranib (AZD2171; Recentin)
VEGFR-1, -2, -3, PDGFR-β, KIT
Kidney, breast, lung, liver, ovarian, head and neck, prostate and colorectal cancer, GIST, glioblastoma, melanoma
Phase II 105, 106
Vatalanib (PTK787; ZK222584)
VEGFR-1, -2, -3, PDGFR-β, KIT
Prostate, colorectal, kidney and pancreatic cancer, melanoma, lymphoma, leukemia
Phase II or III 107, 108
Motesanib (AMG706)
VEGFR-1, -2, -3, PDGFR, KIT, RET
Lung, thyroid, gallbladder, breast and colorectal cancer, GIST
Phase II or III 109, 110
Table 1. Anti-angiogenic tyrosine kinase inhibitors in clinical development.
CSF-1R, colony stimulating factor-1 receptor; EGFR, epidermal growth factor receptor; FLT3, fms-
related tyrosine kinase 3; GIST, gastro-intestinal stromal tumor; PDGFR, platelet-derived growth
factor receptor; VEGFR, vascular endothelial growth factor receptor.

Chapter 2
22
signaling receptor.20 A second important growth factor involved in angiogenesis is the
platelet-derived growth factor (PDGF). The PDGF family consists of at least 4
members: PDGF-A, PDGF-B, PDGF-C and PDGF-D, which bind to two different
receptors, known as PDGFR-α and -β.22 PDGFs facilitate recruitment of pericytes and
smooth muscle cells and are important for maturation and stability of the
vasculature.23 Also basic fibroblast growth factor (bFGF), known as FGF2 as well, has
important angiogenic properties. The 18 members of FGF family can be divided into
six subfamilies and bind to seven main FGF receptors. FGF2 induces angiogenesis by
stimulating migration and proliferation of endothelial cells. Furthermore, it supports
proliferation of smooth muscle cells and fibroblasts.24
Tyrosine kinase signaling in angiogenesis
Stimulation of VEGFRs and other tyrosine kinase receptors causes massive activation
of signaling pathways in endothelial cells. Signaling molecules downstream of
receptor tyrosine kinases not only include tyrosine kinases, but involves other
signaling proteins as well including serine/ threonine kinases and G-proteins.
Important signaling molecules recruited to tyrosine kinase receptors comprise
proteins with a Src homology 2 (SH2) domain. Association of a phosphorylated
tyrosine kinase receptor with a SH2 domain-containing protein results in the
phosphorylation and activation of this effector protein. In addition, the binding of this
SH2 domain-containing protein to the receptor serves as a docking site for other
signaling molecules. Phospholipase C-γ (PLCγ) is an SH2 domain-containing protein
that is frequently involved in signaling by VEGFRs. PLCγ phosphorylates protein kinase
C (PKC),25 which subsequently phosphorylates a range of kinases. Phosphorylation of
MEK (mitogen-activated protein kinase (MAPK) and extracellular-signal-regulated
kinase (ERK) kinase) by PKC stimulates the p42/44 MAPK pathway.26 Phosphorylated
MAPK, a serine/ threonine kinase, activates various transcription factors and is
known to regulate cell proliferation (Fig. 3a).
Another signaling molecule involved in the MAPK cascade, is the growth factor
receptor-bound protein 2 (Grb2).27 Grb2 contains SH2 and SH3 domains and is able to
activate the G-protein Ras via association with the ATP/ADP exchange factor
mammalian Son-of-sevenless (Sos).28 The Ras protein can bind to and phosphorylate
Raf, which in turn can activate the MEK/ MAPK pathway. The Ras/ Raf pathway is a
classical pathway in activation of MAPK and is involved in signaling of many tyrosine
kinase receptors, for example the epidermal growth factor receptor (EGFR). However,
activation of the Ras/ Raf pathway plays a minor role in VEGFR signaling.29
An adapter molecule which is important in VEGFR mediated signaling, is the SH2 and
β-cells (Shb) protein. Interaction of Shb with a specific phosphorylation site of VEGFR-
2 activates phosphatidylinositol 3’-kinase (PI3K). PI3K and its downstream activated

Anti-angiogenic TKIs: what is their mechanism of action?
23
2
serine/ threonine kinase Akt/ protein kinase B (PKB) are involved in several important
processes of angiogenesis, including endothelial cell migration, proliferation and
survival, as shown in figure 3b. Activation of Akt/ PKB requires generation of
phosphatidylinositol 3,4,5-triphosphate (PIP3) by PI3K mediated phosphorylation of
phosphatidylinositol 4,5-biphosphate (PIP2).30 Akt/ PKB stimulates proliferation and
survival by the activation or inhibition of a variety of substrates.31 Akt/ PKB
phosphorylates and inhibits the pro-apoptotic protein BAD (Bcl-2 associated death
promoter) as well as GSK3 (glycogen synthase kinase 3). Akt/ PKB is also able to
activate the mammalian target of rapamycin (mTOR) and its downstream p70S6K
that are regulators of cell proliferation and survival.32 In addition, Akt/ PKB enhances
cellular proliferation through activation of nuclear factor-κB (NF-κB).33 Furthermore,
Akt/ PKB is able to stimulate vasodilation, vascular remodeling and angiogenesis,
through phosphorylation of endothelial nitric oxide (NO) syntheses (eNOS).34 Last,
but not least, the PI3K pathway seems to be involved in endothelial cell migration.35
Other signaling molecules that are involved in (endothelial) cell migration are shown
in figure 3a and include the T-cell specific adaptor (TSAd) protein, p38 MAPK and the
focal adhesion kinase (FAK).36 TSAd binds to an other phosphorylation site of the
VEGFR-2 than PLCγ and Shb. Activated TSAd forms complexes with Src and regulates
cell migration and vascular permeability.37 Interaction of p38 MAPK with a
phosphorylation site of the VEGFR-2 mediates actin reorganization and cell
migration.38 Activated FAK is capable of controlling diverse aspects of cell migration,
including regulation of the cytoskeleton and influences structures of cell adhesion
sites.39 FAK has also been shown to maintain survival signals in endothelial cells.40
Tyrosine kinase inhibitors
Metabolism of tyrosine kinase inhibitors
Tyrosine kinase inhibitors are small-molecules and are in contrast to monoclonal
antibodies able to pass through the cell membrane.41 Monoclonal antibodies can only
act on molecules expressed on the cell surface or on secreted molecules. Small-
molecule inhibitors are largely hydrophobic and can easily enter the cell where they
can interact with the intracellular domain of receptors and intracellular signaling
molecules. As a result, small-molecules kinase inhibitors are able to block the
activation of various downstream signaling pathways intracellularly. Tyrosine kinase
inhibitors can be taken orally, if necessary in a salt form of the inhibitor. For example,
sunitinib is taken as sunitinib malate (the malate salt of sunitinib),42 while sorafenib is
taken as tosylate sorafenib (the tosylate salt of sorafenib).43 Tyrosine kinase inhibitors
are being administered to patients at a fixed dose once or twice daily, because the
variability in pharmacokinetics of these agents are not significantly affected by

Chapter 2
24
weight.44 Some of the tyrosine kinase inhibitors are metabolized by the liver primarily
by cytochrome-P enzymes. For example, sunitinib is metabolized primarily by the
cytochrome P450 enzyme CYP3A4.42 The parent compound and active metabolite
have similar biochemical activity and potency. The primary metabolite is further
metabolized by CYP3A4 to its secondary inactive metabolite.45 Also other enzymes
are involved in the metabolism of sunitinib. Van Erp et al.46 investigated
Receptor tyrosine kinase
eNOS
Akt/ PKB
P38 MAPKPKC
PLCγ
MAPK
MEK
Raf
Ras
Grb2
TSAD
FAKPI3K
Shb
Vascularpermeability
MigrationProliferation Survival
eNOS
Akt/ PKB
NF-κB
GSK3
mTOR
p70S6K
PIP3
Vascularpermeability
MigrationProliferation Survival
PI3K
BAD
Receptor tyrosine kinase
eNOS
Akt/ PKB
P38 MAPKPKC
PLCγ
MAPK
MEK
Raf
Ras
Grb2
TSAD
FAKPI3K
Shb
Vascularpermeability
MigrationProliferation Survival
eNOS
Akt/ PKB
NF-κB
GSK3
mTOR
p70S6K
PIP3
Vascularpermeability
MigrationProliferation Survival
PI3K
BAD
Figure 3. Signal transduction pathways and biological pro-cesses mediated by receptor tyrosine kinases focused on angiogenesis. a, A selection of pathways, activated by receptor tyrosine kinase involved in angiogenesis is shown. Pathway activation, for example by VEGFR or PDGFR, can result in a variety of angiogenic processes, such as cell proliferation, migration, survival and vascular permea-bility. b, The phosphatidylinositol 3’-kinase (PI3K) pathway is an im port ant dow nstr eam pathway of diverse receptor tyrosine kinases and is involved in various cellular processes in angiogenesis. Akt/ protein kinase B (PKB) is activated downstream of PI3K. BAD, Bcl-2 associated death promoter; eNOS, endothelial nitric oxide synthase; FAK, focal adhesion kinase; Grb2, growth factor receptor-bound protein 2; GSK3, glycogen synthase kinase 3; MAPK, mitogen-activated protein kinase; MEK, MAPK and extracellular-signal-regulated kinase (ERK) kinase; mTOR, mammalian target of rapamycin; NF-κB, nuclear factor-κB; PIP3, phospha-tidylinositol 3,4,5-triphosphate; PKC, protein kinase C; PLCγ phospholipase C-γ; p70S6K, p70S6 kinase; Shb, SH2 and β-cells; TSAd, T-cell specific adaptor.
b
a
Anti-angiogenic TKIs: what is their mechanism of action?
25
2
polymorphisms genotyped in the pharmacokinetic and pharmacodynamic pathway of
sunitinib and studied their association with sunitinib-induced toxicities. Half-life times
of sunitinib and its primary metabolite are approximately 40 to 60 hours and 80 to
110 hours, respectively.42 Elimination of sunitinib is primarily via feces.45
Sorafenib undergoes oxidative metabolism, mediated by CYP3A4, as well as
glucuronidation, mediated by UGT1A9.43 Several metabolites of sorafenib have been
identified, of which the main circulating metabolite, the pyridine N-oxide, shown
potency similar to that of sorafenib in vitro. Sorafenib elimination half time is
between 25 and 48 hours and sorafenib is secreted in feces as well as in urine.43
Modes of tyrosine kinase inhibitor binding
Most small-molecule kinase inhibitors discovered to date compete with ATP. The
chemical structure of ATP is shown in figure 4a. ATP consists of adenosine, composed
of an adenine ring and a ribose sugar, and three phosphate groups. Binding of ATP to
a kinase is characterized by the formation of hydrogen bonds from the adenine ring
to the ATP binding cleft of the kinase. Kinase inhibitors can target (nearby) the ATP
binding site of a kinase. The ATP binding site is common to all protein kinases and
selectivity of kinase inhibitors is engineered by the chemical structure that is not
similar to the ATP structure. The chemical structures of the anti-angiogenic tyrosine
kinase inhibitor listed in table 1 are shown in figure 4b. Elements of some compounds
can be compared to elements of ATP. For example, the adenine ring of ATP, with
forms hydrogen bonds to the kinase, is in more or lesser similarity seen in pazopanib,
vatalanib and axitinib.
Tyrosine kinase inhibitors can be subdivided in categories. Here, we classify tyrosine
kinase inhibitors in three different types and focus on anti-angiogenic tyrosine kinase
inhibitors. Type I kinase inhibitors recognize the active conformation of a kinase. They
bind to the ATP binding site by presenting one to three hydrogen bonds that mimic
the hydrogen bonds normally formed by ATP.47 An example of a type I tyrosine kinase
inhibitor targeting the VEGF pathway is sunitinib. Sunitinib demonstrated competitive
inhibition to ATP against VEGFR-2 (Flk-1) and PDGFR-β.48 Sunitinib is furthermore a
well-known inhibitor of VEGFR-1 and -3, PDGFR-α, KIT, fms-related tyrosine kinase 3
(FLT3), colony stimulating factor-1 receptor (CSF-1R) and RET.7 Sunitinib is expected
to compete with ATP by presenting several hydrogen bonds to the ATP binding
site.47,49
In contrast to type I kinase inhibitors, type II kinase inhibitors recognize the inactive
conformation of a kinase. Type II inhibitors indirectly compete with ATP by occupying
a hydrophobic pocket that is directly adjacent to the ATP binding site. This
hydrophobic pocket is created by the DFG-out conformation of the activation loop.
This unique DFG-out conformation is also known as the allosteric site and type II

Chapter 2
26
inhibitors can modulate kinase activity in an allosteric way. Some type II inhibitors are
able to form a hydrogen bond directly to the ATP binding site while this is not
necessary for functionality.15 Sorafenib is a type II kinase inhibitor50 and blocks the
phosphorylation of VEGFR, PDGFR, Raf and KIT by using a hydrophobic pocket to
(indirectly) compete with ATP. It binds to its target kinases in an inactive
conformation.49
A third class of kinase inhibitors is known as ‘covalent’ inhibitors. These inhibitors
have been developed to covalently bind to cysteines at specific sites of the kinase.
Sulfur (S), present in the cysteine residue, is an electron-rich atom, which reacts with
an electrophilic group of the inhibitor. As a result, the inhibitor and the cysteine
residue irreversibly bind by sharing electrons. This allows the inhibitor to block
binding of ATP to the kinase and prevents activation of the kinase.51 Examples of
covalent tyrosine kinase inhibitors are quinazoline-based inhibitors52 such as
vandetanib (ZD6474, Zactima, AstraZeneca), which in addition to targeting VEGFR,
inhibits EGFR.53 This inhibitor is an anilquinazoline derivate, and inhibits activation of
kinases by covalently bind to a cysteine group of the kinase.
Binding regions of type I and type II inhibitors in ATP binding cleft of the kinase are
indicated in figure 2. Because covalent inhibitors bind a cysteine residue which can be
variably located in the kinase domain, the binding site of this inhibitor type is not
illustrated.
a
b
Figure 4. Chemical structures of ATP and anti-angiogenic tyrosine kinase inhibitors.
a, Chemical structure of ATP. ATP consists of an adenine ring, a ribose sugar and three phosphate
groups. The adenine ring, which forms hydrogen bonds to the ATP binding site of its target kinase, is
encircled in this figure. b, Chemical structures of the anti-angiogenic tyrosine kinase inhibitors
sunitinib, sorafenib, pazopanib, vandetanib, axitinib, cediranib, vatalanib and motesanib. The targets
of these inhibitors, their clinical activity and their phase of development are shown in table 1.

Anti-angiogenic TKIs: what is their mechanism of action?
27
2
Selectivity of tyrosine kinases inhibitors
Many anti-angiogenic tyrosine kinase inhibitors are so-called multi-targeted kinase
inhibitors. These agents target a number of different kinases, which are involved in
several signaling pathways. It is reasonable to expect that inhibitors of multiple
kinases possess a broader efficacy than a single-targeted inhibitor. For example, the
VEGF pathway and PDGF pathway both play important roles in angiogenesis. For
inhibition of angiogenesis, it is expected that a multi-targeted kinase inhibitor which
blocks VEGFR signaling as well as PDGFR signaling will be more effective than an
inhibitor that targets only one of these pathways.
On the other hand, inhibitors should be highly selective to minimize treatment
induced toxicities.54 Toxicities observed in treatment with tyrosine kinase inhibitors
are diverse, varying from more general complications like diarrhea and nausea to
specific toxicities like hand foot syndrome. Most common toxicities of the anti-
angiogenic tyrosine kinase inhibitors sunitinib and sorafenib include hypertension,
bleeding, fatigue, diarrhea, nausea and/or vomiting, hand foot syndrome and
myelosuppression.54,55 Other toxicities with a low frequency include hypothyroidism,
impaired kidney function and reversible posterior leukoencephalopathy syndrome. In
addition, during sunitinib treatment hemoglobin levels and erythrocyte numbers
transiently increase.56 The anti-angiogenic monoclonal antibody bevacizumab blocks
the VEGF ligand and inhibits angiogenesis.57 Most commonly reported toxicities
induced by bevacizumab are hypertension, proteinuria, bleeding, fatigue and gastro-
intestinal symptoms.54,58,59 Since these toxicities highly overlap with toxicities induced
by anti-angiogenic tyrosine kinase inhibitors, these toxicities are expected to be
related to the targeted (VEGF) pathway. Molecular mechanisms involved in toxicities
of targeting the VEGF pathway are discussed by Verheul and Pinedo,13 and by Kamba
and McDonald.59
Tyrosine kinases have a high degree of similarity in the kinase domain. The ATP
binding site is most similar, because of its need to bind ATP for its activity. These
binding sites are highly conserved across the kinome. Type I inhibitors invariably
occupy the adenine region in the ATP binding site and for that reason it is difficult to
develop highly selective type I inhibitors. Inhibitors against less conserved regions of
a kinase can be more selective.33 Selective kinase targeting can be easier achieved
within type II inhibitors because more variability is seen among kinases in their
inactive conformation.60 Covalent inhibitors should be very selective due to their
irreversible mechanism of binding to a cysteine residue of the target kinase.
Unexpected targets of covalent inhibitors could result in serious toxicities.
Selectivity of kinase inhibitors is hard to predict when only based on structure and
sequence. Specificity profiles of kinase inhibitors can be analyzed by assessment of
binding affinities. Fabian and colleagues reported inhibitor-kinase interaction maps

Chapter 2
28
for a number of kinase inhibitors, including sunitinib, vatalanib and vandetanib.61 The
dissociation constant (Kd) was used to describe the binding affinity; the smaller the
dissociation constant, the higher the affinity of the inhibitor to a kinase. Selectivity
varied largely among agents that are presumed to target the same kinase. Vatalanib
specifically binds VEGFR-2, while sunitinib binds many additional kinases. The binding
affinities of different inhibitors vary substantially with dissociation constants of less
than 1nM to some target kinases, to 1-10μM to ‘non-target’ kinases. Although some
inhibitors show (low) affinity to a large proportion of kinases, these assays measure
binding affinity and no conclusions can be drawn on activity of the inhibitor. It is
important to realize that a low binding affinity of a tyrosine kinase inhibitor to a
certain kinase may have a crucial impact on cell signaling, while the same inhibitor
with a high binding affinity to another kinase may have no significant intracellular
downstream effect. Not only inhibition of a specific tyrosine kinase, but also the
expression level of a kinase and the number of potential parallel pathways (other
kinases) determine the downstream biological efficacy of a tyrosine kinase inhibitor.
It is important to get more insight in the relative importance of targeted kinases and
the alternative activity routes of kinases in cancer. Several approaches to determine
kinase activities in tumor samples are being explored in preclinical studies and in the
clinical setting.62-64 We expect that high throughput analyses of kinome activity
profiles in tumors from patients can be used to select specific kinase inhibitors for
treatment of patients, so called personalized medicine.
Drug resistance
Drug resistance in patients treated with anti-angiogenic therapies is an important
clinical problem.65 Tumors may acquire resistance during anti-angiogenic treatment
or show intrinsic resistance. The majority of patients transiently benefits from anti-
angiogenic therapy, before a tumor recovers and starts to grow again and forms
metastases. A small fraction of patients fails to show even initial clinical benefit.12
One possible mechanism involved in treatment resistance might be the excess of
signaling pathways that are involved in angiogenesis. Although VEGF mediated
signaling is the predominant stimulator of angiogenesis in cancer, parallel angiogenic
pathways also drive tumor growth. Activation of these pathways may overcome
inhibition by anti-angiogenic tyrosine kinase inhibitors. For example, Delta-like 4
(Dll4) mediated Notch signaling represents an important pathway in angiogenesis and
inhibition of this pathway results in excessive, non-productive angiogenesis and in
reduced tumor growth.66 It has been suggested that Dll4/ Notch signaling might be
involved in resistance to anti-VEGF therapy67 and that this pathway might be
responsible for the escape from anti-angiogenic therapy. Also the Tie receptors,

Anti-angiogenic TKIs: what is their mechanism of action?
29
2
together with their two major ligands, angiopoietin-1 (Ang-1) and angiopoietin-2 (Ang
-2), are alternative pathways to induce biological responses involved in angiogenesis,
such as vessel maturation.68 The PI3K/ Akt pathway is an example of a downstream
signaling pathway of VEGFR, which can also be activated by angiopoietin-Tie
signaling.29 Inhibition of VEGFR mediated pathways might not be sufficient to
completely inhibit signaling pathways involved in angiogenesis and as a result tumors
are able to grow and progress despite inhibition of the VEGF pathway.
VEGF was discovered as an endothelial cell mitogen and functions as an angiogenesis
stimulator.69 This suggested that VEGF acts by binding to receptors present on
endothelial cells. De Vries et al. 70 determined fms-like tyrosine kinase (Flt-1) as a
receptor for VEGF, nowadays also known as VEGFR-1. Fetal liver kinase-1 (Flk-1), the
mouse homologue of kinase insert domain-containing receptor (KDR), was shown to
be a second functional VEGF receptor and was demonstrated to play a role in
angiogenesis.71-73 Quinn et al. 72 demonstrated that Flk-1 in the mouse embryo
exclusively is expresses in the vascular endothelium and the umbilical cord stroma.
Nowadays, stimulation of VEGFR on (tumor) endothelium by VEGF is well-known.
However, VEGFRs may also be present on tumor cells, as has been shown by several
studies listed by Hicklin and Ellis.21 For that reason it could be hypothesized that VEGF
is also able to stimulate tumor cells expressing VEGFRs. Inhibitors of VEGFR may not
only restrain tumor growth by the inhibition of tumor angiogenesis, but may exert
additional inhibitory effects on tumor cells.74 We have recently found that the anti-
angiogenic tyrosine kinase inhibitor sunitinib inhibits tumor cell proliferation and
clonogenic capacity directly.75 Therefore, acquired resistance may also be a
consequence of alternative signaling of tumor cells including the production of
alternative angiogenic growth factors.
Resistance to kinase inhibitors as result of a mutation in the target kinase in tumor
cells is a well-known mechanism and is described for inhibitors such as gefitinib and
erlotinib. These two inhibitors target the epidermal growth factor receptor (EGFR)
and are used for treatment of patients with non-small cell lung cancer and several
other types of cancer. Somatic activating mutations in the EGFR have been associated
with sensitivity to these agents.76,77 Despite clinical responses to these inhibitors,
most patients acquire resistance during treatment. One mechanism of acquired
resistance is a specific secondary mutation in the EGFR. In the presence of this
secondary mutation, the kinase inhibitors are unable to inhibit phosphorylation of
the target kinase.78
Initially, resistance to anti-angiogenic tyrosine kinase inhibitors was not expected,
because these agents were supposed to target endothelial and other stroma cells
that are genetically stable and therefore unlikely to develop mutations. However,
now we know that anti-angiogenic tyrosine kinase inhibitors may also inhibit tumor

Chapter 2
30
cells directly, mutations in target receptors are more likely to occur and should be
explored as possible mechanisms of resistance. Recently, several studies reported
mutations in target kinases that correlate with resistance to sunitinib in imatinib-
resistant gastro-intestinal stromal tumors (GISTs).79-82 Heinrich et al. 79 determined
mutational status of KIT and PDGFR-α in tumors of patients with metastatic, imatinib
resistant or intolerant GISTs. They reported that primary and secondary mutations in
these kinases influence sunitinib activity. Clinical benefit and objective response rates
with sunitinib were higher in patients with primary KIT exon 9 mutations than with
exon 11 mutations. In vitro, sunitinib activity against KIT double mutants was
dependent of location of the second mutation. The PDGFR-α D842V mutant
conferred resistance to imatinib as well as to sunitinib in in vitro experiments. Nishida
et al. 80 analyzed KIT mutations in patients with imatinib-resistant GISTs, who had
been treated with sunitinib. They reported that the pre-imatinib sample had KIT
mutations in exon 9 or exon 11 (n=8) and most imatinib-resistant tumors carried a
secondary mutation. Most patients with a secondary mutation in exon 13 or 14 (the
ATP-binding domain) obtained clinical benefits from sunitinib, while most tumors
with a secondary mutation in exon 17 (the activation loop) showed resistance to the
drug. All secondary (and tertiary) mutations were located on the same allele as the
primary mutation, so called cis-mutations. Also Guo et al. 81 investigated mutations in
KIT conferring sunitinib resistance in GIST. They found that secondary mutations in
the KIT activation domain are associated with sunitinib resistance after initial
response to the drug. Gajiwala et al. 82 investigated the molecular basis of resistance
to sunitinib in GIST. They reported that the KIT mutants D816H and D816V undergo a
change in conformational equilibrium. The conversion from the inactivated kinase
conformation to the active conformation results in a drug-insensitive active form and
causes loss of inhibition.
Toxicities of tyrosine kinase inhibitors
Toxicities of anti-angiogenic tyrosine kinase inhibitors might be due to inhibitors with
multiple so-called ‘off-targets’. However, selective inhibitors may also induce
toxicities, because their target kinases are not differentially expressed by endothelial
cells. Angiogenesis inhibitors are intended to target activated tumor endothelium.
Initially, these agents were not expected to target normal vasculature, because most
blood vessels remain quiescent during adulthood.19 However, under normal
physiological circumstances growth factor signaling in endothelial cells seems
important for their survival and maintenance of vascular integrity. Inhibitors of
angiogenesis are capable of affecting signaling pathways in endothelial cells and
might elicit toxicities as a result of decreased endothelial cell renewal capacity.83

Anti-angiogenic TKIs: what is their mechanism of action?
31
2
Apart from kinase inhibitors with ‘off-targets’ activities, downstream signaling
pathways of target kinases may also be involved in the development of toxicities. As
shown above, one kinase is able to activate several downstream signaling pathways.
By inhibition of a kinase with a tyrosine kinase inhibitor, a whole spectrum of
signaling pathways can be deactivated. This might result in a reduction of specific
biological outcomes that are not intended to adjust. It has been shown that specific
kinases are involved in the normal physiology of certain organs such as kidneys and
the thyroid gland. It has been suggested that specific toxicities, like nephrotic
syndrome and fatigue might be related to interference of these inhibitors with the
normal function of these organs.84,85 Furthermore, bleeding complications (including
subungual bleedings) and wound healing problems may be caused by a disturbance
of the close interaction of platelets and the vasculature.13 In preliminary experiments,
we have found that platelet function is disturbed by anti-angiogenic kinase inhibitors
(Walraven et al, preliminary results). Another factor involved in toxicity might be an
altered pharmacodynamic effect of sunitinib treatment due to certain gene variances
as recently reported by Van Erp et al.46. These investigators analyzed in a group of
219 patients treated with single agent sunitinib a total of 31 single nucleotide
polymorphisms (SNPs) in 12 candidate genes, together with several non-genetic
variants and found a correlation between sunitinib induced leucopenia and SNP-
variants. We expect that genetic analyses will be included in routine screening before
start of treatment with kinase inhibitors to predict for treatment related toxicity.
Based on this type of analyses, dose adjustments or alternative kinase inhibitor
treatment options can be considered.
Optimal treatment strategy: multi-targeted inhibitors and combining inhibitors
Resistance is less likely to arise if multiple regulatory molecules are being targeted at
the same time.86 Multi-targeted kinase inhibitors are able to target various signaling
molecules. This may inhibit multiple parallel downstream signaling pathways or
enhance inhibition of one specific shared signaling pathway downstream of several
signaling molecules. Moreover, a drug with multiple so called ‘off-target’ effects
binds less precisely to its target kinases and is for that reason less sensitive for
dislodging due to a mutation of the target kinase.87
A decreased incidence of resistance or a delay in its development may also be
achieved by combining agents.88 Anti-angiogenic tyrosine kinase inhibitors can
variously be combined. Firstly, anti-angiogenic tyrosine kinase inhibitors can be
combined with other anti-angiogenic agents. Tyrosine kinase inhibitors could be
combined to simultaneously inhibit multiple linked signaling pathways. Besides

Chapter 2
32
‘horizontal’ inhibition of signaling pathways, inhibition in a ‘vertical’ strategy could
enhance therapy efficacy; drugs are combined to inhibit a cascade of signaling
molecules.74,89,90 By inhibition in a ‘vertical’ strategy, feedback loops in the network of
signaling pathways may be circumvented. Feedback loops are important regulators of
signaling pathway90 and might be involved in unexpected and undesirable outcomes
of targeting therapies. For example, feedback loops might be involved in the (absence
of) response to sorafenib therapy in melanomas. Although sorafenib is developed as
a Raf inhibitor, some discussion is going on whether sorafenib does certainly inhibit
Raf. Activating mutations of B-Raf are present in approximately 70% of the human
melanomas.91,92 These activating B-Raf mutations may result in an increased activity
of the downstream protein MAPK. In human melanoma cell lines it is shown that
apoptosis is increased when B-Raf expression is down-regulated using RNA
interference, suggesting that B-Raf is a therapeutic target in melanomas.93 However,
in a phase II clinical trial, it is found that sorafenib has little or no anti-tumor effect in
advanced melanoma patients.94 In addition, the addition of sorafenib to carboplatin
and paclitaxel (CP) did not improve therapy outcomes compared to CP and placebo.95
It is possible that sorafenib is not strong enough to inhibit (all) the activated mutant B
-Raf, although it shows an IC50 of 38nM to the oncogenic B-Raf V600E.8 Another
possibility is that several feedback loops downstream of B-Raf compensate for the B-
Raf inhibition. Downstream proteins of B-Raf, for example MAPK, might still be
activated by feedback loops, while B-Raf itself is inhibited. Targeting a cascade of
signaling molecules might avoid downstream responses to be still activated through
triggering of feedback loops.
Targeting a cascade of signaling molecules could also be helpful when it is unknown
which proteins are important in the development of resistance to targeted therapy.
Kinases with a high expression level are not necessary ‘key’ kinases of signaling
pathways. Kinases with a low expression level can have a high activity and may be
crucial for a signaling pathway. Defining key kinases in a signaling pathway might
improve the use of targeted therapies, but it is hard to define which protein is most
important. By targeting several proteins in the same signaling pathway, this problem
may partly be avoided. As shown above, downstream signaling pathways of receptor
tyrosine kinases not only include tyrosine kinase but also serine/ threonine kinases.
For that reason, combining tyrosine kinase inhibitors with serine/ threonine inhibitors
might be a worthwhile strategy, as well as combining anti-angiogenic tyrosine kinase
inhibitors with the anti-VEGF monoclonal antibody bevacizumab.
A second strategy to combine anti-angiogenic agents comprises the combination with
other anti-cancer therapeutics, for example conventional cytotoxic chemotherapy. It
is hypothesized that anti-angiogenic agents can induce vessel normalization of the
structurally and functionally abnormal tumor vasculature.96 This may result in

Anti-angiogenic TKIs: what is their mechanism of action?
33
2
improved delivery of cytotoxic drugs and oxygen to the tumor, and could enhance
the efficacy of chemotherapy or radiation therapy.97 In addition, it is suggested that
chemotherapy and radiation therapy may also directly damage endothelial cells, and
thus may enhance anti-angiogenic effects.21,97 Furthermore, combining anti-
angiogenic agents with chemotherapy potentially delays the development of
resistance to anti-angiogenic drugs as well as to chemotherapy.96,98 The monoclonal
antibody bevacizumab is in combination with chemotherapy approved for several
(metastatic) cancers. Currently, many clinical trials are ongoing studying the
combination of anti-angiogenic tyrosine kinase inhibitors with chemotherapy or
radiation therapy. Of course one should realize that combination of different
inhibitors or generating broader targeting inhibitors will induce more toxicity as well.
Therefore, analyses of the tumor kinome profile (genetically or with real activity
analyses) from each single patient by high throughput analyses may provide specific
kinome profiles that should be targeted at once. We expect that combination of
currently available or newly designed specific inhibitors may be prescribed based on
these kinome profiles as a standard way of personalized treatment.
Conclusions and perspectives
Targeting angiogenesis to inhibit tumor growth has been developed as a new anti-
cancer treatment strategy in the past few decades. Anti-angiogenic therapies show
clinical efficacy in diverse cancer types. Since many different regulatory factors and
signaling pathways are involved in angiogenesis, therapies targeting angiogenesis are
quite susceptible for causing toxicity and drug resistance. With respect to the excess
of signaling pathways downstream of certain kinases, selective tyrosine kinase
inhibitors have some advantages in order to minimize the induction of toxicities. On
the other hand, multi-targeted kinase inhibitors, or a combination of inhibitors, may
target additional angiogenic pathways and may carry out a broader efficacy and may
avoid resistance. It is important to get more insight in the signaling pathways that are
modified by the use of (anti-angiogenic) kinase inhibitors. A better understanding of
patient-specific kinomes including alterations in signaling pathways may circumvent
treatment-induced resistance and toxicities of anti-angiogenic agents leading to
improved clinical benefit.

Chapter 2
34
References
1. Hanahan D, Weinberg RA. The hallmarks of cancer. Cell 2000;100(1):57-70.
2. Bergers G, Benjamin LE. Tumorigenesis and the angiogenic switch. Nat Rev Cancer 2003;3
(6):401-10.
3. Folkman J. What is the evidence that tumors are angiogenesis dependent? J Natl Cancer Inst
1990;82(1):4-6.
4. Verheul HM, Voest EE, Schlingemann RO. Are tumours angiogenesis-dependent? J Pathol
2004;202(1):5-13.
5. Folkman J. Tumor angiogenesis: therapeutic implications. N Engl J Med 1971;285(21):1182-6.
6. Folkman J. Angiogenesis: an organizing principle for drug discovery? Nat Rev Drug Discov
2007;6(4):273-86.
7. Faivre S, Demetri G, Sargent W, Raymond E. Molecular basis for sunitinib efficacy and future
clinical development. Nat Rev Drug Discov 2007;6(9):734-45.
8. Wilhelm S, Carter C, Lynch M et al. Discovery and development of sorafenib: a multikinase
inhibitor for treating cancer. Nat Rev Drug Discov 2006;5(10):835-44.
9. Motzer RJ, Bukowski RM. Targeted therapy for metastatic renal cell carcinoma. J Clin Oncol
2006;24(35):5601-8.
10. Escudier B, Eisen T, Stadler WM et al. Sorafenib in advanced clear-cell renal-cell carcinoma. N
Engl J Med 2007;356(2):125-34.
11. Llovet JM, Ricci S, Mazzaferro V et al. Sorafenib in advanced hepatocellular carcinoma. N Engl
J Med 2008;359(4):378-90.
12. Bergers G, Hanahan D. Modes of resistance to anti-angiogenic therapy. Nat Rev Cancer
2008;8(8):592-603.
13. Verheul HM, Pinedo HM. Possible molecular mechanisms involved in the toxicity of
angiogenesis inhibition. Nat Rev Cancer 2007;7(6):475-85.
14. Manning G, Whyte DB, Martinez R, Hunter T, Sudarsanam S. The protein kinase complement
of the human genome. Science 2002;298(5600):1912-34.
15. Liu Y, Gray NS. Rational design of inhibitors that bind to inactive kinase conformations. Nat
Chem Biol 2006;2(7):358-64.
16. Schlessinger J. Cell signaling by receptor tyrosine kinases. Cell 2000;103(2):211-25.
17. Hubbard SR, Miller WT. Receptor tyrosine kinases: mechanisms of activation and signaling.
Curr Opin Cell Biol 2007;19(2):117-23.
18. Pawson T. Specificity in signal transduction: from phosphotyrosine-SH2 domain interactions
to complex cellular systems. Cell 2004;116(2):191-203.
19. Carmeliet P. Angiogenesis in life, disease and medicine. Nature 2005;438(7070):932-6.
20. Kerbel RS. Tumor angiogenesis. N Engl J Med 2008;358(19):2039-49.
21. Hicklin DJ, Ellis LM. Role of the vascular endothelial growth factor pathway in tumor growth
and angiogenesis. J Clin Oncol 2005;23(5):1011-27.

Anti-angiogenic TKIs: what is their mechanism of action?
35
2
22. Andrae J, Gallini R, Betsholtz C. Role of platelet-derived growth factors in physiology and
medicine. Genes Dev 2008;22(10):1276-312.
23. Jain RK. Molecular regulation of vessel maturation. Nat Med 2003;9(6):685-93.
24. Beenken A, Mohammadi M. The FGF family: biology, pathophysiology and therapy. Nat Rev
Drug Discov 2009;8(3):235-53.
25. Takahashi T, Yamaguchi S, Chida K, Shibuya M. A single autophosphorylation site on KDR/Flk-
1 is essential for VEGF-A-dependent activation of PLC-gamma and DNA synthesis in vascular
endothelial cells. EMBO J 2001;20(11):2768-78.
26. Mackay HJ, Twelves CJ. Targeting the protein kinase C family: are we there yet? Nat Rev
Cancer 2007;7(7):554-62.
27. Zachary I, Gliki G. Signaling transduction mechanisms mediating biological actions of the
vascular endothelial growth factor family. Cardiovasc Res 2001;49(3):568-81.
28. Ravichandran KS, Lorenz U, Shoelson SE, Burakoff SJ. Interaction of Shc with Grb2 regulates
association of Grb2 with mSOS. Mol Cell Biol 1995;15(2):593-600.
29. Shibuya M. Vascular endothelial growth factor-dependent and -independent regulation of
angiogenesis. BMB Rep 2008;41(4):278-86.
30. Engelman JA, Luo J, Cantley LC. The evolution of phosphatidylinositol 3-kinases as regulators
of growth and metabolism. Nat Rev Genet 2006;7(8):606-19.
31. Manning BD, Cantley LC. AKT/PKB signaling: navigating downstream. Cell 2007;129(7):1261-
74.
32. Memmott RM, Dennis PA. Akt-dependent and -independent mechanisms of mTOR regulation
in cancer. Cell Signal 2009;21(5):656-64.
33. Klein S, McCormick F, Levitzki A. Killing time for cancer cells. Nat Rev Cancer 2005;5(7):573-
80.
34. Morbidelli L, Donnini S, Ziche M. Role of nitric oxide in the modulation of angiogenesis. Curr
Pharm Des 2003;9(7):521-30.
35. Olsson AK, Dimberg A, Kreuger J, Claesson-Welsh L. VEGF receptor signalling - in control of
vascular function. Nat Rev Mol Cell Biol 2006;7(5):359-71.
36. Kowanetz M, Ferrara N. Vascular endothelial growth factor signaling pathways: therapeutic
perspective. Clin Cancer Res 2006;12(17):5018-22.
37. Matsumoto T, Bohman S, Dixelius J et al. VEGF receptor-2 Y951 signaling and a role for the
adapter molecule TSAd in tumor angiogenesis. EMBO J 2005;24(13):2342-53.
38. McMullen ME, Bryant PW, Glembotski CC, Vincent PA, Pumiglia KM. Activation of p38 has
opposing effects on the proliferation and migration of endothelial cells. J Biol Chem 2005;280
(22):20995-1003.
39. Mitra SK, Hanson DA, Schlaepfer DD. Focal adhesion kinase: in command and control of cell
motility. Nat Rev Mol Cell Biol 2005;6(1):56-68.
40. Zachary I. Signaling mechanisms mediating vascular protective actions of vascular endothelial
growth factor. Am J Physiol Cell Physiol 2001;280(6):C1375-86.
Chapter 2
36
41. Imai K, Takaoka A. Comparing antibody and small-molecule therapies for cancer. Nat Rev
Cancer 2006;6(9):714-27.
42. Goodman VL, Rock EP, Dagher R et al. Approval summary: sunitinib for the treatment of
imatinib refractory or intolerant gastrointestinal stromal tumors and advanced renal cell
carcinoma. Clin Cancer Res 2007;13(5):1367-73.
43. Kane RC, Farrell AT, Saber H et al. Sorafenib for the treatment of advanced renal cell
carcinoma. Clin Cancer Res 2006;12(24):7271-8.
44. Houk BE, Bello CL, Kang D, Amantea M. A population pharmacokinetic meta-analysis of
sunitinib malate (SU11248) and its primary metabolite (SU12662) in healthy volunteers and
oncology patients. Clin Cancer Res 2009;15(7):2497-506.
45. Adams VR, Leggas M. Sunitinib malate for the treatment of metastatic renal cell carcinoma
and gastrointestinal stromal tumors. Clin Ther 2007;29(7):1338-53.
46. van Erp NP, Eechoute K, van der Veldt AA et al. Pharmacogenetic Pathway Analysis for
Determination of Sunitinib-Induced Toxicity. J Clin Oncol 2009;27(26):4406-12.
47. Zhang J, Yang PL, Gray NS. Targeting cancer with small molecule kinase inhibitors. Nat Rev
Cancer 2009;9(1):28-39.
48. Mendel DB, Laird AD, Xin X et al. In vivo antitumor activity of SU11248, a novel tyrosine
kinase inhibitor targeting vascular endothelial growth factor and platelet-derived growth
factor receptors: determination of a pharmacokinetic/pharmacodynamic relationship. Clin
Cancer Res 2003;9(1):327-37.
49. Johnson LN. Protein kinase inhibitors: contributions from structure to clinical compounds. Q
Rev Biophys 2009;42(1):1-40.
50. Wan PT, Garnett MJ, Roe SM et al. Mechanism of activation of the RAF-ERK signaling
pathway by oncogenic mutations of B-RAF. Cell 2004;116(6):855-67.
51. Kwak EL, Sordella R, Bell DW et al. Irreversible inhibitors of the EGF receptor may circumvent
acquired resistance to gefitinib. Proc Natl Acad Sci USA 2005;102(21):7665-70.
52. Wissner A, Fraser HL, Ingalls CL et al. Dual irreversible kinase inhibitors: quinazoline-based
inhibitors incorporating two independent reactive centers with each targeting different
cysteine residues in the kinase domains of EGFR and VEGFR-2. Bioorg Med Chem 2007;15
(11):3635-48.
53. Morabito A, Piccirillo MC, Falasconi F et al. Vandetanib (ZD6474), a dual inhibitor of vascular
endothelial growth factor receptor (VEGFR) and epidermal growth factor receptor (EGFR)
tyrosine kinases: current status and future directions. Oncologist 2009;14(4):378-90.
54. Eskens FA, Verweij J. The clinical toxicity profile of vascular endothelial growth factor (VEGF)
and vascular endothelial growth factor receptor (VEGFR) targeting angiogenesis inhibitors; a
review. Eur J Cancer 2006;42(18):3127-39.
55. Bhojani N, Jeldres C, Patard JJ et al. Toxicities associated with the administration of sorafenib,
sunitinib, and temsirolimus and their management in patients with metastatic renal cell
carcinoma. Eur Urol 2008;53(5):917-30.

Anti-angiogenic TKIs: what is their mechanism of action?
37
2
56. Van der Veldt AA, Boven E, Vroling L, Broxterman HJ, van den Eertwegh AJ, Haanen JB.
Sunitinib-induced hemoglobin changes are related to the dosing schedule. J Clin Oncol
2009;27(8):1339-40.
57. Ferrara N, Hillan KJ, Gerber HP, Novotny W. Discovery and development of bevacizumab, an
anti-VEGF antibody for treating cancer. Nat Rev Drug Discov 2004;3(5):391-400.
58. Gressett SM, Shah SR. Intricacies of bevacizumab-induced toxicities and their management.
Ann Pharmacother 2009;43(3):490-501.
59. Kamba T, McDonald DM. Mechanisms of adverse effects of anti-VEGF therapy for cancer. Br J
Cancer 2007;96(12):1788-95.
60. Mol CD, Fabbro D, Hosfield DJ. Structural insights into the conformational selectivity of STI-
571 and related kinase inhibitors. Curr Opin Drug Discov Devel 2004;7(5):639-48.
61. Fabian MA, Biggs WH, III, Treiber DK et al. A small molecule-kinase interaction map for
clinical kinase inhibitors. Nat Biotechnol 2005;23(3):329-36.
62. van Baal JW, Diks SH, Wanders RJ et al. Comparison of kinome profiles of Barrett's esophagus
with normal squamous esophagus and normal gastric cardia. Cancer Res 2006;66(24):11605-
12.
63. Gromov P, Celis JE, Gromova I, Rank F, Timmermans-Wielenga V, Moreira JM. A single lysis
solution for the analysis of tissue samples by different proteomic technologies. Mol Oncol
2008;2(4):368-79.
64. Sikkema AH, Diks SH, den Dunnen WF et al. Kinome profiling in pediatric brain tumors as a
new approach for target discovery. Cancer Res 2009;69(14):5987-95.
65. Broxterman HJ, Gotink KJ, Verheul HM. Understanding the causes of multidrug resistance in
cancer: a comparison of doxorubicin and sunitinib. Drug Resist Updat 2009;12(4-5):114-26.
66. Thurston G, Noguera-Troise I, Yancopoulos GD. The Delta paradox: DLL4 blockade leads to
more tumour vessels but less tumour growth. Nat Rev Cancer 2007;7(5):327-31.
67. Ellis LM, Hicklin DJ. Pathways mediating resistance to vascular endothelial growth factor-
targeted therapy. Clin Cancer Res 2008;14(20):6371-5.
68. Augustin HG, Koh GY, Thurston G, Alitalo K. Control of vascular morphogenesis and
homeostasis through the angiopoietin-Tie system. Nat Rev Mol Cell Biol 2009;10(3):165-77.
69. Leung DW, Cachianes G, Kuang WJ, Goeddel DV, Ferrara N. Vascular endothelial growth
factor is a secreted angiogenic mitogen. Science 1989;246(4935):1306-9.
70. de Vries C, Escobedo JA, Ueno H, Houck K, Ferrara N, Williams LT. The fms-like tyrosine
kinase, a receptor for vascular endothelial growth factor. Science 1992;255(5047):989-91.
71. Millauer B, Wizigmann-Voos S, Schnurch H et al. High affinity VEGF binding and
developmental expression suggest Flk-1 as a major regulator of vasculogenesis and
angiogenesis. Cell 1993;72(6):835-46.
72. Quinn TP, Peters KG, de Vries C, Ferrara N, Williams LT. Fetal liver kinase 1 is a receptor for
vascular endothelial growth factor and is selectively expressed in vascular endothelium. Proc
Natl Acad Sci USA 1993;90(16):7533-7.

Chapter 2
38
73. Millauer B, Shawver LK, Plate KH, Risau W, Ullrich A. Glioblastoma growth inhibited in vivo by
a dominant-negative Flk-1 mutant. Nature 1994;367(6463):576-9.
74. Ellis LM, Hicklin DJ. VEGF-targeted therapy: mechanisms of anti-tumour activity. Nat Rev
Cancer 2008;8(8):579-91.
75. Gotink KJ, Rudek MA, Broxterman HJ et al. The antiangiogenic tyrosine kinase inhibitor
sunitinib has direct antitumor activity on renal and colorectal cancer cells in vitro at
intratumoral concentrations achieved in mice. In: Proceedings of the 100th Annual Meeting
on American Association of Cancer Research 2009;Denver, CO, Abstract no.150.
76. Lynch TJ, Bell DW, Sordella R et al. Activating mutations in the epidermal growth factor
receptor underlying responsiveness of non-small-cell lung cancer to gefitinib. N Engl J Med
2004;350(21):2129-39.
77. Pao W, Miller V, Zakowski M et al. EGF receptor gene mutations are common in lung cancers
from "never smokers" and are associated with sensitivity of tumors to gefitinib and erlotinib.
Proc Natl Acad Sci USA 2004;101(36):13306-11.
78. Engelman JA, Janne PA. Mechanisms of acquired resistance to epidermal growth factor
receptor tyrosine kinase inhibitors in non-small cell lung cancer. Clin Cancer Res 2008;14
(10):2895-9.
79. Heinrich MC, Maki RG, Corless CL et al. Primary and secondary kinase genotypes correlate
with the biological and clinical activity of sunitinib in imatinib-resistant gastrointestinal
stromal tumor. J Clin Oncol 2008;26(33):5352-9.
80. Nishida T, Takahashi T, Nishitani A et al. Sunitinib-resistant gastrointestinal stromal tumors
harbor cis-mutations in the activation loop of the KIT gene. Int J Clin Oncol 2009;14(2):143-9.
81. Guo T, Hajdu M, Agaram NP et al. Mechanisms of sunitinib resistance in gastrointestinal
stromal tumors harboring KITAY502-3ins mutation: an in vitro mutagenesis screen for drug
resistance. Clin Cancer Res 2009;15(22):6862-70.
82. Gajiwala KS, Wu JC, Christensen J et al. KIT kinase mutants show unique mechanisms of drug
resistance to imatinib and sunitinib in gastrointestinal stromal tumor patients. Proc Natl Acad
Sci USA 2009;106(5):1542-7.
83. Widakowich C, de Castro G Jr., de Azambuja E, Dinh P, Awada A. Review: side effects of
approved molecular targeted therapies in solid cancers. Oncologist 2007;12(12):1443-55.
84. Eremina V, Jefferson JA, Kowalewska J et al. VEGF inhibition and renal thrombotic
microangiopathy. N Engl J Med 2008;358(11):1129-36.
85. Torino F, Corsello SM, Longo R, Barnabei A, Gasparini G. Hypothyroidism related to tyrosine
kinase inhibitors: an emerging toxic effect of targeted therapy. Nat Rev Clin Oncol 2009;6
(4):219-28.
86. Dent P, Curiel DT, Fisher PB, Grant S. Synergistic combinations of signaling pathway
inhibitors: mechanisms for improved cancer therapy. Drug Resist Updat 2009;12(3):65-73.
87. Fojo T. Commentary: Novel therapies for cancer: why dirty might be better. Oncologist
2008;13(3):277-83.

Anti-angiogenic TKIs: what is their mechanism of action?
39
2
88. Sebolt-Leopold JS, English JM. Mechanisms of drug inhibition of signalling molecules. Nature
2006;441(7092):457-62.
89. Verheul HM, Salumbides B, Van Erp K et al. Combination strategy targeting the hypoxia
inducible factor-1 alpha with mammalian target of rapamycin and histone deacetylase
inhibitors. Clin Cancer Res 2008;14(11):3589-97.
90. Araujo RP, Liotta LA, Petricoin EF. Proteins, drug targets and the mechanisms they control:
the simple truth about complex networks. Nat Rev Drug Discov 2007;6(11):871-80.
91. Davies H, Bignell GR, Cox C et al. Mutations of the BRAF gene in human cancer. Nature
2002;417(6892):949-54.
92. Garnett MJ, Marais R. Guilty as charged: B-RAF is a human oncogene. Cancer Cell 2004;6
(4):313-9.
93. Karasarides M, Chiloeches A, Hayward R et al. B-RAF is a therapeutic target in melanoma.
Oncogene 2004;23(37):6292-8.
94. Eisen T, Ahmad T, Flaherty KT et al. Sorafenib in advanced melanoma: a Phase II randomised
discontinuation trial analysis. Br J Cancer 2006;95(5):581-6.
95. Hauschild A, Agarwala SS, Trefzer U et al. Results of a phase III, randomized, placebo-
controlled study of sorafenib in combination with carboplatin and paclitaxel as second-line
treatment in patients with unresectable stage III or stage IV melanoma. J Clin Oncol 2009;27
(17):2823-30.
96. Jain RK. Normalizing tumor vasculature with anti-angiogenic therapy: a new paradigm for
combination therapy. Nat Med 2001;7(9):987-9.
97. Jain RK. Normalization of tumor vasculature: an emerging concept in antiangiogenic therapy.
Science 2005;307(5706):58-62.
98. Kerbel RS. Antiangiogenic therapy: a universal chemosensitization strategy for cancer?
Science 2006;312(5777):1171-5.
99. Podar K, Tonon G, Sattler M et al. The small-molecule VEGF receptor inhibitor pazopanib
(GW786034B) targets both tumor and endothelial cells in multiple myeloma. Proc Natl Acad
Sci USA 2006;103(51):19478-83.
100. Sloan B, Scheinfeld NS. Pazopanib, a VEGF receptor tyrosine kinase inhibitor for cancer
therapy. Curr Opin Investig Drugs 2008;9(12):1324-35.
101. Wedge SR, Ogilvie DJ, Dukes M et al. ZD6474 inhibits vascular endothelial growth factor
signaling, angiogenesis, and tumor growth following oral administration. Cancer Res 2002;62
(16):4645-55.
102. Ciardiello F, Caputo R, Damiano V et al. Antitumor effects of ZD6474, a small molecule
vascular endothelial growth factor receptor tyrosine kinase inhibitor, with additional activity
against epidermal growth factor receptor tyrosine kinase. Clin Cancer Res 2003;9(4):1546-56.
103. Hu-Lowe DD, Zou HY, Grazzini ML et al. Nonclinical antiangiogenesis and antitumor activities
of axitinib (AG-013736), an oral, potent, and selective inhibitor of vascular endothelial
growth factor receptor tyrosine kinases 1, 2, 3. Clin Cancer Res 2008;14(22):7272-83.

Chapter 2
40
104. Schiller JH, Larson T, Ou SH et al. Efficacy and Safety of Axitinib in Patients With Advanced
Non-Small-Cell Lung Cancer: Results From a Phase II Study. J Clin Oncol 2009;27(23):3836-41.
105. Wedge SR, Kendrew J, Hennequin LF et al. AZD2171: a highly potent, orally bioavailable,
vascular endothelial growth factor receptor-2 tyrosine kinase inhibitor for the treatment of
cancer. Cancer Res 2005;65(10):4389-4400.
106. Lindsay CR, MacPherson IR, Cassidy J. Current status of cediranib: the rapid development of a
novel anti-angiogenic therapy. Future Oncol 2009;5(4):421-32.
107. Wood JM, Bold G, Buchdunger E et al. PTK787/ZK 222584, a novel and potent inhibitor of
vascular endothelial growth factor receptor tyrosine kinases, impairs vascular endothelial
growth factor-induced responses and tumor growth after oral administration. Cancer Res
2000;60(8):2178-89.
108. Scott EN, Meinhardt G, Jacques C, Laurent D, Thomas AL. Vatalanib: the clinical development
of a tyrosine kinase inhibitor of angiogenesis in solid tumours. Expert Opin Investig Drugs
2007;16(3):367-79.
109. Polverino A, Coxon A, Starnes C et al. AMG 706, an oral, multikinase inhibitor that selectively
targets vascular endothelial growth factor, platelet-derived growth factor, and kit receptors,
potently inhibits angiogenesis and induces regression in tumor xenografts. Cancer Res
2006;66(17):8715-21.
110. Schlumberger MJ, Elisei R, Bastholt L et al. Phase II Study of Safety and Efficacy of Motesanib
in Patients With Progressive or Symptomatic, Advanced or Metastatic Medullary Thyroid
Cancer. J Clin Oncol 2009;27(23):3794-801.


Chapter 3
Lysosomal sequestration of sunitinib:
a novel mechanism of drug resistance
Kristy J. Gotink, Henk J. Broxterman, Mariette Labots, Richard
R. de Haas, Henk Dekker, Richard J. Honeywell, Michelle A.
Rudek, Laurens V. Beerepoot, René J. Musters, Gerrit Jansen,
Arjan W. Griffioen, Yehuda G. Assaraf, Roberto Pili,
Godefridus J. Peters, Henk M.W. Verheul
Clinical Cancer Research 2011;17(23):7337-46

Chapter 3
44
Abstract
Purpose: Resistance to anti-angiogenic tyrosine kinase inhibitors such as sunitinib is
an important clinical problem, but its underlying mechanisms are largely unknown.
We analyzed tumor sunitinib levels in mice and patients and studied sensitivity and
resistance mechanisms to sunitinib.
Experimental design: Intratumoral and plasma sunitinib concentrations in mice and
patients were determined. Sunitinib exposure on tumor cell proliferation was
examined. Resistant tumor cells were derived by continuous exposure and studied
for alterations in intracellular sunitinib accumulation and activity.
Results: Intratumoral concentrations of sunitinib in mice and patients were 10.9 ± 0.5
and 9.5 ± 2.4 µM respectively, while plasma concentrations were 10-fold lower, 1.0 ±
0.1 and 0.3 ± 0.1 µM, respectively. Sunitinib inhibited tumor cell growth at clinically
relevant concentrations in vitro, with IC50 values of 1.4 to 2.3 µM. Continuous
exposure to sunitinib resulted in resistance of 786-O renal and HT-29 colon cancer
cells. Fluorescent microscopy revealed intracellular sunitinib distribution to acidic
lysosomes, which were significantly higher expressed in resistant cells. An 1.7 to 2.5-
fold higher sunitinib concentration in resistant cells was measured due to increased
lysosomal sequestration. Despite the higher intracellular sunitinib accumulation,
levels of the key signaling p-Akt and p-ERK1/2 were unaffected and comparable to
untreated parental cells, indicating reduced effectiveness of sunitinib.
Conclusion: We report that sunitinib inhibits tumor cell proliferation at clinically
relevant concentrations and found lysosomal sequestration to be a novel mechanism
of sunitinib resistance. This finding warrants clinical evaluation whether targeting
lysosomal function will overcome sunitinib resistance.

Lysosomal sequestration of sunitinib: a novel mechanism of drug resistance
45
3
Introduction
Resistance to anti-angiogenic tyrosine kinase inhibitors (TKIs) is a major clinical
problem and mechanistic insight into the possible underlying mechanisms of
resistance is limited.1 Sunitinib is an anti-angiogenic TKI which prolongs progression-
free and overall survival of patients with advanced renal cell carcinoma (RCC)2,3 and
of patients with gastrointestinal stroma cell tumors refractory to imatinib treatment.4
Recently, sunitinib has shown activity in patients with advanced pancreatic
neuroendocrine tumors as well.5 Several distinct resistance mechanisms to sunitinib
and other anti-angiogenic TKIs have been proposed based on preclinical studies
including induction of alternative growth factor signaling as well as epithelial to
mesenchymal transformation (EMT),6-9 but these cannot fully explain the clinical
observations of resistance. Acquired mutations in target kinases play an important
role in TKI resistance such as to imatinib in chronic myeloid leukemia and to B-RAF
inhibitors in melanoma, but altered pharmaco-kinetics and -dynamics should be
evaluated as potential resistance mechanisms as well.10 While sunitinib has been
developed as an anti-angiogenic agent, intended to primarily target endothelial and
perivascular cells through its high-affinity binding to the vascular endothelial growth
factor receptor (VEGFR)-2 and plateled-derived growth factor receptor (PDGFR), it
inhibits many other kinases.11 In fact, Karaman and colleagues12 studied the affinity of
TKIs to a panel of 317 kinases and found that sunitinib has a low selectivity for
specific tyrosine kinases.
Based on this potential broader profile of kinase inhibition, we investigated whether
an alternative mechanism of action may play a role in the antitumor activity of
sunitinib rather than solely its anti-angiogenic activity. We determined intratumoral
concentrations of sunitinib and studied these clinically relevant concentrations on
tumor cells and endothelial cells in vitro. In addition, we studied whether continuous
sunitinib exposure would induce tumor cell resistance. We found that sunitinib
resistance of tumor cells is mediated by lysosomal sequestration. This sunitinib
resistance mechanism is transient as shown by recovery after drug-free culture and
can be modulated by interference with lysosomal function. Therefore, this new
resistance mechanism warrants further clinical translation.
Materials and methods
Cell culture
The tumor cell lines 786-O, HT-29, DLD-1, HCT116 and MCF-7 were cultured in DMEM
medium supplemented with 5% fetal bovine serum (FBS). The 786-O and HT-29 cell
lines were authenticated by the American Tissue Culture Collection (ATCC). Human

Chapter 3
46
umbilical vein endothelial cells (HUVECs) were isolated from human umbilical cords.
Endothelial colony forming cells (ECFCs) were isolated from the mononuclear cell
fraction that was obtained from cord blood. To induce resistance, 786-O and HT-29
cancer cell lines were continuously exposed for more than 12 months to gradually
increasing concentrations of sunitinib up to 6 µM (786-O) or 12 µM (HT-29). Cells
were maintained in a humidified incubator containing 5% CO2 at 37°C. Sunitinib was
provided by Pfizer Global Pharmaceuticals and was prepared as 20 mM stock solution
in DMSO (Sigma-Aldrich) and stored at -20°C.
Sunitinib measurements in murine samples, human samples and in vitro
BALB/c female mice were injected with 5 x 10⁵ Renca RCC tumor cells and treated
with sunitinib (40 mg/kg/d) and sacrificed after 1 month. Experiments were approved
by the Institutional Care and Use Committee at the Johns Hopkins Medical
Institutions and in accordance with the NIH Guide for the care and use of laboratory
animals.
Three patients diagnosed with advanced malignancies (malignant solitary fibrous
tumor, colorectal cancer and leiomyosarcoma) were treated with sunitinib in context
of a clinical trial at a dose of 37.5 - 50 mg/d for at least 4 weeks. Tumors of these
patients were biopsied and in parallel plasma samples were collected. The use of
these samples was in accordance with the local ethical guidelines at VU University
Medical Center. For the determination of sunitinib in tissue (tumor or skin), an
amount of about 10 mg of snap frozen tissue was cut, put into a vial and weighed. A
total of 200 µL of water was added, the sample was snap-frozen and freeze-dried
overnight. For extraction, 200 µl of ice-cold 83% acetonitrile (ACN) was added and
left on ice for one hour. After centrifugation, 50 µL of supernatant was transferred
for subsequent liquid chromatography – tandem mass spectrometry (LC-MS/MS)
analysis as reported previously for plasma and cell pellet homogenates.13 The data
are expressed in mol/L to allow comparison of tissue concentrations with the IC50
values in cell culture and are based on the conversion of 1 gram of tissue to 1 mL of
liquid.14
Proliferation and clonogenic assays
For proliferation and clonogenic assays, cells were seeded and allowed to attach for
24h. After these 24h, sunitinib was added at different concentrations. For
proliferation assays, a t=0 measurement was performed at the same time. Cell
proliferation was studied 96h after sunitinib treatment. T=0 and t=96h
measurements are performed using MTT (3-(4,5-dimethylthiazolyl-2)-2,5-diophenyl
tetrazolium bromide) or by cell counts. Cell proliferation was calculated using the
following formula:

Lysosomal sequestration of sunitinib: a novel mechanism of drug resistance
47
3
% of proliferation = ((96h measurement of treated cells – 0h measurement) / (96h
measurement of untreated cells – 0h measurement)) x 100 %
Subtracting the measurement at the beginning of treatment (t=0 measurement)
might result in negative value, representing cell killing.
For clonogenic assays,15 medium was refreshed after 72 hours of sunitinib treatment.
After 10 days in drug-free medium, colonies were fixed, stained with 10% Giemsa and
counted. Proliferation and clonogenic assays were performed in triplicate and
repeated a minimum of three times independently. IC50 values of the parental and
resistant cell lines were estimated in parallel in 4 independent experiments, by direct
reading from the proliferation curve. Results were normalized to DMSO controls.
Western blot analysis
Cells were treated as indicated. Cells were lysed in M-PER Mammalian Protein
Extraction Reagent (Pierce) supplemented with Protease and Phosphatase Inhibitor
Cocktails (Pierce). Protein concentrations were determined by Micro BCA protein
assay (Pierce). Samples containing 50 µg protein underwent electrophoresis on 8-
12% SDS polyacrylamide gels and were subsequently transferred to PVDF
membranes. Proteins were detected using the following antibodies (with catalogue
numbers in parentheses): Akt (9272), phospho-Akt (on Ser473; 9271), ERK 1/2 (9102),
phospho-ERK 1/2 (on Thr202 and Tyr204; 9101) (Cell Signaling Technology), LAMP-1
(sc-20011), LAMP-2 (sc-18822) (Santa Cruz biotechnology), β-actin (A5441) (Sigma-
Aldrich). After incubation with IRDye infrared dye labeled secondary antibodies (LI-
COR Biosciences), membranes were scanned and analyzed with the Odyssey Infrared
Imaging System and accompanying software program (LI-COR Biosciences).16
Subcellular co-localization studies
Cells were incubated with sunitinib, Lysotracker Red DND-99 (Invitrogen) or
Mitotracker Red FM (Invitrogen), Hoechst 33342 (Invitrogen) and bafilomycin A1 (LC
laboratories) or ammonium chloride (NH4Cl; Sigma-Aldrich) as indicated. Viable cells
were imaged in real time with a Zeiss Axiovert 200 Marianas inverted microscope
(ZEISS) equipped with a motorized stage (stepper-motor z axis increments, 0.1 μm),
multiple fluorescence (FITC filter for sunitinib, Cy3 filter for Lysotracker or
Mitotracker and DAPI filter for Hoechst nuclear stain), and a Cooke Sensicam cooled
charge-coupled device camera (Cooke; 1,280 by 1,024 pixels) with true 16-bit
capability at 63x oil immersion objective. The acquisition protocols included 3D
optical sections in real time. Image acquisition and analysis was performed under full
software control (SlideBook 5.0.0.18; Intelligent Imaging Innovations). 3D optical
sections were deconvoluted using the same software. Representative images from
more than three independent experiments are shown.

Chapter 3
48
Statistical analysis
Data are expressed as means ± standard error of the mean (SEM). When
appropriate, results are shown as normalized data (percentage of DMSO controls).
Statistical analyses were performed using a Student’s t test. A P value < 0.05 was
considered to be statistically significant.*, P value < 0.05; **, P value < 0.01; ***, P
value < 0.001.
Results
Intratumoral sunitinib concentrations are significantly higher than plasma concentrations
After four weeks of sunitinib treatment at a dose of 40 mg/kg/d, intratumoral
sunitinib concentrations in the murine Renca RCC model were 10-fold higher than the
corresponding steady-state plasma concentrations (mean ± SEM [range]: 10.9 ± 0.5
[9.95 - 11.8] µM versus 1.0 ± 0.1 [0.84 - 1.2] µM sunitinib; n=3, respectively; P <
0.001) (Fig. 1a). The intratumoral sunitinib concentrations in µM correspond to, in µg
sunitinib per g tissue: 4.33 ± 0.21 [3.96 - 4.69] µg/g. In normal skin tissue of these
mice, sunitinib concentrations were comparable to intratumoral concen-trations
(mean [range]: 7.4 [6.6 - 8.3] µM, or in µg/g: 3.0 [2.6 - 3.3]; n=2). Subsequently,
tumor biopsies from three patients undergoing sunitinib treatment were obtained. In
line with the murine data, intratumoral concentrations in patients were 30-fold
higher compared to plasma concentrations. Intratumoral concentrations of sunitinib
in patients were 9.5 ± 2.4 [5.1 - 13.4] µM while their plasma concentrations were 0.3
± 0.1 [0.22 - 0.34] µM; n=3; P < 0.05) (Fig. 1a). The intratumoral sunitinib
concentrations in µM correspond to, in µg sunitinib per g tissue: 3.79 ± 1.67 [2.02 -
5.32] µg/g.
Sunitinib directly inhibits tumor cells at intratumoral concentrations
In a panel of RCC, colorectal cancer (CRC) and breast cancer cell lines, sunitinib
inhibited the proliferation at clinically achievable intratumoral drug concentrations,
with inhibitory concentrations of 50% (IC50) ranging between 1.4 to 2.3 µM (Fig. 1b).
These results were confirmed in a clonogenic assay in a subset of cancer cell lines
(Fig. 1c). In addition, sunitinib inhibited the proliferation of human umbilical vein
endothelial cells (HUVECs) and endothelial colony forming cells (ECFCs) grown in
complete medium at similar concentrations (Fig. 1d). Western blot analysis of tumor
cell lysates revealed that sunitinib reduced phosphorylation of ERK 1/2 and Akt,
which are two downstream signaling proteins of sunitinib targets17,18 (Fig. 1e). No
inhibition of Akt phosphorylation was observed in 786-O cells in accordance with a
mutated PTEN status in this cell line causing constitutive activation of the Akt
pathway.19

Lysosomal sequestration of sunitinib: a novel mechanism of drug resistance
49
3
Prolonged sunitinib exposure results in tumor cell resistance in vitro
786-O and HT-29 cells were cultured for more than 12 months at gradually increasing
sunitinib concentrations. This prolonged drug exposure resulted in tumor cell
resistance, which is reflected by a continuation of growth at sunitinib concentrations
above 6 µM while at these concentrations cell death is induced in the parental 786-O
and HT-29 cells (Fig. 2a). IC50 values were increased in the sunitinib-resistant cells
compared to the parental cells from 1.2 to 3.1 µM in 786-O cells (P < 0.001) and from
1.9 to 3.5 µM in HT-29 cells (P < 0.05) (Fig. 2b). In addition, resistant cells had a
0 2 4 6 8 100
20
40
60
80
100
120 HT-29DLD-1HCT116
Sunitinib (µmol/L)
Co
lon
y fo
rmat
ion
(%
)
0 2 4 6 8 10 120
20
40
60
80
100
120HUVECECFC
Sunitinib (µmol/L)
Pro
life
rati
on
(%
) HT-29
p-ERK 1/2
- +
786-O
ERK 1/2
p-Akt
Akt
β-actin
Sunitinib- +
5 10 15-20
0
20
40
60
80
100
120786-OHT-29DLD-1HCT116MCF-7
Sunitinib (µmol/L)
Pro
life
rati
on
(%
)
plasma intratumoral0
5
10
15
mice
human
***
*
Su
nit
inib
co
nc.
(µ
mo
l/L)
Figure 1. High intratumoral concentrations of sunitinib inhibit tumor cells directly.
a, Intratumoral and plasma concentrations of sunitinib in mice with RCC tumors (n=3) and patients
with advanced malignancies (n=3), treated with sunitinib at a dose of 40 mg/kg/d for 1 months
(mice) or 37.5 – 50 mg/d for at least 4 weeks (patients). b, Proliferation (MTT assay) of tumor cell
lines incubated with increasing sunitinib concentrations. Sunitinib inhibited proliferation of tumor
cells at clinically relevant intratumoral concentrations. c, Sunitinib inhibition of colony formation of
tumor cell lines. d, Proliferation of endothelial cells incubated with increasing concentrations of
sunitinib, while grown in complete medium. Human umbilical vein endothelial cells (HUVECs) were
cultured in M199 medium supplemented with 10% fetal bovine serum (FBS) and 10% human serum
while endothelial colony forming cells (ECFCs) were cultured in EBM-2 medium supplemented with
10% FBS, VEGF, EGF, IGF and FGF. e, Western blot analysis of (phosphorylated) ERK 1/2 and Akt in
786-O and HT-29 cell lines treated with 2 µM sunitinib for 1 hour, compared to DMSO controls.
Results are shown as means ± SEM; *, P < 0.05; ***, P < 0.001
a b
c d
e

Chapter 3
50
reduced growth rate (Fig. 2c) and a reduced clonogenic capacity (HT-29) (Fig. 2d).
Morphologic examination by light microscopy and immunofluorescent staining with β
-actin and Hoechst revealed that a subpopulation of the resistant cells was more
flattened, had enlarged nuclei and/or were multi-nuclear compared to their parental
cells (Fig. 2e). No signs of increased senescence characteristics were found, since
mean cell volume and expression of pH-dependent β-galactosidase activity of the
resistant cell population was comparable to parental cells (Supplementary Fig. S1a
and S1b).
786-O
2 4 6 8 10-20
0
20
40
60
80
100
120PAR
SUN
Sunitinib (µmol/L)
Pro
lifer
atio
n (
%)
HT-29
2 4 6 8 10-20
0
20
40
60
80
100
120PAR
SUN
Sunitinib (µmol/L)
Pro
lifer
atio
n (
%)
HT-290
10
20
30
40PAR
SUN
*
Co
lon
y fo
rmat
ion
(%
)
786-O HT-290
1
2
3
4
5PAR
SUN
***
*
IC50
val
ues
su
nit
inib
(µ
M)
786-O HT-290
20
40
60
80PAR
SUN
*
**
Do
ub
ling
tim
e (h
)
PAR SUN
Lightmicroscopy
Immuno-fluorescence
e
a b
c d
Figure 2. Acquired resistance to sunitinib in tumor cells.
To induce resistance, 786-O and HT-29 cancer cell lines were continuously exposed for more than 12
months to gradually increasing concentrations of sunitinib up to 6 µM (786-O) or 12 µM (HT-29). a,
Proliferation assay showing reduced drug sensitivity of sunitinib-resistant (SUN) cancer cells
compared to their parental (PAR) cells. b, 50% inhibitory concentration (IC50) values of sunitinib were
increased in the resistant 786-O and HT-29 cells, compared to their parental cells. c, Sunitinib-
resistant 786-O and HT-29 cells had a reduced cell growth (higher doubling time), compared to their
parental cells. d, Sunitinib-resistant HT-29 cells had a reduced clonogenic capacity, compared to
parental cells. e, Morphological changes in sunitinib-resistant 786-O cells. For immunofluorescent
staining, cells were incubated with β-actin antibody, followed by FITC-conjugated secondary
antibody and Hoechst. Scale bars are 100 µm.
Results are shown as means ± SEM; *, P < 0.05; **, P < 0.01; ***, P < 0.001.
Lysosomal sequestration of sunitinib: a novel mechanism of drug resistance
51
3
Sunitinib resistance is transient
To determine whether in vitro resistance is transient or irreversible, sunitinib-
resistant 786-O and HT-29 cells were cultured in drug-free medium for a period of up
to 12 weeks. Sunitinib sensitivity was gradually restored and these revertant 786-O
and HT-29 cells reached the original drug sensitivity after 12 weeks (Fig. 3a).
Concomitantly, their growth rate and cell morphology restored to that of their
parental cells (Fig. 3b).
Sunitinib is sequestered in lysosomes
A classical mechanism of drug resistance includes increased drug efflux, resulting in
decreased intracellular drug concentration in the resistant cells.10 To investigate
whether a decreased intracellular drug concentration was involved in the sunitinib-
resistant tumor cells, we analyzed the intracellular sunitinib accumulation. In contrast
to expectations from classical drug resistance studies, pharmacological analysis
revealed that the intracellular sunitinib concentrations were significantly higher in
the resistant tumor cells, compared to the parental cells incubated with 5 µM
sunitinib for 24 hours. Intracellular concentrations in the resistant 786-O and HT-29
cells were 5.04 ± 0.11 and 4.25 ± 0.86 mM sunitinib (mean ± SEM), respectively (Fig.
4a). These concentrations in the resistant cells are 1.7-fold (P < 0.05) and 2.5-fold (P <
0.05) higher compared to the parental 786-O and HT-29 cells, in which intracellular
concentrations of 2.93 ± 0.42 and 1.68 ± 0.29 mM sunitinib were measured,
respectively (Fig. 4a). These intracellular concentrations in the resistant cells are up
to 1000-fold the sunitinib concentration in the conditioned medium. The intracellular
concentration of sunitinib calculated as the amount of drug per gram of cellular
protein are 23.8 ± 0.4 and 13.0 ± 2.6 ng sunitinib/ µg protein in the resistant 786-O
and HT-29 cell, respectively, and to 12.2 ± 1.3 and 5.9 ± 0.8 ng sunitinib/ µg protein in
the parental 786-O and HT-29 cell, respectively.
To further define the mechanism of sunitinib resistance in the tumor cells, we
analyzed the subcellular distribution of sunitinib, to investigate whether sunitinib
accumulates in specific subcellular compartments. Taking advantage of the
autofluorescent properties of sunitinib, fluorescence microscopy revealed that
sunitinib is specifically sequestered in subcellular compartments. This sequestration
was significantly higher in resistant cells compared to the parental cells. Consistent
with the physicochemical properties of sunitinib, which is a hydrophobic (logP = 5.2)
weak base (pKa, acid dissociation constant, = 8.95), it appeared that sunitinib
predominantly co-localized with lysosomal staining upon treatment of 786-O and HT-
29 cells in combination with a viable lysosomal-specific probe (Lysotracker Red DND-
99) (786-O: Fig. 4b, first and second rows; HT-29: data not shown). Lysosomal
accumulation of sunitinib was also present in HUVECs (Supplementary Fig. S2). We

Chapter 3
52
studied whether the subcellular localization of sunitinib can be disturbed by
interfering with the function of acidic lysosomes. 786-O cells were co-incubated with
bafilomycin A1, a specific inhibitor of vacuolar type H+ - ATPase (V-ATPase), which
abolishes acidification of lysosomes,20 and ammonium chloride, a lysosomotropic
weak base, which rapidly increases lysosomal pH.21 These incubations resulted in a
significantly reduced sequestration of sunitinib within lysosomes (Fig. 4b, third and
fourth rows), confirming acidic lysosomal localization of sunitinib. Alternative
sequestration in mitochondria was ruled out by the absence of co-localization of
sunitinib with Mitotracker Red FM staining (Supplementary Fig. S3).
Lysosomal sequestration is involved in sunitinib resistance
Comparison of parental and sunitinib-resistant 786-O and HT-29 cells indicated that
the lysosomal capacity of resistant cells was substantially increased (Fig. 4c, second
row). In addition, Fig. 4d shows that incubation of resistant 786-O cells with
786-O
PARSU
NREV1
REV4REV8
REV120
20
40
60
Nu
mb
er o
f ce
lls a
fter
96
h (
104) HT-29
PARSU
NREV1
REV4REV8
REV120
100
200
300
Nu
mb
er o
f ce
lls a
fter
96
h (
104)
786-O
2 4 6 8 10-20
0
20
40
60
80
100
120 PAR
SUN
REV4
REV8
REV12
Sunitinib (µmol/L)
Pro
lifer
atio
n (
%)
HT-29
2 4 6 8 10-20
0
20
40
60
80
100
120 PAR
SUN
REV4
REV8
REV12
Sunitinib (µmol/L)
Pro
lifer
atio
n (
%)
Figure 3 Transient resistance to sunitinib in vitro.
To recover cells from continuously sunitinib exposure, 786-O and HT-29 resistant cells were cultured
in sunitinib-free medium for a period of up to 12 weeks. a, Sensitivity of revertant cells after 4, 8 and
12 weeks of drug free culture conditions. Cells recovering from continuous sunitinib exposure
gradually regained sensitivity to the level of parental cells. b, Growth rate of revertant cells after 1, 4,
8 and 12 weeks of drug free culture conditions.
PAR: parental cells; SUN: sunitinib-resistant cells; REV: revertant cells after 1 week (REV1); 4 weeks
(REV4); 8 weeks (REV8); 12 weeks (REV12) in drug-free medium. Results are shown as means ± SEM.
b
a

Lysosomal sequestration of sunitinib: a novel mechanism of drug resistance
53
3
bafilomycin or ammonium chloride largely decreased the lysosomal fluorescence.
Western Blot analysis indeed showed increased expression of the major lysosomal
membrane proteins LAMP-1 and LAMP-222 in the resistant 786-O and HT-29 cells
compared to their parental cells (Fig. 4e). Supportive for the increased sequestration
in lysosomes of sunitinib as a mechanism of resistance includes similar
phosporylation levels of ERK 1/2 and Akt in resistant cells compared to untreated
parental cells (Fig. 4f), despite the high intracellular sunitinib concentrations. In
addition, after 12 weeks of drug-free culture of the sunitinib-resistant cells, these
revertant cells had normalized their lysosomal capacity and LAMP expression to the
level of the parental cells (Fig. 4c, 3rd row and Fig. 4e). During this same period,
sunitinib sensitivity was also restored to that of the parental cells (Fig. 3a), supporting
the role of lysosomes in sunitinib resistance.
Discussion
Based on the pharmacokinetic properties of sunitinib with a high apparent volume of
distribution (>2,000 L), the majority of the drug is distributed into various tissues as
reflected by yellow discoloration of the skin in patients, while only a relatively small
fraction of the drug remains in the circulation. To gain quantitative insight into the
distribution of sunitinib in normal tissues and tumors, we determined sunitinib
concentrations in skin and tumor tissues of a murine RCC model and in tumor
biopsies from patients during sunitinib treatment. We found that intratumoral
sunitinib concentrations in mice and patients were at least 10-fold higher than
plasma concentrations. These plasma concentrations in mice and patients were
similar to previously published observations.13,23 Together, (pre)clinical intratumoral
concentrations indicated that sunitinib plasma pharmacokinetics are unlikely to
provide adequate insight into the antitumor mechanisms operative at the tumor
tissue level.
While sunitinib has been developed as an anti-angiogenic agent, intended to
primarily target endothelial and perivascular cells through its high affinity binding to
VEGFR2 and PDGFR, it inhibits many other kinases.11 Karaman and colleagues12
studied the affinity of TKIs to a panel of 317 kinases and found that sunitinib has a
low selectivity for specific tyrosine kinases. Given the fact that high intratumoral
sunitinib concentrations in patients may not only inhibit angiogenesis but may also
target tumor cells directly, we studied the activity of sunitinib in vitro. We found that
sunitinib inhibits tumor and endothelial cells at intratumoral concentrations achieved
in tumors of patients, explaining clinical observations that sunitinib treatment not
only results in tumor stabilization due to its anti-angiogenic activity, but also can
cause partial or complete clinical tumor responses.

Chapter 3
54
PAR + 24h sun SUN0
2
4
6
8 786-O
HT-29
*
*
Intr
acel
lula
r su
nit
inib
(m
mo
l/L)
786-OPAR
786-OPAR
+ NH4Cl
786-OPAR
+ BAF
Sunitinib (+ Hoechst)
786-OPAR
(10X)
MergedLysotracker(+ Hoechst)
786-OPAR
786-OREV
786-OSUN
Sunitinib (+ Hoechst)
MergedLysotracker(+ Hoechst)
a b
c
Figure 4. Lysosomal sequestra-tion of sunitinib. a, Intracellular sunitinib con-centration of parental cells, incubated for 24 hours with 5 µM sunitinib, and resistant cells, continuously incubated with sunitinib. b and c, Confocal images after incubation with sunitinib (green), 75 nM Lysotracker (red) and 0.5 µg/mL Hoechst (blue) for 60 minutes. Sunitinib and Lysotracker were found to highly co-localize (yellow). b, 1st and 2nd row: 786-O parental cells (PAR), treated with 5 µM sunitinib for 60 minutes, 10x and 63x magnify-cation, respectively; 3rd row: 786-O PAR, treated with 50 nM bafilomycin A1 for 90 minutes, starting 30 minutes before addition of sunitinib, Lyso-tracker and Hoechst. 4th row: 786-O PAR, treated with 10 mM ammonium chloride (NH4Cl) for 90 minutes, starting 30 minutes before addition of sunitinib, Lysotracker and Hoechst. Scale bars are 25 µm. c, 1st row: 786-O PAR, treated with 5 µM sunitinib for 60 minutes; 2nd row: 786-O sunitinib-resistant cells (SUN), continuously treated with sunitinib; 3rd row: 786-O revertant cells (REV), cultured for 12 weeks in sunitinib-free medium, and subsequently retreated as the parental cells. Scale bars are 25 µm.

Lysosomal sequestration of sunitinib: a novel mechanism of drug resistance
55
3
LAMP-1
786-O
PAR SUN REV
HT-29
REVPAR SUN
β-actin
LAMP-2
p-Erk 1/2
786-O
PAR SUN
HT-29
PAR SUN
Erk 1/2
p-Akt
Akt
β-actin
786-OSUN
786-OSUN
+ NH4Cl
786-OSUN
+ BAF
Sunitinib (+ Hoechst)
MergedLysotracker(+ Hoechst)
LAMP-1
786-O
PAR SUN REV
HT-29
REVPAR SUN
β-actin
LAMP-2
p-Erk 1/2
786-O
PAR SUN
HT-29
PAR SUN
Erk 1/2
p-Akt
Akt
β-actin
786-OSUN
786-OSUN
+ NH4Cl
786-OSUN
+ BAF
Sunitinib (+ Hoechst)
MergedLysotracker(+ Hoechst)
Figure 4 (continued). Lysosomal sequestration of sunitinib. d, 1st row: 786-O sunitinib resistant cells (SUN), continuously treated with sunitinib; 2nd row: 786-O SUN, treated with 50 nM bafilomycin A1 for 90 minutes. 3rd row: 786-O SUN, treated with 10 mM ammonium chloride (NH4Cl) for 90 minutes. Scale bars are 25 µm. e, Western blot analysis of lysosomal associated membrane proteins (LAMP) -1 and -2 of parental, sunitinib-resistant, and revertant 786-O and HT-29 cells. f, Western blot analysis of (phosphorylated) ERK 1/2 and Akt of parental and sunitinib-resistant 786-O and HT-29 cells. Results are shown as means ± SEM; *, P < 0.05.
d
e f

Chapter 3
56
Previous reports indicated that sunitinib antitumor activity could not be mediated by
direct antitumor activity, firstly because no activity of sunitinib at assumed relevant
plasma concentrations on tumor cells in vitro was seen and secondly because
endothelial cells were several fold more sensitive to sunitinib treatment compared to
tumor cells in previous reports.24 By gaining more insight into the pharmacokinetics
of sunitinib, we here show that plasma concentrations do not truly reflect
physiological intratumoral pharmacokinetics of sunitinib due to its high volume of
tissue distribution and by our finding that sunitinib concentrations are 10-fold higher
in (tumor) tissue compared to plasma levels. Secondly, while tumor cell proliferation
experiments are mostly performed with a fixed concentration of bovine serum (5 to
20% of the growth medium), for endothelial cells experimental conditions are being
varied extensively. Mostly for specific proliferation assays, endothelial cells are being
starved and stimulated at low serum level (0.1-1%) with the addition of a specific
growth factor, such as VEGF or basic fibroblast growth factor (bFGF).24,25 Although
these specific conditions are important to study specific growth factor pathway
signaling modifications, vascular cells in the in vivo situation or in patients are not
only being stimulated by one specific growth factor. Vascular cells in vivo are
stimulated by multiple growth factors and proteins, due to tumor release of several
growth factors, extracellular matrix proteins and platelet releasates, similar to the
proteins present in serum.26,27 Therefore, in our experimental set up we determined
the sensitivity of endothelial cells in vitro under full growth stimulating conditions for
endothelial cells and found under these conditions similar sunitinib sensitivity of
endothelial cells as for tumor cells. These results further support our findings that
sunitinib may not only inhibit angiogenesis but has a direct antitumor effect in vivo
and in patients as well.
Furthermore, we found that sunitinib inhibits key signaling pathways in our cancer
cell lines similar to what was previously reported by Yang and colleagues.28 While
possible primary targets of the multi-targeted agent sunitinib on tumor cells are
multiple and remain to be studied, we reasoned that p-Akt and p-ERK would be a
rational first choice as read-out of sunitinib activity, because they are two major
downstream proteins of several known targets of sunitinib. In addition, they are
major downstream junctions in many signaling pathways controlling cancer cell
proliferation and/or apoptosis. Indeed, we found decreased p-Akt and p-ERK in the
sensitive, but not the continuously exposed cells. This inhibitory action on signaling
pathways is in support of the activity profile of sunitinib at higher doses due to its
affinity to other kinases as previously reported by Karaman and colleagues.12 In
preliminary studies using a peptide based kinase activity array, we indeed confirmed
that multiple kinases are inhibited by sunitinib in tumor cells (data not shown).

Lysosomal sequestration of sunitinib: a novel mechanism of drug resistance
57
3
One of the major clinical problems with anti-angiogenic TKIs including sunitinib is
their intrinsic and acquired drug resistance.1,17,29 Based on preclinical studies, the
upregulation of VEGF production as well as other compensatory cytokines and
growth factors such as HGF/cMET, IL-8, PlGF, SDF-1 or erythropoietin and epithelial
mesenchymal transformation (EMT) have been suggested to play a role in sunitinib
resistance.6-9,30-32 Based on our findings that sunitinib inhibits tumor cell proliferation
directly, we investigated the possible role of tumor cells in sunitinib resistance. We
found that continuous exposure to sunitinib resulted in resistance of tumor cells by
an adaptive tumor cell mechanism identified as an increased intracellular lysosomal
sunitinib sequestration. The resistance factors were moderate, but were not due to
variation in the MTT assays, which were highly consistent in 4 independent
experiments per cell line. Moreover the continuously exposed cells kept growing at
concentrations (5 µM for 786-0 and 10 µM for HT29) that kill the parental cells.
Because this form of adaptive resistance to sunitinib might not be the result of a
stable mutation in its target such as often occurs with TKIs in cells addicted to one
oncogenic target receptor, we decided to investigate other possibilities. We reasoned
that sunitinib might preferentially accumulate in acidic lysosomes, because sunitinib
is a hydrophobic (logP = 5.2) weak base (pKa = 8.95)4 as is described for some other
substances. Because sunitinib is a hydrophobic compound, it can easily cross plasma
membranes and other intracellular membranes. In addition, sunitinib is a weak base
with a pKa of ~9, implying that decreasing the pH below 9, sunitinib will be
increasingly protonated and thereby losing its ability to cross membranes. At a pH of
5, all sunitinib will be protonated. Therefore, upon entering an acidic organelle such
as a lysosome, sunitinib becomes protonated and cannot cross membranes anymore.
To test this hypothesis we studied co-localization of sunitinib and acidic lysosomes.
Indeed, we found clear co-localization of acidic lysosomes by staining with a known
lysosomal marker probe and sunitinib due to its auto-fluorescence. No co-localization
with other organelles could be detected. In addition, subsequent disturbance of the
lysosomal function resulted in sunitinib release from lysosomes. Subsequently, we
found that resistant cells are able to sequester sunitinib from their cytoplasmic
compartment into acidic lysosomes to a higher extent contributing to a decreased
growth inhibitory activity. Despite higher intracellular concentration of sunitinib in
resistant cells, intracellular kinase activity was comparable to untreated parent cells.
This result supports that sequestration of sunitinib in acidic lysosomes reduces its
cytoplasmic availability and provides a novel mechanism of resistance that has not
been previously reported. This mechanism of resistance may play a role for other
agents, including tyrosine kinase inhibitors, as well and it may reflect a natural
defense mechanism of cells.

Chapter 3
58
Lysosomal sequestration as a mechanism of drug resistance is reversible, since drug-
free culture of resistant tumor cells resulted in normalization of their lysosomal
capacity and recovery of drug sensitivity. Transient in vitro resistance of tumor cells
supports clinical resistance data that were recently reported. While resistance to
sunitinib is acquired during treatment in almost all patients,29 it is transient in some
of them after treatment interruption and subsequent rechallenge.33 The latter is also
supported by our recent finding with a tumor derived cell line from a progressive skin
metastasis.9
Although in vitro prolonged primary endothelial cell culture experiments are not
easily feasible, our results indicate that continuous clinical exposure to sunitinib may
cause an increased lysosomal capacity in various cell types and provide a general
mechanism of resistance. Whether this novel resistance mechanism is unique for
sunitinib or whether this is a general mechanism of TKI resistance remains to be
studied. Other TKIs either have a relatively high pKa (pazopanib and dasatinib) or a
high lipophilicity (gefitinib and nilotinib), while sunitinib is both a weak base and
hydrophobic. In conclusion, this novel mechanism of resistance warrants further
clinical investigation either by re-treatment with sunitinib after prior tumor
progression in patients or by concomitant treatment with clinically available drugs
that interfere with lysosomal function, such as chloroquine.34
Acknowledgements
This work was supported by a research grant of Pfizer Global Pharmaceuticals and by
an AEGON Research Fellowship Program.

Lysosomal sequestration of sunitinib: a novel mechanism of drug resistance
59
3
References
1. Bergers G, Hanahan D. Modes of resistance to anti-angiogenic therapy. Nat Rev Cancer
2008;8(8):592-603.
2. Motzer RJ, Michaelson MD, Rosenberg J et al. Sunitinib efficacy against advanced renal cell
carcinoma. J Urol 2007;178(5):1883-7.
3. Motzer RJ, Hutson TE, Tomczak P et al. Overall survival and updated results for sunitinib
compared with interferon alfa in patients with metastatic renal cell carcinoma. J Clin Oncol
2009;27(22):3584-90.
4. Goodman VL, Rock EP, Dagher R et al. Approval summary: sunitinib for the treatment of
imatinib refractory or intolerant gastrointestinal stromal tumors and advanced renal cell
carcinoma. Clin Cancer Res 2007;13(5):1367-73.
5. Raymond E, Dahan L, Raoul JL et al. Sunitinib malate for the treatment of pancreatic
neuroendocrine tumors. N Engl J Med 2011;364(6):501-13.
6. Shojaei F, Lee JH, Simmons BH et al. HGF/c-Met acts as an alternative angiogenic pathway in
sunitinib-resistant tumors. Cancer Res 2010;70(24):10090-100.
7. Huang D, Ding Y, Zhou M et al. Interleukin-8 mediates resistance to antiangiogenic agent
sunitinib in renal cell carcinoma. Cancer Res 2010;70(3):1063-71.
8. Doberstein K, Wieland A, Lee SB et al. L1-CAM expression in ccRCC correlates with shorter
patients survival times and confers chemoresistance in renal cell carcinoma cells.
Carcinogenesis 2011;32(3):262-70.
9. Hammers HJ, Verheul HM, Salumbides B et al. Reversible epithelial to mesenchymal
transition and acquired resistance to sunitinib in patients with renal cell carcinoma: evidence
from a xenograft study. Mol Cancer Ther 2010;9(6):1525-35.
10. Broxterman HJ, Gotink KJ, Verheul HM. Understanding the causes of multidrug resistance in
cancer: a comparison of doxorubicin and sunitinib. Drug Resist Updat 2009;12(4-5):114-26.
11. Fabian MA, Biggs WH III, Treiber DK et al. A small molecule-kinase interaction map for clinical
kinase inhibitors. Nat Biotechnol 2005;23(3):329-36.
12. Karaman MW, Herrgard S, Treiber DK et al. A quantitative analysis of kinase inhibitor
selectivity. Nat Biotechnol 2008;26(1):127-32.
13. Honeywell R, Yarzadah K, Giovannetti E et al. Simple and selective method for the
determination of various tyrosine kinase inhibitors used in the clinical setting by liquid
chromatography tandem mass spectrometry. J Chromatogr B Analyt Technol Biomed Life Sci
2010;878(15-16):1059-68.
14. Holdhoff M, Supko JG, Gallia GL et al. Intratumoral concentrations of imatinib after oral
administration in patients with glioblastoma multiforme. J Neurooncol 2010;97(2):241-5.
15. Franken NA, Rodermond HM, Stap J, Haveman J, van Bree C. Clonogenic assay of cells in
vitro. Nat Protoc 2006;1(5):2315-9.
16. Mathews ST, Plaisance EP, Kim T. Imaging systems for westerns: chemiluminescence vs.
infrared detection. Methods Mol Biol 2009;536:499-513.
17. Gotink KJ, Verheul HM. Anti-angiogenic tyrosine kinase inhibitors: what is their mechanism of
action? Angiogenesis 2010;13(1):1-14.

Chapter 3
60
18. Lemmon MA, Schlessinger J. Cell signaling by receptor tyrosine kinases. Cell 2010;141
(7):1117-34.
19. Myers MP, Pass I, Batty IH et al. The lipid phosphatase activity of PTEN is critical for its tumor
supressor function. Proc Natl Acad Sci USA 1998;95(23):13513-8.
20. Bowman EJ, Siebers A, Altendorf K. Bafilomycins: a class of inhibitors of membrane ATPases
from microorganisms, animal cells, and plant cells. Proc Natl Acad Sci USA 1988;85(21):7972-
6.
21. Ohkuma S, Poole B. Fluorescence probe measurement of the intralysosomal pH in living cells
and the perturbation of pH by various agents. Proc Natl Acad Sci USA 1978;75(7):3327-31.
22. Saftig P, Klumperman J. Lysosome biogenesis and lysosomal membrane proteins: trafficking
meets function. Nat Rev Mol Cell Biol 2009;10(9):623-35.
23. Motzer RJ, Michaelson MD, Redman BG et al. Activity of SU11248, a multitargeted inhibitor
of vascular endothelial growth factor receptor and platelet-derived growth factor receptor, in
patients with metastatic renal cell carcinoma. J Clin Oncol 2006;24(1):16-24.
24. Huang D, Ding Y, Li Y et al. Sunitinib acts primarily on tumor endothelium rather than tumor
cells to inhibit the growth of renal cell carcinoma. Cancer Res 2010;70(3):1053-62.
25. Verheul HM, Lolkema MP, Qian DZ et al. Platelets take up the monoclonal antibody
bevacizumab. Clin Cancer Res 2007;13(18 Pt 1):5341-7.
26. Battinelli EM, Markens BA, Italiano JE, Jr. Release of angiogenesis regulatory proteins from
platelet alpha granules: modulation of physiologic and pathologic angiogenesis. Blood
2011;118(5):1359-69.
27. Chouaib S, Kieda C, Benlalam H, Noman MZ, Mami-Chouaib F, Ruegg C. Endothelial cells as
key determinants of the tumor microenvironment: interaction with tumor cells, extracellular
matrix and immune killer cells. Crit Rev Immunol 2010;30(6):529-45.
28. Yang F, Jove V, Xin H, Hedvat M, Van Meter TE, Yu H. Sunitinib induces apoptosis and growth
arrest of medulloblastoma tumor cells by inhibiting STAT3 and AKT signaling pathways. Mol
Cancer Res 2010;8(1):35-45.27
29. Ellis LM, Hicklin DJ. Pathways mediating resistance to vascular endothelial growth factor-
targeted therapy. Clin Cancer Res 2008;14(20):6371-5.
30. Ebos JM, Lee CR, Christensen JG, Mutsaers AJ, Kerbel RS. Multiple circulating proangiogenic
factors induced by sunitinib malate are tumor-independent and correlate with antitumor
efficacy. Proc Natl Acad Sci USA 2007;104(43):17069-74.
31. Vroling L, van der Veldt AA, de Haas RR et al. Increased numbers of small circulating
endothelial cells in renal cell cancer patients treated with sunitinib. Angiogenesis 2009;12
(1):69-79.
32. Ellis LM, Hicklin DJ. Resistance to Targeted Therapies: Refining Anticancer Therapy in the Era
of Molecular Oncology. Clin Cancer Res 2009;15(24):7471-8.
33. Zama IN, Hutson TE, Elson P et al. Sunitinib rechallenge in metastatic renal cell carcinoma
patients. Cancer 2010;116(23):5400-6.
34. Fehrenbacher N, Jaattela M. Lysosomes as targets for cancer therapy. Cancer Res 2005;65
(8):2993-5.

Lysosomal sequestration of sunitinib: a novel mechanism of drug resistance
61
3
Sunitinib + Hoechst Merged Lysotracker + Hoechst
Sunitinib + Hoechst Mitotracker + Hoechst Merged
Supplementary Figure S1. The flattened phenotype of sunitinib resistant cells was not related to a
more senescent phenotype. a, Cell volume was not significantly different between parental (PAR)
and sunitinib resistant (SUN) 786-O cells (P = 0.49). Results are mean ± SEM. b, Parental (PAR) and
sunitinib resistant (SUN) 786-O cells had equal low expression of pH-dependent β-galactosidase
activity.
Supplementary Figure S2. Lysosomal sequestration of sunitinib in HUVECs. Confocal images of
human umbilical vein endothelial cells (HUVECs) after incubation with 5 µM sunitinib (green), 75 nM
Lysotracker (red) and 0.5 µg/mL Hoechst (blue) for 60 minutes. In addition to sequestration in
lysosomes in tumor cells (Fig. 4), sunitinib and lysotracker were also highly co-localized in HUVECs,
indicating that sunitinib is also sequestered in lysosomes of HUVECs. Scale bar is 10 µm.
Supplementary Figure S3. No sequestration of sunitinib in mitochondria. Confocal images of 786-O
cells after incubation with 5 µM sunitinib (green), 100 nM Mitotracker (red) and 0.5 µg/mL Hoechst
(blue) for 60 minutes. Sunitinib is not sequestered in mitochondria, since no co-localization was
found of sunitinib and Mitotracker. Scale bar is 25 µm.
500 µm
100 µm 100 µm
500 µm
PAR SUN0
2000
4000
6000
8000
10000C
ell
vo
lum
e (
µm
3)
PAR SUN
Supplementary figures
a b


Chapter 4
Acquired tumor cell resistance to sunitinib causes
resistance in a HT-29 human colon cancer xenograft
mouse model without affecting sunitinib
biodistribution or the tumor microvasculature
Kristy J. Gotink, Henk J. Broxterman, Richard J. Honeywell,
Henk Dekker, Richard R. de Haas, Kiersten M. Miles, Remi
Adelaiye, Arjan W. Griffioen, Godefridus J. Peters, Roberto
Pili, Henk M.W. Verheul
Oncoscience 2014;1(12):844-53

Chapter 4
64
Abstract
Acquired resistance to anti-angiogenic tyrosine kinase inhibitors is an important
clinical problem in treating various cancers. To what extent acquired resistance is
determined by microenvironmental host-factors or by tumor cells directly is
unknown. We previously found that tumor cells can become resistant to sunitinib in
vitro. Here, we studied to what extent in vitro induced resistance of tumor cells
determines in vivo resistance to sunitinib.
In severe combined immunodeficient mice, tumors were established from HT-29
parental colon cancer cells (HT-29PAR) or the in vitro induced sunitinib resistant HT-
29 cells (HT-29SUN). Treatment with sunitinib (40mg/kg/day) inhibited tumor growth
of HT-29PAR tumors by 71±5%, while no inhibition of HT-29SUN tumor growth was
observed. Intratumoral sunitinib concentrations and reduced microvessel density
(MVD) were similar in both groups. Ki67 staining revealed that tumor cell
proliferation was significantly reduced with 30% in HT-29PAR tumors, but unaffected
in HT-29SUN tumors upon sunitinib treatment. The lysosomal capacity reflected by
LAMP-1 and -2 expression was higher in HT-29SUN compared to HT-29PAR tumors
indicating an increased sequestration of sunitinib in lysosomes of resistant tumors. In
conclusion, we demonstrate that tumor cells rather than host-factors may play a
crucial role in acquired resistance to sunitinib in vivo.

Acquired tumor cell resistance to sunitinib causes in vivo resistance
65
4
Introduction
Multiple anti-angiogenic tyrosine kinase inhibitors (TKIs) have been approved for the
treatment of patients with disseminated cancers. Acquired resistance to these type
of agents is an important clinical problem in treating patients with various types of
cancer. In general, protein kinase inhibitors are effective in multiple different cancer
types, but resistance inevitably emerges. Acquired mechanisms of resistance to
kinase inhibitors include reactivation of the target through a secondary mutation,
activation of upstream or downstream effectors, activation of a bypass oncoprotein
and microenvironmental factors.1
One of these TKIs, sunitinib, is currently approved for treatment of patients with
gastrointestinal stroma tumors (GIST) refractory to imatinib, advanced pancreatic
neuroendocrine tumors (pNET) and metastasized renal cell carcinoma (RCC).2-4 For
other tumor types, sunitinib showed some clinical activity in a subgroup of patients,
for example in colorectal cancer.5 Sunitinib has been developed as an anti-angiogenic
agent primarily targeting the vascular endothelial growth factor receptors (VEGFRs)
and platelet-derived growth factor receptors (PDGFRs).6 Sunitinib also inhibits other
kinases with higher or lower affinity that are active in endothelial cells and pericytes
as well as in tumor cells.7,8 The inhibition of these kinases might be important for its
antitumor activity as well.
Several potential mechanisms that contribute to sunitinib resistance include the
induction of alternative angiogenic growth factors,9 epithelial to mesenchymal
transformation of the tumor microenvironment,10 alternative bone marrow
support11,12 or altered pharmacokinetics, for example an increased metabolism of
sunitinib, altered drug distribution, increased cellular efflux or inhibited drug
uptake.13,14 Still, the underlying mechanism(s) to fully explain and overcome acquired
resistance to sunitinib remain(s) unclear. Most studies have been focusing on
potential angiogenic-factor-mediated mechanisms of resistance and the
microenvironment of the host,1,9-12,15-17 while relatively little attention has been paid
to the contribution of tumor-cell-related mechanisms of resistance to sunitinib, with
the exception for sunitinib resistance in c-KIT expressing GIST and acquired resistance
to sunitinib by tumor cell expression of the extracellular matrix metalloproteinase
inducer.18,19 Therefore, it is important to have a more complete understanding of all
possible mechanisms contributing to sunitinib resistance in order to develop new
treatment strategies to overcome this resistance.
Previously, we reported that tumor cells are sensitive to sunitinib treatment in vitro
at clinically relevant intratumoral sunitinib concentrations.20 These findings indicate
that sunitinib directly inhibit tumor cell growth rather than only inhibiting
angiogenesis. In addition, when cultured in vitro, we were able to induce tumor cell

Chapter 4
66
resistance to sunitinib in several cell lines upon continuous exposure to increasing
doses of sunitinib. This acquired tumor cell resistance was transient and not related
to genetic alterations. The underlying mechanism of this resistance was related to an
increased lysosomal sequestration of sunitinib limiting its intracellular antitumor
activity. Based on these findings we hypothesized that acquired tumor cell resistance
to sunitinib contributes to the development of resistance to sunitinib in patients.
Therefore, we studied here to what extent tumor cells may contribute to sunitinib
resistance in vivo. We compared growth properties of in vitro sunitinib resistant HT-
29 colon cancer cells with the parental HT-29 cells in a murine model and determined
their in vivo sensitivity to sunitinib treatment. We show that tumor cells rather than
host-factors play a crucial role in acquired resistance to sunitinib in vivo based on
comparable intratumoral sunitinib concentrations and reduced microvessel density in
both groups, while tumor cell proliferation was only reduced in parental tumors and
lysosomal capacity was increased in resistant tumors. In addition, we examined
whether chloroquine, a clinical available antimalarial drug, which was recently shown
to potentiate antitumor activity of sunitinib21 and inhibits lysosomal function22-24
could revert sunitinib resistance in this in vivo model.
Material and methods
Cell culture and reagents
The 786-O renal cell cancer cell line and the HT-29 colon cancer cell line were
cultured in DMEM supplemented with 5% fetal bovine serum (FBS) and maintained in
a humidified incubator containing 5% CO2 at 37°C. The cell lines originated from the
American Tissue Culture Collection (ATCC) and were authenticated by STR profiling
(Baseclear, Leiden, Netherlands). Resistance to sunitinib was induced as previously
described.20 Briefly, cells were continuously exposed to increasing concentrations of
sunitinib. Resistance was evaluated by proliferation assays as previously described.20
Sunitinib malate was kindly provided by Pfizer Global Pharmaceuticals. For in vitro
experiments, sunitinib malate was prepared as 20 mM stock solution in DMSO and
stored at -20°C. For in vivo experiments, sunitinib malate was dissolved at a
concentration of 8 mg/ ml in a vehicle containing distilled water with 1.8% NaCl, 0.5%
carboxymethylcellulose, 0.4% Tween80 and 0.9% benzylalcohol (pH adjusted to 6.0).
The mixture was sonicated to achieve stable dispersion. Chloroquine (chloroquine
diphosphate; Sigma-Aldrich) was prepared as a 10 mg/ml solution in PBS.
In vivo mouse experiments
The animal research protocol was approved by the Institutional Animal Care and Use
Committee at the Roswell Park Cancer Institute and was in accordance with the

Acquired tumor cell resistance to sunitinib causes in vivo resistance
67
4
National Research Council’s Guide for the Care and Use of Laboratory Animals. Four-
to six-week-old male severe combined immunodeficient (SCID) mice were housed
under pathogen-free conditions in a temperature-controlled room on a 12/12 hour
light/dark schedule with food and water ad libitum.
Tumor establishment: 5x10⁶ parental or sunitinib resistant HT-29 cells grown under
10 µM sunitinib exposure were harvested from non-confluent monolayer cell cultures
in 100 µL PBS. In the initial experiment tumor cells were injected subcutaneously,
while in subsequent experiments equal viable tumor pieces from sacrificed mice
were selected (approximately 1 mm3), and inoculated subcutaneously into a new
cohort of mice (see below). Tumor growth was assessed twice weekly by caliper
measurement, and size was expressed in mm3 using the standard formula: length ×
width2 × 0.52. Seven to twelve days post-injection/ transplantation, tumor-bearing
mice within either model were randomly distributed into 2 groups (6-8 animals per
group) and treatment was started. Mice received treatment with sunitinib malate 40
mg/kg or a corresponding amount of vehicle, once daily, 7 days a week, by oral
gavage. Mice selected for chloroquine treatment (n = 4), received 50 mg/kg
chloroquine diphosphate by intraperitoneal (ip) injection, once daily, 4-8 h before
sunitinib treatment. After 6-8 weeks of treatment, animals were sacrificed and blood
was collected by cardiac puncture. Tumors were harvested and weighed, and tumor
pieces were subsequently snap-frozen in liquid nitrogen.
In order to obtain tumor tissue for transplantation, three mice were bilaterally
injected with either HT-29PAR or HT-29SUN cells and treated with vehicle or
sunitinib, starting 7 days after injection and continued for 25 days. To establish
parental tumors, tumor pieces of a vehicle-treated HT-29PAR tumor were
transplanted in a new cohort of 16 mice. Since sunitinib resistance of HT-29SUN in
vitro is transient,20 mice with HT-29SUN tumors planned for tumor transplantation
were treated with sunitinib, in order to maintain resistance. For selection of a more
rapid tumor growth rate, the fastest growing tumor was transplanted in a new cohort
of 16 mice.
Immunohistochemistry
Tumor pieces were fixed in 10% formalin and embedded in paraffin.
Deparaffinization and rehydration of 3-µm-thick sections were followed by H&E or
specific immunohistochemical staining. After blocking, sections were incubated with
primary antibodies to detect CD31 (Santa Cruz Biotechnology), Ki-67 (Thermo
Scientific) or the appropriate IgG controls, followed by incubation with secondary
antibodies. Staining was developed by incubation with 3,3′-diaminobenzidine, and
counterstained with hematoxylin. Subsequently, sections were dehydrated in alcohol

Chapter 4
68
and xylene and mounted. Images were captured using an Olympus microscope
(model BX50F) with a Leica camera (DC300 V2.0) and Leica software.
Microvessel density (MVD; n = 8 per group) was scored using CD31 staining. Viable
areas of the tumor were selected, and MVD was subsequently assessed in 5 randomly
selected fields (200x). The results are shown as number of vessels/field. Ki-67
quantification (n = 4 per group) was performed using a Leica microscope (DMLM)
with a Leica CCD camera and Leica QPRODIT software (version V3.2). At first, viable
areas of the tumor were selected using a 2.5x objective. Over this measurement area,
600 fields of vision were randomly equidistantly placed by the QPRODIT software. At
40x objective, each field of vision was investigated using a 6-point electronic grid
system of three ‘Weibel-type’ test lines (grid point distance was 70.0 µm) of which
the center grid point was registered. A point falling on a tumor cell was counted, but
other tissue or empty space (stroma, infiltrate, scar, no tissue) was ignored. When
the center point was scored (as Ki-67 negative or positive tumor cell) or ignored in
one field of vision, the next field was selected using a random systematic sampling
approach in the measurement area. After the measurements, the QPRODIT software
calculated automatically the percentage of Ki-67 negative and positive tumor cells (as
a percentage of total counted tumor cells).
Western blot analysis
Lysates (n = 4 per group) from snap-frozen tumor tissues were prepared using M-PER
lysis buffer containing phosphatase and protease inhibitors (Thermo Scientific) added
to 20 µm cryoslides. Tissues were incubated with the lysis buffer mixture for 20
minutes on ice and subsequently centrifuged (10,000 x g) for 15 minutes at 4°C.
Supernatant was collected and stored at -80°C until analysis. Protein concentrations
were determined with Micro BCA protein assay (Thermo Scientific). Samples
containing 20 µg protein underwent electrophoresis on 10% SDS polyacrylamide gels
and were subsequently transferred to PVDF membranes (Immobilon-FL, Millipore).
Proteins were detected using LAMP-1 (sc-5570) and LAMP-2 (sc-18822) antibodies
(Santa Cruz biotechnology) and β-actin (Sigma-Aldrich). After incubation with IRDye
infrared dye labeled secondary antibodies (LI-COR Biosciences), membranes were
scanned with the Odyssey Infrared Imaging System (LI-COR Biosciences). LAMP-1 and
-2 expression was analyzed with the accompanying software program (LI-COR
Biosciences), and subsequently corrected for β-actin expression and normalized to
vehicle-treated tumor samples. Western blots were performed twice.
Sunitinib measurements by LC-MS/MS
Tumor and skin pieces as well as serum (n = 8 per group) were analyzed for sunitinib
amount by a validated liquid chromatography - tandem mass spectrometry (LC-MS/

Acquired tumor cell resistance to sunitinib causes in vivo resistance
69
4
MS) assay, as reported previously.20,25 Briefly, at the end of the mice experiments,
blood was drawn by cardiac puncture and transferred to 1 ml tubes. Tubes were
inverted 5 times and stored at RT for 1 hour. After centrifugation for 10 minutes at
13,000 rpm RT, the supernatant was transferred into a new tube and stored at -80°C.
Serum was analyzed by LC-MS/MS, as previously reported.25 Tumor and skin pieces,
after harvesting, were immediately snap-frozen in liquid nitrogen and stored at –80°C
until analyzed. For analysis, tissue pieces were weighed frozen and suspended in
milliQ water (200 µl) and subsequently freeze-dried. Lyophilized tumor and skin
tissue were subsequently resuspended in acetonitrile:water (ACN:H2O ; 5:1),
homogenized and briefly sonicated (30 sec). After centrifugation, supernatant was
taken for LC-MS/MS analysis.25 Data are expressed in micromolar (µM) and are
conversed as previously described.20
Statistical analysis
Data are expressed as mean ± standard error of the mean (SEM) or, when indicated,
as median with range. When appropriate, results are shown as normalized data.
Statistical analyses were performed using Student’s t-test. A P value < 0.05 was
considered to be statistically significant. *, P value < 0.05; **, P value < 0.01; ***, P
value < 0.001.
Results
In vivo growth and sunitinib treatment of HT-29 parental and sunitinib resistant cells
Prior to in vivo experiments, in vitro resistance to sunitinib was confirmed similar to
our previous report.20 Although sensitive and resistant 786-O and HT-29 cells were
injected in mice, reliable solid tumors from 786-OPAR and 786-OSUN cells in mice in
3 independent experiments did not form. Because, the IC50 values for sunitinib in 786
-OPAR and 786-OSUN cells were in the same range as in HT-29PAR and HT-29SUN
cells, respectively,20 we continued the in vivo experiments with HT-29 xenografts.
Seven days after injection of HT-29PAR and HT-29SUN tumor cells, tumors were
established in vivo (50-100 mm3 in size) and treatment with sunitinib malate (40 mg/
kg/day) or vehicle was started. Vehicle-treated mice carrying tumors established
from HT-29PAR cells were sacrificed after 30 days of treatment, because of ulceration
and size. Sunitinib significantly inhibited the growth rate of HT-29PAR tumors with 76
± 1% (mean ± SEM, n = 6; P < 0.001; Fig. 1a), while growth of HT-29SUN tumors was
unaffected after 40 days of sunitinib treatment (2 ± 8% inhibition, P = ns (not
significant); Fig. 1b). Similar, the weight of sunitinib-treated HT-29PAR tumors was
lower than vehicle-treated HT-29PAR tumors, with weights of 0.11 ± 0.01 g versus
0.54 ± 0.04 g, respectively (P < 0.001; Fig. 1c). No significant difference was observed

Chapter 4
70
between the weights of sunitinib- and vehicle-treated HT-29SUN tumors (0.10 ± 0.01
versus 0.14 ± 0.02 g, P = ns; Fig. 1d).
In a second experiment, in which tumors were established by transplantation of
tumor pieces from other mice, these results were confirmed (Supplementary Fig. S1).
In both in vivo experiments, the mice tolerated sunitinib treatment very well with a
maximal weight loss in an individual mouse of less than 10%.
Intratumoral sunitinib concentrations
Intratumoral sunitinib concentrations were determined in mice at the end of
treatment. In sunitinib-treated tumors, intratumoral concentrations were
comparable between HT-29PAR and HT-29SUN tumors with 9.1 µM (7.4 – 12.6 µM)
and 8.1 µM (5.5 – 13.1 µM) (median (range); n = 8; P = ns), respectively (Fig. 2a). In
addition, sunitinib concentrations in normal skin tissues of these mice were
comparable between mice bearing HT-29PAR and HT-29SUN tumors (1.0 (0.9 – 2.4)
µM versus 1.4 (0.7 – 3.1) µM sunitinib (P = ns; Fig. 2b)). The corresponding
intratumoral / skin sunitinib concentrations in micrograms sunitinib per gram tissue
are shown in table 1. Sunitinib serum concentrations varied largely between mice,
HT-29PAR
0 10 20 30 40 500
200
400
600
VehicleSunitinib
***
Days after cell injection
Tum
or
volu
me
(m
m3)
HT-29SUN
0 10 20 30 40 500
50
100
150
200
250
VehicleSunitinib
NS
Days after cell injection
Tum
or
volu
me
(m
m3)
HT-29PAR
Vehicle Sunitinib0.0
0.2
0.4
0.6
0.8
***Tum
or
we
igh
t (g
)
HT-29SUN
Vehicle Sunitinib0.00
0.05
0.10
0.15
0.20
NS
Tum
or
we
igh
t (g
)
Figure 1. Sunitinib treatment of HT-29PAR and HT-29SUN tumors.
a, and b, Growth curves of tumors established from HT-29 parental (HT-29PAR;a) and HT-29
sunitinib resistant (HT-29SUN; b) tumor cells after tumor cell injection (5x10⁶ cells; n = 6). Mice
received treatment with vehicle or sunitinib malate (40 mg/kg/day). c, and d, Tumor weights at the
end of the experiment of HT-29PAR (c) and HT-29SUN (d) tumors.
Results are shown as mean ± SEM (n = 6); ***, P < 0.001, NS= not significant.
a
c
b
d

Acquired tumor cell resistance to sunitinib causes in vivo resistance
71
4
but were comparable between mice bearing HT-29PAR and HT29-SUN tumors: 0.1
µM (non-detectable – 0.3 µM) versus 0.1 µM (0.0 – 0.4 µM) sunitinib (P = ns; Fig. 2c).
Microvessel density, tumor cell proliferation and lysosomal capacity
Representative examples of tumor tissue slices stained with H&E are shown in figure
3a (upper row). Sunitinib-treated HT-29PAR tumors revealed large areas of necrosis
compared to its vehicle-treated tumors. No clear differences in viable or necrotic
areas were observed between vehicle- and sunitinib-treated HT-29SUN tumors.
CD31 staining (representative pictures are shown in figure 3a, middle row) was used
to quantify microvessel density (MVD), as a measure for angiogenesis inhibition. MVD
was significantly reduced in both HT-29PAR and HT-29SUN tumors treated with
sunitinib compared to vehicle-treated tumors (HT-29PAR: 4.7 ± 0.6 versus 10.9 ± 1.6
vessels per field (n = 4; P < 0.01); HT-29SUN: 3.8 ± 1.0 versus 9.3 ± 1.7 vessels per
field (P < 0.05) for sunitinib and vehicle treatment, respectively (Fig. 3b)). This
corresponds to 56 ± 6% MVD inhibition in HT-29PAR and 59 ± 11% inhibition in HT-
29SUN tumors after sunitinib treatment.
Representative pictures of Ki-67 staining as a measure of tumor cell proliferation are
shown in figure 3a, lower row. Ki-67 quantification revealed a significant reduction in
tumor cell proliferation by sunitinib treatment in HT-29PAR tumors by 30 ± 5% (81
± 4% versus 56 ± 4% proliferating cells in PAR vehicle- versus sunitinib-treated mice; n
= 4, P < 0.01; Fig. 3c). In mice bearing HT-29SUN tumors, proliferation of tumors cells
remained unaffected with a tumor cell proliferation of 67 ± 0% in vehicle- and 66 ±
1% in sunitinib-treated mice (P = ns).
Expression of lysosomal associated membrane proteins-1 and -2 (LAMP-1 and -2) was
used as a measure of lysosomal capacity. Like in vitro,20 western blot analysis showed
increased expression of both LAMP-1 and LAMP-2 in HT-29SUN tumors compared to
HT-29PAR tumors (Fig. 3d). Quantification demonstrated an increase in LAMP-1
expression in HT-29SUN versus HT-29PAR tumors of 3.1 fold in vehicle-treated (P =
ns) and 3.9 fold in sunitinib-treated tumors (P < 0.01; Fig. 3e). In addition, LAMP-2
expression was increased in HT-29SUN compared to HT-29PAR tumors with 1.7 fold
in vehicle-treated (P = ns) and also 1.7 fold in sunitinib-treated tumors (P < 0.01).
Table 1. Sunitinib concentrations (median (range)) in tumor and in normal skin.
micromole (µM) µg per gram tissue (µg / g)
Tumor HT-29PAR
HT-29SUN
9.1 (7.4 – 12.6)
8.1 (5.5 – 13.1)
3.6 (3.0 – 5.0)
3.2 (2.2 – 5.2)
Skin HT-29PAR
HT-29SUN
1.0 (0.9 – 2.4)
1.4 (0.7 – 3.1)
0.4 (0.3 – 0.9)
0.5 (0.3 – 1.2)
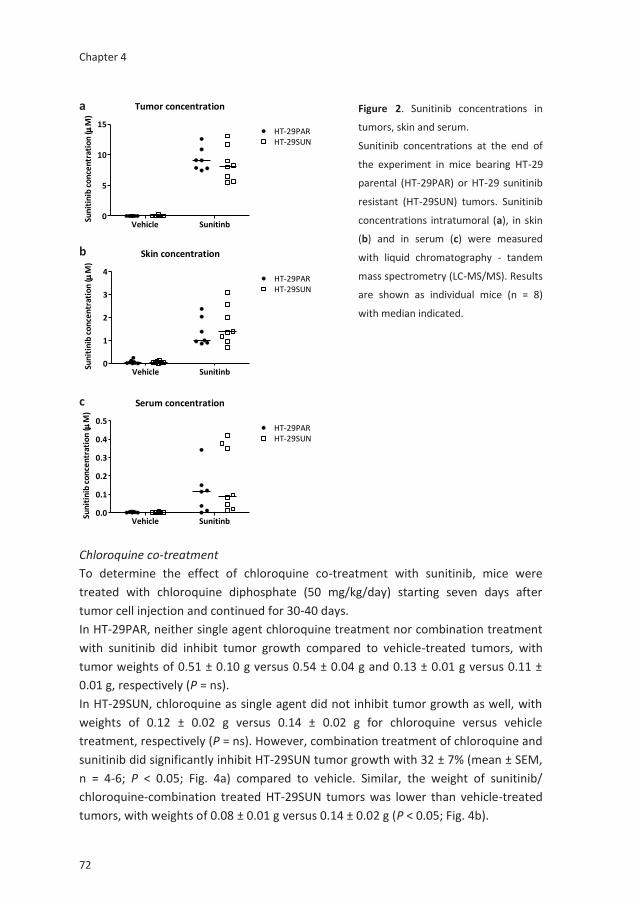
Chapter 4
72
Chloroquine co-treatment
To determine the effect of chloroquine co-treatment with sunitinib, mice were
treated with chloroquine diphosphate (50 mg/kg/day) starting seven days after
tumor cell injection and continued for 30-40 days.
In HT-29PAR, neither single agent chloroquine treatment nor combination treatment
with sunitinib did inhibit tumor growth compared to vehicle-treated tumors, with
tumor weights of 0.51 ± 0.10 g versus 0.54 ± 0.04 g and 0.13 ± 0.01 g versus 0.11 ±
0.01 g, respectively (P = ns).
In HT-29SUN, chloroquine as single agent did not inhibit tumor growth as well, with
weights of 0.12 ± 0.02 g versus 0.14 ± 0.02 g for chloroquine versus vehicle
treatment, respectively (P = ns). However, combination treatment of chloroquine and
sunitinib did significantly inhibit HT-29SUN tumor growth with 32 ± 7% (mean ± SEM,
n = 4-6; P < 0.05; Fig. 4a) compared to vehicle. Similar, the weight of sunitinib/
chloroquine-combination treated HT-29SUN tumors was lower than vehicle-treated
tumors, with weights of 0.08 ± 0.01 g versus 0.14 ± 0.02 g (P < 0.05; Fig. 4b).
Tumor concentration
Vehicle Sunitinb0
5
10
15HT-29PARHT-29SUN
Sun
itin
ib c
on
cen
trat
ion
(M
)
Skin concentration
Vehicle Sunitinb0
1
2
3
4HT-29PARHT-29SUN
Sun
itin
ib c
on
cen
trat
ion
(
M)
Serum concentration
Vehicle Sunitinb0.0
0.1
0.2
0.3
0.4
0.5HT-29PARHT-29SUN
Sun
itin
ib c
on
cen
trat
ion
(M
)
Figure 2. Sunitinib concentrations in
tumors, skin and serum.
Sunitinib concentrations at the end of
the experiment in mice bearing HT-29
parental (HT-29PAR) or HT-29 sunitinib
resistant (HT-29SUN) tumors. Sunitinib
concentrations intratumoral (a), in skin
(b) and in serum (c) were measured
with liquid chromatography - tandem
mass spectrometry (LC-MS/MS). Results
are shown as individual mice (n = 8)
with median indicated.
a
b
c

Acquired tumor cell resistance to sunitinib causes in vivo resistance
73
4
Discussion
The development of acquired drug resistance is a major clinical problem for protein
kinase inhibitors. We hypothesize that elucidating the mechanism of acquired
resistance to sunitinib will provide new potential treatment strategies to circumvent
or overcome this resistance. Therefore, we developed an in vivo tumor model
established from HT-29 parental and sunitinib resistant tumor cells. We showed that
treatment of mice with sunitinib did not inhibit tumor growth of HT-29SUN tumors
while inhibiting tumor growth in HT-29PAR tumors significantly, indicating that tumor
resistant factors play a larger role in resistance than host-factors. This finding was
supported by the fact that sunitinib concentrations in the resistant tumors were
equal to parental tumors reflecting that differences in pharmacokinetic and drug
delivery should not account for this difference. This observation may be of clinical
relevance also based on our previously reported intratumoral sunitinib
concentrations in patients that support a direct antitumor activity of sunitinib rather
than solely inhibition of angiogenesis.20,26
Sunitinib is a multi-targeted tyrosine kinase inhibitor with anti-angiogenic properties
by its potent VEGFR and/or PDGFR targeting. In preclinical studies sunitinib has been
shown to significantly inhibit the growth of a number of colon cancer xenograft
models such as HT-29, LS174t and Colo205 at doses of 40 mg/kg/day. However, an
initial clinical phase II trial with sunitinib in patients with advanced colorectal cancer
that was refractory to standard therapy demonstrated meaningful single-agent
responses only in a subgroup of patients at the standard dosing of 50 mg/kg in 4-
weeks-on, 2-weeks-off cycles (1 PR and 13 SD patients in a group of 84 patients.5
The HT-29 colon cancer cell model is considered an appropriate model for studying
sunitinib resistance mechanisms, because it is initially sensitive to conventional doses
of 40 mg/kg sunitinib malate as used in mouse models by Mendel et al.27 Indeed, we
confirmed a significant tumor growth inhibition of HT-29 tumors, either injected as
cell suspension or as transplanted tumor pieces. Moreover, in another in vivo colon
cancer model (Colo205) it was shown that after administration of a standard dose of
40 mg/kg sunitinib to the mice, a dose sufficient for target inhibition,27 gene
expression changes were detected already 6 hours post-treatment.28 In this in vivo
model we observed a similar resistant phenotype of the tumors as we observed in
vitro with a significant overexpression of the lysosomal compartment in the resistant
tumors as measured by LAMP-1 and LAMP-2 overexpression. In addition, in the
tumors established from the HT-29SUN cells, the effect of sunitinib treatment on
microvessel density was similar to the effect in the HT-29PAR tumors, while the effect
on the percentage of proliferating (Ki-67 positive) tumor cells was decreased in the
sensitive, but not in the resistant HT-29SUN xenografts (Figure 3). Furthermore, we

Chapter 4
74
HT-29PAR
Vehicle SunitinibVehicleSunitinib
H&E
CD31
Ki-67
HT-29SUN
LAMP-1
β-actin
LAMP-2
HT-29PAR
SunitinibVehicle
HT-29SUN
SunitinibVehicle
Microvessel density
HT-29PAR HT-29SUN0
5
10
15VehicleSunitinib
***
No.
of C
D31
pos
itiv
e ve
ssel
s Proliferating tumor cells
HT-29PAR HT-29SUN0
20
40
60
80
100VehicleSunitinibNS
**
% K
i-67
pos
itiv
e tu
mor
cel
ls
LAMP-1
Vehicle Sunitinib0
1
2
3
4
5
**
NS
Treatment
Rel
. LA
MP-
1 ex
pres
sion
LAMP-2
Vehicle Sunitinib0.0
0.5
1.0
1.5
2.0
2.5HT-29PARHT-29SUN
**NS
Treatment
Rel
. LA
MP-
2 ex
pres
sion
a
b c
d
e

Acquired tumor cell resistance to sunitinib causes in vivo resistance
75
4
found a similar slower tumor growth rate of sunitinib resistant tumors compared to
parental tumors as we previously observed in vitro.20 The difference in growth rate
between resistant and parental tumors indicates that the resistant tumors are
significantly affected by continuous exposure to sunitinib. Whether this tumor
resistant phenotype accurately predicts sunitinib resistance in patients needs further
clinical evaluation. However, our results provide the first evidence that a tumor-cell-
mediated mechanism of resistance may play a significant role in acquired resistance
to sunitinib in vivo.
The intratumoral sunitinib uptake in HT-29 tumors was ~10 μM, which was very
similar to the sunitinib tumor uptake in patients treated with the standard dose of 50
mg daily.20 We also found that tumor sunitinib uptake is not different in the sensitive
and resistant tumors, suggesting that difference in exposure of the tumor
compartment to sunitinib does not seem the cause of the resistant phenotype.
Though an increased active cellular efflux of sunitinib might cause cellular resistance
similar to resistance to cytotoxic agents and other protein kinase inhibitors,13,29
sunitinib is not a high affinity substrate for the most common ATP binding cassette
transporters.30 Moreover, we have shown that the cellular sunitinib levels are not
decreased in HT-29 sunitinib resistant cells in vitro. Since sunitinib inhibits the
vascularity in both tumor models to the same extent, the resistance phenotype does
not seem a consequence to hypoxia-induced growth factor production in the tumors
or mobilization of growth-factor producing myeloid cell populations31 with
consequent switch of the endothelial cell compartment from dependence on VEGFR
signaling to other signaling pathways (i.e. EGF/EGFR or HGF/c-MET supported
signaling).16
Figure 3. Immunohistochemical stainings and CD31, Ki-67 and LAMP-1 and -2 quantification.
a, Representative pictures of (immunohistochemical) stainings of tumors established from HT-29
parental (HT-29PAR) and HT-29 sunitinib resistant (HT-29SUN) tumor cells, treated with vehicle or
sunitinib. Upper row: H&E staining; middle row: CD31 staining; lower row: Ki-67 staining. b, Quantifi-
cation of microvessel density (MVD) using CD31 staining (n = 8). Data are expressed as number of
CD31 positive vessels per 200x field. c, Quantification of tumor cell proliferation using Ki-67 staining
(n = 4). Data are expressed as Ki-67 positive tumor cells as percentage of total tumor cells. d, West-
ern blot of lysosomal associated membrane proteins-1 and -2 (LAMP-1 and -2). Two representative
tumor tissue samples per group are shown. e, Quantification of LAMP-1 and -2 by western blot
analysis (n = 4). LAMP-1 and -2 expression was corrected for β-actin expression, and normalized to
vehicle-treated tumor samples.
Results are shown as mean ± SEM; *, P <0.05; **, P <0.01, NS = not significant. Scale bars are 100µm.

Chapter 4
76
The observed lack of effect on tumor growth of sunitinib in the presence of an anti-
angiogenic effect has been reported in a pancreatic ductal adenocarcinoma model as
well.32 Similar to this prior report, in our study the HT-29 sunitinib resistant tumors
continued to grow independently from the vasculature nearby. In addition, we have
no indication from exposure of human umbilical vein endothelial cells (HUVECs) to
sunitinib in vitro that a significant down-regulation of CD31 expression is the reason
for the apparent reduction of microvessels in the treated tumors (data not shown).
Whether the slower growth rate of HT-29SUN tumors contributes to a more
angiogenesis-independent tumor growth remains to be defined. In addition,
treatment induced senescence may play a role in this angiogenesis independent
growth, which may be mediated by p53/DEC1 activation and Raf-1/nuclear factor-
(NF)-κB activation as shown by Zhu et al.33
The clinical significance of the HT-29 resistant phenotype remains to be investigated.
It is important to consider that tumor-mediated rather than, or in addition to, a host-
mediated resistance mechanisms might contribute to initial or acquired resistance to
sunitinib or other VEGF receptor tyrosine kinase inhibitors.
As we previously reported that acidic lysosomes may be involved in the cause of
resistance by intracellular sequestration of sunitinib due to its chemical
characteristics,20 we found that LAMP-1 and -2 expression remains elevated in the
resistant compared to the parental tumors. Due to the fact that sunitinib is
hydrophobic (logP = 5.2), it can easily cross plasma membranes and other
intracellular membranes. On the other hand, because it is a weak base (pKa = 8.95),2
sunitinib will be increasingly protonated and thereby lose its ability to cross
HT-29SUN
0 10 20 30 40 500
50
100
150
200
250VehicleCombination
*
Days after cell injection
Tum
or
volu
me
(m
m3)
HT-29SUN
Vehicle Combination0.00
0.05
0.10
0.15
0.20
*
Tum
or
we
igh
t (g
)
Figure 4. Co-treatment of sunitinib with chloroquine.
a, Growth curves and b, Tumor weights at the end of the experiment of tumors established from HT-
29 sunitinib resistant (HT-29SUN) tumor cells after tumor cell injection. Mice were treated with
vehicle or the combination of sunitinib malate (40 mg/kg/day) and chloroquine diphosphate (50 mg/
kg/day).
Results are shown as mean ± SEM (n = 4-6); *, P < 0.05.
a b

Acquired tumor cell resistance to sunitinib causes in vivo resistance
77
4
membranes in acidic environment. At a pH of 5, all sunitinib will be protonated.
Therefore, upon entering an acidic organelle such as a lysosome (pH ≤ 5), sunitinib
becomes protonated and cannot cross membranes anymore. Lysosomal sunitinib
sequestration may play an important role in these in vivo experiments as a mediator
of resistance. We have previously reported that short time exposure of bafilomycin
A1, an inhibitor of the lysosomal function by increasing the lysosomal pH, does
induce the release of sunitinib from lysosomes in vitro.20 However, this agent is too
toxic for in vivo experiments and therefore it is impossible to demonstrate whether it
can revert sunitinib resistance in vivo. We examined chloroquine as an alternative for
bafilomycin A1. In line with the recent report of Abdel-Aziz and co-workers, showing
a potentiating effect of chloroquine on the antitumor activity of sunitinib,21 our
current in vivo data indicate that systemic exposure to chloroquine, in combination
with sunitinib, inhibits tumor growth of sunitinib resistant tumors in these
xenografts. The activity of chloroquine to overcome sunitinib resistance in the HT-
29SUN tumors may suggest that displacement of sunitinib from lysosomal stores may
increase its general kinase inhibitory activity or for instance that the resistant tumor
cells are more vulnerable to autophagy-inhibitory properties of chloroquine, which
has been reported for several cell lines21 and needs further clinical evaluation.
In conclusion, we show that acquired resistance to sunitinib is significantly dependent
on tumor cells rather than host-factors. Reduction in microvessel density was similar
in sensitive and resistant tumors in vivo, indicating that in this model endothelial cell
function/ proliferation may play a secondary role in the resistance to sunitinib. The
lysosomal capacity of tumor cells most likely contributes to sunitinib resistance.
Based on these results, we started to evaluate the lysosomal function in resistance to
sunitinib in a clinical trial in which patients with metastatic RCC are being
rechallenged with sunitinib treatment following acquired resistance to sunitinib.
Acknowledgements
This work was supported by a research grant of Pfizer Global Pharmaceuticals, an
AEGON Research Fellowship Program and a travel grant from the Dutch Cancer
Society.

Chapter 4
78
References
1 Garraway LA, Janne PA. Circumventing cancer drug resistance in the era of personalized
medicine. Cancer Discov 2012;2(3):214-26.
2 Goodman VL, Rock EP, Dagher R et al. Approval summary: sunitinib for the treatment of
imatinib refractory or intolerant gastrointestinal stromal tumors and advanced renal cell
carcinoma. Clin Cancer Res 2007;13(5):1367-73.
3 Raymond E, Dahan L, Raoul JL et al. Sunitinib malate for the treatment of pancreatic
neuroendocrine tumors. N Engl J Med 2011;364(6):501-13.
4 Motzer RJ, Hutson TE, Tomczak P et al. Overall survival and updated results for sunitinib
compared with interferon alfa in patients with metastatic renal cell carcinoma. J Clin Oncol
2009;27(22):3584-90.
5 Saltz LB, Rosen LS, Marshall JL et al. Phase II trial of sunitinib in patients with metastatic
colorectal cancer after failure of standard therapy. J Clin Oncol 2007;25(30):4793-9.
6 Faivre S, Demetri G, Sargent W, Raymond E. Molecular basis for sunitinib efficacy and future
clinical development. Nat Rev Drug Discov 2007;6(9):734-45.
7 Fabian MA, Biggs WH 3rd, Treiber DK et al. A small molecule-kinase interaction map for
clinical kinase inhibitors. Nat Biotechnol 2005;23(3):329-36.
8 Karaman MW, Herrgard S, Treiber DK et al. A quantitative analysis of kinase inhibitor
selectivity. Nat Biotechnol 2008;26(1):127-32.
9 Bottsford-Miller JN, Coleman RL, Sood AK. Resistance and escape from antiangiogenesis
therapy: clinical implications and future strategies. J Clin Oncol 2012;30(32):4026-34.
10 Hammers HJ, Verheul HM, Salumbides B et al. Reversible epithelial to mesenchymal
transition and acquired resistance to sunitinib in patients with renal cell carcinoma: evidence
from a xenograft study. Mol Cancer Ther 2010;9(6):1525-35.
11 Bergers G, Hanahan D. Modes of resistance to anti-angiogenic therapy. Nat Rev Cancer
2008;8(8):592-603.
12 Ellis LM, Hicklin DJ. Pathways mediating resistance to vascular endothelial growth factor-
targeted therapy. Clin Cancer Res 2008;14(20):6371-5.
13 Broxterman HJ, Gotink KJ, Verheul HM. Understanding the causes of multidrug resistance in
cancer: a comparison of doxorubicin and sunitinib. Drug Resist Updat 2009;12(4-5):114-26.
14 Tang SC, Lankheet NA, Poller B, Wagenaar E, Beijnen JH, Schinkel AH. P-glycoprotein (ABCB1)
and breast cancer resistance protein (ABCG2) restrict brain accumulation of the active
sunitinib metabolite N-desethyl sunitinib. J Pharmacol Exp Ther 2012;341(1):164-73.
15 Huang D, Ding Y, Zhou M, Rini BI et al. Interleukin-8 mediates resistance to antiangiogenic
agent sunitinib in renal cell carcinoma. Cancer Res 2010;70(3):1063-71.
16 Shojaei F, Lee JH, Simmons BH et al. HGF/c-Met acts as an alternative angiogenic pathway in
sunitinib-resistant tumors. Cancer Res 2010;70(24):10090-100.

Acquired tumor cell resistance to sunitinib causes in vivo resistance
79
4
17 Su SC, Hu X, Kenney PA et al. Autotaxin-lysophosphatidic Acid signaling axis mediates
tumorigenesis and development of acquired resistance to sunitinib in renal cell carcinoma.
Clin Cancer Res 2013;19(23):6461-72..
18 Yang J, Ikezoe T, Nishioka C et al. Long-term exposure of gastrointestinal stromal tumor cells
to sunitinib induces epigenetic silencing of the PTEN gene. Int J Cancer 2012;130(4):959-66.
19 Sato M, Nakai Y, Nakata W et al. EMMPRIN promotes angiogenesis, proliferation, invasion
and resistance to sunitinib in renal cell carcinoma, and its level predicts patient outcome.
PLoS One 2013;8(9):e74313.
20 Gotink KJ, Broxterman HJ, Labots M et al. Lysosomal sequestration of sunitinib: a novel
mechanism of drug resistance. Clin Cancer Res 2011;17(23):7337-46.
21 Abdel-Aziz AK, Shouman S, El-Demerdash E, Elgendy M, Abdel-Naim AB. Chloroquine
synergizes sunitinib cytotoxicity via modulating autophagic, apoptotic and angiogenic
machineries. Chem Biol Interact. 2014;217:28-40
22 Slater AF. Chloroquine: mechanism of drug action and resistance in Plasmodium falciparum.
Pharmacol Ther 1993;57(2-3):203-35.
23 Savarino A, Boelaert JR, Cassone A, Majori G, Cauda R. Effects of chloroquine on viral
infections: an old drug against today's diseases? Lancet Infect Dis 2003;3(11):722-7.
24 Zhao H, Cai Y, Santi S, Lafrenie R, Lee H. Chloroquine-mediated radiosensitization is due to
the destabilization of the lysosomal membrane and subsequent induction of cell death by
necrosis. Radiat Res 2005;164(3):250-7.
25 Honeywell R, Yarzadah K, Giovannetti E et al. Simple and selective method for the
determination of various tyrosine kinase inhibitors used in the clinical setting by liquid
chromatography tandem mass spectrometry. J Chromatogr B Analyt Technol Biomed Life Sci
2010;878(15-16):1059-68.
26 Labots M, Neerincx M, Van der Mijn JC et al. Tumor, skin, and plasma concentrations of
protein kinase inhibitors (PKIs) in patients with advanced cancer. J Clin Oncol 2013;31 suppl;
abstr 11087.
27 Mendel DB, Laird AD, Xin X et al. In vivo antitumor activity of SU11248, a novel tyrosine
kinase inhibitor targeting vascular endothelial growth factor and platelet-derived growth
factor receptors: determination of a pharmacokinetic/ pharmacodynamic relationship. Clin
Cancer Res 2003;9(1):327-37.
28 Morimoto AM, Tan N, West K et al. Gene expression profiling of human colon xenograft
tumors following treatment with SU11248, a multitargeted tyrosine kinase inhibitor.
Oncogene 2004;23(8):1618-26.
29 Broxterman HJ, Lankelma J, Hoekman K. Resistance to cytotoxic and anti-angiogenic
anticancer agents: similarities and differences. Drug Resist Updat 2003;6(3):111-27.
30 Hu S, Chen Z, Franke R et al. Interaction of the multikinase inhibitors sorafenib and sunitinib
with solute carriers and ATP-binding cassette transporters. Clin Cancer Res 2009;15(19):6062
-9.
Chapter 4
80
31 Shojaei F, Wu X, Qu X et al. G-CSF-initiated myeloid cell mobilization and angiogenesis
mediate tumor refractoriness to anti-VEGF therapy in mouse models. Proc Natl Acad Sci USA
2009;106(16):6742-7.
32 Olson P, Chu GC, Perry SR, Nolan-Stevaux O, Hanahan D. Imaging guided trials of the
angiogenesis inhibitor sunitinib in mouse models predict efficacy in pancreatic
neuroendocrine but not ductal carcinoma. Proc Natl Acad Sci USA 2011;108(49):E1275-
E1284.
33 Zhu Y, Xu L, Zhang J et al. Sunitinib induces cellular senescence via p53/Dec1 activation in
renal cell carcinoma cells. Cancer Sci 2013;104(8):1052-61.

Acquired tumor cell resistance to sunitinib causes in vivo resistance
81
4
HT-29PAR
20 40 60 800
200
400
600
800
1000VehicleSunitinib
***
Days after tumor transplant
Tum
or
volu
me
(m
m3)
HT-29SUN
20 40 60 800
100
200
300VehicleSunitinib
NS
Days after tumor transplant
Tum
or
volu
me
(m
m3)
HT-29PAR
Vehicle Sunitinib0.0
0.2
0.4
0.6
0.8
***
Tum
or
we
igh
t (g
)
HT-29SUN
Vehicle Sunitinib0.00
0.05
0.10
0.15
0.20
0.25
NS
Tum
or
we
igh
t (g
)
Supplementary figure
Supplementary Figure S1. Sunitinib treatment of HT-29PAR and HT-29SUN tumors after tumor
transplant.
a, and b, Growth curves of tumors established from HT-29 parental (HT-29PAR; a) and HT-29
sunitinib-resistant (HT- 29SUN; b) tumor cells after tumor transplantation, treated with vehicle or
sunitinib (40 mg/kg/day). c, and d, Tumor weights at the end of the experiment of HT-29PAR (c) and
HT-29SUN (d) tumors.
Results are shown as mean ± SEM (n = 8); ***, P < 0.001.
a b
c d


Chapter 5
Cross-resistance to clinically used
tyrosine kinase inhibitors
sunitinib, sorafenib and pazopanib
Kristy J. Gotink, Maria Rovithi, Richard R. de Haas, Richard J.
Honeywell, Henk Dekker, Dennis Poel, Kaamar Azijli,
Godefridus J. Peters, Henk J. Broxterman, Henk M.W. Verheul
Cellular Oncology 2015;38(2):119-29

Chapter 5
84
Abstract
Purpose: When during cancer treatment resistance to a tyrosine kinase inhibitor (TKI)
occurs, switching to another TKI is often considered as a reasonable option.
Previously, we reported that resistance to sunitinib may be caused by increased
lysosomal sequestration, leading to increased intracellular lysosomal storage and,
thereby, inactivity. Here, we studied the effect of several other TKIs on the
development of (cross-)resistance.
Methods: TKI resistance was induced by continuous exposure of cancer cell lines to
increasing TKI concentrations for 3-4 months. (Cross-)resistance was evaluated using
MTT cell proliferation assays. Intracellular TKI concentrations were measured using
LC-MS/MS. Western Blotting was used to detect lysosome-associated membrane
protein-1 and -2 (LAMP1/2) expression.
Results: The previously generated sunitinib-resistant (SUN) renal cancer cells (786-O)
and colorectal cancer cells (HT-29) were found to be cross-resistant to pazopanib,
erlotinib and lapatinib, but not sorafenib. Exposure of 786-O and HT-29 cells to
sorafenib, pazopanib or erlotinib for 3-4 months induced drug resistance to
pazopanib and erlotinib, but not sorafenib. Intracellular drug accumulation was found
to be increased in pazopanib- and erlotinib-, but not in sorafenib-exposed cells.
Lysosomal capacity, reflected by LAMP1/2 expression, was found to be increased in
resistant cells and, in addition, to be transient. No cross-resistance to the mTOR
inhibitor everolimus was detected.
Conclusions: Our data indicate that tumor cells can develop (cross-)resistance to TKIs,
and that such resistance includes increased intracellular drug accumulation
accompanied by increased lysosomal storage. Transient (cross-)resistance was found
to occur for several of the TKIs tested, but not for everolimus, indicating that
switching from a TKI to an mTOR inhibitor may be an attractive therapeutic option.

Cross-resistance to clinically used TKIs
85
5
Introduction
The human kinome encodes 518 protein kinases, many of which are deregulated in
cancer.1 Receptor tyrosine kinases, belonging to the vascular endothelial growth
factor (VEGF) signaling pathway, serve as validated clinical anticancer targets for
tyrosine kinase inhibitors (TKIs) such as sunitinib, sorafenib and pazopanib.2 These
multi-targeted TKIs have shown clinical benefit as monotherapy in renal cell cancer,
and their application is currently expanding to other tumor types.3 Despite their
clinical benefit, however, complete remissions are rare and with time patients
invariably suffer from disease progression, leading to discontinuation of treatment. In
case of progression or unacceptable toxicity for either one of these TKIs, switching to
another TKI is considered as a bona fide treatment option.4,5 Such sequential use can
indeed be effective, i.e., pazopanib and sorafenib have shown clinical activity after
sunitinib failure, suggesting that cross-resistance may be only partial.5,6
Currently, detailed information is lacking on patterns of resistance or cross-resistance
of tumor cells to long-term exposure to multi-targeted TKIs. Contrary, single targeted
TKIs, such as e.g. vemurafenib, targeting the BRAFV600E mutation in melanomas, or
gefitinib, targeting activating EGFR mutations in lung cancer, often lead to the
development of secondary drug-resistant kinase mutations thereby, at least partly,
explaining the development of TKI resistance.7 As yet, it is poorly understood how
tumor cells respond to long-term kinase inhibitor exposure, e.g. to the clinical
administration of sunitinib, where partial responses are most commonly observed.
We have recently mimicked prolonged sunitinib exposure in vitro and showed that
continuous exposure to sunitinib for several months can induce resistance to this TKI
in 786-O renal cell cancer and the HT-29 colorectal cancer cell lines.8 Importantly,
when grown as in vivo xenografts in mice, the HT-29 sunitinib-resistant cell line
remained resistant.9 In addition, we found that sunitinib resistance was accompanied
by an increased lysosomal storage capacity and was reversible upon removal of the
drug within several weeks. Therefore, this transient form of resistance may be an
adaptation to (partial) inhibition of multiple kinases and/or to a partly disturbed
lysosomal function, rather than a stable, genetic form of resistance. These results
support other preliminary reports indicating that re-challenging of patients with
sunitinib, after a certain recovery period, may be a bona fide treatment option.10,11
In order to obtain further insight into the possible consequences of long-term
administration of sunitinib or other TKIs to the sensitivity of tumor cells to second
line therapy, we explored the resistance and cross-resistance patterns of tumor cells
to several multi-targeted TKIs and the mTOR inhibitor everolimus. Since there is
preclinical and clinical evidence for the existence of synergistic interactions between
EGFR and VEGFR inhibitors in various tumor types,12-14 we also included erlotinib and

Chapter 5
86
lapatinib in our current study. We found that sunitinib-resistant tumor cells are cross-
resistant to some, but not all, TKIs tested in conjunction with increased intracellular
drug accumulation. Upon continuous exposure of both 786-O and HT-29 cells,
resistance could be induced to some TKIs, and the results are comparable to the
cross-resistance findings. Furthermore, in the resistant cells the lysosomal
compartment was increased as revealed by increased LAMP-1/2 expression.
Materials and methods
Reagents
Sunitinib malate was kindly provided by Pfizer Oncology (New York, NY). Sorafenib,
pazopanib, erlotinib hydrochloride, lapatinib di-p-toluenesulfonate and everolimus
were purchased from LC Laboratories (Woburn, MA). All drugs were prepared as 20
mM stock solutions in DMSO (Sigma-Aldrich), except erlotinib hydrochloride, which
was prepared as a 10 mM stock solution in 96% DMSO/ 4% H2O. All stock solutions
were stored at -80°C.
Cell culture
786-O renal cell cancer (RCC) and HT-29 colorectal cancer (CRC) cell lines were
cultured in DMEM supplemented with 5% fetal bovine serum (FBS) and maintained in
a humidified incubator containing 5% CO2 at 37°C. Both cell lines were purchased
from the American Tissue Culture Collection (ATCC) and were authenticated by STR
profiling (Baseclear, Leiden, Netherlands). The generation of the sunitinib-resistant
sub-lines 786-O SUN and HT-29 SUN, continuously cultured in the presence of 5 µM
or 10 µM sunitinib, respectively, has been described previously.8 To induce resistance
to sorafenib, pazopanib and erlotinib, the parental cell lines 786-O and HT-29 were
continuously exposed for 3-4 months to gradually increasing concentrations of the
respective drugs. The initial exposure concentrations were set between the IC10 and
IC50 values for each specific compound. When cells reached confluence, they were
split and the TKI concentration was at maximum doubled in the subsequent culture
period. This procedure was repeated for 3-4 months, until a stable well-tolerated TKI
concentration was reached and TKI sensitivity was tested as described below.
MTT proliferation assay
The (cross-)resistance to different drugs was evaluated by MTT proliferation assays as
previously described.8 Briefly, all cells were seeded in 96-well culture plates without
drug and allowed to adhere for 24h. Subsequently, t = 0 was measured using MTT (3-
(4,5-dimethylthiazolyl-2)-2,5-diophenyl tetrazolium bromide) and drugs were added
at different concentrations (in 3-fold). After 96h, proliferation was assessed using

Cross-resistance to clinically used TKIs
87
5
MTT. Experiments were repeated three times independently, unless stated
otherwise.
TKI measurements by LC-MS/MS
Parental and sunitinib, sorafenib, pazopanib or erlotinib exposed cells were seeded in
6-well culture plates and allowed to adhere for 48h. Next, cells were washed once
with PBS and incubated with TKI-containing medium as indicated. After 24h, cells
were washed three times with ice-cold PBS after which cells were trypsinized at 37°C
for 5 min and, when detached, ice-cold PBS was added. Next, samples were re-
suspended, collected and counted. After centrifugation at 13,000 rpm/ 4°C for 10
minutes, the supernatant was discarded and pellets were snap frozen in liquid
nitrogen and stored at -80°C until analysis.
For TKI accumulation analyses, cell pellets were reconstituted in 100 µl of Milli-Q
water and homogenized by gentle aspiration. Subsequently, 20 µl of the
homogeneous solution was mixed with 80 µl of ice cold acetonitrile in a round
bottomed 96-well plate; a plate seal was applied to prevent evaporation. After
careful ultra-sonication for 30 seconds, the plate was centrifuged at 4°C / 1000 x g for
10 minutes and 50 µl solution was transferred to a conical 200 µl 96-well plate for
injection on the optimized liquid chromatography - tandem mass spectrometry
system (LC-MS/MS system). Chromatographic parameters and mass spectroscopic
parameters for sunitinib, sorafenib and erlotinib were as previously reported.15
Optimized pazopanib parameters were determined using a standard reference
compound diluted to 1 µg/ml in mobile phase and linearity, accuracy and precision
parameters were determined for responses across a concentration range of 5 - 5000
ng/ml.
Western blot analysis
Parental and sorafenib, pazopanib or erlotinib exposed cells were seeded in TKI-
containing medium and allowed to grow for 48h. Before lysis, cells were washed
twice with ice-cold PBS. Cell lysates were prepared using M-PER mammalian protein
extraction reagent (Thermo Scientific) supplemented with protease and phosphatase
inhibitor cocktails (Thermo Scientific). Cells were incubated with the lysis buffer
mixture for 20 min on ice, scraped off, collected and, subsequently, centrifuged at
10,000 x g for 15 min at 4°C. The supernatant was collected and stored at -80°C until
analysis. Cell lysates were prepared three times independently. Protein
concentrations were determined using a micro BCA protein kit (Thermo Scientific).
Samples containing 20-50 µg protein were subjected to 10% SDS polyacrylamide gel
electrophoresis and, subsequently, transferred to PVDF membranes (Immobilon-FL,
Millipore). Proteins were detected using the following antibodies (catalogue numbers

Chapter 5
88
in parentheses): anti-LAMP-1 (sc-20011), anti-LAMP-2 (sc-18822) (Santa Cruz
biotechnology) and anti-β-actin (A5441) (Sigma-Aldrich). After incubation with IRDye
infrared dye labeled secondary antibodies (LI-COR Biosciences), membranes were
scanned using an Odyssey Infrared Imaging System (LI-COR Biosciences). Protein
expression was determined using the accompanying software program (LI-COR
Biosciences) and corrected for β-actin expression. Expression levels were normalized
to untreated samples.
Statistical analyses
Data are expressed as mean ± standard error of the mean (SEM). When appropriate,
results are shown as normalized data. Statistical analyses were performed using
Student’s t-test. Resistance is defined as resistance factor > 2.5, calculated as IC50
value of the exposed cell line divided by the IC50 value of the parental cell line. A P
value < 0.05 was considered to be statistically significant.
Results
TKI sensitivity of parental 786-O and HT-29 cells
First, we determined the sensitivity of the parental cell lines 786-O PAR and HT-29
PAR to the tyrosine kinase inhibitors (TKIs) sunitinib, sorafenib and pazopanib, to the
EGFR TKIs erlotinib and lapatinib and to the mTOR inhibitor everolimus in 96 hour
proliferation assays. The sensitivities to the respective TKIs were found to be in the
same, low micro-molar range (Fig. 1a), with IC50 values between 0.8 and 6.5 µM
(Table 1), and were comparable between the two cell lines. The mTOR inhibitor
everolimus showed a different sensitivity curve compared to the TKIs and reached a
plateau between ~1 nM and 10 µM, at which the proliferation hardly decreased
(~IC60 (786-O) and ~IC30 (HT-29); Fig. 1b).
TKI cross-resistance in sunitinib-resistant 786-O and HT-29 cells
First, we confirmed the previously reported8 sunitinib-resistance in the 786-O SUN
and HT-29 SUN cell lines with a resistance factor (RF) of 3 - 4 fold (Fig. 2a and Table
1). Subsequently, we determined the sensitivity of 786-O SUN and HT-29 SUN cells to
sorafenib, pazopanib, erlotinib, lapatinib and everolimus (Fig. 2a and Table 1).
Erlotinib showed a pronounced cross-resistance in both 786-O SUN and HT-29 SUN
cells (RF ≥ 4.5 and > 3.2, respectively) and did not reach an IC50 within the tested
concentration range. Pazopanib showed cross-resistance in HT-29 SUN cells (RF = 22),
but not in 786-O SUN cells (RF = 1.6). Two other TKIs, sorafenib and lapatinib, showed
no cross-resistance in the sunitinib-resistant cells. The effect of everolimus on cell

Cross-resistance to clinically used TKIs
89
5
proliferation was modest over a wide concentration range in the parental cells, with
no detectable cross-resistance in the sunitinib-resistant cell lines.
Since we previously showed that sunitinib-resistance may be associated with an
increased intracellular accumulation of the drug,8 we also measured intracellular
sorafenib, pazopanib and erlotinib concentrations in the SUN compared to the PAR
cell lines (Fig. 2b). First, we confirmed that the total intracellular accumulation of
sunitinib was increased in the resistant cells. Next, we found that the accumulation of
erlotinib was also increased (2-8 fold higher in the sunitinib-resistant cell lines).
Pazopanib showed a 2-fold higher accumulation in HT-29 SUN cells compared to HT-
29 PAR cells, but a similar accumulation in 786-O SUN and PAR cells. Compared to
their respective parental cells, sorafenib showed a 3-fold higher accumulation in HT-
29 SUN cells, but a lower accumulation in 786-O SUN cells.
786-O
5 10 15 20-20
0
20
40
60
80
100
120
sunitinib
sorafenib
pazopanib
erlotinib
lapatinib
Drug conc. (M)
Pro
life
rati
on
(%
)
786-O
0.1 1 10100
1000
10000
100000-20
0
20
40
60
80
100
120
everolimus
Drug conc. (nM)
Pro
life
rati
on
(%
)
HT-29
5 10 15 20-20
0
20
40
60
80
100
120
Drug conc. (M)
HT-29
0.1 1 10100
1000
10000
100000-20
0
20
40
60
80
100
120
Drug conc. (nM)
Figure 1. Sensitivity of (parental) 786-O and HT-29 tumor cells to different inhibitors.
Proliferation assays (MTT) of 786-O (left) and HT-29 (right) parental cell lines incubated with
different concentrations of a, the tyrosine kinase inhibitors (TKIs) sunitinib, sorafenib, pazopanib,
erlotinib or lapatinib or b, the mTOR inhibitor everolimus.
Results are shown as mean ± SEM.
a
b

Chapter 5
90
Induction of multiple TKI cross-resistances in 786-O and HT-29 cells
In order to investigate whether the resistant phenotype induced by sunitinib may
represent an universal resistance mechanism, we exposed 786-O PAR and HT-29 PAR
cells continuously for 3-4 months to increasing concentrations of the multi-targeted
TKIs sorafenib and pazopanib and to the single-targeted TKI erlotinib to compare
resistance induction to an EGFR family TKI. The induction of resistance by these three
TKIs was found to be comparable to their cross-resistance phenotype in the sunitinib-
selected cells: a prominent resistance to pazopanib and erlotinib (RF ≥ 3.1 - > 25) and
no development of resistance to sorafenib (RF = 1.2; Fig. 3a and Table 2). The final
concentration after 3-4 months of exposure was 3 µM sorafenib and 20 µM
pazopanib or erlotinib, respectively. Higher concentrations of pazopanib and erlotinib
could not be achieved due to their limited solubility in culture medium. Pazopanib- or
erlotinib-resistant cells, as well as sorafenib-exposed cells, did not show cross-
resistance to any of the other drugs tested (i.e., sunitinib, sorafenib, pazopanib,
erlotinib, lapatinib, everolimus; data not shown). The intracellular accumulation of
IC50 value (µM) Resistance
Drug Cell line PAR SUN factor
Sunitinib 786-O 1.4 4.2 3.1 ***
HT-29 0.90 3.7 4.1 ***
Sorafenib 786-O 2.7 3.4 1.2 *
HT-29 2.0 3.7 1.8 **
Pazopanib 786-O 6.5 10 1.6
HT-29 0.80 18 22 ***
Erlotinib 786-O 4.4 >20 >4.5 a
HT-29 6.3 >20 >3.2 a
Lapatinib 786-O 4.6 6.4 1.4
HT-29 2.1 4.2 2.0 ***
Everolimus 786-O 0.57 x 10⁻³ 13 x 10-3 23
HT-29 10 23 2.4 *
Table 1. Cross-resistance of sunitinib-resistant cells.
IC50 values of 786-O and HT-29 parental (PAR) and sunitinib-resistant (SUN) cell lines determined by
MTT proliferation assays. IC50 values are shown as means (n = 2-3). Resistance factors are calculated
by dividing the IC50 values of the sunitinib-resistant cell lines by the IC50 value of the parental cell
line, and is denoted ‘cross-resistant’ when >2.5.
*, P < 0.05; **, P < 0.01; ***, P < 0.001; a, P value not available because IC50 was not reached.

Cross-resistance to clinically used TKIs
91
5
Sunitinib
2 4 6 8 10-20
0
20
40
60
80
100
120
786-O PAR
HT-29 PAR
786-O SUN
HT-29 SUN
Sunitinib conc. (M)
Pro
life
rati
on
(%
)Sorafenib
2 4 6 8 10-20
0
20
40
60
80
100
120
Sorafenib conc. (M)
Pazopanib
5 10 15 200
20
40
60
80
100
120
Pazopanib conc. (M)
Erlotinib
0 5 10 15 200
20
40
60
80
100
120
Erlotinib conc. (M)
Pro
life
rati
on
(%
)
Lapatinib
5 10 15 20-20
0
20
40
60
80
100
120
Lapatinib conc. (M)
Everolimus
0.1 1 10100
1000
10000
100000-20
0
20
40
60
80
100
120
Everolimus conc. (nM)
Sunitinib
786-O HT-290
100
200
300
400
PAR
SUN
**
***
ng
sun
itin
ib/
10
E5 c
ell
s
Sorafenib
786-O HT-290
1
2
3
20
40
60
*
*
ng
sora
fen
ib/
10
E5 c
ell
s
Pazopanib
786-O HT-290
1
2
3
4**NS
ng
paz
op
anib
/ 1
0E5
ce
lls
Erlotinib
786-O HT-290.0
0.1
0.2
0.3
0.4
**
***
ng
erl
oti
nib
/ 1
0E5
ce
lls
Figure 2. Cross-resistance of sunitinib-resistant cells.
a, cross-resistance patterns, determined by MTT proliferation assays, of the sunitinib-resistant 786-O
SUN and HT-29 SUN cell lines to sorafenib, pazopanib, erlotinib, lapatinib or everolimus compared to
parental (PAR) cell lines. b, intracellular accumulation of sorafenib, pazopanib or erlotinib in parental
(PAR) and sunitinib-resistant (SUN) cells. Cells were incubated for 24h with drug-containing medium
at the ~IC50 concentration of the parental cell line (except sunitinib itself). Drug concentrations:
sunitinib: 5 µM (786-O) or 10 µM (HT-29); sorafenib: 2 µM (both cell lines); pazopanib: 4 µM (786-O)
or 2 µM (HT-29); erlotinib: 5 µM (both cell lines).
Results are shown as mean ± SEM (n = 2-3). *, P < 0.05; **, P < 0.01; ***, P < 0.001.
a
b

Chapter 5
92
the selected TKIs (sorafenib, pazopanib, erlotinib) was measured in these
continuously exposed cells and compared to shortly exposed parental cells. By doing
so, a ~ 5 - 50 fold increase in pazopanib and erlotinib content, but not in sorafenib
content, was found in the continuously exposed cells compared to the parental cells
(Fig. 3b).
As a measure for the lysosomal compartment the lysosome-associated membrane
proteins LAMP-1 and LAMP-2, which are the most abundant constituents of the
lysosomal membrane,16 were measured by Western blotting. These proteins were
previously found to be increased in the sunitinib-resistant cells and to be reverted to
control levels when cells became sensitive again.8 Through Western blot analysis, we
found that both LAMP-1 and LAMP-2 were expressed at increased levels in most of
the continuously exposed cell lines tested (Fig. 3c). Quantification revealed a 1.5 - 2
fold increase in LAMP-1 and LAMP-2 expression levels for the three TKIs in the
continuously exposed 786-O and HT-29 cell lines, except for the 786-O SOR cell line in
which LAMP-1 expression was found to be unaltered (Fig. 3d).
IC50 value (µM) Resistance
factor Drug Cell line PAR SOR/PAZ/ERL
Sorafenib 786-O 2.7 3.2 1.2 *
HT-29 2.0 2.5 1.2 *
Pazopanib 786-O 6.5 >20 >3.1 a
HT-29 0.80 >20 >25 a
Erlotinib 786-O 4.4 >20 >4.5 a
HT-29 6.3 >20 >3.2 a
Table 2. Induction of resistance to sorafenib, pazopanib or erlotinib.
IC50 values of 786-O and HT-29 parental (PAR) and sorafenib (SOR), pazopanib (PAZ) or erlotinib (ERL)
selected cell lines determined by MTT proliferation assays. IC50 values are shown as means. Resis-
tance factors are calculated by dividing the IC50 value of the inhibitor selected cell line by the IC50
value of the parental cell line, and is denoted ‘resistant’ when >2.5.
*, P < 0.05; a, P value is not available because IC50 was not reached.

Cross-resistance to clinically used TKIs
93
5
Sorafenib
2 4 6 8 10
-20
0
20
40
60
80
100
120
786-O PAR
HT-29 PAR
786-O SOR
HT-29 SOR
Sorafenib conc. (M)
Prol
ifer
atio
n (%
)Pazopanib
5 10 15 20
-20
0
20
40
60
80
100
120
786-O PAR
HT-29 PAR
786-O PAZ
HT-29 PAZ
Pazopanib conc. (M)
Erlotinib
0 5 10 15 200
20
40
60
80
100
120786-O PAR
HT-29 PAR
786-O ERL
HT-29 ERL
Erlotinib conc. (M)
Sorafenib
786-O0
10
20
30
40PAR
SOR
NS
ng s
oraf
enib
/ 10
E5 c
ells
Pazopanib
786-O HT-290
50
100
400
600
800PAR
PAZ
***
***
ng p
azop
anib
/ 10
E5 c
ells
Erlotinib
786-O HT-290.00.20.40.60.81.0
15
20
25PAR
ERL
***
***
ng e
rlot
inib
/ 10
E5 c
ells
PAR SOR PAR ERLPAR PAZ
HT-29
LAMP-1
β-actin
LAMP-2
786-O
PAR SOR PAR ERLPAR PAZ
786-O
PAR SOR PAZ ERL0
1
2
3LAMP-1
LAMP-2****
*** ***
Rel
. exp
ress
ion
HT-29
PAR SOR PAZ ERL0
1
2
3
***
*****
*
***
***
Sorafenib
2 4 6 8 10
-20
0
20
40
60
80
100
120
786-O PAR
HT-29 PAR
786-O SOR
HT-29 SOR
Sorafenib conc. (M)
Prol
ifer
atio
n (%
)
Pazopanib
5 10 15 20
-20
0
20
40
60
80
100
120
786-O PAR
HT-29 PAR
786-O PAZ
HT-29 PAZ
Pazopanib conc. (M)
Erlotinib
0 5 10 15 200
20
40
60
80
100
120786-O PAR
HT-29 PAR
786-O ERL
HT-29 ERL
Erlotinib conc. (M)
Sorafenib
786-O0
10
20
30
40PAR
SOR
NS
ng s
oraf
enib
/ 10
E5 c
ells
Pazopanib
786-O HT-290
50
100
400
600
800PAR
PAZ
***
***
ng p
azop
anib
/ 10
E5 c
ells
Erlotinib
786-O HT-290.00.20.40.60.81.0
15
20
25PAR
ERL
***
***
ng e
rlot
inib
/ 10
E5 c
ells
PAR SOR PAR ERLPAR PAZ
HT-29
LAMP-1
β-actin
LAMP-2
786-O
PAR SOR PAR ERLPAR PAZ
786-O
PAR SOR PAZ ERL0
1
2
3LAMP-1
LAMP-2****
*** ***
Rel
. exp
ress
ion
HT-29
PAR SOR PAZ ERL0
1
2
3
***
*****
*
***
***
Figure 3. Induction of resistance to sorafenib, pazopanib and erlotinib.
a, resistance patterns, determined by MTT proliferation assays, of the 786-O and HT-29 cells
continuously exposed to sorafenib (SOR), pazopanib (PAZ) or erlotinib (ERL) for 3-4 months. b,
intracellular accumulation of sorafenib, pazopanib or erlotinib in parental (PAR) and continuously
exposed SOR, PAZ and ERL cells. PAR cells were incubated for 24h with drug-containing medium at
the concentration of the continuous exposure. Drug concentrations: sorafenib: 3 µM; pazopanib: 20
µM; erlotinib: 20 µM. c, Western blot analysis of lysosome-associated membrane protein-1 and -2
(LAMP-1 and -2), as a measure of the lysosomal compartment. d, quantification of LAMP-1 and -2 by
Western blot analysis. LAMP-1 and LAMP-2 expression was corrected for β-actin expression, and
normalized to untreated samples (PAR). P values are derived from comparison to the PAR cell line.
Results are shown as mean ± SEM. *, P value < 0.05; **, P value < 0.01; ***, P value < 0.001.
b
c
d
a

Chapter 5
94
Pazopanib resistance induction and reversal in 786-O and HT-29 cells
The remarkable pazopanib-resistance, which was observed after 3 - 4 months
continuous exposure to this drug, is of particular interest because of its increasing
clinical use.2 Therefore, additional experiments aimed at establishing a time-course
for resistance induction and its subsequent reversibility were performed. To this end,
786-O and HT-29 cells were exposed to pazopanib for 1, 2 and 4 weeks. We found
that resistance to pazopanib developed rapidly in 786-O cells and was fully present
after a 2 week exposure, whereas such resistance developed slower in HT-29 cells
(Fig. 4a). When pazopanib was removed from the resistant cells (PAZ; cultured for 4
months in presence of the drug), sensitivity was determined after 1, 2 and 4 weeks of
withdrawal. The recovery was found to be rapid in both cell lines and to be nearly
complete within 1 week (Fig. 4b).
786-O
5 10 15 200
20
40
60
80
100
120PAR
PAZ
PAZ 1 wk
PAZ 2 wk
PAZ 4 wk
Pazopanib conc (M)
Pro
life
rati
on
(%
)
HT-29
5 10 15 200
20
40
60
80
100
120
Pazopanib conc (M)
786-O
5 10 15 200
20
40
60
80
100
120PAR
PAZ
REC 1 wk
REC 2 wk
REC 4 wk
Pazopanib conc (M)
Pro
life
rati
on
(%
)
HT-29
5 10 15 200
20
40
60
80
100
120
Pazopanib conc (M)
Figure 4. Induction and recovery of pazopanib-resistance.
a, induction: sensitivity to pazopanib after 1, 2 or 4 weeks of culturing the parental cells (PAR) in the
presence of the drug, compared to the pazopanib-resistant cell line (PAZ; cultured for 3-4 months).
b, recovery: sensitivity to pazopanib 1, 2 or 4 weeks after drug withdrawal from the pazopanib-
resistant cells (PAZ; cultured for 3-4 months), compared to the parental cells (PAR).
Results are shown as mean ± SEM.
b
a

Cross-resistance to clinically used TKIs
95
5
Discussion
Previously, we reported in vitro induction of resistance to sunitinib after prolonged,
continuous exposure of 786-O and HT-29 cancer cell lines to this tyrosine kinase
inhibitor (TKI).8 Induction of resistance was accompanied by an increased intracellular
accumulation of sunitinib and an increase of the lysosomal compartment, as
indicated by an increased expression of the lysosome-associated membrane proteins
LAMP-1 and LAMP-2. The resistance phenotype was found to be transient and
reversible upon removal of sunitinib (8-12 weeks). In the present study, we aimed to
determine whether sunitinib-resistant cancer cell lines may exhibit cross-resistance
to other targeted agents, and whether resistance induction in this experimental
context is a common feature of TKIs. We tested pazopanib, sorafenib and everolimus,
as compounds that are used interchangeably or consecutively for the treatment of
renal cell cancer and two other TKIs with distinct modes of action, i.e., lapatinib and
erlotinib. As in our previous reports, we used the 786-O renal cell cancer (RCC) cell
line, representative of a tumor type in which sunitinib, sorafenib and pazopanib
exhibit single agent activities, and the HT-29 colorectal cancer (CRC) cell line which
represents a tumor type in which these three drugs exhibit activity at best in a small
subset of patients. This latter observation underscores the need to understand in
depth the effect of prolonged administration of these agents, also in CRC.17 We found
cross-resistance of the sunitinib-resistant cell lines to the TKIs pazopanib and
erlotinib, but not to sorafenib, lapatinib or everolimus. A similar resistance pattern
was observed when the parental cell lines were exposed for several months to
sorafenib, pazopanib or erlotinib, i.e., induction of resistance to pazopanib or
erlotinib was found, but not to sorafenib. The development of (cross-) resistance was
accompanied by an increased intracellular accumulation of the respective drugs and
an elevated expression of the lysosomal membrane proteins LAMP-1 and LAMP-2 in
the resistant cells, suggesting an involvement of the lysosomal compartment in the
respective cellular adaptations. In addition, we found that resistance to pazopanib
could be rapidly induced (in 786-O cells) and reversed within a few weeks after drug
withdrawal.
Considering the potential mechanism(s) causing resistance to TKIs in cancer, we
selected tumor cell lines and clinically approved agents to mimic the long-term use of
these agents and the resulting resistance patterns observed in patients. In a clinical
setting, these drugs are often applied continuously, over prolonged periods of time,
of which RCC constitutes a prototype example. It is commonly assumed that
mutations arising under selective pressure during therapy account for the
development of acquired resistance. However, in contrast to e.g. chronic myeloid
leukemia (CML) and gastrointestinal stromal tumors (GIST), where oncogene

Chapter 5
96
addiction is clearly at work, no resistance mutations have been discovered in primary
RCCs or in RCC-derived cell lines that would constitute indisputable proof that this
mutated kinase is required for tumor growth and/or survival.18 Although sunitinib is
used clinically to treat c-KIT driven GISTs, efficient growth inhibition of HT-29 CRC
cells or xenografts requires a simultaneous block of EGFR19,20 or c-MET21 kinases, in
addition to BRAFV600E, consistent with the very low response rate (about 5%) in BRAF-
mutant CRCs. Although the delineation of resistance mechanisms to VEGF inhibitors
is an intense field of investigation, it appears plausible that adaptation to treatment,
including up-regulation of distinct angiogenic mediators22 and reversible epithelial to
mesenchymal transition (EMT),23 may be relevant to this group of agents. Our results
do support this notion, since resistance was found to be temporary and to be
preserved only under continued drug exposure. Upon removal, the cells rapidly
recover their original sensitivity.
At the growth inhibitory IC50 of sunitinib (1 - 2 μM) several major downstream
substrates of (receptor) tyrosine kinases are known to be inhibited, such as p-Akt
(Ser473) and/or p-ERK1/2(Thr202/Tyr204) and/or p-STAT3(Tyr705).24 Given the
apparent lack of one single targetable kinase sufficient to cause effective growth
inhibition in the cell lines tested, it is plausible that a more general low level
inhibition of several upstream receptors and/or non-receptor kinases converges to
the downstream effects of multi-targeted TKIs like sunitinib and sorafenib.25 A
number of kinases, which have in comprehensive in vitro kinase catalytic activity
assays been found to be moderately inhibited by sunitinib,26 are highly
phosphorylated in HT-29 and 786-O cells, including Axl and RSK4.21,27 Therefore,
combined inhibition of these, as well as a number of other abundant kinases such as
AMPK28 or possibly high affinity kinases expressed at a low level such as CSFR1,29
could lead to disruption of proper downstream survival signals. Similar to sunitinib,
these considerations also apply to sorafenib and pazopanib, which have a partially
overlapping kinase inhibition profile.26,30 Knowledge of adaptations in these or other
kinase activity profiles, and on the possibility of kinome reprogramming contributing
to loss of sensitivity to these TKIs, requires further phospho-proteomic based studies.
Such studies may lead to insight in promising combination therapies to improve
response rates, for instance by direct modulation of the Akt/mTOR signaling
pathway.31
We found that resistance induction in 786-O and HT-29 parental cells to pazopanib
and erlotinib bears characteristics resembling resistance induction to sunitinib, i.e.,
increased intracellular drug accumulation and increased levels of LAMP-1 and LAMP-
2 in the resistant cell lines. Pazopanib and erlotinib belong to the same class of
hydrophobic, membrane-permeable weak bases as sunitinib, properties that could
facilitate the accumulation of their protonated form in the acidic lysosomes, thereby

Cross-resistance to clinically used TKIs
97
5
resulting in increased accumulation and an increase in the lysosomal compartment. A
recent study confirmed the lysosomal accumulation of sunitinib and revealed a
disturbed intra-lysosomal pH, leading to leakage of lysosomal proteases into the
cytosol.32 As such, this mechanism may be implicated in cell death induction by this
type of TKIs. An increased stabilization of lysosomes by increased LAMP-1 and LAMP-
2 expression may contribute to the resistance observed. Taking a closer look,
however, some differences between sunitinib-resistance and pazopanib- or erlotinib-
resistance do appear. First, pazopanib- or erlotinib-resistant cells do not show cross-
resistance to any of the other drugs tested (data not shown), while sunitinib-resistant
cells are cross-resistant to pazopanib and erlotinib. In addition, pazopanib-resistant
cells regain sensitivity much faster (~one week after drug removal) than sunitinib-
resistant cells. Differences in time-to-induction of resistance may affect the outcome
(4 months for pazopanib- or erlotinib-resistance versus more than one year for
sunitinib-resistance). Drug characteristics and metabolism may, however, offer
alternative explanations, i.e., resistance may also be influenced by the efficiency of
drug efflux by drug transporters, such as P-glycoprotein, and the mutation-inducing
properties of drugs.33 For instance, though sunitinib and doxorubicin exhibit very
similar physicochemical properties facilitating lysosomal accumulation, and
doxorubicin intercalates into the DNA causing mutations, sunitinib as TKI affects
survival signaling pathways, leading to both similar, but also distinct, cellular
adaptations and resistance mechanisms.34 Our observation that resistance to
sorafenib did not develop in these cell lines under similar conditions indicates that
subtle changes in physicochemical properties of a particular drug, in combination
with a different kinase inhibition profile, may result in differential resistance patterns.
We found that the lysosomal compartment, as measured by LAMP-1/2 expression,
was not or only moderately induced by sorafenib in the present schedule, and that no
intracellular accumulation of sorafenib was detected after continuous exposure. Both
findings support an alternative resistance mechanism for sorafenib compared to the
other TKIs. A recent study showed that sorafenib resistance in hepatocellular
carcinoma cells may at least partly be related to p38α (MAPK14) dependent MEK-ERK
activation, but other downstream proteins, such as STAT3, also seem to be
important.35,36 Since sensitivities to both sorafenib and everolimus are retained in
sunitinib-resistant and pazopanib-resistant cells, switching to these drugs is a
reasonable strategy when progression occurs in patients treated with sunitinib or
pazopanib. The observation that sunitinib-resistant cells do not show cross-resistance
to sorafenib is consistent with results from clinical trials that revealed a survival
benefit for sorafenib in a second-line setting in patients who progressed upon
sunitinib treatment.37 The mTOR inhibitor everolimus may, based on the differences
between these two classes of drugs (multi-targeted TKI versus mTOR inhibitor), be an

Chapter 5
98
even more interesting candidate for sequential therapy. In the past, everolimus has
been shown to prolong progression-free survival after failure of VEGF-targeted
therapy.38 Furthermore, everolimus is currently assessed as alternate treatment with
pazopanib in a rotating schedule in patients with RCC.39
In conclusion, we found that tumor cells can develop (cross-)resistance to TKIs, such
as sunitinib, pazopanib and erlotinib, which is accompanied by an increased
intracellular accumulation. In resistant cells, an increased lysosomal compartment
was found that may cause lysosomal drug sequestration and, thereby, an increased
intracellular accumulation that may prevent intracellular drug activity. The notion
that prolonged administration of these TKIs may cause tumor cell adaptations and
(cross-)resistance to some, but not all, agents tested is of relevance, since these
agents are frequently considered for combination or sequential therapy. In addition,
lysosomal protein expression could serve as a candidate biomarker for these forms of
drug resistance.

Cross-resistance to clinically used TKIs
99
5
References
1. Manning G, Whyte DB, Martinez R, Hunter T, Sudarsanam S. The protein kinase complement
of the human genome. Science 2002;298(5600):1912-34.
2. Motzer RJ, Hutson TE, Cella D et al. Pazopanib versus sunitinib in metastatic renal-cell
carcinoma. N Engl J Med 2013;369(8):722-31.
3. Peled N, Wynes MW, Ikeda N et al. Insulin-like growth factor-1 receptor (IGF-1R) as a
biomarker for resistance to the tyrosine kinase inhibitor gefitinib in non-small cell lung
cancer. Cell Oncol 2013;36(4):277-288.
4. Sabbatini R, Ortega C, Procopio G, Masini C, Galligioni E, Porta C. Metastatic renal cell
carcinoma: how to make the best sequencing decision after withdrawal for intolerance to a
tyrosine kinase inhibitor. Future Oncol 2013;9(6):831-43.
5. Westgeest HM, van Erp NP, Honeywell RJ, Hoekstra R, Peters GJ, Verheul HM. Successful
treatment of renal cell carcinoma with sorafenib after effective but hepatotoxic sunitinib
exposure. J Clin Oncol 2013;31(6):e83-6.
6. Rautiola J, Utriainen T, Peltola K, Joensuu H, Bono P. Pazopanib after sunitinib failure in
patients with metastatic renal cell carcinoma. Acta Oncol 2014;53(1):113-8.
7. Gainor JF, Shaw AT. Emerging paradigms in the development of resistance to tyrosine kinase
inhibitors in lung cancer. J Clin Oncol 2013;31(31):3987-96.
8. Gotink KJ, Broxterman HJ, Labots M et al. Lysosomal sequestration of sunitinib: a novel
mechanism of drug resistance. Clin Cancer Res 2011;17(23):7337-46.
9. Gotink KJ, Broxterman HJ, Honeywell RJ et al. Acquired tumor cell resistance to sunitinib
causes resistance in a HT-29 human colon cancer xenocraft mouse model without affecting
sunitinib biodistribution or the tumor microvasculature. Oncoscience 2014;1(12):844-53.
10. Kuczynski EA, Sargent DJ, Grothey A, Kerbel RS. Drug rechallenge and treatment beyond
progression--implications for drug resistance. Nat Rev Clin Oncol 2013;10(10):571-87.
11. VU University Medical Center. Phase II study of sunitinib rechallenge in patients with
metastatic renal cell carcinoma. In: ClinicalTrials.gov [Internet]. Bethesda (MD): National
Library of Medicine (US). 2000 [cited 2014 May 31]. Available from: http://clinicaltrials.gov/
show/NCT02071641 NLM Identifier: NCT02071641
12. Olaussen KA, Commo F, Tailler M et al. Synergistic proapoptotic effects of the two tyrosine
kinase inhibitors pazopanib and lapatinib on multiple carcinoma cell lines. Oncogene 2009;28
(48):4249-60.
13. Martinelli E, Troiani T, Morgillo F et al. Synergistic antitumor activity of sorafenib in
combination with epidermal growth factor receptor inhibitors in colorectal and lung cancer
cells. Clin Cancer Res 2010;16(20):4990-5001.
14. Lind JS, Dingemans AM, Groen HJ et al. A multicenter phase II study of erlotinib and sorafenib
in chemotherapy-naive patients with advanced non-small cell lung cancer. Clin Cancer Res
2010;16(11):3078-87.

Chapter 5
100
15. Honeywell R, Yarzadah K, Giovannetti E et al. Simple and selective method for the
determination of various tyrosine kinase inhibitors used in the clinical setting by liquid
chromatography tandem mass spectrometry. J Chromatogr B Analyt Technol Biomed Life Sci
2010;878(15-16):1059-68.
16. Saftig P, Schroder B, Blanz J. Lysosomal membrane proteins: life between acid and neutral
conditions. Biochem Soc Trans 2010;38(6):1420-3.
17. Saltz LB, Rosen LS, Marshall JL et al. Phase II trial of sunitinib in patients with metastatic
colorectal cancer after failure of standard therapy. J Clin Oncol 2007;25(30):4793-9.
18. Knight ZA, Lin H, Shokat KM. Targeting the cancer kinome through polypharmacology. Nat
Rev Cancer 2010;10(2):130-7.
19. Yang H, Higgins B, Kolinsky K et al. Antitumor activity of BRAF inhibitor vemurafenib in
preclinical models of BRAF-mutant colorectal cancer. Cancer Res 2012;72(3):779-89.
20. Corcoran RB, Ebi H, Turke AB et al. EGFR-mediated re-activation of MAPK signaling
contributes to insensitivity of BRAF mutant colorectal cancers to RAF inhibition with
vemurafenib. Cancer Discov 2012;2(3):227-35.
21. Gusenbauer S, Vlaicu P, Ullrich A. HGF induces novel EGFR functions involved in resistance
formation to tyrosine kinase inhibitors. Oncogene 2013;32(33):3846-56.
22. Huang D, Ding Y, Zhou M et al. Interleukin-8 mediates resistance to antiangiogenic agent
sunitinib in renal cell carcinoma. Cancer Res 2010;70(3):1063-71.
23. Hammers HJ, Verheul HM, Salumbides B et al. Reversible epithelial to mesenchymal
transition and acquired resistance to sunitinib in patients with renal cell carcinoma: evidence
from a xenograft study. Mol Cancer Ther 2010;9(6):1525-35.
24. Xin H, Zhang C, Herrmann A, Du Y, Figlin R, Yu H. Sunitinib inhibition of Stat3 induces renal
cell carcinoma tumor cell apoptosis and reduces immunosuppressive cells. Cancer Res
2009;69(6):2506-13.
25. Yang F, Brown C, Buettner R et al. Sorafenib induces growth arrest and apoptosis of human
glioblastoma cells through the dephosphorylation of signal transducers and activators of
transcription 3. Mol Cancer Ther 2010;9(4):953-62.
26. Anastassiadis T, Deacon SW, Devarajan K, Ma H, Peterson JR. Comprehensive assay of kinase
catalytic activity reveals features of kinase inhibitor selectivity. Nat Biotechnol 2011;29
(11):1039-45.
27. Bender C, Ullrich A. PRKX, TTBK2 and RSK4 expression causes Sunitinib resistance in kidney
carcinoma- and melanoma-cell lines. Int J Cancer 2012;131(2):E45-E55.
28. Hasinoff BB, Patel D, O'Hara KA. Mechanisms of myocyte cytotoxicity induced by the multiple
receptor tyrosine kinase inhibitor sunitinib. Mol Pharmacol 2008;74(6):1722-8.
29. Menke J, Kriegsmann J, Schimanski CC, Schwartz MM, Schwarting A, Kelley VR. Autocrine CSF
-1 and CSF-1 receptor coexpression promotes renal cell carcinoma growth. Cancer Res
2012;72(1):187-200.
Cross-resistance to clinically used TKIs
101
5
30. Kumar R, Crouthamel MC, Rominger DH et al. Myelosuppression and kinase selectivity of
multikinase angiogenesis inhibitors. Br J Cancer 2009;101(10):1717-23.
31. Makhov PB, Golovine K, Kutikov A et al. Modulation of Akt/mTOR signaling overcomes
sunitinib resistance in renal and prostate cancer cells. Mol Cancer Ther 2012;11(7):1510-7.
32. Ellegaard AM, Groth-Pedersen L, Oorschot V et al. Sunitinib and SU11652 inhibit acid
sphingomyelinase, destabilize lysosomes, and inhibit multidrug resistance. Mol Cancer Ther
2013;12(10):2018-30.
33. Szwed M, Kania KD, Jozwiak Z. Relationship between therapeutic efficacy of doxorubicin-
transferrin conjugate and expression of P-glycoprotein in chronic erythromyeloblastoid
leukemia cells sensitive and resistant to doxorubicin. Cell Oncol 2014;37(6):421-8.
34. Broxterman HJ, Gotink KJ, Verheul HM. Understanding the causes of multidrug resistance in
cancer: a comparison of doxorubicin and sunitinib. Drug Resist Updat 2009;12(4-5):114-26.
35. Rudalska R, Dauch D, Longerich T et al. In vivo RNAi screening identifies a mechanism of
sorafenib resistance in liver cancer. Nat Med 2014;20(10):1138-46.
36. Hung MH, Tai WT, Shiau CW, Chen KF. Downregulation of signal transducer and activator of
transcription 3 by sorafenib: a novel mechanism for hepatocellular carcinoma therapy. World
J Gastroenterol 2014;20(41):15269-74.
37. Hutson TE, Escudier B, Esteban E et al. Randomized phase III trial of temsirolimus versus
sorafenib as second-line therapy after sunitinib in patients with metastatic renal cell
carcinoma. J Clin Oncol 2014;32(8):760-7.
38. Motzer RJ, Escudier B, Oudard S et al. Efficacy of everolimus in advanced renal cell
carcinoma: a double-blind, randomised, placebo-controlled phase III trial. Lancet 2008;372
(9637):449-56.
39. Netherlands Working Group on Immunotherapy of Oncology. Rotating Pazopanib and
Everolimus to Avoid Resistance (ROPETAR). In: ClinicalTrials.gov [Internet]. Bethesda (MD):
National Library of Medicine (US). 2000 [cited 2014 May 31]. Available from: http://
clinicaltrials.gov/show/NCT01408004 NLM Identifier: NCT01408004


Chapter 6
Evaluation of a tyrosine kinase peptide
microarray for TKI therapy selection in
cancer
Mariette Labots, Kristy J. Gotink, Henk Dekker, Kaamar Azijli,
Johannes C. van der Mijn, Charlotte M. Huijts, Sander R.
Piersma, Connie R. Jiménez, Henk M.W. Verheul
Submitted

Chapter 6
104
Abstract
Personalized cancer medicine aims for accurate response prediction in individual
patients to targeted therapies, including tyrosine kinase inhibitors (TKIs). Clinical
implementation of this concept requires a robust selection tool. Here, we evaluated a
high-throughput tyrosine kinase peptide substrate array to determine its readiness as
potential selection tool for TKI therapy using cancer cell lines and tumor tissue from
patients. We found linearly increasing phosphorylation signal intensities of peptides
representing kinase activity along the kinetic curve of the assay with 7.5-10 µg lysate
protein and up to 400 µM ATP. Basal kinase activity profiles were reproducible with
intra- and inter-experiment CV’s <15% and <20%, respectively. Evaluation of 14
tumor cell lines and tissues showed similar consistently (high) phosphorylated
peptides in their basal profiles. Incubation of 4 patient-derived tumor lysates with the
TKIs dasatinib, sunitinib, sorafenib and erlotinib mainly caused inhibition of
substrates which were highly phosphorylated in the basal profile analyses. Using
recombinant Src and Axl kinase, relative substrate specificity was demonstrated for a
subset of peptides; their phosphorylation was reverted by co-incubation with a
specific inhibitor. In conclusion, we showed high-throughput usability and robust
technical specifications of this tyrosine kinase peptide microarray. While specific
phosphorylations for recombinant kinases were shown, the currently available
peptide substrates can benefit from an enhancement of the differential potential for
complex biological samples such as tumor lysates. We propose that mass
spectrometry-based phosphoproteomics may provide such an enhancement by
identifying more discriminative peptides to enable clinical validation of this assay.

Tyrosine kinase peptide microarray for TKI therapy selection
105
6
Introduction
Tyrosine kinases are key regulators of normal cellular processes including
differentiation, proliferation, migration and apoptosis.1,2 Although only 1% of the
phosphoproteome is a result of tyrosine phosphorylation, nearly half of the 90
tyrosine kinases encoded in the human genome have been implicated in cancer,
emphasizing their role in this disease.3,4 When mutated or overexpressed, receptor
tyrosine kinases may become oncoproteins, causing and promoting tumor growth by
aberrant tyrosine signaling.5 Since the introduction of imatinib in 2003, nearly 20
tyrosine kinase inhibitors (TKIs) interfering with these proteins have reached clinical
approval, while more than 40 targeted therapies have been approved for the
treatment of patients with advanced solid and hematological tumors.6
(http://www.fda.gov/drugs/informationondrugs/approveddrugs/ucm279174.htm).
Apart from EGFR mutation status, ALK and ROS1 rearrangement and BCR-ABL1 gene
sequence, there are no clinically available tests indicative of response to TKIs.7-10
Considering the aberrant signaling activities in tumors, it is hypothesized that kinase
activity profiling could be a valuable clinical tool to select TKI treatment for patients
with advanced cancer, thereby enhancing efficacy of available drugs and expanding
the therapeutic arsenal. Such therapy selection tools should be a robust screening
method with a short turnaround time to evaluate available drugs or drug
combinations based on tumor biology from an individual patient. We hypothesize
that determination of kinase activity in a tumor biopsy may be used in such a
screening method.
The PamChip microarray contains 144 tyrosine kinase peptide substrates
representing key signal transduction pathways (PamGene, Den Bosch, The
Netherlands). Consisting of a porous membrane through which a tumor tissue or cell
line lysate is being repeatedly transported by a miniature pumping system, this chip –
here further referred to as protein tyrosine kinase (PTK) microarray – enables ‘kinetic’
measurement of phosphorylation changes over time. Spot intensities on the arrays
are derived by the binding of a fluorescently labelled anti-phosphotyrosine antibody
to the peptide substrates that become phosphorylated by kinases present in the
sample.11-13 Meanwhile, in several papers its potential for target identification in
clinical samples has been discussed14,15 while others have suggested PTK microarray
application for the identification of responders versus non-responders.16-18 Here, we
have evaluated the PTK microarray for the measurement of kinase activity in cancer
cell lines and patient derived tumor tissues under various experimental conditions, to
determine optimal test conditions and to evaluate its potential for clinical
implementation.

Chapter 6
106
Materials and methods
Cell culture and lysis
The cancer cell lines 786-O (renal cell cancer), HCT116 (colorectal cancer), H460 (non-
small cell lung cancer) were cultured according to standard methods. Cells were lysed
with M-PER Mammalian Protein Extraction Reagent (M-PER; Thermo Scientific),
unless stated otherwise, according to methods described elsewhere.19
Tumor tissue collection and lysis
Frozen archival primary resection and metastasectomy specimens and liver
metastasis needle biopsies were obtained from patients with several tumor types,
including melanoma, breast, colorectal and lung cancer according to the ethical
guideline of the VU University Medical Center, The Netherlands. Additionally, tissue
from a previously harvested murine MDA-MB-231 breast cancer xenograft model and
from a chicken embryo chorio-allantoic membrane (CAM) model using colorectal
cancer cell line HT-29 were obtained.
Tyrosine kinase activity profiling
Tyrosine kinase peptide microarray (PamGene International, 's-Hertogenbosch, The
Netherlands) experiments were performed utilizing a PamStation®12 instrument as
described elsewhere.11 During microarray incubation the sample mix, which includes
adenosine triphosphate (ATP), fluorescein-labeled anti-phosphotyrosine antibody
PY20 and (lysate) protein, is repeatedly transferred through the array, while
fluorescence intensities resulting from binding of the antibody are monitored during
the enzymatic reaction. Bionavigator software version 5.1 (PamGene International)
was used for image and data analysis.
Supplementary materials and methods
The supplementary materials and methods provide additional information on
experimental conditions and data analysis .
Results
Conditions influencing basal profile signal intensity
Protein and ATP concentration
To determine the amount of protein, reflecting kinase abundance, and ATP needed
for optimal basal profile signal intensities, arrays were incubated with increasing pro-
tein and ATP concentrations using HCT116 cancer cell line or MDA-MB-231 xenograft
tissue lysate. Increasing protein concentrations resulted in accordingly elevation of

Tyrosine kinase peptide microarray for TKI therapy selection
107
6
the signal intensity for both lysates, reaching optimal signal intensity at 10 µg and 7.5
µg protein input per array, respectively (Fig. 1a). The signal dropped slightly when
more protein was added, probably due to clogging of the array membrane. For the
xenograft lysate, ATP concentrations up to 400 μM strongly increased signal
intensities, while higher concentrations yielded similar signal intensities (Fig. 1b).
Background reduction
Prior to sample loading, a blocking step is performed to saturate excess and non-
specific peptide-binding sites, thereby reducing background signal which may hamper
microarray spot delimitation accuracy. We tested four membrane blocking buffers of
which Rockland resulted in comparable acceptable backgrounds compared to BSA 2%
(Supplementary Results).
Lysis buffer efficiency
To determine whether signal intensity may be influenced by the type of buffer used
for lysis, Mammalian Protein Extraction Reagent (M-PER), Tissue Protein Extraction
Reagent (T-PER) and Radioimmunoprecipitation assay buffer (RIPA) were evaluated.
As concluded from the signal intensities, M-PER resulted in more efficient tumor cell
lysis when compared to T-PER and RIPA (M-PER vs T-PER: P<0.001 for HCT116, P =
0.81 for 786-O; M-PER vs RIPA: P<0.0001 both cell lines, Fig. 1c) while protein yield
was equal (data not shown). When applied to colorectal cancer tissue, no significant
differences were found between M-PER and T-PER buffers (Supplementary results).
Since time may also be a critical factor to conserve kinase activity during the actual
lysis procedure of tumor cells,20 we compared trypsin-based lysis to the
recommended method of cell-scraping on ice. Significant differences in terms of
signal intensity were observed between trypsinized and scraped cells: trypsin
resulted in a 3 to 4-fold increased signal intensity when compared to scraping (Fig.
1d). It is not clear whether this is indeed a result of enhanced lysis efficacy, as
activation of stress kinases may play a role as well. Both incubation with 2 µM
sunitinib prior to trypsin-based lysis and ex-vivo spiking of the same concentration in
a scraping-based lysate of cell line 786-O resulted in ~25% decrease of average signal
intensity compared to the control sample (Fig. 1d).
Assay temperature and freeze-thawing effects
Within a cell, kinase activities are counterbalanced by the enzymatic activity of
phosphatases which are active at 37°C. As phosphatase activity may decrease signal
intensity, the addition of phosphatase inhibitors as well as lysate incubation on the
microarray are recommended at 30°C similar to other kinase assays to prevent both
this activity as well as loss of kinase activity by increased evaporation of the lysate.
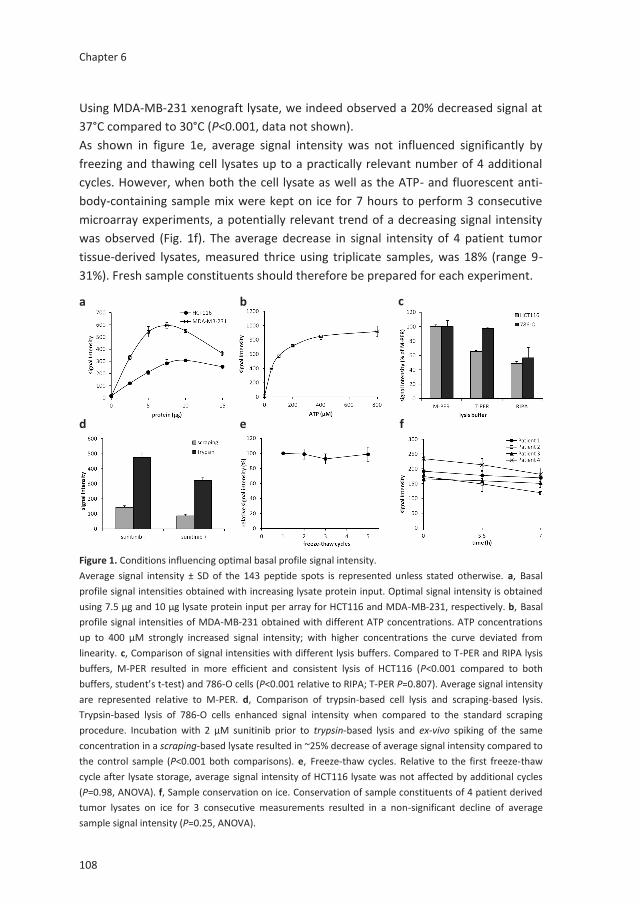
Chapter 6
108
Figure 1. Conditions influencing optimal basal profile signal intensity.
Average signal intensity ± SD of the 143 peptide spots is represented unless stated otherwise. a, Basal
profile signal intensities obtained with increasing lysate protein input. Optimal signal intensity is obtained
using 7.5 µg and 10 µg lysate protein input per array for HCT116 and MDA-MB-231, respectively. b, Basal
profile signal intensities of MDA-MB-231 obtained with different ATP concentrations. ATP concentrations
up to 400 μM strongly increased signal intensity; with higher concentrations the curve deviated from
linearity. c, Comparison of signal intensities with different lysis buffers. Compared to T-PER and RIPA lysis
buffers, M-PER resulted in more efficient and consistent lysis of HCT116 (P<0.001 compared to both
buffers, student’s t-test) and 786-O cells (P<0.001 relative to RIPA; T-PER P=0.807). Average signal intensity
are represented relative to M-PER. d, Comparison of trypsin-based cell lysis and scraping-based lysis.
Trypsin-based lysis of 786-O cells enhanced signal intensity when compared to the standard scraping
procedure. Incubation with 2 µM sunitinib prior to trypsin-based lysis and ex-vivo spiking of the same
concentration in a scraping-based lysate resulted in ~25% decrease of average signal intensity compared to
the control sample (P<0.001 both comparisons). e, Freeze-thaw cycles. Relative to the first freeze-thaw
cycle after lysate storage, average signal intensity of HCT116 lysate was not affected by additional cycles
(P=0.98, ANOVA). f, Sample conservation on ice. Conservation of sample constituents of 4 patient derived
tumor lysates on ice for 3 consecutive measurements resulted in a non-significant decline of average
sample signal intensity (P=0.25, ANOVA).
b c
d
a
e f
Using MDA-MB-231 xenograft lysate, we indeed observed a 20% decreased signal at
37°C compared to 30°C (P<0.001, data not shown).
As shown in figure 1e, average signal intensity was not influenced significantly by
freezing and thawing cell lysates up to a practically relevant number of 4 additional
cycles. However, when both the cell lysate as well as the ATP- and fluorescent anti-
body-containing sample mix were kept on ice for 7 hours to perform 3 consecutive
microarray experiments, a potentially relevant trend of a decreasing signal intensity
was observed (Fig. 1f). The average decrease in signal intensity of 4 patient tumor
tissue-derived lysates, measured thrice using triplicate samples, was 18% (range 9-
31%). Fresh sample constituents should therefore be prepared for each experiment.

Tyrosine kinase peptide microarray for TKI therapy selection
109
6
Substrate specificity
Kinases can phosphorylate multiple peptide substrates, although the number of
phosphorylation substrates may differ substantially per kinase.21 As peptide
phosphorylation intensity on the PTK microarray represents the cumulative activity of
multiple kinases, we studied substrate specificity by incubating separate arrays with
the recombinant kinases Src and Axl (Fig. 2a). While some peptides were
(predominantly) phosphorylated by either Src (e.g., spots on row 3 - column 11 and 5
-6, corresponding to substrates EPHA1_774_786 (site Y781) and FES_706-718 (Y713),
respectively) or Axl (9-11 and 10-5 corresponding to RAF1_332_344 (Y340, 341) and
RON_1346_1358 (Y1353), respectively), while most were phosphorylated by both (3-
1, 3-10). Putative upstream kinases for the respective 4 substrates are unknown, FES,
Src and RON/MET respectively (http://www.phosphosite.org/
siteSearchAction.do).22,23 A correlation plot also showed substrate preference by
these two kinases (R2 = 0.29, Fig. 2b), but otherwise clearly demonstrated the
promiscuous nature of phosphorylation for the majority of the peptide substrates in
this assay.
Figure 2. Recombinant Src
and Axl kinase substrate
specificity.
Microarrays were incu-
bated with 125 ng/ml of
recombinant Src or 500
ng/ml Axl kinase. a, Raw
images of array spot
phosphorylation after 1h
demonstrate significant
overlap in peptide
phosphorylation. Some
peptides are predo-
minantly phosphorylated
by either Src (e.g., spots
on row 3-column 11 and 5-
6) or Axl (e.g., spots 9-11
and 10-5). b, Correlation
plot of 143 peptide signal
intensities showing rela-
tive substrate preference
for Src and Axl kinase
indicated by the dotted
and solid circle, respec-
tively.
b
a
Chapter 6
110
Profile reproducibility
We determined intra-experimental technical reproducibility using HCT116 lysate
replicates on 3 chips, comprising 12 arrays. Intra-chip and inter-chip correlations
between peptide phosphorylation levels as assessed by Pearson’s correlations (r)
ranged from 0.9954 to 0.9993. As an example, a regression analysis of two replicates
shows that they differed 0.87% from each other as revealed by the linearity equation
with a coefficient of determination (r2) of 0.9949 (Fig. 3a). High technical
reproducibility of the microarray was further demonstrated by the obtained total
median coefficient of variation (CV) of <15% (Fig. 3b), while this was <20% between
experiments using MDA-MB-231 xenograft lysate (data not shown). The median CV
for well-expressed signals is much lower, namely 7% for peptides with signal intensity
of ≥ 200 in aforementioned experiment, but these represented only 35% of available
substrates (Fig. 3b).
To determine reproducibility of biological replicates, 786-O cells were lysed on three
different time points. A correlation plot of 3 independent measurements yielded r2
values of 0.9942 and 0.9934 respectively while the median CV was <20% (Fig. 3c and
3d).
Differences between samples of different biological origin
To investigate whether PTK microarray analysis can differentiate between samples of
different biological origin based on the presence of sample-specific profiles, we first
measured 4 tumor tissues, 2 from patients with metastatic non-small cell lung cancer
(NSCLC; pt1 harboring KRAS exon 1 mutation, pt2 EGFR exon 20 mutation) and 2 with
primary breast cancer (pt2 HER2 amplification). The kinase activity profiles of these
tumors were largely similar as determined from the presence and absence of
phosphorylation of similar peptides (Suppl. Fig. 1; top-65 peptides). Additionally, 10
samples including cancer cell lines, xenograft and patient derived tumor tissues were
compared. A heatmap of obtained basal profiles demonstrated phosphorylation of
similar peptides across the samples with modest variability of signal intensity, but no
apparent ‘on-off’ differences in terms of peptide phosphorylation (Fig. 4a). These
inter-sample profile similarities are even more notable when the absolute signal
intensities are represented in a ‘landscape view’ (Fig. 4b). Moreover, these analyses
revealed that in these samples approximately 2/3 of available peptide substrates are
being phosphorylated. The top 15 peptide substrates with highest phosphorylation
intensity included ENOG, CD79A, EFS, SRC8, PLCG1, FRK, PAXI, CDK2, FES and RET in
both data sets. These substrates were shown to be highly phosphorylated in other
datasets as well.11,24,25

Tyrosine kinase peptide microarray for TKI therapy selection
111
6
Inhibition profiles
’Off-‘ versus ‘on-chip’ TKI treatment
Results of tumor tissue or cancer cell line inhibition profiles using several protein
kinase inhibitors have previously been published.11,18,25,26 To compare drug incubation
of cancer cells in vitro (‘off-chip treatment’) with ‘on-chip’ spiking of the
corresponding control lysate, we incubated HCT116 cells prior to lysis for 1 hour with
DMSO control or 2 µM sunitinib, a concentration shown to inhibit phosphorylation of
Figure 3. Microarray reproducibility and linearity.
Inter-chip and intra-chip correlations between peptide phosphorylation levels as assessed by
Pearson’s correlations (r) using 12 technical replicates of HCT116 lysate (7.5 µg) measured on 3 chips
in a single run. a, Linearity plot of 2 representative technical replicates. b, CV plot of the technical
replicas shown in 3a. Threshold was set at 15% as recommended by the microarray manufacturer. c,
Linearity plot of biological replicates of 786-O cells in 3 independent experiments. d, CV plot of the
biological replicas shown in 3c. Threshold at CV15%.
CV, coefficient of variation as determined by the ratio of the standard deviation to the mean signal
intensity.
c
b
d
a

Chapter 6
112
b
a

Tyrosine kinase peptide microarray for TKI therapy selection
113
6
key downstream signaling proteins.27 For subsequent PTK microarray analysis, lysates
from control and sunitinib incubated cells were spiked with DMSO control (SUN -/-,
SUN +/- respectively) or 2 µM sunitinib (SUN -/+, SUN +/+). Although inhibition
patterns were similar, inhibition of phosphorylation was more pronounced in
sunitinib-incubated (SUN +/-) versus spiked (SUN -/+) samples (Fig. 5a). This can be
explained by high uptake of sunitinib in cancer cells within one hour,27 which may
contribute to prolonged inhibition ‘on chip’ by sunitinib present in the lysate, in
absence of ‘spiked’ sunitinib. This should be taken into account in future drug screens
using this array.
Competition with ATP
The majority of TKIs compete, directly or indirectly, with ATP binding.28,29 These
inhibitors include the clinically approved multitargeted TKIs sunitinib, sorafenib and
dasatinib. As shown above, the addition of ATP increases signal intensity of peptides
spotted on the PTK microarrays. We spiked HCT116 lysate with a fixed concentration
Figure 4. Basal profile comparison
of 10 tumor-related samples.
Samples were measured using
triplicate samples of 7.5 µg lysate
protein per array. a, Heatmap of
log2-transformed normalized signal
intensities of the top-65
phosphorylated peptides in 10
different tumor cell or tissue-
derived samples, sorted from high
(red) to low signal intensity (blue).
b, ‘Phosphorylation landscape’
indicating marginal absolute signal
intensity differences between the
tumor tissues (colorectal cancer,
HCC, melanoma, lung cancer,
pNET, MDA-MB-231 human breast
cancer xenograft, HT-29 CAM
model) and cell lines (HT-29
colorectal cancer, NIH/3T3 mouse
fibroblast, 786-O renal cell cancer).
HCC, hepatocellular carcinoma,
pNET, pancreatic neuroendocrine
tumor CAM, chick choreoallantoic
membrane.
b

Chapter 6
114
of sunitinib (4 µM), sorafenib (25 µM) or dasatinib (10 nM) and investigated whether
increasing ATP concentrations could partially neutralize their inhibitory effect. While
inhibition of phosphorylation was observed by a mean of 66 % for all peptide
substrates at 100 µM ATP for sunitinib, 65% for sorafenib and 85% for dasatinib,
increasing ATP concentrations induced signal intensity and attenuated the inhibitory
effects of sunitinib and sorafenib (Fig. 5b). For dasatinib a smaller increase in signal
intensity was observed, suggesting partial ATP-independent inhibition of kinase
activity by additional allosteric binding of the target kinase. While allosteric binding
sites may be obscure, their presence has been suggested previously for dasatinib.30,31
This, as well as its high-affinity for off-targets, may also explain the circa 1000-fold
lower concentration of dasatinib needed for inhibition.
Specificity of phosphorylation inhibition
The peptide substrates on the array can be phosphorylated by multiple kinases
present in the lysate, while the relative contribution of these kinases to the signal
intensity of a given peptide substrate is not known. Above we showed kinase-specific
activity of Src and Axl-kinase; here we studied the potency and specificity of their
inhibitors. We incubated separate microarrays with 125 ng/ml recombinant Src- and
500 ng/ml Axl-kinase +/- Src-inhibitor dasatinib (85 nM) and Axl-inhibitor R428 (2
µM), respectively. Both drugs caused (near-)complete inhibition of phosphorylation
of the Src- and Axl-phosphorylated peptides (Fig. 5c and 5d). In addition, we studied
potential substrate-specific inhibition in tumor lysates. We assessed phosphorylation
of the 7 EGFR-substrates on the PTK microarray, revealing consistent phosphorylation
of 3 substrates (EGFR_1103_1115, 1165_1177, 1190_1202) in all replicates for the
tumor lysates from the 4 patients reported above while EGFR_908_920 was not
phosphorylated in any of the lysates, nor in previously discussed experiments (data
not shown). For the 3 remaining substrates, we did not observe specific inhibition
upon spiking with 20 µM of the EGFR-specific inhibitor erlotinib. For aforementioned
EGFR_1103_1115, significant inhibition of this substrate was observed using dasatinib
(85 nM), sunitinib (4 µM) and erlotinib in 4/4 and using sorafenib (25 µM) in 2/4
patients, indicating that this peptide is phosphorylated by kinases other than EGFR.
Incubation with recombinant Src and to a lesser extent with Axl kinase indeed caused
phosphorylation of this substrate, while dasatinib and RF428 respectively resulted in
complete inhibition of activity (data not shown). Its phosphorylation site Y1110 is
known to be an EGFR autophosphorylation site (http://www.phosphosite.org/
siteSearchAction.do) and has been previously shown to be inhibited by similar
dasatinib concentrations.32

Tyrosine kinase peptide microarray for TKI therapy selection
115
6
TKI treatment selection
As a therapy selection pilot, we compared phosphorylation inhibition by five TKIs,
including two concentrations of lapatinib and sorafenib, in tumor tissue lysates of
four patients. As there are no algorithms available to evaluate inhibition profiles for
potential efficacy ‘in vivo’ and activated pathways cannot be inferred from basal
microarray profiles, the inhibition potency for a given drug may be assessed by the
Figure 5. Inhibition of kinase activity.
a, TKI incubation versus spiking. Prior to lysis, HCT116 cells were incubated in vitro ± sunitinib 2 µM;
subsequent lysates were spiked ± sunitinib 2 µM (drug incubation | drug spiking). Signal intensity of
the top-15 substrates is represented from high to low. Although inhibition patterns are similar,
inhibition potency is increased for sunitinib-incubated versus spiked samples, while additional
spiking of previously incubated samples does not increase the degree of inhibition. b, Competition
with ATP. HCT116 lysate was spiked with 4 µM sunitinib, 25 µM sorafenib or 10 nM dasatinib in
presence of increasing ATP concentrations. Despite average phosphorylation inhibition of 65-85 % at
100 µM ATP, increasing ATP concentrations induced signal intensity and attenuated the inhibitory
effects of sunitinib and sorafenib. With dasatinib signal intensity increased to a lesser extent,
suggesting partial ATP-independent inhibition of kinase activity. c, and d, Substrate-specific
inhibition. Microarrays were incubated with 125 ng/ml recombinant Src or 500 ng/ml Axl kinase ± 85
nM Src-inhibitor dasatinib or 2 µM Axl-inhibitor R428, respectively. Both drugs resulted in (near-)
complete inhibition of phosphorylation; results of the top-25 phosphorylated substrates are shown.
d
a b
c

Chapter 6
116
number of significantly inhibited peptides as well as their inhibition/control ratios.
Additionally, the presence of a ‘drug response’ relationship may indicate sensitivity as
well. The inhibition ratios in figure 6a suggests that inhibition occurred in similar
peptide substrates and to the same extent. Dasatinib had highest inhibition potency,
followed by sunitinib and sorafenib 25 µM, while no inhibition for lapatinib and a
clear dose-response relation for sorafenib was observed. Figure 6b further
exemplifies that the inhibition potency of these drugs varies, rather than that
differential inhibition of highest intensity substrates is observed.
Discussion
In this study, we evaluated kinase activity profiling of cancer cell lines and (patient-
derived) tumor tissue using a commercially available array (PamChip) consisting of
144 tyrosine kinase peptide substrates, aiming to evaluate its performance under
several experimental conditions for future TKI therapy selection in patients with
cancer. We determined linearity and reproducibility as well as optimal lysis and
experimental running conditions. As ‘positive control’ for readout of kinase activity,
we demonstrated phosphorylation activity of recombinant Axl and Src kinase which
could be reverted by co-inhibition with a specific inhibitor. Ideally, when aiming to
predict TKI-sensitivity in individual patients, peptide phosphorylation on chip should
be exclusively related to a single kinase and/or pathway, such that inhibition may be
directly related to clinical sensitivity.13 The currently included peptide substrates can
be phosphorylated by multiple kinases present in the lysate, while the relative
contribution of these kinases to the signal intensity of a given peptide substrate is not
known. This promiscuity may be enhanced in vitro by insufficient specificity of the
kinases for the applied short peptides containing the tyrosine residue in this assay,
since both the amino acid sequence context of the phosphorylation site as well as the
three-dimensional structure of the substrate protein are known contributing factors
to this specificity.33,34 Furthermore, cellular compartmentalization has been lost in
lysates. Therefore, ‘hyper-reproducible’ phosphorylation of several (Src-) substrates
including ENOG, CD79A, EFS and SRC8 as shown in several of our experiments (Fig.
4a, 6a, Suppl. Fig 1) may be the result of low kinase specificity for these substrates
rather than a mere reflection of higher abundant upstream kinases.35 Together, these
factors increase the complexity to properly analyze and compare biological samples,
which is illustrated by the apparent absence of sample specific basal profiles of
cancer cells and tissues (Fig. 4a, Suppl. Fig 1). The observed profile similarities
between samples may be resulting from ‘household’ kinase activity essential for
proliferation and survival, while differential kinases contributing to cell- or patient-
specific biologic behavior may be low(er) abundant and therefore not reproducibly

Tyrosine kinase peptide microarray for TKI therapy selection
117
6
detected using this array. The above is equally relevant for the evaluation of specific
inhibitory drug profiles. As shown in Fig. 5a and 6a, inhibition is most prominent in
peptides shown to be highly phosphorylated in basal profile experiments, while the
(off-) target affinity of the applied TKIs, rather than their supposed differential
targets, seems to define the inhibition profiles obtained with this assay.
The application of the PTK microarray for kinase substrate optimization in drug
development has been recently described,36,37 while another confirmed its potential
for diagnostic biomarker discovery. In this study, vemurafenib inhibition profiles of 10
BRAF mutant and 16 BRAF wildtype metastatic melanoma patient tissues resulted in
a mutation classification accuracy of 77% with a sensitivity (Se) of 90% and specificity
(Sp) of 75%. Predictive information could not be obtained since BRAF inhibitor
response data were not available.25 Folkvord et al. analyzed pre-treatment tumor
tissues in relation with pathological response (tumor regression grade, TRG) to
neoadjuvant chemotherapy followed by neoadjuvant chemoradiation in 66 patients
with locally advanced rectal cancer.17 An 86-peptide substrate-based classification
model indicating good vs poor response, constructed from 12 good- (TRG 1-2) and 7
poor-responders (TRG 4), performed with 95% accuracy, 100% Se and 86% Sp in
these patients. Classification accuracy in the remaining 37 good- and 10 intermediate
(TRG 3) responders was 85% for the good-responders with 86% Se, while 80% of
intermediate responders were predicted to have good response.17 These results are
promising and need further evaluation in an independent group of patients.
Moreover, clinical implementation may be favored by a high negative predictive
value to prevent toxicities in patients who are unlikely to benefit from treatment.
Thus far, clinically used predictive tests are available as single mutation or
amplification tests, but none of the available multiplex peptide assays to determine
tyrosine kinase activity have reached the required validated state as treatment
selection tool.38-41 Only prognostic or diagnostic In Vitro Diagnostic Multivariate Index
Assays (IVDMIA) have been cleared or approved by the US Food and Drug
Administration (FDA) for use in oncology, including Mammaprint (2007), OVA1 (2009)
and Prosigna (2013) (http://www.fda.gov/downloads/MedicalDevices/Device
RegulationandGuidance/GuidanceDocuments/ucm071455.pdf). OVA1, a test to
assess likelihood of malignancy in women presenting with an ovarian mass, was the
first FDA-cleared IVDMIA consisting of protein biomarkers.42 Besides appropriate
analytical test performance, critical factors to bring biomarker discovery to approved
clinical diagnostics include clearly defined intended use within a target population
andutilization of appropriate specimens in preliminary validation studies to obtain
sufficient evidence for well-designed validation studies at multiple clinical sites.42-44

Chapter 6
118
a

Tyrosine kinase peptide microarray for TKI therapy selection
119
6
In conclusion, specific activity of recombinant kinases can be adequately measured
on the PTK microarray. For its use with more complex samples containing multiple
kinases, the array peptides need further optimization for specificity. The array has
clear favorable features facilitating clinical implementation as TKI selection tool
including its reproducibility and short turnaround time as well as required protein
amounts as little as 5-7 µg per sample. An alternative method to obtain insight in
tumor kinase activity is provided by mass spectrometry (MS)-based
phosphoproteomics.45 This method provides information of 1000s of
phosphopeptides per sample, but in contrast requires sub- or low milligram-range
protein amounts,46 which is at the high end of the amount that can be obtained in
daily clinical practice from a tumor biopsy (Labots et al, Cancer Res 2015;75(15
Suppl):Abstract nr 2007). Taken together, we aim to enhance the differential
potential of the PTK array by using MS-based phosphoproteomics to select more
discriminative peptides and to enable clinical validation of this assay.
Acknowledgements
This work was financially supported by the AEGON Research Fellowship Program and
a research grant from Vitromics Healthcare Services, The Netherlands.
Figure 6. TKI inhibition profiles of four patient samples.
a, Heatmap of four patient-derived tumor lysates (two breast, two lung cancer) demonstrating inhi-
bition ratios (IR) of the top-80 peptides achieved with spiking of five TKIs. Peptides are sorted from
high inhibition ratio (dark blue) to low; green indicates absence of inhibition. b, Representative pa-
tient example of top-30 highest intensity substrates sorted from high to low based on control sam-
ple, with representation of absolute phosphorylation inhibition achieved by spiking of sorafenib,
erlotinib, sunitinib and dasatinib. Inhibition potency varies between the drugs while no differential
inhibition of individual peptides is observed.
0
500
1000
1500
2000
2500si
gn
al i
nte
nsi
ty
peptide substrates
Control
Erlotinib
Sunitinib
Sorafenib
Dasatinib
b

Chapter 6
120
References
1. Schlessinger J. Cell signaling by receptor tyrosine kinases. Cell 2000;103(2):211-25.
2. Manning G, Whyte DB, Martinez R, Hunter T, Sudarsanam S. The protein kinase complement
of the human genome. Science 2002;298(5600):1912-34.
3. Gotink KJ, Verheul HM. Anti-angiogenic tyrosine kinase inhibitors: what is their mechanism of
action? Angiogenesis 2010;13(1):1-14.
4. Ptacek J, Snyder M. Charging it up: global analysis of protein phosphorylation. Trends Genet
2006;22(10):545-54.
5. Blume-Jensen P, Hunter T. Oncogenic kinase signalling. Nature 2001;411(6835):355-65.
6. Keefe DM, Bateman EH. Tumor control versus adverse events with targeted anticancer
therapies. Nat Rev Clin Oncol 2012;9(2):98-109.
7. Mazieres J, Zalcman G, Crino L et al. Crizotinib therapy for advanced lung adenocarcinoma
and a ROS1 rearrangement: results from the EUROS1 cohort. J Clin Oncol 2015;33(9):992-9.
8. Kwak EL, Bang YJ, Camidge DR et al. Anaplastic lymphoma kinase inhibition in non-small-cell
lung cancer. N Engl J Med 2010;363(18):1693-1703.
9. Tsao MS, Sakurada A, Cutz JC et al. Erlotinib in lung cancer - molecular and clinical predictors
of outcome. N Engl J Med 2005;353(2):133-44.
10. Druker BJ, Talpaz M, Resta DJ et al. Efficacy and safety of a specific inhibitor of the BCR-ABL
tyrosine kinase in chronic myeloid leukemia. N Engl J Med 2001;344(14):1031-7.
11. Giovannetti E, Labots M, Dekker H et al. Molecular mechanisms and modulation of key
pathways underlying the synergistic interaction of sorafenib with erlotinib in non-small-cell-
lung cancer (NSCLC) cells. Curr Pharm Des 2013;19(5):927-39.
12. Hilhorst R, Houkes L, Mommersteeg M, Musch J, van den Berg A, Ruijtenbeek R. Peptide
microarrays for profiling of serine/threonine kinase activity of recombinant kinases and
lysates of cells and tissue samples. Methods Mol Biol 2013;977:259-71.
13. Piersma SR, Labots M, Verheul HM, Jimenez CR. Strategies for kinome profiling in cancer and
potential clinical applications: chemical proteomics and array-based methods. Anal Bioanal
Chem 2010;397(8):3163-71.
14. ter Elst A, Diks SH, Kampen KR et al. Identification of new possible targets for leukemia
treatment by kinase activity profiling. Leuk Lymphoma 2011;52(1):122-30.
15. Sikkema AH, Diks SH, den Dunnen WF et al. Kinome profiling in pediatric brain tumors as a
new approach for target discovery. Cancer Res 2009;69(14):5987-95.
16. Saelen MG, Flatmark K, Folkvord S et al. Tumor kinase activity in locally advanced rectal
cancer: angiogenic signaling and early systemic dissemination. Angiogenesis 2011;14(4):481-9.
17. Folkvord S, Flatmark K, Dueland S et al. Prediction of response to preoperative
chemoradiotherapy in rectal cancer by multiplex kinase activity profiling. Int J Radiat Oncol
Biol Phys 2010;78(2):555-62.

Tyrosine kinase peptide microarray for TKI therapy selection
121
6
18. Versele M, Talloen W, Rockx C et al. Response prediction to a multitargeted kinase inhibitor
in cancer cell lines and xenograft tumors using high-content tyrosine peptide arrays with a
kinetic readout. Mol Cancer Ther 2009;8(7):1846-55.
19. Gotink KJ, Rovithi M, de Haas RR et al. Cross-resistance to clinically used tyrosine kinase
inhibitors sunitinib, sorafenib and pazopanib. Cell Oncol 2015;38(2):119-29.
20. Jones RJ, Boyce T, Fennell M et al. The impact of delay in cryo-fixation on biomarkers of Src
tyrosine kinase activity in human breast and bladder cancers. Cancer Chemother Pharmacol
2008;61(1):23-32.
21. Ubersax JA, Ferrell JE Jr. Mechanisms of specificity in protein phosphorylation. Nat Rev Mol
Cell Biol 2007;8(7):530-41.
22. Follenzi A, Bakovic S, Gual P, Stella MC, Longati P, Comoglio PM. Cross-talk between the
proto-oncogenes Met and Ron. Oncogene 2000;19(27):3041-9.
23. Mason CS, Springer CJ, Cooper RG, Superti-Furga G, Marshall CJ, Marais R. Serine and
tyrosine phosphorylations cooperate in Raf-1, but not B-Raf activation. EMBO J 1999;18
(8):2137-48.
24. Maat W, van der Slik AR, Verhoeven DH et al. Evidence for natural killer cell-mediated
protection from metastasis formation in uveal melanoma patients. Invest Ophthalmol Vis Sci
2009;50(6):2888-95.
25. Tahiri A, Roe K, Ree AH et al. Differential inhibition of ex-vivo tumor kinase activity by
vemurafenib in BRAF(V600E) and BRAF wild-type metastatic malignant melanoma. PLoS One
2013;8(8):e72692.
26. Kawada I, Hasina R, Arif Q et al. Dramatic antitumor effects of the dual MET/RON small-
molecule inhibitor LY2801653 in non-small cell lung cancer. Cancer Res 2014;74(3):884-95.
27. Gotink KJ, Broxterman HJ, Labots M et al. Lysosomal sequestration of sunitinib: a novel
mechanism of drug resistance. Clin Cancer Res 2011;17(23):7337-46.
28. Zhang J, Yang PL, Gray NS. Targeting cancer with small molecule kinase inhibitors. Nat Rev
Cancer 2009;9(1):28-39.
29. Norman RA, Toader D, Ferguson AD. Structural approaches to obtain kinase selectivity.
Trends Pharmacol Sci 2012;33(5):273-8.
30. Shan Y, Kim ET, Eastwood MP, Dror RO, Seeliger MA, Shaw DE. How does a drug molecule
find its target binding site? J Am Chem Soc 2011;133(24):9181-3.
31. Karaman MW, Herrgard S, Treiber DK et al. A quantitative analysis of kinase inhibitor
selectivity. Nat Biotechnol 2008;26(1):127-32.
32. Li J, Rix U, Fang B et al. A chemical and phosphoproteomic characterization of dasatinib
action in lung cancer. Nat Chem Biol 2010;6(4):291-9.
33. Amanchy R, Periaswamy B, Mathivanan S, Reddy R, Tattikota SG, Pandey A. A curated
compendium of phosphorylation motifs. Nat Biotechnol 2007;25(3):285-6.
34. Beltran L, Casado P, Rodriguez-Prados JC, Cutillas PR. Global profiling of protein kinase
activities in cancer cells by mass spectrometry. J Proteomics 2012;77:492-503.

Chapter 6
122
35. Zhou Q, Zhang XC, Chen ZH et al. Relative abundance of EGFR mutations predicts benefit
from gefitinib treatment for advanced non-small-cell lung cancer. J Clin Oncol 2011;29
(24):3316-21.
36. Sanz A, Ungureanu D, Pekkala T et al. Analysis of Jak2 catalytic function by peptide
microarrays: the role of the JH2 domain and V617F mutation. PLoS One 2011;6(4):e18522.
37. Sanz SA, Niranjan Y, Hammaren H et al. The JH2 domain and SH2-JH2 linker regulate JAK2
activity: A detailed kinetic analysis of wild type and V617F mutant kinase domains. Biochim
Biophys Acta 2014;1844(10):1835-41.
38. Nesterov A, Dorsam E, Cheng YC et al. Peptide arrays with a chip. Methods Mol Biol
2010;669:109-24.
39. Hayashi M, Fearns C, Eliceiri B, Yang Y, Lee JD. Big mitogen-activated protein kinase 1/
extracellular signal-regulated kinase 5 signaling pathway is essential for tumor-associated
angiogenesis. Cancer Res 2005;65(17):7699-706.
40. Thiele A, Zerweck J, Weiwad M, Fischer G, Schutkowski M. High-density peptide microarrays
for reliable identification of phosphorylation sites and upstream kinases. Methods Mol Biol
2009;570:203-219.
41. Thiele A, Zerweck J, Schutkowski M. Peptide arrays for enzyme profiling. Methods Mol Biol
2009;570:19-65.
42. Zhang Z, Chan DW. The road from discovery to clinical diagnostics: lessons learned from the
first FDA-cleared in vitro diagnostic multivariate index assay of proteomic biomarkers. Cancer
Epidemiol Biomarkers Prev 2010;19(12):2995-9.
43. Li D, Chan DW. Proteomic cancer biomarkers from discovery to approval: it's worth the
effort. Expert Rev Proteomics 2014;11(2):135-6.
44. Labots M, Schutte LM, van der Mijn JC, Pham TV, Jimenez CR, Verheul HM. Mass
spectrometry-based serum and plasma peptidome profiling for prediction of treatment
outcome in patients with solid malignancies. Oncologist 2014;19(10):1028-39.
45. Cutillas PR. Role of phosphoproteomics in the development of personalized cancer therapies.
Proteomics Clin Appl 2015;9(3-4):383-95.
46. Piersma SR, Knol JC, de Reus I et al. Feasibility of label-free phosphoproteomics and
application to base-line signaling of colorectal cancer cell lines. J Proteomics 2015;127(Pt
B):247-58.

Tyrosine kinase peptide microarray for TKI therapy selection
123
6
Supplementary data
Supplementary materials and methods
Cell culture and lysis
The cancer cell lines 786-O (renal cell cancer), HCT116 (colorectal cancer), H460 (non-
small cell lung cancer) were cultured in DMEM supplemented with (v/v) 5% fetal
bovine serum (FBS) and (v/v) 1% penicillin-streptomycin, and maintained in a
humidified incubator containing 5% CO2 at 37°C. The cell lines were tested for their
authenticity by short tandem repeats (STR) profiling DNA fingerprinting (Baseclear,
Leiden, The Netherlands).
Cells were seeded in 10 cm2 dishes and allowed to attach for 48h to obtain 70-80%
confluence. At T = 48 hrs, cells were lysed as described elsewhere Protein
concentrations were determined using Micro BCATM Protein Assay Kit (Thermo
Scientific). Cells were lysed with M-PER Mammalian Protein Extraction Reagent (M-
PER; Thermo Scientific) unless stated otherwise. Additional buffers were used in one
experiment: T-PER Tissue Protein Extraction Reagent (T-PER; Thermo Scientific), and
RIPA buffer (homemade; 30 mM Tris-HCl pH 7.48, 150 mM NaCl, and 1% NP-40).
Buffers were supplemented with 1% Protease Inhibitor Cocktail, EDTA-free and 1%
Halt Phosphatase Inhibitor Cocktail (both 100X, Thermo Scientific).
Tumor tissue collection and lysis
Frozen patient derived tumor tissues were obtained from archival primary resection
specimens (breast cancer, melanoma, colorectal cancer), metastasectomy tissue
(lung cancer) and a liver metastasis needle biopsy from a patient with a pancreatic
neuroendocrine tumor and a patient with lung cancer. Additionally, two previously
harvested and frozen tumors, one from a murine breast cancer xenograft model of
the MDA-MB-231 cancer cell line and one from a chicken embryo chorio-allantoic
membrane (CAM) experiment using colorectal cancer cell line HT-29, were obtained.
Approximately 10-20 cryosections (10 μm) per sample were prepared using a LKB-
Reichert-Jung ultra cryomicrotome (Leica, Rijswijk, The Netherlands) and transferred
to 1.5 ml Eppendorf vials while keeping samples frozen at -20°C in the cryotome.
Samples were snap-frozen in liquid nitrogen and stored at -80°C. Using M-PER and/or
T-PER as described in the results section, lysates were prepared as previously
reported.1,2
Tyrosine kinase activity profiling
Tyrosine kinase peptide microarray (PamGene International, 's-Hertogenbosch, The
Netherlands) experiments were performed as described before.1 In short, 40 µl
control sample mix for the kinase activity array was prepared by using reaction buffer

Chapter 6
124
containing 10x ABL buffer (Westburg, Leusden, The Netherlands), 10X BSA, 400 µM
adenosine triphosphate (ATP; Sigma-Aldrich) unless stated otherwise, fluorescein-
labeled antibody PY20 (Exalpha, Maynard, MA, USA), dithiotreitol (DTT) and 7.5 µg
(lysate) protein unless stated otherwise. For drug inhibition experiments,
concentrations of dimethyl sulfoxide (DMSO) were equalized to 2.5% between
inhibition and control samples. Applied TKI concentrations are based on IC50 values of
proliferation assays performed in cancer cell lines (data not shown).3 After blocking
the arrays with 2% BSA or other buffers as specified and subsequent loading of the
sample mix in triplicate onto the arrays, incubation (at 30 °C) was started for 60
cycles utilizing a PamStation®12 instrument during which the sample mix is
transferred through the array once per minute. Repeated fluorescent imaging was
performed with a 12-bit CCD camera, monitoring fluorescence intensities resulting
from binding of the anti-phosphotyrosine antibody in time.
Data analysis
Spot intensity at each time point was quantified (and corrected for local background),
and resulting time-resolved curves were fit to calculate the initial phosphorylation
rate (Vini) and Endlevels using specific kinetic algorithms and appropriate statistical
methods (Bionavigator software version 5.1, PamGene International, 's-
Hertogenbosch, The Netherlands). Unless otherwise stated, data are expressed as
average signal intensity ± SD of the 143 peptide spots based on end levels of the
phosphorylation curve using ≥ three technical replicates per sample. Significant
differences between two conditions were determined by two-sided Student’s t test
using Microsoft Excel, considering P < 0.05 as statistically significant. One-way ANOVA
comparisons were applied when comparing more than two conditions.
Supplementary results
Background reduction
Prior to sample loading on the array, a blocking step is performed to saturate excess
and non-specific peptide-binding sites, thereby reducing background signal which
may negatively influence spot delimitation accuracy during image analysis. Because
cross-reaction of detection reagents with blocking buffers may occur, we tested four
membrane blocking buffers including BSA 2% as advised by the microarray
manufacturer. While Bio-Rad (Veenendaal, The Netherlands) blocking buffer
provided the highest net signal relative to the background (11.4%, Supplementary
Table 1), its application resulted in an uneven, patchy background, probably by local
occlusion of the membrane. Odyssey buffer (Li-Cor, Lincoln, NE, USA) resulted in a
high net signal but also in a high background, potentially reducing spot finding
accuracy. Compared to BSA 2%, Rockland (Limerick, PA, USA) resulted in comparable

Tyrosine kinase peptide microarray for TKI therapy selection
125
6
background activity with a somewhat higher net signal relative to the background
(11.8 vs 9.3%). To investigate whether an optimal BSA concentration exists for the
blocking step, increasing BSA concentrations up to 5 µg/well were also applied, but
this neither attenuated nor increased the signal (data not shown). Clearly, incubation
with only marginal BSA amounts or without any caused a higher background due to
non-specific interaction (Supplementary Table 1).
Supplementary Table 1. Evaluation of membrane blocking buffers. Median phosphorylation signal
intensity and background intensity for the top-100 peptides obtained with 7.5 µg 786-O lysate
protein per sample after application of 2% BSA , Bio-Rad, Odyssey or Rockland blocking buffer. A
control sample without protein was used for subtraction of background signal intensity. For the
buffers, signal minus background is represented relative to results obtained with BSA 2%.
Lysis efficiency
For lysis of tumor tissue, we have compared the efficiency of the buffers M-PER and
T-PER: their difference in composition is not revealed by the company, but probably
lies in the detergent added in 25 mM bicine buffer (pH 7.6). From two colorectal
cancer tissues, four samples per tissue consisting of ten cryosections were cut (A1-4
and B1-4), which were alternatingly lysed using either T-PER or M-PER such that per
tumor 2 samples were lysed with each of aforementioned buffers. There were no
significant differences between obtained signal intensities using either buffer within
the same samples (data not shown), suggesting equal protein extraction efficiency for
M-PER as compared to T-PER when applied to tissue.
Sample Blocking
buffer
Median
signal
Median
background
Sg-bg vs
BSA 2%
Sg-bg/back-
ground (%)
Average
sg-bg
Water BSA 2% 1088 1093 NA -0,4 -5
Lysate BSA 2% 1244 1138 100 9,3 106
Lysate Bio-Rad 1256 1113 135 12,8 143
Lysate Odyssey 1809 1628 170 11,1 181
Lysate Rockland 1354 1211 135 11,8 143

Chapter 6
126
Supplementary Figure 1. Heatmap of basal kinase activity profiles of four patient tumor tissues
demonstrating log2-transformed normalized signal intensities of the top-65 peptides, sorted from
high (red) to low (blue) intensity. NSCLC 1, tumor tissue from patient with KRAS mutation, NSCLC 2,
from patient with EGFR mutation. BC 2, tumor tissue from patient with HER2 amplification.

Tyrosine kinase peptide microarray for TKI therapy selection
127
6
Supplementary references
1. Giovannetti E, Labots M, Dekker H et al. Molecular mechanisms and modulation of key
pathways underlying the synergistic interaction of sorafenib with erlotinib in non-small-cell-
lung cancer (NSCLC) cells. Curr Pharm Des 2013;19(5):927-39.
2. Hilhorst R, Houkes L, Mommersteeg M, Musch J, van den Berg A, Ruijtenbeek R. Peptide
microarrays for profiling of serine/threonine kinase activity of recombinant kinases and
lysates of cells and tissue samples. Methods Mol Biol 2013;977:259-71.
3. Gotink KJ, Rovithi M, de Haas RR et al. Cross-resistance to clinically used tyrosine kinase
inhibitors sunitinib, sorafenib and pazopanib. Cell Oncol 2015;38(2):119-29.


Chapter 7
Summarizing discussion and
future perspectives

Chapter 7
130
One of the major clinical problems with antiangiogenic tyrosine kinase inhibitors
(TKIs), including sunitinib, for the treatment of patients with metastatic renal cell
cancer (RCC) is their intrinsic and acquired drug resistance. On the basis of preclinical
studies, the upregulation of vascular endothelial growth factor (VEGF) production as
well as other compensatory cytokines and growth factors such as HGF/cMET, IL-8,
PlGF, SDF-1, or erythropoietin and epithelial-to mesenchymal transition (EMT) have
been suggested to play a role in sunitinib resistance.1-5 One factor that seems to be
important in sunitinib resistance is tumor hypoxia. Notably, inhibiting angiogenesis
with VEGF-targeted agents does not only result in stabilization or regression of the
tumor, but also leads to hypoxic tumor cells hypoxic and HIF1 accumulation.6
Subsequently, this causes upregulation of proangiogenic factors, such as VEGF that
stimulates angiogenesis, cMET upregulation which increases tumor invasiveness, and
EMT and SDF1 upregulation which recruits proangiogenic bone marrow-derived cells
(BMDCs). A recent study showed that chronic sunitinib treatment induces the
activation of AXL and MET signaling and subsequently even promotes the
prometastatic behavior of renal cancer cells and increases angiogenesis in a
xenograft 786-O mouse model.7 However, these factors cannot explain all clinical
observations of sunitinib resistance. The underlying mechanisms to fully explain and
overcome acquired resistance to sunitinib remain still unclear. Notable, the
contribution of tumor-cell-related mechanisms of resistance to sunitinib is not well
studied In this thesis the main focus was to unravel the molecular mechanism of
sunitinib resistance by studying its direct activity on tumor cells in order to improve
its clinical use.
Sunitinib sensitivity and resistance of tumor cells in vitro
While sunitinib has been developed as an antiangiogenic agent, intended to primarily
target endothelial and perivascular cells through its high affinity binding to VEGF
receptor (VEGFR)-2 and platelet-derived growth factor (PDGFR), it inhibits many
other kinases.8,9 We investigated whether an alternative mechanism of action may
play a role in the antitumor activity of sunitinib rather than solely its antiangiogenic
activity. In our studies (chapter 3), we explored the effect of sunitinib on tumor cells
in vitro and described that sunitinib, besides inhibiting angiogenesis, targets tumor
cells directly. Previous reports indicated that the antitumor activity of sunitinib was
probably not due to a direct effect on tumor cells, because no activity of sunitinib at
assumed relevant plasma concentrations on tumor cells in vitro was observed.10 In
addition, Smith and Houghton11 described that many drug concentrations used in in
vitro studies are not comparable to human pharmacokinetics and they advised that
plasma concentrations should be used to test drugs activity in vitro. Although their
paper is focused on sorafenib, among others, sunitinib is more or less similar in terms

Discussion and perspectives
131
7
of high protein bound and low drug availability in plasma. While their current of
thought is very important to take into account during experiments in general, we
show that plasma concentrations do not truly reflect physiologic intratumoral
pharmacokinetics of sunitinib and found intratumoral concentrations in patients
were 30-fold higher than plasma concentrations. At these clinically relevant
intratumoral drug concentrations achieved in vivo and in patients, sunitinib directly
inhibits tumor cells in vitro.
Lysosomal sequestration as resistance mechanism
In vitro experiments showed that sunitinib concentrations in cells are much higher
compared to surrounding drug concentrations in the medium (chapter 3); low mM
range intracellular versus low µM range in the conditioned medium. The intracellular
sunitinib concentrations in the resistant cells were found to be up to 1000-fold higher
compared to the sunitinib concentration in the conditioned medium. As described in
chapter 3 , the drug is not equally distributed throughout the cell, but - due to the
chemical properties of sunitinib - preferably accumulates in certain organelles.
Sunitinib is a hydrophobic compound (logP = 5.2) allowing the drug to easily cross
plasma membranes and other intracellular membranes via passive diffusion.
However, because sunitinib is a weak base (pKa = 8.95), it becomes protonated in an
acidic environment and loses its ability to cross membranes. Therefore, upon
entering an acidic organelle such as a lysosome, sunitinib is entrapped in its cationic
state in these organelles. Lysosomes contain acidic hydrolases, capable of degrading
biological macromolecules such as nucleic acids, lipids and proteins. In addition,
lysosomes are involved in recycling defective organelles, exocytosis, apoptosis and
autophagy. Other hydrophobic weak base (chemotherapeutic) drugs, such as
doxorubicin, daunorubicin, mitoxantrone, and imidazoacridinones accumulate in
lysosomes as well. 12,13
As a consequence of lysosomal sequestration, drug concentration at the target site
(tyrosine kinases mainly located in the cytosol or intracellular cell membrane) is much
lower, i.e. lysosomal sequestrations prevents the drug from reaching its target. The
amount of drug reaching its target is very hard to predict. The volume of lysosomes
within a cell is only a fraction of the whole cell volume, but contains most of the
sunitinib. In addition, sunitinib is highly protein bound (95% and its primary active
metabolite is 90% bound).14 Many assumption have to be done to calculate the drug
concentration ratio lysosomes / cytosol. However, hypothetically, lysosomal sunitinib
concentration could be several thousand times, or even a million time, higher
compared to the concentration in the cytosol/ at the target site. Presumably, cellular
fragmentation would help to study different drug concentrations within cellular
organelles, but this is a complex method.

Chapter 7
132
In our studies (chapter 3), we found that the intracellular sunitinib concentration was
significantly higher in resistant cells compared to sensitive cells, in parallel with
increased lysosomal capacity, providing a new resistance mechanism for this TKI.
Remarkably, despite higher intracellular sunitinib concentration in resistant cells,
kinase activity was unaffected. p-Akt and p-ERK levels in resistant cells were similar to
the levels in untreated parental cells (chapter 3). Increased sequestration of sunitinib
in lysosomes of resistant tumors has also been demonstrated in in vivo experiments
(chapter 4). Lysosomal associated membrane proteins (LAMP)-1 and -2 expression,
which reflects lysosomal capacity, was found to be higher in sunitinib resistant
tumors when compared with the parental tumors. Lysosomal sequestration as a
resistance mechanism has been described for other TKIs, such as gefitinib or lapatinib
in immortalized human hepatocytes (Fa2N-4 cells).15 In chapter 5, we showed
increased intracellular accumulation of pazopanib and erlotinib and elevated
expression of LAMP-1 and -2 in renal (786-O) and colorectal (HT-29) cancer cells
resistant to these compounds, suggesting an involvement of the lysosomal
compartment in resistance to these TKIs as well. These compounds have similar
chemical properties as sunitinib, being hydrophobic, membrane-permeable weak
base TKIs. Although, we could not show lysosomal sequestration of sorafenib in renal
and colorectal cancer cells, it has been reported in hepatocellular carcinoma (HCC) by
Colombo et al.16 Sorafenib does not belong to the same class of hydrophobic weak
bases as sunitinib and therefore a different mechanism could explain its lysosomal
sequestration, potentially by active involvement of drug pumps.17 Alternative
resistance mechanism of sunitinib and other TKIs may, besides lysosomal
sequestration and restoration of angiogenesis through the activation of alternative
pathways, also include reduced bioavailability through increased efflux by drug
pumps such as the ATP-binding cassette (ABC) superfamily.
Overcoming sunitinib resistance by disturbing lysosomal sequestration
Lysosomal sequestration seems to eliminate the cytotoxic effect of sunitinib by
decreasing drug concentration at the target site. Therefore, a potential approach to
overcome resistance to sunitinib, may be a combination treatment with drugs that
circumvent lysosomal drug sequestration. The extent of lysosomal drug sequestration
has been shown to depend on the pH gradient between the acidic luminal pH of the
lysosome and the cytoplasm.12 In this respect, lysosomal drug accumulation can be
reversed with agents that alkalinize lysosomes, such as bafilomycin A1, a H+ - ATPase
inhibitor. In in vitro experiments this compound reverses lysosomal sunitinib
sequestration (chapter 3). However, this compound is too toxic for in vivo treatment.
Currently, chloroquine and hydroxychloroquine, compounds that prevent
acidification of the lysosomal compartment and inhibit lysosomal function, are the

Discussion and perspectives
133
7
only clinically available inhibitors. We evaluated the effect of chloroquine in vivo and
found preliminary indications that resistance could be reversed by applying
combination therapy with sunitinib (chapter 4).
Despite the findings and mechanism of resistance as described in this thesis,
concanamycin A, a vacuolar type H+-ATPase (V-ATPase) inhibitor, reduced the
amount of cell death induced by sunitinib in breast cancer MCF7 cells dramatically
due to relocalization of sunitinib in to the cytosol.18 This suggests that lysosomal
sequestration seems to be essential for the cytotoxic activity of sunitinib. The
discrepancy that lysosomal sequestration explains sunitinib resistance on one hand
and is important for antitumor activity of sunitinib on the other hand, could be cell
type specific. This also indicates that resistance to an antitumor agent is a complex
process and involves several different molecular mechanisms.
Alternative data show that lysosomal accumulation of sunitinib is involved in
resistance due to overexpression of Pgp on lysosomes enhancing intralysosomal drug
sequestration. Subsequently, inhibition of this drug pump with verapamil restored
sensitivity to tyrosine kinase inhibitors including sunitinib, especially when
administrated after drug pre-incubation.16 Colombo et al. hypothesized that during
the pre-incubation phase, anti-cancer drugs are being trapped in Pgp-positive
lysosomes. Blocking Pgp activity by subsequent incubation with the drug/ verapamil
combination allows drug diffusion from the culture medium and lysosome into the
cytoplasm. Consequently, the intracellular drug concentration is increased.16 Prior
clinical use of verapamil to inhibit PgP activity in patients had no benefit and
therefore we do think that the use of chloroquine or hydroxychloroquine may be of
more value.
Alternative treatment strategies upon resistance
Switching to another TKI in case of sunitinib resistance is a clinical strategy to
consider. However, this option is not always feasible and often does not solve the
problem due to cross-resistance. In chapter 5 we showed that sunitinib resistant RCC
cells are cross-resistant to pazopanib and erlotinib. The antitumor activity of
sorafenib and the mTOR inhibitor everolimus, did not decrease upon sunitinib
resistance. Switching to these drugs is therefore a potential option when patients
with RCC are resistant to sunitinib treatment.
Sequential therapy with everolimus is preferred over combining this drug with
sunitinib. Recently, it was found that lysosomal sequestration of hydrophobic weak
base chemotherapeutics, including sunitinib, triggers transcription factor EB (TFEB)-
mediated lysosomal biogenesis. This can be achieved through mTOR inhibition and
results in a significant increase in the number of lysosomes per cell. As a
consequence, the efficiency of lysosomal drug sequestration and therefore multi-

Chapter 7
134
drug resistance increases even further.13 In addition, the combination of sunitinib
with everolimus was associated with significant toxicities.19
An intriguing observation in vitro is that when exposed to light, sequestered sunitinib
caused immediate destruction of the lysosomes, resulting in the release of sunitinib
and cell death. Despite combining sunitinib with phototherapy could therefore be an
interesting approach to overcome sunitinib resistance caused by lysosomal
sequestration,20 its practical use is very limited due to the superficial and local
treatment options with phototherapy. A more practical approach for patients with
metastatic disease requiring systemic exposure is urgently needed. Several
interesting combination therapies to overcome sunitinib resistance in metastatic
renal cancer are being explored in preclinical and clinical studies.21 It is of high
interest to see the outcome of the phase 1 trial (NCT00813423) in which sunitinib is
combined with hydroxychloroquine in patients with advanced solid tumors that have
not responded to chemotherapy to better understand whether disturbing lysosomal
sunitinib sequestration is clinically involved in its resistance.
Rechallenging the patient with sunitinib after treatment switching or interruption is a
promising strategy, since the sunitinib resistance phenotype was found to be
transient and reversible upon sunitinib removal in vitro (chapter 3). In addition,
transient resistance has been shown in patients as well, since some patients
responded during sunitinib rechallenge after treatment interruption.22 Also
resistance to pazopanib was found to be transient in vitro, with a smaller recovery
period compared to sunitinib (chapter 5). Therefore rechallenge with pazopanib
might also be a worthwhile strategy.
Development of predictive tests
Most of the targeted agents, such as TKIs, induce a response in only a subgroup of
cancer patients. Patients with metastasized RCC will benefit upon treatment with
sunitinib, but approximately 25% of the patients will have no benefit of this
treatment at all.23 Apart from EGFR mutation status, ALK and ROS1 rearrangement
and BCR-ABL1 gene sequence, there are no tests indicative of response to TKIs.24-27
Considering the aberrant signaling activities in tumors, it is hypothesized that kinase
activity profiling could be a valuable clinical tool to select TKI treatment for patients
with advanced cancer, thereby enhancing efficacy of available drugs and expanding
the therapeutic arsenal. Such therapy selection tools should be a fast and robust
screening method to evaluate available drugs or drug combinations based on tumor
biology from an individual patient. Diagnostic evaluation of kinase activity for
treatment selection is being developed by a few companies (including PamGene
International B.V., Pepscan Holding NV and Bayer Healthcare). None of these tests
have reached the clinic so far and our evaluation of a tyrosine kinase microarray,

Discussion and perspectives
135
7
despite the fact that it is a robust, reliable and promising method for measurements
of phosphorylated peptides, indicates that for predicting treatment outcome, more
specific peptides should be available on the array (chapter 6). It seems that more
robust, global phosphoproteomic profiling using targeted Mass spectrometry-based
proteomics may be more suitable to identify specific and unique biomarkers
predictive for response.28 Therefore, we hope that our successful efforts to analyze in
depth the phosphoproteomic profiles of tumor tissues derived from patients will lead
to the identification of reliable predictive biomarkers for response to TKIs.29,30
Conclusions
In this thesis, we evaluated the role of tumor cells in resistance to antiangiogenic
TKIs. Resistance to antiangiogenic TKIs, including sunitinib, is a major clinical problem
and the underlying mechanisms to fully explain and overcome resistance to TKIs
remain unclear. By investigating TKI resistance in tumor cells in vitro and in vivo, we
have identified lysosomal drug sequestration as a novel mechanism of resistance. At
first, we described that antiangiogenic TKIs, including sunitinib, inhibit tumor cell
proliferation directly at clinically relevant intratumoral concentrations and we
induced resistance to sunitinib in tumor cells in vitro. We reported that sunitinib is
sequestered in lysosomes intracellularly and we found increased lysosomal
sequestration in sunitinib resistant tumor cells, without affecting intracellular
signaling. In vivo, we showed that sunitinib resistant tumor cells play a crucial role in
acquired resistance, rather than host- and angiogenic-mediated factors. Furthermore,
we presented cross-resistance to some, but not all, multitargeted TKIs and showed
that (cross-)resistance to these TKIs, including pazopanib and erlotinib, is
accompanied by an increased intracellular drug accumulation. Finally, in order to
define upfront who will benefit from targeted treatment, we evaluated a tyrosine
kinase peptide microarray for TKI therapy selection in cancer.
Together, the work presented in this thesis supports a direct role of tumor cells in
resistance to sunitinib and possibly other antiangiogenic tyrosine kinase inhibitors.
These findings may give new treatment opportunities, such as combining sunitinib
with compounds that interfere with lysosomal drug sequestration, switching to
another TKI to which no cross-resistance was observed, and/or rechallenging the
tumor with the same drug after a period of treatment interruption. These (new)
treatment strategies might prevent or overcome resistance to antiangiogenic TKIs.
Ultimately, this will result in more effective treatment opportunities for patients with
cancer.

Chapter 7
136
References
1. Joosten SC, Hamming L, Soetekouw PM et al. Resistance to sunitinib in renal cell carcinoma:
From molecular mechanisms to predictive markers and future perspectives. Biochim Biophys
Acta 2015;1855(1):1-16.
2. Ellis LM, Hicklin DJ. Pathways mediating resistance to vascular endothelial growth factor-
targeted therapy. Clin Cancer Res 2008;14(20):6371-6375.
3. Shojaei F, Lee JH, Simmons BH et al. HGF/c-Met acts as an alternative angiogenic pathway in
sunitinib-resistant tumors. Cancer Res 2010;70(24):10090-10100.
4. Huang D, Ding Y, Zhou M et al. Interleukin-8 mediates resistance to antiangiogenic agent
sunitinib in renal cell carcinoma. Cancer Res 2010;70(3):1063-1071.
5. Hammers HJ, Verheul HM, Salumbides B et al. Reversible epithelial to mesenchymal
transition and acquired resistance to sunitinib in patients with renal cell carcinoma: evidence
from a xenograft study. Mol Cancer Ther 2010;9(6):1525-1535.
6. Morais C. Sunitinib resistance in renal cell carcinoma. J of Kidney Cancer and VHL 2014;1(1):1
-11.
7. Zhou L, Liu XD, Sun M et al. Targeting MET and AXL overcomes resistance to sunitinib therapy
in renal cell carcinoma. Oncogene 2015; doi: 10.1038/onc.2015.343. [Epub ahead of print]
8. Fabian MA, Biggs WH III, Treiber DK et al. A small molecule-kinase interaction map for clinical
kinase inhibitors. Nat Biotechnol 2005;23(3):329-36.
9. Karaman MW, Herrgard S, Treiber DK et al. A quantitative analysis of kinase inhibitor
selectivity. Nat Biotechnol 2008;26(1):127-32.
10. Huang D, Ding Y, Li Y et al. Sunitinib acts primarily on tumor endothelium rather than tumor
cells to inhibit the growth of renal cell carcinoma. Cancer Res 2010;70(3):1053-62.
11. Smith MA, Houghton P. A proposal regarding reporting of in vitro testing results. Clin Cancer
Res 2013;19(11):2828-33.
12. Wang E, Lee MD, Dunn KW. Lysosomal accumulation of drugs in drug-sensitive MES-SA but
not multidrug-resistant MES-SA/Dx5 uterine sarcoma cells. J Cell Physiol 2000;184(2):263-
274.
13. Zhitomirsky B, Assaraf YG. Lysosomal sequestration of hydrophobic weak base
chemotherapeutics triggers lysosomal biogenesis and lysosome-dependent cancer multidrug
resistance. Oncotarget 2015;6(2):1143-56.
14. Goodman VL, Rock EP, Dagher R et al. Approval summary: sunitinib for the treatment of
imatinib refractory or intolerant gastrointestinal stromal tumors and advanced renal cell
carcinoma. Clin Cancer Res 2007;13(5):1367-73
15. Kazmi F, Hensley T, Pope C et al. Lysosomal sequestration (trapping) of lipophilic amine
(cationic amphiphilic) drugs in immortalized human hepatocytes (Fa2N-4 cells). Drug Metab
Dispos 2013;41(4):897-905.

Discussion and perspectives
137
7
16. Colombo F, Trombetta E, Cetrangolo P et al. Giant Lysosomes as a Chemotherapy Resistance
Mechanism in Hepatocellular Carcinoma Cells. PLoS One 2014;9(12):e114787.
17. Broxterman HJ, Gotink KJ, Verheul HM. Understanding the causes of multidrug resistance in
cancer: a comparison of doxorubicin and sunitinib. Drug Resist Updat 2009;12(4-5):114-126.
18. Ellegaard AM, Groth-Pedersen L, Oorschot V et al. Sunitinib and SU11652 inhibit acid
sphingomyelinase, destabilize lysosomes, and inhibit multidrug resistance. Mol Cancer Ther
2013;12(10):2018-30
13. Zhitomirsky B, Assaraf YG. Lysosomal sequestration of hydrophobic weak base
chemotherapeutics triggers lysosomal biogenesis and lysosome-dependent cancer multidrug
resistance. Oncotarget 2015;6(2):1143-56.
19. Molina AM, Feldman DR, Voss MH et al. Phase 1 trial of everolimus plus sunitinib in patients
with metastatic renal cell carcinoma. Cancer 2012;118(7):1868-76.
20. Nowak-Sliwinska P, Weiss A, van Beijnum JR et al. Photoactivation of lysosomally
sequestered sunitinib after angiostatic treatment causes vascular occlusion and enhances
tumor growth inhibition. Cell Death Dis 2015;6:e1641.
21. clinicaltrials.gov
22. Zama IN, Hutson TE, Elson P et al. Sunitinib rechallenge in metastatic renal cell carcinoma
patients. Cancer 2010;116(23):5400-5406.
23. Heng DY, Mackenzie MJ, Vaishampayan UN et al. Primary anti-vascular endothelial growth
factor (VEGF)-refractory metastatic renal cell carcinoma: clinical characteristics, risk factors,
and subsequent therapy. Ann Oncol 2012;23(6):1549-1555.
24. Mazieres J, Zalcman G, Crino L et al. Crizotinib therapy for advanced lung adenocarcinoma
and a ROS1 rearrangement: results from the EUROS1 cohort. J Clin Oncol 2015;33(9):992-
999.
25. Kwak EL, Bang YJ, Camidge DR et al. Anaplastic lymphoma kinase inhibition in non-small-cell
lung cancer. N Engl J Med 2010;363(18):1693-1703.
26. Tsao MS, Sakurada A, Cutz JC et al. Erlotinib in lung cancer - molecular and clinical predictors
of outcome. N Engl J Med 2005;353(2):133-144.
27. Druker BJ, Talpaz M, Resta DJ et al. Efficacy and safety of a specific inhibitor of the BCR-ABL
tyrosine kinase in chronic myeloid leukemia. N Engl J Med 2001;344(14):1031-1037.
28. Jimenez CR, Verheul HM. Mass spectrometry-based proteomics: from cancer biology to
protein biomarkers, drug targets, and clinical applications. Am Soc Clin Oncol Educ Book
2014;e504-e510.
29. Piersma SR, Labots M, Verheul HM, Jimenez CR. Strategies for kinome profiling in cancer and
potential clinical applications: chemical proteomics and array-based methods. Anal Bioanal
Chem 2010;397(8):3163-3171.
30. Van der Mijn JC, Labots M, Piersma SR et al. Evaluation of different phospho-tyrosine
antibodies for label-free phosphoproteomics. J Proteomics 2015;127(Pt B):259-63


Summary
Nederlandse samenvatting
Dankwoord
Curriculum Vitae
List of publications

Summary
140
Summary
Angiogenesis is a critical step in tumor progression and is redundantly present in
highly vascularized tumor types including renal cell cancer (RCC). Multiple kinases are
involved in angiogenesis, including receptor tyrosine kinases such as the vascular
endothelial growth factor receptor (VEGFR) and platelet-derived growth factor
receptor (PDGFR). Inhibition of angiogenic tyrosine kinases has been developed as a
systemic treatment strategy for cancer. Several antiangiogenic tyrosine kinase
inhibitors (TKIs), including sunitinib, sorafenib, pazopanib and axitinib, have been
approved for treatment of patients with advanced cancer (RCC, gastro-intestinal
stromal tumors, hepatocellular cancer, pancreatic neuroendocrine tumors). Despite
the clinical benefits achieved with antiangiogenic TKIs, they also cause significant
toxicities and inevitably induce resistance. Pre-existing non-responsiveness (intrinsic
resistance) as well as the development of acquired drug resistance is a major clinical
problem, but the underlying mechanisms to fully explain and overcome resistance
remain unclear. Most studies focused on potential angiogenic-factor-mediated
mechanisms of resistance and the microenvironment of the host, while relatively
little attention has been paid to the contribution of tumor-cell-related mechanisms of
resistance to antiangiogenic TKIs. In this thesis, we have studied the potential
mechanisms of resistance to antiangiogenic TKIs, especially sunitinib, by evaluating
direct activity of TKIs on tumor cells, in order to improve their clinical use.
In chapter 2, an overview of the design and development of antiangiogenic TKIs is
given. We described their molecular structure and classification, their mechanism of
action and their inhibitory activity against specific kinase signaling pathways. In
addition, we provided insight to what extent selective targeting of angiogenic kinases
by TKIs may contribute to the clinically observed anti-tumor activity, resistance and
toxicity.
Sunitinib has been developed as an antiangiogenic agent, targeting endothelial and
perivascular cells through its high affinity binding to VEGFR2 and PDGFR, but in
addition it inhibits many other kinases. We investigated whether an alternative
mechanism of action may play a role in the antitumor activity of sunitinib rather than
solely its antiangiogenic activity. In chapter 3, we explored the effect of sunitinib on
tumor cells in vitro and found that sunitinib directly inhibited tumor cells at clinically
relevant intratumoral drug concentrations. In addition, continuous exposure to
sunitinib resulted in resistance of 786-O renal and HT-29 colorectal cancer cells. In
these sunitinib resistant cells, intracellular drug concentrations were significantly
higher compared to parental cells. Based on the chemical properties of sunitinib –

Summary
141
sunitinib is a hydrophobic weak base (logP = 5.2; pKa = 8.95) – we hypothesized that
sunitinib preferably accumulates in specific organelles. Subcellular distribution of
sunitinib was analyzed with fluorescence microscopy and showed that sunitinib is co-
localized with acidic lysosomes. Lysosomal sequestration of sunitinib was higher in
resistant cells compared to parental cells, without affecting intracellular signaling,
providing a new resistance mechanism for this TKI.
To what extent acquired resistance to sunitinib is determined by microenvironmental
host-factors or by tumor cells directly is unknown. In chapter 4, we studied whether
the in vitro induced resistance of tumor cells determines in vivo resistance to
sunitinib. In severe combined immunodeficient mice, tumors were established from
HT-29 parental colon cancer cells (HT-29PAR) or the in vitro induced sunitinib
resistant HT-29 cells (HT-29SUN), as described in chapter 3. Treatment with sunitinib
inhibited tumor growth of HT-29PAR tumors while no inhibition of HT-29SUN tumor
growth was observed. In parallel, tumor cell proliferation was reduced in HT-29PAR
tumors but unaffected in HT-29SUN tumors, upon sunitinib treatment. In addition,
the lysosomal capacity reflected by LAMP-1 and -2 expression was higher in HT-
29SUN compared to HT-29PAR tumors. Reduction in microvessel density was similar
in sensitive and resistant tumors. In this model acquired resistance to sunitinib
depends on tumor cells rather than on host- and angiogenesis-mediated factors.
When during cancer treatment resistance to a TKI occurs, switching to another TKI is
often considered as a reasonable treatment option. Currently, detailed information is
lacking on patterns of resistance or cross-resistance of tumor cells after long-term
exposure to multi-targeted TKIs. In chapter 5, we studied the effect of several multi-
targeted TKIs and the mTOR inhibitor everolimus on the development of (cross-)
resistance. We found that the sunitinib-resistant (SUN) 786-O renal and HT-29
colorectal cancer cells, as described in chapter 3, were cross-resistant to pazopanib,
erlotinib and lapatinib, but not to sorafenib. Upon continuous exposure of tumor
cells, resistance could be induced to some - but not all - TKIs, comparable to the
cross-resistance findings. Such (cross-)resistance includes increased intracellular drug
accumulation accompanied by increased lysosomal storage. No cross-resistance to
the mTOR inhibitor everolimus was detected.
The research described in chapters 3-5 may give new treatment options. Sunitinib
resistance in vitro and in vivo, as well as in vitro resistance to some other TKIs, was
accompanied by an increased lysosomal storage capacity. Lysosomal drug
sequestration can be modulated by interference with lysosomal function, for
example by bafilomycin in vitro (chapter 3) or chloroquine in vivo (chapter 4). It

Summary
142
warrants clinical evaluation whether targeting lysosomal function will overcome
resistance to sunitinib and other TKIs .
No cross-resistance of sunitinib resistant tumor cells to the TKI sorafenib or the mTOR
inhibitor everolimus was detected (chapter 5), indicating that, upon sunitinib
resistance in patients, switching to one of these drugs may be a (new) therapeutic
opportunity.
In addition, we found that sunitinib resistance (chapter 3), as well as pazopanib
resistance (chapter 5), was reversible upon removal of the drug within several weeks.
Therefore, this transient form of resistance may be an adaptation to (partial)
inhibition of multiple kinases and/or to a partly disturbed lysosomal function, rather
than a stable, genetic form of resistance. This indicates that rechallenging the patient
with sunitinib/ pazopanib after treatment switching or interruption is a promising
strategy.
Antiangiogenic TKIs are only effective in a subgroup of cancer patients. Patients with
metastasized RCC have clinical benefit upon treatment with sunitinib, but a subgroup
will have no benefit of this treatment at all. One of the major efforts of current
clinical practice is to adequately define upfront which patient will benefit from
targeted treatments, so-called ‘personalized’ or ‘precision’ medicine. However,
currently there is no reliable test to predict TKI response in patients. In chapter 6 we
evaluated a protein tyrosine kinase (PTK) microarray to determine its potential for
clinical use. Multiple technical conditions were evaluated, including protein and ATP
concentrations, background reduction, lysis efficiency, substrate specificity,
reproducibility, samples of different biological origin, inhibition profiles, and other
factors. Specific activity of recombinant kinases could be adequately measured on
the PTK microarray, but for its use with more complex biological samples containing
multiple kinases, such as tumor lysates, the array peptides need further optimization
for specificity.
The research described in this thesis supports a direct role of tumor cells in resistance
to sunitinib and other antiangiogenic TKIs. These findings may give new treatment
opportunities, such as combining sunitinib with compounds that interfere with
lysosomal drug sequestration, switching to another TKI to which no cross-resistance
was observed, and/or rechallenging the tumor with the same drug after a period of
treatment interruption. These (new) treatment strategies might prevent or overcome
resistance to antiangiogenic TKIs. Ultimately, this will result in more effective
treatment opportunities for patients with cancer.


Nederlandse samenvatting
144
Nederlandse samenvatting (ook voor niet-ingewijden)
Angiogenese is de vorming van nieuwe bloedvaten vanuit reeds bestaande vaten. In
normale fysiologische omstandigheden vindt dit alleen plaats tijdens de ontwikkeling
van een embryo, zwangerschap, menstruele cyclus en wondheling. Angiogenese
speelt echter ook een rol in verschillende ziekten, waaronder kanker. Het is een
essentieel proces in de progressie van tumoren; een groeiende tumor is afhankelijk
van nieuwe bloedvaten om in zijn behoefte van zuurstof en voedingsstoffen te
voorzien én om te kunnen metastaseren (uitzaaien). In bepaalde typen kanker komt
angiogenese in hoge mate voor, bijvoorbeeld bij niercelkanker. Gedurende de laatste
decennia zijn er verschillende middelen ontwikkeld om angiogenese in tumoren te
remmen, met als doel tumorgroei en -progressie te verminderen. Een deel van deze
anti-angiogene middelen betreffen tyrosine kinase remmers (Engels: tyrosine kinase
inhibitor; TKI). Dit zijn kleine moleculen die specifieke eiwitten (kinases) remmen.
Voorbeelden zijn sunitinib, sorafenib, pazopanib en axitinib, welke worden ingezet bij
patiënten met verschillende soorten vergevorderde tumoren. Helaas hebben deze
anti-angiogene middelen vaak (ernstige) bijwerkingen en leidt behandeling vroeg of
laat tot resistentie (ongevoeligheid). Resistentie is een groot probleem, maar het
onderliggende mechanisme om resistentie te verklaren blijft onduidelijk. Veel studies
zijn gericht op de functie van bloedvaten en bijbehorende angiogene factoren, maar
er is weinig aandacht besteed aan de rol van tumor cellen zelf. In dit proefschrift
hebben we de mogelijke rol van tumorcellen in de resistentie tegen anti-angiogene
tyrosine kinase remmers bestudeerd (voornamelijk sunitinib), met als doel de
klinische toepassing van deze middelen te kunnen verbeteren.
In hoofdstuk 2 van dit proefschrift is een literatuurstudie beschreven, waarin
onderzoek is gedaan naar tyrosine kinases en hun rol in angiogenese. Er wordt een
overzicht gegeven van de ontwikkeling van anti-angiogene tyrosine kinase remmers
(TKIs). Daarnaast beschrijven we de moleculaire structuur en classificatie, het
metabolisme (stofwisseling) en het werkingsmechanisme. Vervolgens beschouwen
we de selectiviteit van deze remmers en hoe dit bijdraagt aan de waargenomen anti-
tumor effecten, bijwerkingen en resistentie.
De TKI sunitinib is ontwikkeld als angiogenese remmer, bedoeld om specifieke
moleculen op cellen van bloedvaten te remmen. Belangrijke targets (doelmoleculen)
zijn ondermeer de eiwitten VEGFR (Engels: vascular endothelial growth factor
receptor) en PDGFR (Engels: platelet-derived growth factor receptor). Maar
daarnaast remt sunitinib ook vele ander kinases. Wij hebben onderzocht of sunitinib,

Nederlandse samenvatting
145
naast de anti-angiogene activiteit, een alternatieve manier van tumor remming heeft.
In hoofdstuk 3 hebben we het effect van sunitinib op tumorcellen in vitro (‘in kweek’)
bestudeerd. Het blijkt dat, gemeten in patiënten en in muizen, de concentratie van
sunitinib in de tumor vele malen hoger is dan in het bloedplasma. Bij deze hoge
concentraties worden tumorcellen in vitro rechtstreeks geremd, zonder tussenkomst
van angiogenese remming. Langdurige blootstelling aan sunitinib leidde tot
resistentie van de tumor cellijnen 786-O (nierkanker) en HT-29 (darmkanker).
Vergeleken met de oorspronkelijke gevoelige cellen, was de sunitinib concentratie in
deze resistente cellen significant hoger. Vanwege de chemische eigenschappen van
sunitinib – het betreft een hydrofobe zwakke base (logP = 5,2; pKa = 8,95) –
veronderstelden wij dat sunitinib opstapelt in specifieke organellen
(celcompartimenten). Met behulp van fluorescentie microscopie hebben we laten
zien dat sunitinib in hoge mate voorkomt in zure lysosomen, wat een soort blaasjes in
de cel zijn. Ophoping van sunitinib in deze lysosomen was hoger in de resistente
cellen vergeleken met de oorspronkelijke cellen, zonder dat de signalering in de cel
word aangetast. Hiermee tonen we een nieuw resistentiemechanisme aan voor dit
geneesmiddel.
Het is onbekend in hoeverre verworven resistentie van sunitinib wordt bepaald door
factoren in de micro-omgeving van de gastheer of door tumorcellen zelf. In
hoofdstuk 4 hebben we onderzocht of de in vitro (‘in kweek’) geïnduceerde
resistentie van tumorcellen leidt tot resistentie in vivo (‘binnen (in het) leven’). De
oorspronkelijke gevoelige HT-29 darmkanker cellen (HT-29PAR) en de sunitinib-
resistente HT-29 cellen (HT-29SUN; beschreven in hoofdstuk 3), werden in scid-
muizen uitgegroeid tot tumoren. Van deze immuun-deficiënte muizen werkt het
immuunsysteem niet goed, waardoor ze niet in staat zijn om tumoren af te stoten. Bij
behandeling van deze muizen met sunitinib, werd de groei van HT-29PAR tumoren
geremd, terwijl er geen remming van HT-29SUN tumorgroei werd waargenomen.
Tegelijkertijd was de proliferatie (groei) van tumorcellen in de HT-29PAR tumoren
verminderd, maar gelijk gebleven in HT-29SUN tumoren. Daarnaast was de capaciteit
van de lysosomen, gemeten door expressie van LAMP-1 en -2 eiwitten (Engels:
lysosomal associated membrane proteins), hoger in resistente tumoren. De dichtheid
van micro-bloedvaten (Engels: microvessel density, MVD) was vergelijkbaar tussen de
gevoelige en resistente tumoren. Concluderend, de resistentie tegen sunitinib in dit
model is afhankelijk van tumorcellen en niet van gastheer- en angiogenese-factoren.
Wanneer er resistentie optreedt tijdens de behandeling van een patiënt met een
anti-angiogene TKI, wordt er vaak overgeschakeld naar een andere angiogenese
remmer. Momenteel ontbreekt er uitvoerige informatie over het gevolg van lange
Nederlandse samenvatting
146
termijn blootstelling van TKIs op de ontwikkeling van kruisresistentie. Kruisresistentie
betreft het ongevoelig zijn voor een middel, verwant aan het middel waarmee
behandeld wordt. In hoofdstuk 5 hebben we bestudeerd wat het effect is van
blootstelling aan een aantal TKIs op de ontwikkeling van (kruis)resistentie. Hiertoe
werden de, in hoofdstuk 3 beschreven sunitinib-resistente 786-O en HT-29 kanker
cellen onderzocht op kruisresistentie tegen een aantal andere (verwante)
geneesmiddelen. Het bleek dat deze cellen kruisresistent waren tegen pazopanib,
erlotinib en lapatinib, maar niet tegen sorafenib en de mTOR-remmer everolimus.
Wanneer de oorspronkelijk gevoelige cellen continue blootgesteld worden aan de
verschillende remmers, kan resistentie tegen een aantal, maar niet alle, remmers
worden geïnduceerd. De bevindingen zijn vergelijkbaar met het kruisresistentie
onderzoek: wel resistentie tegen pazopanib en erlotinib, geen resistentie tegen
sorafenib. De waargenomen (kruis)resistentie gaat gepaard met een verhoogde
concentratie van het geneesmiddel in de cellen en met een verhoogde capaciteit van
de lysosomen, net als bij de resistentie tegen sunitinib.
De bevindingen in hoofdstuk 3 - 5 bieden potentie voor nieuwe behandelings-
mogelijkheden. Er zijn verschillende therapeutische strategieën mogelijk, welke
resistentie kunnen voor- of overkomen en verder (klinisch) onderzocht kunnen
worden.
De resistentie beschreven in dit proefschrift gaat gepaard met een verhoogde
capaciteit van lysosomen. Het betreft de resistentie van sunitinib in vitro en in vivo,
alsmede in vitro resistentie tegen een aantal andere TKIs. Ophoping van deze
middelen kan worden beïnvloed door de functie van lysosomen te verstoren.
Hiervoor kunnen stoffen zoals bijvoorbeeld bafilomycine (in vitro; hoofdstuk 3) of
chloroquine (in vivo; hoofdstuk 4) gebruikt worden. Klinisch vervolgonderzoek is
benodigd om te bekijken of verstoring van lysosomale functie de resistentie kan
overkomen.
In het onderzoek van hoofdstuk 5 werd geen kruisresistentie waargenomen van
sunitinib-resistente tumor cellen tegen de TKI sorafenib of de mTOR-remmer
everolimus. Daarom zou het omschakelen naar één van deze middelen een nieuwe
behandelingsmogelijkheid kunnen zijn, wanneer sunitinib resistentie optreedt in een
patiënt.
Een derde nieuwe strategie heeft betrekking op de omkeerbaarheid van resistentie.
Nadat blootstelling aan de remmer is gestopt, treedt er na een aantal weken tot
maanden weer gevoeligheid op tegen sunitinib (hoofdstuk 3) of pazopanib
(hoofdstuk 5). Het is een veelbelovende optie om een patiënt opnieuw te behandelen
met hetzelfde geneesmiddel (sunitinib/ pazopanib) na een onderbreking of na een
tijdelijke alternatieve behandeling.

Nederlandse samenvatting
147
Anti-angiogene TKIs hebben slechts effect in een subgroep van patiënten. Het is een
grote uitdaging om vooraf adequaat te voorspellen welke patiënt baat zal hebben bij
een therapie en welke patiënt niet. Er zijn echter weinig mogelijkheden om de reactie
op een TKI te voorspellen. In hoofdstuk 6 evalueren we een zogenoemde “tyrosine
kinase microarray” om de klinische toepasbaarheid te bepalen. Met dit platform kan
de kinase activiteit gemeten worden van bijvoorbeeld cellen of patiëntenmateriaal en
kan bepaald worden welk effect toegevoegde medicijnen hebben. Verscheidene
technische condities werden geëvalueerd, bijvoorbeeld eiwit- en ATP concentraties,
vermindering van achtergrond signaal, specificiteit, reproduceerbaarheid,
verschillende (biologische) monsters, remming van TKIs, en andere factoren. Met het
platform kon specifieke kinase activiteit goed worden gemeten, maar optimalisatie is
benodigd voor complexe biologische monsters zoals tumor lysaat.
Het in dit proefschrift beschreven onderzoek wijst op een directe rol van tumorcellen
in de resistentie van sunitinib en andere anti-angiogene TKIs. Deze bevindingen
kunnen leiden tot nieuwe behandelingsmogelijkheden, zoals het combineren van
sunitinib met middelen die de functie van lysosomen verstoren, het wisselen naar
andere medicijnen waartegen geen kruisresistentie is waargenomen, en/ of het
opnieuw behandelen van patiënten met hetzelfde middel na een onderbreking. Deze
(nieuwe) behandelingsstrategieën zouden resistentie van sunitinib en andere TKIs
kunnen voor- of overkomen. Hopelijk leidt dit uiteindelijk tot effectievere
behandelings-mogelijkheden voor patiënten met kanker.
Dankwoord
148
Dankwoord
Dit meest gelezen onderdeel van een proefschrift komt toe aan een ieder die op
welke manier dan ook heeft bijgedragen aan mijn promotieonderzoek en dit boekje.
Er zijn ontzettend veel mensen om te bedanken, dus: BEDANKT ALLEMAAL! Een
aantal mensen wil ik toch graag even bij naam en toenaam noemen.
Mijn promotor, prof. dr. H.M.W. Verheul: Beste Henk, hartelijk bedankt dat jij me de
mogelijkheid hebt gegeven om onder jouw hoede te promoveren. Wat heb ik het
getroffen met jou als promotor. Ik heb er dan ook zeker geen spijt van dat ik na
slechts een paar maanden in Utrecht te hebben gezeten met jou als copromotor,
besloten heb om jou te volgen naar Amsterdam om hier te starten als je eerste
‘eigen’ promovendus. Ik heb het je vast niet altijd even makkelijk gemaakt en je hebt
zo nu en dan met mijn eigengereidheid heel wat te stellen gehad. Maar met veel
dank aan jouw relativerende blik en altijd motiverende besprekingen/ telefoontjes/
mails, is het uiteindelijk goed gekomen, want zie hier: het boekje is er gekomen!
Henk, wat heb jij een mensenkennis, ik waag me niet meer aan weddenschappen met
jou, of “dat gaat echt niet gebeuren”, want wedden dat ik dat ga verliezen! En jouw
immer oprechte interesse in je medemens heb ik altijd erg gewaardeerd!
Prof. dr. G.J. Peters: Beste Frits, als tweede promotor ben je, zeker in de eerste fase
van mijn onderzoek, onmisbaar geweest. Bedankt voor de hartelijke ontvangst in
jouw groep, na de verhuizing naar het CCA. Ook bedankt voor de input die ik van jou
ondermeer tijdens de farmacologie- werkbesprekingen mocht ontvangen.
De leden van de promotiecommissie, prof. dr. R. Pili, dr. N. van Erp, prof. dr. P.O.
Witteveen, dr. A. Bergman, prof. dr. A.W. Griffioen en dr. Broxterman, wil ik hartelijk
bedanken voor de tijd en aandacht die zij aan mijn proefschrift hebben besteed. I
would like to thank the members of the PhD committee, prof. dr. R. Pili, dr. N. van
Erp, prof. dr. P.O. Witteveen, dr. A. Bergman, prof. dr. A.W. Griffioen en dr.
Broxterman, for their time and effort that they have invested in the evaluation of my
thesis.
Een speciaal woord van dank voor dr. Broxterman. Beste Henk, in de praktijk ben je
min of meer mijn co-promotor geweest. Heel hartelijk bedankt voor al je input voor
dit onderzoek, je voortdurende kritische blik, je sturing, je uitmuntende kennis van de
literatuur, je discussies over welke weg in te slaan, je schrijfhulp bij de artikelen en al
je onbenoembare hulp van de afgelopen jaren.
Prof. dr. A.W. Griffioen, beste Arjan, toen jij met een heel onderzoeksteam uit
Maastricht naar Amsterdam kwam, heb ik de overstap gemaakt van de farmacologie

Dankwoord
149
naar de angiogenese groep. Wat een kennis hebben jij en je team meegenomen naar
het CCA. Ik wil je hartelijk bedanken voor de nuttige discussies en je waardevolle
input tijdens de werkbesprekingen of gewoon ergens tussendoor.
Prof. dr. R. Pili, dear Roberto, thank you for the fruitful collaboration over the years
and for giving me the opportunity to work at the Roswell Park Cancer Institute. I
really appreciate your willingness to come to Amsterdam for my thesis defense, and
I’m looking forward to see you soon.
Iris en Mariette, wat vind ik het geweldig dat jullie mijn paranimfen willen zijn.
Ondanks dat we elkaar de laatste tijd niet veel gesproken hebben, zijn jullie tijdens
het grootste deel van mijn promotie erg belangrijk voor me geweest, zowel op werk
gebied als op sociaal vlak. De eer komt jullie geheel toe! Iris, we hebben heel veel ins
en outs van het promotietraject gedeeld, bergen en dalen, afwijzingen en publicaties,
werken en ontspannen. Kommetje melk, vakantie-accent, beenwarmers, route-
planner op de fiets om de weg naar huis te vinden, Washington: het zijn zomaar een
paar woorden als ik aan onze tijd samen denk, al vergeet ik vast wat typerende
dingen. Ik vind het nog steeds ontzettend knap van je dat jij je promotie zo goed hebt
weten af te ronden. En Mariette, wanneer sta jij je proefschrift te verdedigen? Ik
weet nog goed dat ik je mocht inwerken op het lab en je de kneepjes van het
pipetteren mocht leren. Maar je hebt bewezen dat artsen ook best kunnen
pipetteren :-p. Ik bewonder je hoe jij al je verschillende werkzaamheden in de kliniek,
lab en thuis weet te combineren! Verder ben ik je veel dank verschuldigd voor
hoofdstuk 6: het oneindige pamgene stuk/ methods paper/ kinase artikel.
Een aantal collega’s wil ik graag extra bedanken voor hun hulp tijdens mijn promotie.
Richard de Haas, jij hebt zoveel labwerk in dit boekje verricht, jij hoort eigenlijk ook
paranimf te zijn, maar ik weet dat ik je daar geen plezier mee zou doen. Een eervolle
vermelding in dit dankwoord zal je waarschijnlijk meer kunnen waarderen. Dus
Richard, ontzettend bedankt voor je vele blotjes, ontelbare MTT assays, en al het
andere werk dat je voor mij hebt gedaan.
Henk Dekker, jij bent de derde Henk die onmisbaar is geweest voor dit boekje. Je
bent een echt manusje van alles, en ik heb je voor de meest uiteenlopende vragen/
problemen/ praktische vaardigheden/ computerkennis weten te vinden. Veel dank
voor je al je hulp.
Richard Honeywell, thank you for all the LC-MS/MS analyses you performed to
measure TKI amount.
Kaamar, bedankt voor je hulp met de laatste submissies, omzetten van artikelen,
correcties of gewoon meedenken tijdens de laatste fase van mijn promotie.

Dankwoord
150
Iris, Mariette, Henk D, Kaamar, Maudy, Maarten, Maria en Jennifer: Ik heb roomies
zien komen en gaan, maar roomie van CCA 2.40 blijf je voor altijd . Bedankt voor de
supergezellige tijd! Maria, I love your sense of humor, en ik ben benieuwd hoe
vloeiend je al Nederlands spreekt.
Ook in de ‘aangrenzende’ kamers en labs viel er altijd wat te beleven (lees: er werd
áltijd heel serieus gewerkt en overleg was áltijd werktechnisch van aard), dus ook de
andere lieve collega’s, Kitty, Yvette, Esther, Madelon, Koen, Ed, Tse, Victor, Judy, Roy,
Rajshri, Maaike en Linda: bedankt voor al jullie wetenschappelijk input, semi-
wetenschappelijke discussies, en niet-wetenschappelijke gezelligheid. Kitty en Yvette,
bedankt voor de nodige mentale ondersteuning op het kweeklab. Heeft één van jullie
wel eens bedacht hoeveel uur we daar samen hebben doorgebracht? Ik wil het niet
weten…
De collega’s van de eerste verdieping wil ik graag bedanken voor de gezellige lunches,
en ook lekkersdag niet te vergeten: Simone, Saskia, Kees, Ietje, Elisa, Nienke en
Leonie: Bedankt!
Verder wil ik iedereen bedanken die ik hier vergeten ben te noemen, maar aan wie ik
toch mijn dank verschuldigd ben; (oud-) collega’s van de angiogenese, farmacologie,
onco-proteomics, immunotherapie of één van de andere groepen van het lab
medische oncologie: Bedankt voor de gezellige tijd en jullie wetenschappelijk input!
Ook de mensen in Utrecht, waar ik toch mijn promotieonderzoek ben begonnen, wil
ik bedanken voor de fijne start: Jeanine, Marlies, Sander, Joost, Stephanie, Judith,
Rachel, René en Emile. Leuk dat we elkaar na die tijd nog her en der zijn
tegengekomen.
I am very grateful to my colleagues and friends in Buffalo who made my stay a very
special time: Paula, Remi, Swathi, Li, Marie, Sheng-Yu, Leigh and Alejandro. Paula and
Alejandro, thank you for introducing me to the Irish pub, barbecue dinners, your
friends, and some weird American traditions; you made my stay wonderful. Wish you
all the best in Chile!
Ik wil graag de studenten Zhen, Lisette en Dennis bedanken die ik heb mogen
begeleiden en/of die mij geholpen hebben bij het praktische werk. Dennis, heel leuk
dat je terug bent gekomen bij het VUmc en veel succes met je eigen onderzoek.
De vele vrienden en vriendinnen die mij al deze jaren hebben gesteund, ver weg en
dichtbij, maar altijd geïnteresseerd hoe het met mijn promotieonderzoek ging en
soms ook tot vervelends toe hebben gevraagd of ik nu al klaar was in Amsterdam:
lieve Kippen, Warnsveldse vriendinnetjes (waarvan niemand meer in Warnsveld
woont), Boegen, Salaciaantjes, Martijns ‘oude’ vrienden en Martijns ‘jonge’ vrienden

Dankwoord
151
(haha, jullie weten wie ik bedoel), allemaal bedankt! Ik ben heel benieuwd wat jullie
van zo’n proefschrift en promotie vinden.
Ook veel dank aan mijn familie en schoonfamilie:
Pap en mam, bedankt voor alles. Jullie hebben me altijd vrij gelaten in mijn eigen
keuzes, gestimuleerd om me te ontwikkelen, mij achterna gereisd voor een bezoekje
aan andere kanten van de wereld. Bedankt voor alle steun de afgelopen jaren! Jan en
Hermien, bedankt voor jullie interesse in het onderzoek en voor jullie hulp tussen alle
bedrijven door. Lieve (schoon)ouders, ook bedankt voor alle oppas-uren, waar ik
jullie, zeker de laatste tijd, mee opgezadeld heb. Heel fijn, dat ik de kinderen zo vaak
bij jullie heb mogen ‘droppen’. Marina en Jurgen, Jon en Roelie, Frederike en Marco,
Anne-marie en Henk, Robert en Marijke: bedankt voor jullie medeleven! Robert,
extra woord van dank voor jouw laatste check!
Tot slot, het allerbelangrijkste: mijn mannen!
Jurre en Sjoerd, jullie hebben er geen flauw benul van, maar jullie hebben het mij niet
altijd even makkelijk gemaakt om mijn promotie te voltooien ;-). Toch ben ik jullie
ontzettend dankbaar, gewoon, door er te zijn. Wat is het genieten met jullie!
Lieve Martijn, zonder jou was dit boekje er nooit gekomen. Ik weet niet meer hoe
vaak je tegen mij hebt gezegd dat ik nog ‘even’ door moest zetten. Ik ben je zó
dankbaar voor je steun, je opbeurende woorden, je vertrouwen, je hulp bij de
opmaak, je warmte, én voor je liefde; ik ben je onbeschrijfelijk dankbaar voor alles!

Curriculum Vitae
152
Curriculum Vitae
Kristiane Johanne Gotink (Kristy) was born on August 9th 1983 in Warnsveld, The
Netherlands. She graduated from secondary school (Atheneum) at the Baudartius
College in Zutphen in 2001. She continued her education at the Radboud University in
Nijmegen, where she studied Biomedical Sciences. During her Master studies, which
was focused on pathology (major specialization) and oncology (minor specialization),
she performed an internship at the research department of intensive care (Radboud
University Nijmegen Medical Center, headed by prof. dr. JG van der Hoeven), which
focused on microcirculation and endotoxin-tolerance in humans. A second internship
was performed at the department of pathology (Radboud University Nijmegen
Medical Center, headed by prof. dr. JH van Krieken) under the supervision of dr. PJ
Groenen and dr. M Schraders. This internship was about the role of mitochondria and
apoptosis in mantle cell lymphoma. She obtained her Master of Science (MSc) degree
in 2007. After starting as a PhD student at the University Medical Center in Utrecht,
she continued her PhD training at the VU University Medical Center in Amsterdam
(dept. of medical oncology) under supervision of prof. dr. HMW Verheul (first
promoter) and prof. dr. GJ Peters (second promoter). During her PhD training, she
performed a research fellowship at the Roswell Park Cancer Institute (RPCI), Buffalo,
NY, USA, at the department of medicine, genitourinary section, under the supervision
of prof. dr. R. Pili. During this time, she studied resistance to sunitinib in vivo. The
results of her PhD project are described in this thesis, entitled “Tumor cell resistance
to antiangiogenic receptor tyrosine kinase inhibitors”.

List of publications
153
List of publications
Labots M, Gotink KJ, Dekker H, Azijli K, van der Mijn JC, Huijts CM, Piersma SR,
Jiménez CR, Verheul HMW. Evaluation of a tyrosine kinase peptide microarray for TKI
therapy selection in cancer. Submitted.
Azijli K, Gotink KJ, Verheul HMW. The potential role of lysosomal sequestration in
sunitinib resistance of renal cell cancer. Journal of Kidney Cancer and VHL; in press.
Gotink KJ, Rovithi M, de Haas RR, Honeywell RJ, Dekker H, Poel D, Azijli K, Peters GJ,
Broxterman HJ, Verheul HMW. Cross-resistance to clinically used tyrosine kinase
inhibitors sunitinib, sorafenib and pazopanib. Cellular Oncology 2015;38(2)119-29.
Gotink KJ, Broxterman HJ, Honeywell RJ, Dekker H, de Haas RR, Miles KM, Adelaiye R,
Griffioen AW, Peters GJ, Pili R, Verheul HMW. Acquired tumor cell resistance to
sunitinib causes resistance in a HT-29 human colon cancer xenograft mouse model
without affecting sunitinib biodistribution or the tumor microvasculature.
Oncoscience 2014;1(12):844-53.
Gotink KJ, Broxterman HJ, Labots M, de Haas RR, Dekker H, Honeywell RJ, Rudek MA,
Beerepoot LV, Musters RJ, Jansen G, Griffioen AW, Assaraf YG, Pili R, Peters GJ,
Verheul HMW. Lysosomal sequestration of sunitinib: a novel mechanism of drug
resistance. Clinical Cancer Research 2011;17(23):7337-46.
Erratum in: Clinical Cancer Research 2012;18(1):318.
Gotink KJ, Verheul HMW. Anti-angiogenic tyrosine kinase inhibitors: what is their
mechanism of action? Angiogenesis 2010;13(1):1-14.
Broxterman HJ, Gotink KJ, Verheul HMW. Understanding the causes of multidrug
resistance in cancer: a comparison of doxorubicin and sunitinib. Drug Resistance
Updates 2009;12 (4-5):114-26.