Tumor pathogenesis Oncogenes Tumor suppressor genes Invasion and Metastasis

Page 1/49
Hub Genes and Key Pathway Identi�cation in WilmsTumor Based on Bioinformatics AnalysisBasavaraj Vastrad
Department of Biochemistry, Basaveshwar College of Pharmacy, Gadag, Karnataka 582103, India.https://orcid.org/0000-0003-2202-7637
Chanabasayya Vastrad ( [email protected] )Biostatistics and Bioinformatics, Chanabasava Nilaya, Bharthinagar, Dharwad 580001, Karanataka,
India. https://orcid.org/0000-0003-3615-4450Iranna Kotturshetti
Department of Ayurveda, Rajiv Gandhi Education Society`s Ayurvedic Medical College, Ron, Karnataka562209, India. https://orcid.org/0000-0003-1988-7345
Research Article
Keywords: protein–protein interaction, gene expression, Wilms tumor, pathways, differentially expressedgenes
Posted Date: December 22nd, 2020
DOI: https://doi.org/10.21203/rs.3.rs-133323/v1
License: This work is licensed under a Creative Commons Attribution 4.0 International License. Read Full License

Page 2/49
AbstractWilms tumor (WT) is a childhood kidney cancer with unknown etiology. Gene expression analysis hasbecome very essential in WT. Thus, we performed an integrated analysis of gene expression data toidentify new molecular mechanisms and key functional genes in WT. Gene expression (GSE60850)dataset was downloaded from Gene Expression Omnibus. Differentially expressed genes (DEGs) wereidenti�ed using limma. Pathway and Gene Ontology (GO) enrichment analyses were performed for theDEGs by ToppGene database. Then, protein–protein interaction (PPI) networks and modules wereestablished by the Mentha database and PEWCC1, and visualized by Cytoscape software. Target gene -miRNA regulatory network and target gene - TF regulatory network were established by the NetworkAnalyst database and visualized by Cytoscape software. Finally, survival analysis, expressionanalysis, stage analysis, mutation analysis, immunohistochemical (IHC) analysis, receiver operatingcharacteristic (ROC), reverse transcription polymerase chain reaction (RT-PCR) and immune in�ltrationanalysis of hub genes was performed. We identi�ed 988 DEGs ultimately including 502 up regulatedgenes and 486 down regulated genes. Pathway and GO enrichment analysis revealed that DEGs weremainly enriched in D-myo-inositol (3,4,5,6)-tetrakisphosphate biosynthesis, platelet activation, cholesterolbiosynthesis III, and complement, coagulation cascades, embryo development, cell surface, DNA-bindingtranscription factor activity, carboxylic acid metabolic process, extracellular space and signaling receptorbinding. FN1, AURKA, TRIM41, NFKBIA, TXNDC5, SIN3A, MAGI1, GPRASP2, UCHL1 and FXYD6 were�ltrated as the hub genes. These identi�ed DEGs and hub genes facilitate our knowledge of theunderlying molecular mechanism of WT and have the potential to be used as diagnostic and prognosticbiomarkers or therapeutic targets for WT.
IntroductionWilms tumor (WT) is the rare diagnosed pediatric tumor worldwide and is named as nephroblastoma [1].WT is form of kidney cancer that mostly advances in children under age under 10 years [2]. Because ofroutine early screening and recent advances in treatment techniques, long-term survival rates haveupgraded [3]. However, in developing countries, most WT patients are diagnosed at an end stage, withpoor prognosis [4]. Therefore, further studies should still be emphasized for the early diagnoses,prognosis and targeted therapy of WT.
Genetic aberrations and its related pathways have been reported to be signi�cant factors contributing tothe progression of WT. Genes such as IGF2 [5], WT1 [6], RASSF1A [7], PAF1 [8], and DROSHA and DICER1[9] as well as signaling pathways such as WNT/β‐catenin pathway [10], IGF signaling pathway [11], S1P/S1P1 signaling pathway [12], PTEN/PI3K/AKT signaling pathway [13] and VEGF‐C/VEGFR‐2signaling pathway [14] were responsible for pathogenesis of WT. Despite improvement and progress inWT diagnosis, prognosis and treatment, the underlying WT molecular mechanisms are not entirely clear

Page 3/49
and novel diagnosis, prognosis and treatment options are still needed for more effective control of WTdevelopment.
Gene expression pro�le analysis is a high-throughput method for detecting messenger RNA expression invarious cancer tissues or cell samples. By analyzing the different gene expression between cancerpatients and normal controls, an improved understanding of the molecular mechanism of a varioustumors can be obtained, facilitating the identi�cation of the potential key genes and pathways fordiagnostics markers, prognostics markers and targeted therapy [15-16].
The current study aimed to explore the molecular pathogenesis of WT by a computational bioinformaticsanalysis of gene expression. Gene expression data from the Gene Expression Omnibus (GEO) databasewas extracted, and differentially expressed genes (DEGs) between WT and normal samples wereidenti�ed. The possible functions of the DEGs were predicted using pathway and gene ontology (GO)enrichment analysis. Furthermore, protein-protein interaction (PPI) networks were constructed usingmentha PPI database, and visualized and module analysis was conducted using Cytoscape software tosearch for essential hub genes that may be associated in the progression of WT. Dysregulation ofmicroRNAs (miRNAs) and transcription factors (TFs) have been indicated to be associated with thepathogenesis of WT, the WT speci�c regulatory networks of target gene and miRNA, and target gene andTFs were constructed. Validation of the hub genes was performed to screen genes with prognostic anddiagnostics signi�cance in WT.
Materials And MethodsMicroarray data
Human gene expression microarray data of WT samples (n = 36) and normal samples (n = 36) wereobtained from the Gene Expression Omnibus (GEO, https://www.ncbi.nlm.nih.gov/geo/) with anaccession ID of GSE60850. The platform of GSE60850 is GPL19130 Breakthrough Human 17K 2.1.2.
Data preprocessing
The raw data in GSE60850 were preprocessed using limma [17], an R software package and itimplemented background correcting, quantile normalization and expression calculation automatically.Then, probe values were translated to gene-symbol values based on message associated in microarrayplatform, and probes without proper gene-symbols were excluded.
Differentially Expressed Genes
Based on the gene expression microarray data, DEGs between WT samples and normal samples wereidenti�ed using limma [17], an R software package. The corresponding p-values were calculated using t-test provided by limma. The genes met the criteria of p-value<0.05 and |log2 fold change (FC)|≥1.22 forup regulated genes and |log2 fold change (FC)|≥ -1.39 for down regulated genes were de�ned assigni�cant DEGs between the two groups.

Page 4/49
Pathway enrichment analysis of DEGs
BIOCYC (https://biocyc.org/) [18], Kyoto Encyclopedia of Genes and Genomes (KEGG;http://www.genome.jp/kegg/) [19], Pathway Interaction Database (PID, http://pid.nci.nih.gov/) [20],Reactome (https://reactome.org/PathwayBrowser/) [21], Molecular signatures database (MSigDB,http://software.broadinstitute.org/gsea/msigdb/) [22], GenMAPP (http://www.genmapp.org/) [23],Pathway Ontology (https://bioportal.bioontology.org/ontologies/PW) [24] and PantherDB(http://www.pantherdb.org/) [25] database are used to understand the high-level functions and utilitiesof the biological system. ToppGene (ToppFun) (https://toppgene.cchmc.org/enrichment.jsp) [26] is acomprehensive set of functional annotation tools for researchers to understand biological meaningbehind large scale of genes. P < 0.05 was set as the cut-off criterion.
GO enrichment analysis of DEGs
GO (http://www.geneontology.org/) [27] enrichment analysis is a universal genes analysis method, whichcan contribute functional classi�cation for genomic data, including categories of BPs, cellular component(CC), and molecular function (MF). ToppGene (ToppFun) (https://toppgene.cchmc.org/enrichment.jsp)[26] is an online tool for gene functional classi�cation, which can systematic and integrative analysis oflarge gene lists. In this study, to analyze the functions of DEGs, GO enrichment analysis were conductedusing the ToppGene online tool; p < 0.05 was set as the cutoff point.
PPI network construction and module analysis
Mentha (https://mentha.uniroma2.it/index.php) [28] was an online biological tool which had a major rolein the analysis of biological information and integrates different PPI database such as IntAct(https://www.ebi.ac.uk/intact/) [29], MINT (https://mint.bio.uniroma2.it/) [30], BioGRID(https://thebiogrid.org/) [31], DIP (http://dip.doe-mbi.ucla.edu/dip/Main.cgi) [32] and MatrixDB(http://matrixdb.univ-lyon1.fr/) [33]. As a result, based on the STRING database, a protein–proteininteraction (PPI) network of WT was built. PPIs of DEGs (up and down regulated genes) were selectedwith a combination score >0.9. Subsequently, the PPI network was input into Cytoscape(http://www.cytoscape.org/) (version: 3.7.2) [34]. Five topological methods (node degree, betweennesscentrality, stress centrality, closeness centrality and clustering coe�cient ) using to rank and evaluatedhub genes using network analyzer [35-39] and modules analysis were taken using PEWCC1 of Cytoscapeplugin [40].
Construction of target gene - miRNA regulatory network
The target genes - miRNA interactions were predicted with NetworkAnalyst(https://www.networkanalyst.ca/) [41], which involves two miRNA databases such as DIANA-TarBase(http://diana.imis.athena-innovation.gr/DianaTools/index.php?r=tarbase/index) [42] and miRTarBase(http://mirtarbase.mbc.nctu.edu.tw/php/download.php) [43]. Subsequently, the target genes - miRNAregulatory network was input into Cytoscape (version: 3.7.2) [34].

Page 5/49
Construction of target gene - TF regulatory network
Experimentally-validated target genes and their TFs were screened in one TF database ChEA database(http://amp.pharm.mssm.edu/lib/chea.jsp) [44]. TFs that have a regulatory relationship with the targetgenes in the constructed network were identi�ed. The NetworkAnalyst (https://www.networkanalyst.ca/)[41] online tool was used to predict TF-regulating genes in the network. Cytoscape (version: 3.7.2) [34], anopen-source platform for visualizing complex networks, was used to visualize target genes - TF regulatorynetwork.
Validation of hub genes
The survival probability study was implemented using Kaplan-Meier method to compare overall survivalcurves between high and low expression gene groups UALCAN (https://ualcan.path.uab.edu/index.html)online dataset [45], which is a user-friendly, interactive web resource for the analysis of cancertranscriptome data.. P<0.05 was considered to indicate a statistically signi�cant difference. Theexpression analysis and stage analysis of hub genes were analyzed using UALCAN online dataset [45]. The mutation frequencies of up and down hub genes were inquired in cBioportal online database(http://www.cbioportal.org/) [46]. In addition, up and down regulated hub genes were further validated fortheir prognostic values (immunohistochemical (IHC) analysis in normal and cancer tissue) using TheCancer Genome Atlas database (https://www.proteinatlas.org/) [47]. Receiver operating characteristic(ROC) analyses are generally used to check out the conduct of disease diagnosis and prognosis. Thearea under the curve (AUC) was used to demonstrate the accuracy of an individual gene for predictingrecurrence using R package“pROC” [48]. Reverse transcription polymerase chain reaction (RT-PCR) wascarried out for validation of up and down regulated hub genes. Total RNA was extracted from the WTtissue sample and normal kidney tissue samples using TRI Reagent® (Sigma, USA) according to themanufacturer's protocol. A RNA was reverse transcribed into cDNA using FastQuant RT kit (with gDNase;Tiangen Biotech Co., Ltd.), according to the manufacturer's protocol. The primer sequences (Genewiz,Inc.) used for RT-PCR are listed in Table 1. The mRNA expression levels of hub genes were measured by Real time-PCR using the QuantStudio 7 Flex real-time PCR system (Thermo Fisher Scienti�c, Waltham,MA, USA) . The following reaction conditions were used for RT-PCR: Initial denaturation at 95˚C for 3 minfollowed by 40 cycles of denaturation at 95˚C for 10 sec and annealing and elongation at 60˚C for 30 sec.The relative expression levels of up and down regulated hub genes were determined using the 2 -ΔΔCt
method [49] and normalized to the internal reference gene, β-actin. Immune in�ltration analysis wasperformed using the TIMER (https://cistrome.shinyapps.io/timer/) [50] is a RNA-Seq expression pro�lingdatabase from The Cancer Genome Atlas (TCGA) portal for up and down regulated hub genes, which isused to check the immune in�ltrates (B cells, CD4+ T cells, CD8+ T cells, neutrophils, macrophages, anddendritic cells) across WT.
ResultsIdenti�cation of DEGs

Page 6/49
After data, including 36 WT samples and 36 normal samples, was downloaded from GEO database andpreprocessed. The results before and after normalization are shown Fig. 1A and Fig. 1B. 988 DEGs,including 486 up genes and 502 down genes were identi�ed using limma packages on the basis of thecut off criteria (P<0.05 and |log2 fold change (FC)| > 1.39 for up regulated genes and |log2 fold change(FC)| < -1.22 for down regulated genes) in WT samples compared with normal samples (Table 1). Thevolcano plot showed the up regulated and down regulated genes in dataset GSE60850 is shown in Fig. 2.The details of up and down regulated gene expression heat map are shown in Fig. 3 and Fig. 4.
Pathway enrichment analysis of DEGs
Pathway enrichment analysis of the DEGs (up and down regulated genes) was performed usingToppGene. Pathways were identi�ed for the up regulated genes, including the cholesterol biosynthesis III(via desmosterol), superpathway of methionine degradation, complement and coagulation cascades,ECM-receptor interaction, FOXA1 transcription factor network, direct p53 effectors, hemostasis,extracellular matrix organization, phenylalanine tyrosine and tryptophan biosynthesis, tyrosinemetabolism, ensemble of genes encoding extracellular matrix and extracellular matrix-associatedproteins, genes encoding enzymes and their regulators involved in the remodeling of the extracellularmatrix, plasminogen activating cascade, blood coagulation, altered lipoprotein metabolic,gluconeogenesis pathway, phenylalanine and tyrosine metabolism. Similarly, pathways were identi�edfor the up regulated genes including the D-myo-inositol (3,4,5,6)-tetrakisphosphate biosynthesis, 1D-myo-inositol hexakisphosphate biosynthesis V (from Ins(1,3,4)P3), platelet activation, protein digestion andabsorption, endothelins, alpha-synucleinsignaling, extracellular matrix organization, degradation of theextracellular matrix, MAP kinase kinase activity, glycolysis, gluconeogenesis, ensemble of genes encodingextracellular matrix and extracellular matrix-associated proteins, ensemble of genes encoding coreextracellular matrix including ECM glycoproteins, collagens and proteoglycans, Wnt signaling pathway,integrin signalling pathway, activinsignalin, parkinson disease, quinapril pathway and diltiazem pathway. The detailed results of pathway enrichment analysis for up and down regulated genes are presented inTable 2 and Table 3.
GO enrichment analysis of DEGs
All up and down regulated genes were uploaded to the ToppGene software to identify GO function. GOenrichment analysis results for up and down regulated genes are presented in Table 4 and Table 5. Forbiological processes (BP), the top GO terms of up and down regulated genes were signi�cantly enrichedin carboxylic acid metabolic process, oxoacid metabolic process, embryo development and animal organmorphogenesis, were included. For cell component (CC), top GO terms of up and down regulated genes were signi�cantly enriched in cell surface, endoplasmic reticulum, neuron projection and neuron part. Formolecular function (MF), the top GO terms of up and down regulated genes were signi�cantly enriched in signaling receptor binding, identical protein binding, DNA-binding transcription factor activity andcalcium ion binding.
PPI network construction and module analysis

Page 7/49
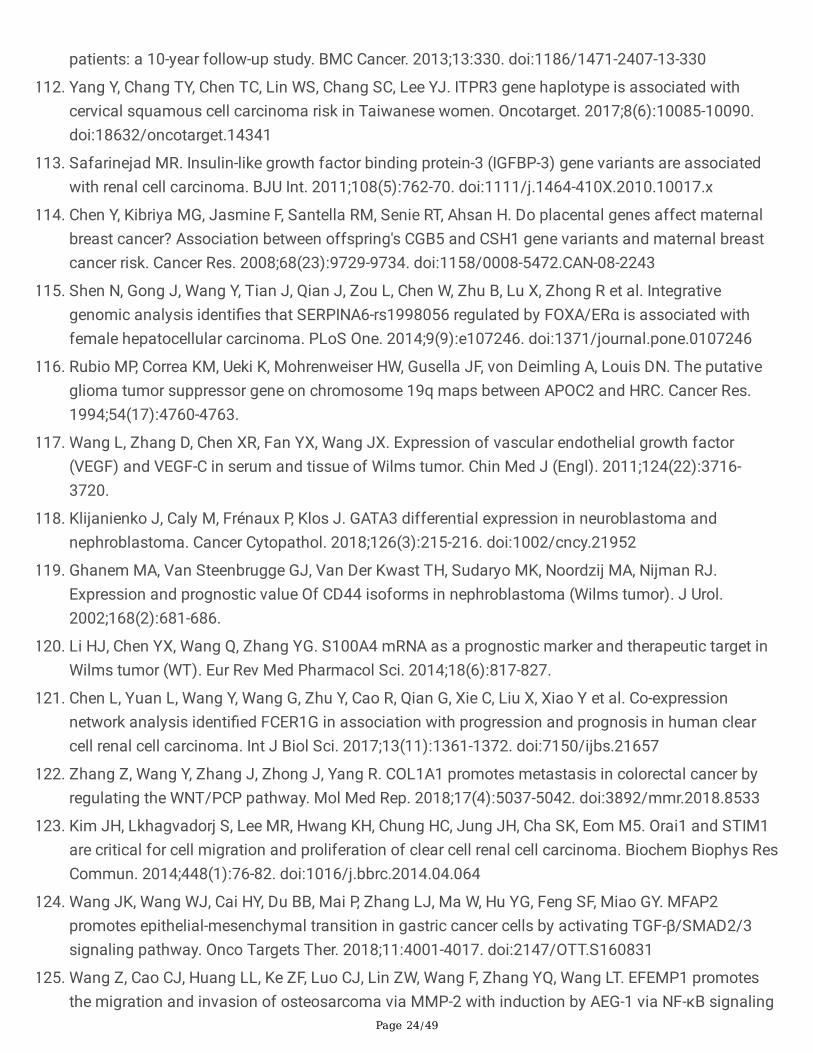
The Mentha PPI database was used to construct PPI networks. The PPI network of the up regulatedgenes is illustrated in Fig. 5 with 7649 nodes and 17236 edges. The topology analysis (higest nodedegree distribution, betweenness centrality, stress centrality, closeness centrality and lowest clustringcoe�cient) for up regulated genes showed that ESR1, FN1, AURKA, SMURF1, PDK1, NANOG, SLC25A5,NUDT21, KCNQ3, ADM, CEL, CXCL3 and GABRA5 were the hub genes (Table. 6) and statistical results inscatter plot for node degree distribution, betweenness centrality, stress centrality, closeness centrality andclustring coe�cient are shown in Fig. 6A - 6E. These identi�ed hug genes were enriched in neuron part,ECM-receptor interaction, metabolism of proteins, negative regulation of response to stimulus, carboxylicacid metabolic process, response to oxygen-containing compound, programmed cell death, identicalprotein binding, cell surface, signaling receptor binding, metabolic pathways, ensemble of genesencoding extracellular matrix and extracellular matrix-associated proteins, and regulation of response tostress. Similarly, PPI network of the down regulated genes is illustrated in Fig. 7 with 7691 nodes and16050 edges. The topology analysis (higest node degree distribution, betweenness centrality, stresscentrality, closeness centrality and lowest clustring coe�cient) for down regulated genes showed that VCAM1, DDIT4L, TCF4, PLK1, RB1, MEOX2, SYK, PLXDC1, TCF7L2, MAPK10, MAGI1 and MRPL15 werethe hub genes (Table. 6) and statistical results in scatter plot for node degree distribution, betweennesscentrality, stress centrality, closeness centrality and clustring coe�cient are shown in Fig. 8A - 8E. Theseidenti�ed hug genes were enriched in cell adhesion molecules (CAMs), regulation of Wnt-mediated betacatenin signaling and target gene transcription, FoxO family signaling, regulation of retinoblastomaprotein, embryo development, animal organ morphogenesis, ensemble of genes encoding extracellularmatrix and extracellular matrix-associated proteins, pathways in cancer, innate immune system and ATPbinding.
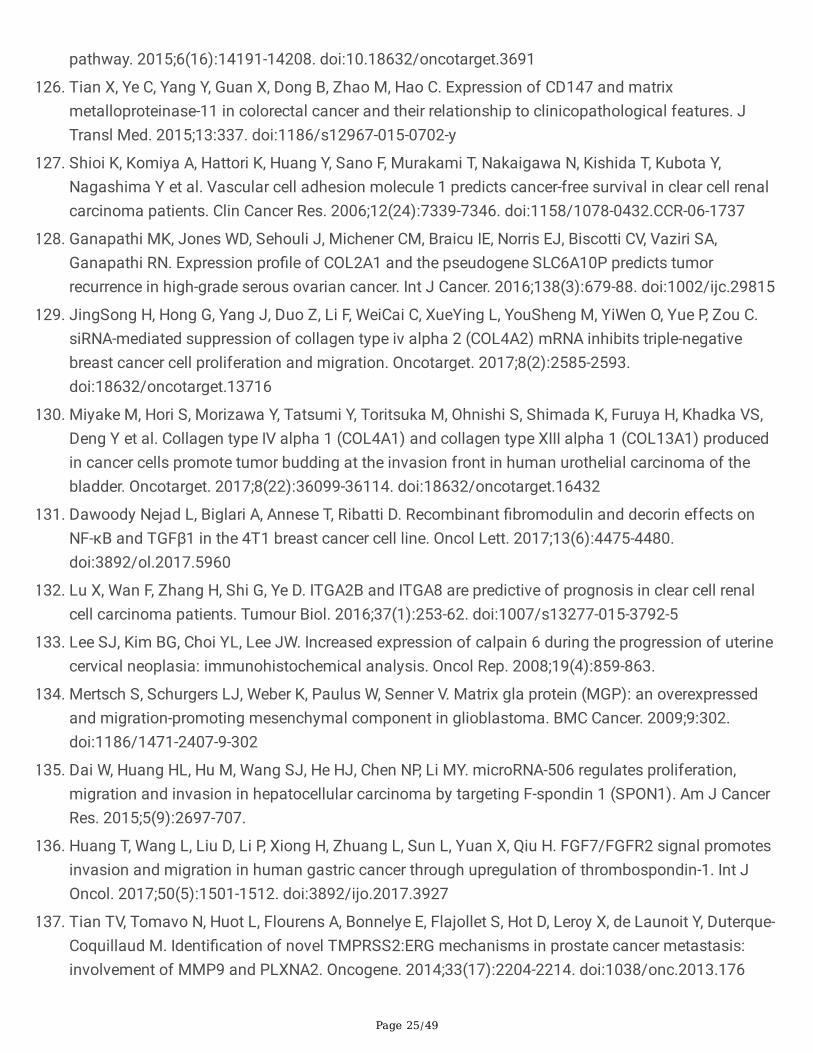
Based on the hub genes (up and down regulated) from the PPI module, pathway and GO terms for furtheranalysis. We chose the four most signi�cant modules (up regulated genes) for further analysis (Fig.9).Module 14 consisted of 174 nodes and 311 edges, module 24 consisted of 131 nodes and 144 edges,module 39 consisted of 113 nodes and 111 edges, and module 40 consisted of 97 nodes and 99 edges.Hub genes in these PPI modules were mainly enriched in the ECM-receptor interaction, metabolism ofproteins, negative regulation of response to stimulus, programmed cell death, response to endogenousstimulus, neuron part, protein-containing complex binding, focal adhesion, proteoglycans in cancer,regulation of cell differentiation, signaling receptor binding, enzyme regulator activity, carboxylic acidmetabolic process, regulation of response to stress, metabolism of amino acids and derivatives,metabolism of lipids and lipoproteins, cell motility and enzyme binding. Finally, we chose the four mostsigni�cant modules (down regulated genes) for further analysis (Fig.10). Module 17 consisted of 145nodes and 186 edges, module 24 consisted of 122 nodes and 188 edges, module 34 consisted of 100nodes and 117 edges, and module 40 consisted of 93 nodes and 95 edges. Hub genes in these PPImodules were mainly enriched in the pathways including DNA-binding transcription factor activity,transcription regulatory region DNA binding, sequence-speci�c DNA binding, pathways in cancer,extracellular matrix organization, hemostasis, innate immune system, PDGFR-beta signaling pathway,cytokine signaling in immune system, signaling receptor binding, molecular function regulator, Wnt

Page 8/49
signaling pathway, embryo development, neurogenesis, regulation of cell differentiation, positiveregulation of multicellular organismal process and cell surface.
Construction of target gene - miRNA regulatory network
Based on the interaction information of target genes and miRNAs in corresponding miRNA databases, theintegrated regulatory network of target genes (up and down regulated) and relevant miRNAs wereconstructed (Fig. 11 and Fig. 12). We found that up regulated target genes such as CCND1 can betargeted by 197 miRNAs (ex, hsa-mir-2392), SCD can be targeted by 167 miRNAs (ex, hsa-mir-1269a),PTP4A1 can be targeted by 132 miRNAs (ex, hsa-mir-6731-5p), LDLR can be targeted by 123 miRNAs(ex, hsa-mir-4295) and RRM2 can be targeted by 102 miRNAs (ex, hsa-mir-4458) are listed in Table 7.These identi�ed target genes were enriched in focal adhesion, PPAR signaling pathway, cell motility,organic substance catabolic process and superpathway of purine nucleotide salvage. Similarly, we foundthat down regulated target genes such as ZNF703 can be targeted by 115 miRNAs (ex, hsa-mir-3938),ENPP5 can be targeted by 114 miRNAs (ex, hsa-mir-4768-3p), MYLIP can be targeted by 113 miRNAs (ex,hsa-mir-552-5p), ENAH can be targeted by 92 miRNAs (ex, hsa-mir-4282) and ZBTB20 can be targeted by85 miRNAs (ex, hsa-mir-4282) are listed in Table 7. These identi�ed target genes were enriched inregulation of multicellular organismal development, integral component of plasma membrane, adaptiveimmune system, axon guidance and positive regulation of multicellular organismal process.
Construction of target gene - TF regulatory network
Based on the interaction information of target genes and TFs in corresponding TF database, theintegrated regulatory network of target genes (up and down regulated) and relevant TFs were constructed(Fig. 13 and Fig. 14). We found that up regulated target genes such as MAGEC2 can be targeted by 207TFs (ex, SOX2), TSPAN7 can be targeted by 173 TFs (ex, MYC), ESR1 can be targeted by 172 TFs (ex,HNF4A), PCSK6 can be targeted by 166 TFs (ex, EGR1) and LDLR can be targeted by 145 TFs (ex, TP63)are listed in Table 8. These identi�ed target genes were enriched in organic substance catabolic process,intrinsic component of plasma membrane, neuron part, golgi apparatus and identical proteinbinding.Similarly, we found that down regulated target genes such as PLEKHO1 can be targeted by 184TFs (ex, SOX2), CACHD1 can be targeted by 151 TFs (ex, AR), CASD1 can be targeted by 139 TFs (ex,NANOG), GLIS3 can be targeted by 132 TFs (ex, STAT3) and AFF3 can be targeted by 130 TFs (ex, TP53)are listed in Table 8. These identi�ed target genes were enriched in cell projection part, regulation oftranscription by RNA polymerase II and DNA-binding transcription factor activity.
Validation of hub genes
Te overall survival rates of patients with high expression of UCHL1, FN1, AURKA, TRIM41 and TXNDC5were all signi�cantly lower than those of patients with low/medium expression (Fig. 15), while overallsurvival rates of patients with low expression of SIN3A, MAGI1, GPRASP2, FXYD6 and NFKBIA were allsigni�cantly lower than those of patients with high expression (Fig. 16). The box plots (expressionanalysis) showed that the expression levels of FN1, AURKA, TRIM41, NFKBIA and TXNDC5 were

Page 9/49
signi�cantly higher in primary tumor than those in the normal kidney for WT patients from TCGA (Fig.17A -17E), while the expression levels of SIN3A, MAGI1, GPRASP2, UCHL1 and FXYD6 were signi�cantlylower in primary tumor than those in the normal kidney for WT patients from TCGA (Fig. 17F -17J). Thebox plot suggested (stage analysis) that the high expression level of FN1, AURKA, TRIM41, NFKBIA andTXNDC5 show signi�cant distance in different pathological stages in KT compared to normal (Fig. 18A-18E), while low expression level of SIN3A, MAGI1, GPRASP2, UCHL1 and FXYD6 show signi�cantdistance in different pathological stages in KT compared to normal (Fig. 18F -18J). Up and downregulated hub genes’ alteration statuses in TCGA WT patients were analyzed using the CbioPortaldatabase. FN1 altered (2%), and missense mutation, truncating mutation, ampli�cation and deep dilationwere the main type. AURKA altered (0%). TRIM41 altered (8%), and missense mutation and ampli�cationwere the main type. NFKBIA altered (0.3%), and ampli�cation was the main type. TXNDC5 altered (0.7%),and missense mutation and truncating mutation were the main type. SIN3A altered (0.3%), and missense mutation was the main type. MAGI1 altered (2.8%), and inframe mutation, ampli�cation anddeep dilation was the main type. GPRASP2 altered (2%), and truncating mutation and ampli�cation werethe main type. UCHL1 altered (0%). FXYD6 altered (0.3%), and ampli�cation was the main type. Thefrequencies of alteration of each hub gene are shown in Fig. 19. The Human Protein Atlas database,which indicated the expression level of FN1, AURKA, TRIM41, NFKBIA and TXNDC5 were higher in WTtissue compared to normal kidney tissues (Fig. 20A-20E), while expression level of SIN3A, MAGI1,GPRASP2, UCHL1 and FXYD6 were lower in WT tissue compared to normal kidney tissues (Fig. 20F-20J).The ROC curve de�ned an optimal threshold to predict the recurrence risk of WT, and the AUC values ofthe ROC for FN1, AURKA, TRIM41, NFKBIA, TXNDC5, SIN3A, MAGI1, GPRASP2, UCHL1 and FXYD6 were0.991, 0.998, 0.952, 0.939, 0.994, 0.954, 0.905, 0.947, 0.938 and 0.973, respectively (Fig. 21). RT-PCRresult were consistent with the results of the database analysis, mRNA expression level of FN1, AURKA,TRIM41, NFKBIA and TXNDC5 were signi�cantly higher in WT tissues compared with normal kidneytissues (Fig. 22A - 22E), while mRNA expression level of SIN3A, MAGI1, GPRASP2, UCHL1 and FXYD6were signi�cantly lower in WT tissues compared with normal kidney tissues (Fig. 22F – 22J). TheImmune in�ltration analysis of up and down hub genes from the TIMER was investigated using TCGAdatabase. The results demonstrated that the higher expression level of FN1, AURKA, TRIM41, NFKBIA andTXNDC5 were all negatively associated with tumor purity (Fig. 23A - 23E), while lower expression level ofSIN3A, MAGI1, GPRASP2, UCHL1 and FXYD6 positively associated with tumor purity (Fig. 23F - 23J).
DiscussionTo better uncover the molecular pathogenesis and develop new prognostic, diagnostics and therapeuticstrategies for WT, we performed this integrated analysis between WT patients and normal controls. Atotal of 988 genes across the studies were consistently differentially expressed in WT (502 up regulatedand 486 down regulated) with FDR < 0.05. MEIS1 was identi�ed with development of WT [51]. GUCY1A3was linked with angiogenesis in glioma [52], but this gene may be involved in angiogenesis in WT. TFF1was linked with progression of gastric cancer [53], but this gene may be involved in pathogenesis of WT.Elevated expression of genes such as FGG (�brinogen gamma chain) [54] and CGA (glycoprotein
Page 10/49
hormones, alpha polypeptide) [55] were liable for advancement of hepatocellular carcinoma, but highexpression of these genes may be associated with pathogenesis of WT. Methylation inactivation oftumor suppressor genes such as HOXA11 [56] and MAPK10 [57] were associated with development ofvarious cancers types, but loss of these genes may be liable for progression of WT. Genes such asCOL3A1 [58], S100P [59] and MYO1B [60] were important for invasion of various cancer cells types, butthese genes may be linked with invasion of WT cells.
In pathway enrichment analysis for up regulated genes were carried out.. High expression of enrichedgenes such as SERPINA1 [61], FGB (�brinogen beta chain) [62], SCG3 [63], ITIH3 [64], FST (follistatin) [65],AMBP (alpha-1-microglobulin/bikunin precursor) [66], IGFBP1 [67], IGFBP6 [68] and PLOD3 [69] wereresponsible for advancement of various cancers types, but over expression of these genes may linkedwith pathogenesis of WT. Enriched genes such as CLU (clusterin) [70], VTN (vitronectin) [71], SERPINE1[72], SERPINE2 [73], FN1 [74], SLC3A2 [75], ITGA2 [76], ITGA3 [77], ITGA5 [78], DOCK2 [79], L1CAM [80],CAV1 [81], TSPAN7 [82], CRLF1 [83], SRPX (sushi-repeat-containing protein, X-linked) [84], FGL1 [85],CCL20 [86], COL1A2 [87], SEMA3C [88], GDF15 [89], ANXA11 [90], SPP1 [91], LAMA1 [92], TDGF1 [93],CXCL3 [94], LGALS3 [95], SERPINB1 [96] and LUM (lumican) [97] were associated with invasion ofvarious cancer cells types, but these genes may be liable for invasion of WT cells. Enriched genes such as SERPINA5 [98], ENO2 [99] and CSTB (cystatin B (ste�n B)) [100] were involved in development of variouscancers types, but these genes may be responsible for advancement of WT. Alteration in genes such asESR1 [101], FOXA1 [102] and PRSS1 [103] were important for development of various cancer types, butmutation in these genes may be liable for progression of WT. Enriched genes such as NKX3-1 [104],GATA2 [105], CEACAM1 [106], RAB27B [107], SCUBE2 [108] and THBS2 [109] were involved inadvancement of various cancers types, but these genes may be responsible for progression of WT. Enriched polymorphic genes such as MMP1 [110], APOA1 [111], ITPR3 [112], MMP3 [110], IGFBP3 [113],CSH1 [114], SERPINA6 [115] and APOC2 [116] were associated with pathogenesis of various cancerstypes, but these polymorphic genes may be linked with development of WT. Enriched genes such asVEGFC (vascular endothelial growth factor C) [117], GATA3 [118], CD44 [119] and S100A4 [120] wereimportant for development of WT. Our study found that FDFT1, EBP (emopamil binding protein (sterolisomerase)), DHCR7, F5 (coagulation factor V (proaccelerin, labile factor)), SERPINC1, C4A, C4BPB, APOB(apolipoprotein B (including Ag(x) antigen)), PDE2A, DGKZ (diacylglycerol kinase, zeta 104kDa), APOH(apolipoprotein H (beta-2-glycoprotein I)), LRP8, HBE1, HBG1, GOT1, PAH (phenylalanine hydroxylase),FSTL3, AREG (amphiregulin (schwannoma-derived growth factor), ITIH2, COCH (coagulation factor Chomolog, cochlin (limulus polyphemus)), CLEC2B, HGD (homogentisate 1,2-dioxygenase (homogentisateoxidase)) and YARS (tyrosyl-tRNAsynthetase) are up regulated in WT and has potential as a noveldiagnostic and prognostic biomarker, and therapeutic target. In pathway enrichment analysis for downregulated genes were carried out. FCER1G was associated with chronic in�ammation in kidney cancer[121], but this gene may be important for pathogenesis of WT. Enriched genes such as COL1A1 [122] STIM1 [123], MFAP2 [124], EFEMP1 [125], MMP11 [126], VCAM1 [127], COL2A1 [128], COL4A2 [129],COL13A1 [130], FMOD (�bromodulin) [131], ITGA8 [132], CAPN6 [133], MGP (matrix Gla protein) [134],SPON1 [135], FGF7 [136], PLXNA2 [137], CXCL12 [138], PTN (pleiotrophin (heparin binding growth factor

Page 11/49
8, neurite growth-promoting factor 1)) [139], FNDC1 [140], SERPING1 [141], PCSK6 [142], TCF7L2 [143]and TLE4 [144] were associated with invasion of various cancer cells types, but these genes may beliable for invasion of WT cells. Methylation inactivation of enriched tumor suppressor genes such asADCY4 [145], FBLN1 [146], FBN2 [147], ADAMTS9 [148], NELL2 [149] and PCDH18 [150] were importantfor progression of various cancers such as breast cancer, colorectal cancer, nasopharyngeal cancer andkidney cancer, but loss of these genes may be linked with development of WT. Enriched genes such asVWF (Von Willebrand factor) [151] and ACVR2B [152] were identi�ed with progression of WT. ITPR1 waslinked with activation of autophagy in kidney cancer [153], but this gene may be responsible for inductionof autophagy in WT. SYK (spleen tyrosine kinase) was liable for cancer drug resistance in ovarian cancer[154], but this gene may be involved in chemo resistance in WT. Enriched polymorphic genes such asMMP7 [155] and C1QA [156] were answerable for progression of various cancer types, but thesepolymorphic genes may be important for advancement of WT. Enriched genes such as S100A9 [157],SCUBE3 [158], PDGFC (platelet derived growth factor C) [159] and CTBP2 [160] were linked withdevelopment of various cancer types, but elevated expression of these genes may be responsible forprogression of WT. Low expression of genes such as SPARCL1 [161], SEMA3F [162], PCDH9 [163], CDH11[164] and NR3C2 [165] were liable for development various cancer types, but decrease expression ofthese genes may be associated with advancement of WT. PLXDC1 was identi�ed with angiogenesis inovarian cancer [166], but this gene may be associated with angiogenesis in WT. Our study found thatITPK1, ADCY2, MYLK (myosin, light polypeptide kinase), EDNRA (endothelin receptor type A), COL14A1,FBN3, ASPN (asporin (LRR class 1)), NCAM1, KLKB1, TLL1, F13A1, FGF14, C1QTNF7, PAPPA2, FRAS1,CILP (cartilage intermediate layer protein, nucleotide pyrophosphohydrolase), NRG3, FREM1, FGL2,BMPER (BMP binding endothelial regulator), RSPO3, PLXDC2, TNFSF8, DCHS1, MYCN (V-mycmyelocytomatosis viral related oncogene, neuroblastoma derived (avian)), PCDHB14, CDH5,ACVR2A, KCNJ8 and ABCC9 are down regulated in WT and has potential as a novel diagnostic andprognostic biomarker, and therapeutic target.
GO enrichment analysis for up regulated genes were carried out. High expression of enriched genes suchas PDK1 [167], GCLM (glutamate-cysteine ligase, modi�er subunit) [168], SPHK1 [169], NQO1 [170], CBS(cystathionine-beta-synthase) [171], P4HB [172], PCK2 [173], ADA (adenosine deaminase) [174], ADM(adrenomedullin) [175], AGR2 [176], ULBP2 [177], PTPRZ1 [178], LDLR (low density lipoprotein receptor(familial hypercholesterolemia)) [179], CASK (calcium/calmodulin-dependent serine protein kinase(MAGUK family)) [180], KRT17 [181], TRAP1 [182] and EMP2 [183] were liable for progression of variouscancer types, but increase expression of these genes may be important for pathogenesis of WT. Enrichedgenes such as ACSL4 [184], TYRP1 [185], PPA1 [186], PSMB8 [187], STAT5B [188], ENPP1 [189], CLIC1[190], STC2 [191], BCHE (butyrylcholinesterase) [192], APOM (apolipoprotein M) [193], HMGA1 [194],ICAM3 [195], DNER (delta-notch-like EGF repeat-containing transmembrane) [196] and CAV2 [197] werelinked with invasion of various cancer cells types, but these genes may be liable for invasion of WT cells.Enriched genes such as FBP1 [198], INSIG1 [199], IER3 [200], GLDC (glycine dehydrogenase(decarboxylating)) [201], KYNU (kynureninase (L-kynurenine hydrolase)) [202], PLA2G2A [203], DKK1[204], AZGP1 [205], WFDC1 [206] and SOCS2 [207] were answerable for pathogenesis of various cancer

Page 12/49
types, but low expression of these genes may be associated with development of WT. Enrichedpolymorphic genes such as COMT (catechol-O-methyltransferase) [208], PTGS2 [209], UTS2 [210],TMBIM1 [211], TAP2 [212] and EFNA1 [213] were culpable for progression of various cancer types, butthese polymorphic genes may be linked with development of WT. Enriched genes such as SLC27A2 [214]and KRT10 [215] were important for drug resistance in ovarian cancer, but these genes may be liable forchemo resistance in WT. Methylation inactivation of tumor suppressor CDH13 was associated withprogression of breast cancer [216], but inactivation of this gene may be important for advancement ofWT. Our study found that CDH13, CEL (carboxyl ester lipase (bile salt-stimulated lipase)), MAT1A, ETFB(electron-transfer-�avoprotein, beta polypeptide), TYR (tyrosinase (oculocutaneous albinism IA)),MID1IP1, SCD (stearoyl-CoA desaturase (delta-9-desaturase)), PYCR2, PLP1, WARS (tryptophanyl-tRNAsynthetase), ERO1A, SLC7A2, DECR2, ALDH4A1, CTPS1, GALE (UDP-galactose-4-epimerase),CYP8B1, DCT (dopachrometautomerase (dopachrome delta-isomerase, tyrosine-related protein 2)),PSMD6, RGN (regucalcin (senescence marker protein-30)), OTC (ornithine carbamoyltransferase), MECR(mitochondrial trans-2-enoyl-CoA reductase), EHHADH (enoyl-Coenzyme A, hydratase/3-hydroxyacylCoenzyme A dehydrogenase), UGT2A3, PCCB (propionyl coenzyme A carboxylase, beta polypeptide),NRN1, HIST1H2BG, HIST1H2BK, NLGN1, HAMP (hepcidin antimicrobial peptide), KLHL17, HIST1H2BJ,LCP1, KLRK1, IL1RAP, GABRA5, BCAS3, CD3G and TSPAN4 are up regulated in WT and has potential as anovel diagnostic and prognostic biomarker, and therapeutic target. Similarly, GO enrichment analysis fordown regulated genes was carried out. Enriched genes such as MEOX2 [217], SIX1 [218] and RARA(retinoic acid receptor, alpha) [219] were identi�ed with development of WT. Methylation inactivation ofenriched tumor suppressor genes such as HOXA5 [220], SALL2 [221], TCF21 [222], PAX1 [223], ZNF516[224], EBF3 [225] and ZNF677 [226] were liable for advancement of various cancer types, but loss ofthese genes may be important for pathogenesis of WT. Low expression of enriched genes such as HOXB6[227], TSHZ3 [228], SIN3A [229], CAMTA1 [230], TCF4 [231] and MEIS2 [232] were linked with progressionof various cancer types, but decrease expression of these genes may be responsible for advancement ofWT. Enriched genes such as HOXC10 [233], RECK (reversion-inducing-cysteine-rich protein with kazalmotifs) [234], NRP1 [235], STOX2 [236], NR2F2 [237], GPR161 [238], PBX1 [239], KLF7 [240], TCF12 [241],TFAP4 [242], KLF12 [243] and ZBTB20 [244] were linked with invasion of various cancer cells types, butthese genes may be responsible for invasion of WT cells. Enriched genes such as FGFR2 [245], RARB(retinoic acid receptor, beta) [246], EFNB1 [247], ABCG1 [248], AUTS2 [249], MLLT11 [250], GLIS3 [251],HIF3A [252], ELF1 [253], STAG1 [254], BCL11A [255] and TSC22D1 [256] were important for pathogenesisof various cancer types, but these genes may be linked with progression of WT. CNOT2 was linked withangiogenesis in breast cancer [257], but this gene may be associated with angiogenesis in WT. AFF3 wasimportant for drug resistance in breast cancer [258], but this gene may be involved with chemo resistancein WT. Our study found that PDGFRB (platelet-derived growth factor receptor, beta polypeptide),KIDINS220, CLIC5, PGAP1, FLRT3, SLC8A1, ENAH (enabled homolog (Drosophila)), SMO (smoothenedhomolog (Drosophila)), STOX1, NRK (nik related kinase), MAFB (V-mafmusculoaponeurotic�brosarcomaoncogene homolog B (avian)), RB1, NR2F1, MED25, ZNF211, ZNF605, ZNF420, ZNF135, ZNF300,ZNF501 and ZNF532 are down regulated in WT and has potential as a novel diagnostic and prognosticbiomarker, and therapeutic target.
Page 13/49
PPI network was constructed and analyzed for up regulated genes. AURKA was important forpathogenesis WT [259]. SMURF1 was responsible for invasion of breast cancer cells [260], but this genemay be liable for invasion of WT cells. NUDT21 was involved in proliferation of glioblastoma cells [261],but this gene may be associated with proliferation WT cells. Our study found that NANOG(nanoghomeobox), SLC25A5 and KCNQ3 are up regulated in WT and has potential as a novel diagnosticand prognostic biomarker, and therapeutic target. Similarly, PPI network was constructed and analyzedfor down regulated genes. PLK1 was associated with proliferation of kidney cancer cells [262], but thisgene may be liable for proliferation of WT cells. Low expression of MAGI1 was linked with progression ofkidney cancer [263], but decrease expression of this gene may be responsible for pathogenesis of WT. Our study found that DDIT4L and MRPL15 are down regulated in WT and has potential as a noveldiagnostic and prognostic biomarker, and therapeutic target.
Module analysis was performed for up regulated genes. Genes such as IGF2BP1 [264] and PIR (Pirin(iron-binding nuclear protein)) [265] were linked with invasion of various cancer cells types, bur thesegenes may be involved in invasion of WT cells. Over expression of CCND1 was involved in pathogenesisof breast cancer [266], but high expression of this gene may be linked with progression of WT. Our studyfound that APRT, HBZ, EIF2S1, CUL7 and TKT are up regulated in WT and has potential as a noveldiagnostic and prognostic biomarker, and therapeutic target. Similarly, module analysis was performedfor down regulated genes. FANCC (fanconianemia, complementation group C) was important foradvancement of WT [267].
Target gene ‐ miRNA network was constructed and analyzed for up regulated genes. PTP4A1 wasimportant for invasion of breast cancer cells [268], but this gene may be linked with invasion of WTcells. High expression RRM2 of was involved in advancement of cervical cancer [269], but elevatedexpression of this gene may be associated with development of WT. Similarly, target gene ‐ miRNAnetwork was constructed and analyzed for down regulated genes. ZNF703 was liable for invasion ofcolorectal cancer cells [270], but this gene may be responsible for invasion of WT cells.
Target gene ‐ TF network was constructed and analyzed for up regulated genes. MAGEC2 was linked withinvasion of breast cancer cells [271], but this gene may be involved in invasion of WT cells. Similarly,target gene ‐ TF network was constructed and analyzed for down regulated genes. Methylationinactivation of tumor suppressor PLEKHO1 was responsible for advancement of gastric cancer [272], butloss of this gene may be important for pathogenesis of WT. Our study found that CACHD1 and CASD1are down regulated in WT and has potential as a novel diagnostic and prognostic biomarker, andtherapeutic target.
In the current investigation, the DEGs between WT and normal tissue samples in the GSE60850 datasetwere determined, and the up and down regulated hub genes among the DEGs were demonstrated to beassociated with the prognosis and diagonsis of patients with WT. Furthermore, FN1, AURKA, TRIM41,NFKBIA, TXNDC5, SIN3A, MAGI1, GPRASP2, UCHL1 and FXYD6 were identi�ed as possible candidatebiomarkers for patients with WT. High FN1, AURKA, TRIM41, NFKBIA, TXNDC5 mRNA expression levels

Page 14/49
and low SIN3A, MAGI1, GPRASP2, UCHL1 and FXYD6 mRNA expression levels were validated by TCGAdatabase, human protein atlas database and subsequent ROC analysis and RT‐qPCR analysis, whichmay preliminarily discover the pathophysiological role of these hub genes in WT at the molecular level.
In conclusion, 988 DEGs and 10 hub genes were identi�ed as potential diagnostic or prognosticbiomarkers of WT. The current investigation identi�ed several genes which had not been alreadyassociated with WT and implemented evidence that these genes were associated with this disease.Encourage examines are recommended to authenticate these results and to more precisely analyze theassociations between these genes and WT. Overall, the current investigation highlights possibly newtargets for more individualized treatment of patients with WT.
DeclarationsAcknowledgement
I thank Richard Dafydd Williams, UCL Institute of Child Health, Developmental Biology and Cancer, 30Guilford Street, London, United Kingdom, very much, the author who deposited their microarray dataset,GSE60850, into the public GEO database.
Con�ict of interest
The authors declare that they have no con�ict of interest.
Ethical approval
This article does not contain any studies with human participants or animals performed by any of theauthors.
Informed consent
No informed consent because this study does not contain human or animals participants.
Availability of data and materials
The datasets supporting the conclusions of this article are available in the GEO (Gene ExpressionOmnibus) (https://www.ncbi.nlm.nih.gov/geo/) repository. [(GSE60850)(https://www.ncbi.nlm.nih.gov/geo/query/acc.cgi?acc= GSE60850)]
Consent for publication
Not applicable.
Competing interests
The authors declare that they have no competing interests.

Page 15/49
Author Contributions
B. V. - Writing original draft, and review and editing
C. V. - Software and investigation
I. K. - Supervision and resources
Authors
Basavaraj Vastrad ORCID ID: 0000-0003-2202-7637
Chanabasayya Vastrad ORCID ID: 0000-0003-3615-4450
Iranna Kotturshetti ORCID ID: 0000-0003-1988-7345
References1. Ford K, Gunawardana S, Manirambona E Philipoh GS Mukama B Kanyamuhunga A Cartledge P,
Nyoni MJ, Mwaipaya D, Mpwaga J et al. Investigating Wilms' Tumours Worldwide: A Report of theOxPLORE Collaboration-A Cross-Sectional Observational Study. World J Surg. 2019.doi:1007/s00268-019-05213-6
2. Rivera MN, Haber DA. Wilms' tumour: connecting tumorigenesis and organ development in thekidney. Nat Rev Cancer. 2005;5(9):699-712. doi:1038/nrc1696
3. McNeil DE, Brown M, Ching A, DeBaun MR.Screening for Wilms tumor and hepatoblastoma inchildren with Beckwith-Wiedemann syndromes: a cost-effective model. Med Pediatr Oncol.2001;37(4):349-356. doi:1002/mpo.1209
4. Kaste SC, Dome JS, Babyn PS, Graf NM, Grundy P, Godzinski J, Levitt GA, Jenkinson H. Wilmstumour: prognostic factors, staging, therapy and late effects.Pediatr Radiol. 2008;38(1):2-17.doi:1007/s00247-007-0687-7
5. Ogawa O, Eccles MR, Szeto J, McNoe LA, Yun K, Maw MA, Smith PJ, Reeve AE. Relaxation of insulin-like growth factor II gene imprinting implicated in Wilms' tumour. 1993;362(6422):749-751.doi:10.1038/362749a0
�. Pelletier J, Bruening W, Li FP, Haber DA, Glaser T, Housman DE. WT1 mutations contribute toabnormal genital system development and hereditary Wilms' tumour. Nature. 1991;353(6343):431-434. doi:1038/353431a0
7. Wagner KJ, Cooper WN, Grundy RG, Caldwell G, Jones C, Wadey RB, Morton D, Scho�eld PN, Reik W,Latif F et al. Frequent RASSF1A tumour suppressor gene promoter methylation in Wilms' tumour andcolorectal cancer. Oncogene. 2002;21(47):7277-7282. doi:1038/sj.onc.1205922
�. Hanks S, Perdeaux ER, Seal S, Ruark E, Mahamdallie SS, Murray A, Ramsay E, Del Vecchio Duarte S,Zachariou A, de Souza B et al. Germline mutations in the PAF1 complex gene CTR9 predispose to

Page 16/49
Wilms tumour. Nat Commun. 2014;5:4398. doi:1038/ncomms5398
9. Rakheja D, Chen KS, Liu Y, Shukla AA, Schmid V, Chang TC, Khokhar S, Wickiser JE, Karandikar NJ,Malter JS et al. Somatic mutations in DROSHA and DICER1 impair microRNA biogenesis throughdistinct mechanisms in Wilms tumours. Nat Commun. 2017;8:16177. doi:1038/ncomms16177
10. Schweigert A, Fischer C, Mayr D, von Schweinitz D, Kappler R, Hubertus J. Activation of the Wnt/β-catenin pathway is common in wilms tumor, but rarely through β-catenin mutation and APC promotermethylation. Pediatr Surg Int. 2016;32(12):1141-1146. doi:1007/s00383-016-3970-6
11. Maschietto M, Charlton J, Perotti D, Radice P, Geller JI, Pritchard-Jones K, Weeks M. The IGFsignalling pathway in Wilms tumours--a report from the ENCCA Renal Tumours Biology-driven drugdevelopment workshop. Oncotarget. 2014;5(18):8014-8026. doi:18632/oncotarget.2485
12. Li MH, Sanchez T, Yamase H, Hla T, Oo ML, Pappalardo A, Lynch KR, Lin CY, Ferrer F. S1P/S1P1signaling stimulates cell migration and invasion in Wilms tumor. Cancer Lett. 2009;276(2):171-179.doi:1016/j.canlet.2008.11.025
13. Liu GL, Yang HJ, Liu B, Liu T. Effects of MicroRNA-19b on the Proliferation, Apoptosis, and Migrationof Wilms' Tumor Cells Via the PTEN/PI3K/AKT Signaling Pathway. J Cell Biochem.2017;118(10):3424-3434. doi:1002/jcb.25999
14. Nowicki M, Ostalska-Nowicka D, Kaczmarek M, Miskowiak B, Witt M. The signi�cance of VEGF-C/VEGFR-2 interaction in the neovascularization and prognosis of nephroblastoma (Wilms' tumour).Histopathology. 2007;50(3):358-364. doi:1111/j.1365-2559.2007.02613.x
15. Wang WJ, Li HT, Yu JP, Li YM, Han XP, Chen P, Yu WW, Chen WK, Jiao ZY, Liu HB. Identi�cation of keygenes and associated pathways in KIT/PDGFRA wild‐type gastrointestinal stromal tumors throughbioinformatics analysis. Mol Med Rep. 2018;18(5):4499-4515. doi:3892/mmr.2018.9457
1�. Li YL, Jin YF, Liu XX, Li HJ. A comprehensive analysis of Wnt/β-catenin signaling pathway-relatedgenes and crosstalk pathways in the treatment of As2O3 in renal cancer. Ren Fail. 2018;40(1):331-339. doi:1080/0886022X.2018.1456461
17. Ritchie ME, Phipson B, Wu D, Hu Y, Law CW, Shi W, Smyth GK. limma powers differential expressionanalyses for RNA-sequencing and microarray studies. Nucleic Acids Res. 2015;43(7):e47.doi:1093/nar/gkv007
1�. Karp PD, Billington R, Caspi R, Fulcher CA, Latendresse M, Kothari A, Keseler IM, Krummenacker M,Midford PE, Ong Q et al. The BioCyc collection of microbial genomes and metabolic pathways. BriefBioinform. 2019;20(4):1085-1093. doi:1093/bib/bbx085
19. Aoki-Kinoshita KF, Kanehisa M. Gene annotation and pathway mapping in KEGG. Methods Mol Biol.2007;396:71-91. doi:1007/978-1-59745-515-2_6
20. Schaefer CF, Anthony K, Krupa S, Buchoff J, Day M, Hannay T, Buetow KH. PID: the PathwayInteraction Database. Nucleic Acids Res. 2009;37(Database issue):D674-D679. doi:1093/nar/gkn653
21. Croft D, O'Kelly G, Wu G, Haw R, Gillespie M, Matthews L, Caudy M, Garapati P, Gopinath G, Jassal Bet al. Reactome: a database of reactions, pathways and biological processes. Nucleic Acids Res.2011;39(Database issue):D691-D697. doi:1093/nar/gkq1018

Page 17/49
22. Liberzon A, Subramanian A, Pinchback R, Thorvaldsdóttir H, Tamayo P, Mesirov JP. Molecularsignatures database (MSigDB) 3.0. Bioinformatics. 2011;27(12):1739-1740.doi:1093/bioinformatics/btr260
23. Dahlquist KD, Salomonis N, Vranizan K, Lawlor SC, Conklin BR. GenMAPP, a new tool for viewing andanalyzing microarray data on biological pathways. Nat Genet. 2002 ;31(1):19-20. doi:1038/ng0502-19
24. Petri V, Jayaraman P, Tutaj M, Hayman GT, Smith JR, De Pons J, Laulederkind SJ, Lowry TF, Nigam R,Wang SJ et al. The pathway ontology - updates and applications. J Biomed Semantics. 2014;5(1):7.doi:1186/2041-1480-5-7
25. Mi H, Muruganujan A, Thomas PD. PANTHER in 2013: modeling the evolution of gene function, andother gene attributes, in the context of phylogenetic trees. Nucleic Acids Res. 2013;41(Databaseissue):D377-D386. doi:1093/nar/gks1118
2�. Chen J, Bardes EE, Aronow BJ, Jegga AG. ToppGene Suite for gene list enrichment analysis andcandidate gene prioritization. Nucleic Acids Res. 2009;37(Web Server issue):W305-W311.doi:1093/nar/gkp427
27. Harris MA, Clark J, Ireland A, Lomax J, Ashburner M, Foulger R, Eilbeck K, Lewis S, Marshall B,Mungall C et al. The Gene Ontology (GO) database and informatics. Nucleic Acids Res.2004;32(Database issue):D258-D261. doi:1093/nar/gkh036
2�. Calderone A, Castagnoli L, Cesareni G. mentha: a resource for browsing integrated protein-interactionnetworks. Nat Methods. 2013;10(8):690-691. doi:1038/nmeth.2561
29. Orchard S, Ammari M, Aranda B, Breuza L, Briganti L, Broackes-Carter F, Campbell NH, Chavali G,Chen C, del-Toro N et al. The MIntAct project--IntAct as a common curation platform for 11 molecularinteraction databases. Nucleic Acids Res. 2014;42(Database issue):D358-D363.doi:1093/nar/gkt1115
30. Licata L, Briganti L, Peluso D, Perfetto L, Iannuccelli M, Galeota E, Sacco F, Palma A, Nardozza AP,Santonico E et al. MINT, the molecular interaction database: 2012 update. Nucleic Acids Res.2012;40(Database issue):D857-D861. doi:1093/nar/gkr930
31. Chatr-Aryamontri A, Oughtred R, Boucher L, Rust J, Chang C, Kolas NK, O'Donnell L, Oster S,Theesfeld C, Sellam A et al. The BioGRID interaction database: 2017 update. Nucleic Acids Res.2017;45(D1):D369-D379. doi:1093/nar/gkw1102
32. Salwinski L, Miller CS, Smith AJ, Pettit FK, Bowie JU, Eisenberg D. The Database of InteractingProteins: 2004 update. Nucleic Acids Res. 2004;32(Database issue):D449-D451.doi:1093/nar/gkh086
33. Clerc O, Deniaud M, Vallet SD, Naba A, Rivet A, Perez S, Thierry-Mieg N, Ricard-Blum S. MatrixDB:integration of new data with a focus on glycosaminoglycan interactions. Nucleic Acids Res.2019;47(D1):D376-D381. doi:1093/nar/gky1035
34. Shannon P, Markiel A, Ozier O, Baliga NS, Wang JT, Ramage D, Amin N, Schwikowski B, Ideker TCytoscape: a software environment for integrated models of biomolecular interaction networks.
Page 18/49
Genome Res 2003;13(11):2498-2504. doi:1101/gr.1239303
35. Milenković T, Przulj N. Uncovering biological network function via graphlet degree signatures. CancerInform. 2008;6:257-273.
3�. Hsu CW, Juan HF, Huang HC. Characterization of microRNA-regulated protein-protein interactionnetwork. Proteomics. 2008;8(10):1975-1979. doi:1002/pmic.200701004
37. Shi Z, Zhang B. Fast network centrality analysis using GPUs. BMC Bioinformatics. 2011;12:149.doi:1186/1471-2105-12-149
3�. Estrada E. Generalized walks-based centrality measures for complex biological networks. J TheorBiol. 2010;263(4):556-565. doi:1016/j.jtbi.2010.01.014
39. Stelzl U, Worm U, Lalowski M, Haenig C, Brembeck FH, Goehler H, Stroedicke M, Zenkner M,Schoenherr A, Koeppen S et al. A human protein-protein interaction network: a resource forannotating the proteome. Cell. 2005;122(6):957-968. doi:1016/j.cell.2005.08.029
40. Zaki N, E�mov D, Berengueres J. Protein complex detection using interaction reliability assessmentand weighted clustering coe�cient. BMC. Bioinformatics. 2013,14:163. doi:1186/1471-2105-14-163
41. Zhou G, Soufan O, Ewald J, Hancock REW, Basu N, Xia J. NetworkAnalyst 3.0: a visual analyticsplatform for comprehensive gene expression pro�ling and meta-analysis. Nucleic Acids Res. 2019.doi:1093/nar/gkz240
42. Vlachos IS, Paraskevopoulou MD, Karagkouni D, Georgakilas G, Vergoulis T, Kanellos I,Anastasopoulos IL, Maniou S, Karathanou K, Kalfakakou D et al DIANA-TarBase v7.0: indexing morethan half a million experimentally supported miRNA:mRNA interactions. Nucleic Acids Res.2015;43(Database issue):D153-D159. doi:1093/nar/gku1215
43. Chou CH, Shrestha S, Yang CD, Chang NW, Lin YL, Liao KW, Huang WC, Sun TH, Tu SJ, Lee WH et almiRTarBase update 2018: a resource for experimentally validated microRNA-target interactions.Nucleic Acids Res. 2018;46(D1):D296-D302. doi:1093/nar/gkx1067
44. Lachmann A, Xu H, Krishnan J, Berger SI, Mazloom AR, Ma'ayan A. ChEA: transcription factorregulation inferred from integrating genome-wide ChIP-X experiments. Bioinformatics.2010;26(19):2438-2444. doi:1093/bioinformatics/btq466
45. Chandrashekar DS, Bashel B, Balasubramanya SAH, Creighton CJ, Ponce-Rodriguez I, ChakravarthiBVSK, Varambally S. UALCAN: A Portal for Facilitating Tumor Subgroup Gene Expression andSurvival Analyses. Neoplasia. 2017;19(8):649-658. doi:1016/j.neo.2017.05.002
4�. Gao J, Aksoy BA, Dogrusoz U, Dresdner G, Gross B, Sumer SO, Sun Y, Jacobsen A, Sinha R, Larsson Eet al. Integrative analysis of complex cancer genomics and clinical pro�les using the cBioPortal. SciSignal. 2013;6(269):pl1. doi:1126/scisignal.2004088
47. Uhlen M, Oksvold P, Fagerberg L, Lundberg E, Jonasson K, Forsberg M, Zwahlen M, Kampf C, WesterK, Hober S et al. Towards a knowledge-based Human Protein Atlas. Nat Biotechnol.2010;28(12):1248-1250. doi:1038/nbt1210-1248
4�. Robin X, Turck N, Hainard A, Tiberti N, Lisacek F, Sanchez JC, Müller M. pROC: an open-sourcepackage for R and S+ to analyze and compare ROC curves. BMC Bioinformatics. 2011;12:77.

Page 19/49
doi:1186/1471-2105-12-77
49. Livak KJ, Schmittgen TD. Analysis of relative gene expression data using real-time quantitative PCRand the 2(-Delta Delta C(T)) Method. Methods. 2001;25(4):402–408. doi:1006/meth.2001.1262
50. Li T, Fan J, Wang B, Traugh N, Chen Q, Liu JS, Li B, Liu XS. TIMER: A Web Server for ComprehensiveAnalysis of Tumor-In�ltrating Immune Cells. Cancer Res. 2017;77(21):e108–e110. doi:1158/0008-5472.CAN-17-0307
51. Koller K, Pichler M, Koch K, Zandl M, Stiegelbauer V, Leuschner I, Hoe�er G, Guertl B.Nephroblastomas show low expression of microR-204 and high expression of its target, theoncogenic transcription factor MEIS1. Pediatr Dev Pathol. 2014;17(3):169-175. doi:2350/13-01-1288-OA
52. Saino M , Maruyama T, Sekiya T, Kayama T, Murakami Y. Inhibition of angiogenesis in human gliomacell lines by antisense RNA from the soluble guanylate cyclase genes, GUCY1A3 and GUCY1B3.Oncol Rep. 2004;12(1):47-52.
53. Soutto M, Chen Z, Saleh MA, Katsha A, Zhu S, Zaika A, Belkhiri A, El-Rifai W. TFF1 activates p53through down-regulation of miR-504 in gastric cancer. Oncotarget. 2014;5(14):5663-5673.doi:18632/oncotarget.2156
54. Zhu WL, Fan BL, Liu DL, Zhu WX. Abnormal expression of �brinogen gamma (FGG) and plasma levelof �brinogen in patients with hepatocellular carcinoma. Anticancer Res. 2009;29(7):2531-2534.
55. Malaguarnera M, Vacante M, Fichera R, Cappellani A, Cristaldi E, Motta M. Chromogranin A (CgA)serum level as a marker of progression in hepatocellular carcinoma (HCC) of elderly patients. ArchGerontol Geriatr. 2010;51(1):81-85. doi:1016/j.archger.2009.08.004
5�. Cui Y, Gao D, Linghu E, Zhan Q, Chen R, Brock MV, Herman JG, Guo M. Epigenetic changes andfunctional study of HOXA11 in human gastric cancer. Epigenomics. 2015;7(2):201-213.doi:2217/epi.14.92
57. Yoo KH, Park YK, Kim HS, Jung WW, Chang SG. Identi�cation of MAPK10 as a novel epigeneticmarker for chromophobe kidney cancer. Pathol Int. 2011;61(1):52-54. doi:1111/j.1440-1827.2010.02605.x
5�. Su B, Zhao W, Shi B, Zhang Z, Yu X, Xie F, Guo Z, Zhang X, Liu J, Shen Q et al. Let-7d suppressesgrowth, metastasis, and tumor macrophage in�ltration in renal cell carcinoma by targeting COL3A1and CCL7. Mol Cancer. 2014;13:206. doi:1186/1476-4598-13-206
59. Basu GD, Azorsa DO, Kiefer JA, Rojas AM, Tuzmen S Barrett MT, Trent JM, Kallioniemi O, Mousses S.Functional evidence implicating S100P in prostate cancer progression. Int J Cancer.2008;123(2):330-339. doi:1002/ijc.23447
�0. Zhang HR, Lai SY, Huang LJ, Zhang ZF, Liu J, Zheng SR, Ding K, Bai X, Zhou JY. Myosin 1b promotescell proliferation, migration, and invasion in cervical cancer. Gynecol Oncol. 2018;149(1):188-197.doi:1016/j.ygyno.2018.01.024
�1. Chan HJ, Li H, Liu Z, Yuan YC, Mortimer J, Chen S. SERPINA1 is a direct estrogen receptor target geneand a predictor of survival in breast cancer patients. SERPINA1 is a direct estrogen receptor target

Page 20/49
gene and a predictor of survival in breast cancer patients. Oncotarget. 2015;6(28):25815-25827.doi:18632/oncotarget.4441
�2. Repetto O, Maiero S, Magris R, Miolo G, Cozzi MR, Steffan A, Canzonieri V, Cannizzaro R, De Re V.Quantitative Proteomic Approach Targeted to Fibrinogen β Chain in Tissue Gastric Carcinoma. Int JMol Sci. 2018;19(3). doi:3390/ijms19030759
�3. Moss AC, Jacobson GM, Walker LE, Blake NW, Marshall E, Coulson JM. SCG3 transcript in peripheralblood is a prognostic biomarker for REST-de�cient small cell lung cancer. Clin Cancer Res.2009;15(1):274-283. doi:1158/1078-0432.CCR-08-1163
�4. Chong PK, Lee H, Zhou J, Liu SC, Loh MC, Wang TT, Chan SP, Smoot DT, Ashktorab H, So JB et alITIH3 is a potential biomarker for early detection of gastric cancer. J Proteome Res. 2010;9(7):3671-3679. doi:1021/pr100192h
�5. Ren P, Chen FF, Liu HY, Cui XL, Sun Y, Guan JL, Liu ZH, Liu JG, Wang YN. High serum levels offollistatin in patients with ovarian cancer. J Int Med Res. 2012;40(3):877-886.doi:1177/147323001204000306
��. Huang H, Han Y, Gao J, Feng J, Zhu L, Qu L, Shen L, Shou C. High level of serum AMBP is associatedwith poor response to paclitaxel-capecitabine chemotherapy in advanced gastric cancer patients.Med Oncol. 2013;30(4):748. doi:1007/s12032-013-0748-8
�7. Cao Y, Nimptsch K, Shui IM, Platz EA, Wu K, Pollak MN, Ken�eld SA, Stampfer MJ, Giovannucci EL.Prediagnostic plasma IGFBP-1, IGF-1 and risk of prostate cancer. Int J Cancer. 2015;136(10):2418-2426. doi:1002/ijc.29295
��. Xu XF, Guo CY, Liu J, Yang WJ, Xia YJ, Xu L, Yu YC, Wang XP. Gli1 maintains cell survival by up-regulating IGFBP6 and Bcl-2 through promoter regions in parallel manner in pancreatic cancer cells.J Carcinog. 2009;8:13. doi:4103/1477-3163.55429
�9. Wang B, Xu L, Ge Y, Cai X, Li Q, Yu Z, Wang J, Wang Y, Lu C, Wang D et al. PLOD3 is Upregulated inGastric Cancer and Correlated with Clinicopathologic Characteristics. Clin Lab. 2019;65(1).doi:7754/Clin.Lab.2018.180541
70. Wang X, Luo L, Dong D, Yu Q, Zhao K. Clusterin plays an important role in clear renal cell cancermetastasis. Urol Int. 2014;92(1):95-103. doi:1159/000351923
71. Wei F, Wu Y, Tang L, He Y, Shi L, Xiong F, Gong Z, Guo C, Li X, Liao Q et al BPIFB1 (LPLUNC1) inhibitsmigration and invasion of nasopharyngeal carcinoma by interacting with VTN and VIM. Br J Cancer.2018;118(2):233-247. doi:1038/bjc.2017.385
72. Azimi I., Petersen RM., Thompson EW., Roberts-Thomson SJ4, Monteith GR. Hypoxia-inducedreactive oxygen species mediate N-cadherin and SERPINE1 expression, EGFR signalling and motilityin MDA-MB-468 breast cancer cells. Sci Rep. 2017;7(1):15140. doi:1038/s41598-017-15474-7
73. Wang K, Wang B, Xing AY, Xu KS, Li GX, Yu ZH. Prognostic signi�cance of SERPINE2 in gastriccancer and its biological function in SGC7901 cells. J Cancer Res Clin Oncol. 2015;141(5):805-812.doi:1007/s00432-014-1858-1

Page 21/49
74. Zhang H, Sun Z, Li Y, Fan D, Jiang H. MicroRNA-200c binding to FN1 suppresses the proliferation,migration and invasion of gastric cancer cells. Biomed Pharmacother. 2017;88:285-292.doi:1016/j.biopha.2017.01.023
75. Poettler M, Unseld M, Braemswig K, Haitel A, Zielinski CC, Prager GW. CD98hc (SLC3A2) drivesintegrin-dependent renal cancer cell behavior. Mol Cancer. 2013;12:169. doi:1186/1476-4598-12-169
7�. Chuang YC, Wu HY, Lin YL, Tzou SC, Chuang CH, Jian TY, Chen PR, Chang YC, Lin CH, Huang TH etal. Blockade of ITGA2 Induces Apoptosis and Inhibits Cell Migration in Gastric Cancer. Biol ProcedOnline. 2018;20:10. doi:1186/s12575-018-0073-x
77. Koshizuka K, Hanazawa T, Kikkawa N, Arai T, Okato A, Kurozumi A, Kato M, Katada K, Okamoto Y,Seki N et al. Regulation of ITGA3 by the anti-tumor miR-199 family inhibits cancer cell migration andinvasion in head and neck cancer. Cancer Sci. 2017;108(8):1681-1692. doi:1111/cas.13298
7�. Yoo HI, Kim BK, Yoon SK. MicroRNA-330-5p negatively regulates ITGA5 expression in humancolorectal cancer. Oncol Rep. 2016;36(5):3023-3029. doi:3892/or.2016.5092
79. El Haibi CP, Sharma PK, Singh R, Johnson PR, Suttles J, Singh S, Lillard JW Jr. PI3Kp110-, Src-, FAK-dependent and DOCK2-independent migration and invasion of CXCL13-stimulated prostate cancercells. Mol Cancer. 2010;9:85. doi:1186/1476-4598-9-85
�0. Bondong S, Kiefel H, Hielscher T, Zeimet AG, Zeillinger R, Pils D, Schuster E, Castillo-Tong DC, CadronI, Vergote I et al. Prognostic signi�cance of L1CAM in ovarian cancer and its role in constitutive NF-κB activation. Ann Oncol. 2012;23(7):1795-802. doi:1093/annonc/mdr568
�1. Butz H, Szabó PM, Khella HW, Nofech-Mozes R, Patocs A, Yousef GM. miRNA-target network revealsmiR-124as a key miRNA contributing to clear cell renal cell carcinoma aggressive behaviour bytargeting CAV1 and FLOT1. Oncotarget. 2015;6(14):12543-12557. doi:18632/oncotarget.3815
�2. Wuttig D, Zastrow S, Füssel S, Toma MI, Meinhardt M, Kalman K, Junker K, Sanjmyatav J, Boll K,Hackermüller J et al. CD31, EDNRB and TSPAN7 are promising prognostic markers in clear-cell renalcell carcinoma revealed by genome-wide expression analyses of primary tumors and metastases. IntJ Cancer. 2012;131(5):E693-E704. doi:1002/ijc.27419
�3. Yu ST., Zhong Q., Chen RH., Han P., Li SB., Zhang H., Yuan L, Xia TL, Zeng MS, Huang XM. CRLF1promotes malignant phenotypes of papillary thyroid carcinoma by activating the MAPK/ERK andPI3K/AKT pathways. Cell Death Dis. 2018;9(3):371. doi:1038/s41419-018-0352-0
�4. Liu CL, Pan HW, Torng PL, Fan MH, Mao TL. SRPX and HMCN1 regulate cancer‐associated�broblasts to promote the invasiveness of ovarian carcinoma. Oncol Rep. 2019.doi:3892/or.2019.7379
�5. Bie F, Wang G, Qu X, Wang Y, Huang C, Wang Y, Du J. Loss of FGL1 induces epithelial‐mesenchymaltransition and angiogenesis in LKB1 mutant lung adenocarcinoma. Int J Oncol. 2019;55(3):697-707.doi:3892/ijo.2019.4838
��. Cheng XS, Li YF, Tan J, Sun B, Xiao YC, Fang XB, Zhang XF, Li Q, Dong JH, Li M et al. CCL20 andCXCL8 synergize to promote progression and poor survival outcome in patients with colorectal

Page 22/49
cancer by collaborative induction of the epithelial-mesenchymal transition. Cancer Lett. 2014;348(1-2):77-87. doi:1016/j.canlet.2014.03.008
�7. Ao R, Guan L, Wang Y, Wang JN. Silencing of COL1A2, COL6A3, and THBS2 inhibits gastric cancercell proliferation, migration, and invasion while promoting apoptosis through the PI3k-Akt signalingpathway. J Cell Biochem. 2018;119(6):4420-4434. doi:1002/jcb.26524
��. Malik MF, Satherley LK, Davies EL, Ye L, Jiang WG. Expression of Semaphorin 3C in Breast Cancerand its Impact on Adhesion and Invasion of Breast Cancer Cells. Anticancer Res. 2016;36(3):1281-1286.
�9. Li C., Wang J., Kong J., Tang J., Wu Y, Xu E, Zhang H, Lai M. GDF15 promotes EMT and metastasis incolorectal cancer. Oncotarget. 2016;7(1):860-872. doi:18632/oncotarget.6205
90. Hua K, Li Y, Zhao Q, Fan L, Tan B, Gu J. Downregulation of Annexin A11 (ANXA11) Inhibits CellProliferation, Invasion, and Migration via the AKT/GSK-3β Pathway in Gastric Cancer. Med Sci Monit.2018;24:149-160. doi:12659/msm.905372
91. Zeng B, Zhou M, Wu H, Xiong Z. SPP1 promotes ovarian cancer progression via Integrin β1/FAK/AKTsignaling pathway. Onco Targets Ther. 2018;11:1333-1343. doi:2147/OTT.S154215
92. Meng X, Chen X, Lu P, Ma W, Yue D, Song L, Fan Q. MicroRNA-202 inhibits tumor progression bytargeting LAMA1 in esophageal squamous cell carcinoma. Biochem Biophys Res Commun.2016;473(4):821-827. doi:1016/j.bbrc.2016.03.130
93. Miyoshi N, Ishii H, Mimori K, Sekimoto M, Doki Y, Mori M. TDGF1 is a novel predictive marker formetachronous metastasis of colorectal cancer. Int J Oncol. 2010;36(3):563-568.doi:3892/ijo_00000530
94. Xin H, Cao Y, Shao ML, Zhang W, Zhang CB, Wang JT, Liang LC, Shao WW, Qi YL, Li Y et al.Chemokine CXCL3 mediates prostate cancer cells proliferation, migration and gene expressionchanges in an autocrine/paracrine fashion. Int Urol Nephrol. 2018;50(5):861-868. doi:1007/s11255-018-1818-9
95. Han L, Wu Z, Zhao Q. Revealing the molecular mechanism of colorectal cancer by establishingLGALS3-related protein-protein interaction network and identifying signaling pathways. Int J MolMed. 2014;33(3):581-588. doi:3892/ijmm.2014.1620
9�. Huasong G, Zongmei D, Jianfeng H, Xiaojun Q, Jun G, Sun G, Donglin W, Jianhong Z. Serine proteaseinhibitor (SERPIN) B1 suppresses cell migration and invasion in glioma cells. Brain Res.2015;1600:59-69. doi:1016/j.brainres.2014.06.017
97. Wit M, Belt EJ, Delis-van Diemen PM, Carvalho B, Coupé VM, Stockmann HB, Bril H, Beliën JA,Fijneman RJ, Meijer GA. Lumican and versican are associated with good outcome in stage II and IIIcolon cancer. Ann Surg Oncol. 2013;20 Suppl 3:S348-S359. doi:1245/s10434-012-2441-0
9�. Hagelgans A, Jandeck C, Friedemann M, Donchin A, Richter S, Menschikowski M. Identi�cation ofCpG Sites of SERPINA5 Promoter with Opposite Methylation Patterns in Benign and MalignantProstate Cells. Anticancer Res. 2017;37(12):6609-6618. doi:21873/anticanres.12118

Page 23/49
99. Soh MA, Garrett SH, Somji S, Dunlevy JR, Zhou XD, Sens MA, Bathula CS, Allen C, Sens DA. Arsenic,cadmium and neuron speci�c enolase (ENO2, γ-enolase) expression in breast cancer. Cancer Cell Int.2011;11(1):41. doi:1186/1475-2867-11-41
100. Ma Y, Chen Y, Petersen I. Expression and epigenetic regulation of cystatin B in lung cancer andcolorectal cancer. Pathol Res Pract. 2017;213(12):1568-1574. doi:1016/j.prp.2017.06.007
101. Fribbens C, O'Leary B, Kilburn L, Hrebien S, Garcia-Murillas I, Beaney M, Cristofanilli M, Andre F, Loi S,Loibl S et al. Plasma ESR1 Mutations and the Treatment of Estrogen Receptor-Positive AdvancedBreast Cancer. J Clin Oncol. 2016;34(25):2961-2968. doi:1200/JCO.2016.67.3061
102. Barbieri CE, Baca SC, Lawrence MS, Demichelis F, Blattner M, Theurillat JP, White TA, Stojanov P, VanAllen E, Stransky N et al. Exome sequencing identi�es recurrent SPOP, FOXA1 and MED12 mutationsin prostate cancer. Nat Genet. 2012;44(6):685-689. doi:1038/ng.2279
103. Gao F, Liu QC, Zhang S, Zhuang ZH, Lin CZ, Lin XH. PRSS1 intron mutations in patients withpancreatic cancer and chronic pancreatitis. Mol Med Rep. 2012;5(2):449-451.doi:3892/mmr.2011.684
104. Lei Q, Jiao J, Xin L, Chang CJ, Wang S, Gao J, Gleave ME, Witte ON, Liu X, Wu H. NKX3.1 stabilizesp53, inhibits AKT activation, and blocks prostate cancer initiation caused by PTEN loss. Cancer Cell.2006;9(5):367-378. doi:1016/j.ccr.2006.03.031
105. Peters I, Dubrowinskaja N, Tezval H, Kramer MW, von Klot CA, Hennenlotter J, Stenzl A, Scherer R,Kuczyk MA, Serth J. Decreased mRNA expression of GATA1 and GATA2 is associated with tumoraggressiveness and poor outcome in clear cell renal cell carcinoma. Target Oncol. 2015;10(2):267-275. doi:1007/s11523-014-0335-8
10�. Kammerer R, Riesenberg R, Weiler C, Lohrmann J, Schleypen J, Zimmermann W. The tumoursuppressor gene CEACAM1 is completely but reversibly downregulated in renal cell carcinoma. JPathol. 2004;204(3):258-267. doi:1002/path.1657
107. Worst TS, Meyer Y, Gottschalt M, Weis CA, von Hardenberg J, Frank C, Steidler A, Michel MS, Erben P.RAB27A, RAB27B and VPS36 are downregulated in advanced prostate cancer and show functionalrelevance in prostate cancer cells. Int J Oncol. 2017;50(3):920-932. doi:3892/ijo.2017.3872
10�. Song Q, Li C, Feng X, Yu A, Tang H, Peng Z, Wang X. Decreased expression of SCUBE2 is associatedwith progression and prognosis in colorectal cancer. Oncol Rep. 2015;33(4):1956-1964.doi:3892/or.2015.3790
109. Wei WF, Zhou CF, Wu XG, He LN, Wu LF, Chen XJ, Yan RM, Zhong M, Yu YH, Liang L et al. MicroRNA-221-3p, a TWIST2 target, promotes cervical cancer metastasis by directly targeting THBS2. CellDeath Dis. 2017;8(12):3220. doi:1038/s41419-017-0077-5
110. Ricketts C, Zeegers MP, Lubinski J, Maher ER. Analysis of germline variants in CDH1, IGFBP3, MMP1,MMP3, STK15 and VEGF in familial and sporadic renal cell carcinoma. PLoS One. 2009;4(6):e6037.doi:1371/journal.pone.0006037
111. Hsu MC, Lee KT, Hsiao WC, Wu CH, Sun HY, Lin IL, Young KC. The dyslipidemia-associated SNP onthe APOA1/C3/A5 gene cluster predicts post-surgery poor outcome in Taiwanese breast cancer
Page 24/49
patients: a 10-year follow-up study. BMC Cancer. 2013;13:330. doi:1186/1471-2407-13-330
112. Yang Y, Chang TY, Chen TC, Lin WS, Chang SC, Lee YJ. ITPR3 gene haplotype is associated withcervical squamous cell carcinoma risk in Taiwanese women. Oncotarget. 2017;8(6):10085-10090.doi:18632/oncotarget.14341
113. Safarinejad MR. Insulin-like growth factor binding protein-3 (IGFBP-3) gene variants are associatedwith renal cell carcinoma. BJU Int. 2011;108(5):762-70. doi:1111/j.1464-410X.2010.10017.x
114. Chen Y, Kibriya MG, Jasmine F, Santella RM, Senie RT, Ahsan H. Do placental genes affect maternalbreast cancer? Association between offspring's CGB5 and CSH1 gene variants and maternal breastcancer risk. Cancer Res. 2008;68(23):9729-9734. doi:1158/0008-5472.CAN-08-2243
115. Shen N, Gong J, Wang Y, Tian J, Qian J, Zou L, Chen W, Zhu B, Lu X, Zhong R et al. Integrativegenomic analysis identi�es that SERPINA6-rs1998056 regulated by FOXA/ERα is associated withfemale hepatocellular carcinoma. PLoS One. 2014;9(9):e107246. doi:1371/journal.pone.0107246
11�. Rubio MP, Correa KM, Ueki K, Mohrenweiser HW, Gusella JF, von Deimling A, Louis DN. The putativeglioma tumor suppressor gene on chromosome 19q maps between APOC2 and HRC. Cancer Res.1994;54(17):4760-4763.
117. Wang L, Zhang D, Chen XR, Fan YX, Wang JX. Expression of vascular endothelial growth factor(VEGF) and VEGF-C in serum and tissue of Wilms tumor. Chin Med J (Engl). 2011;124(22):3716-3720.
11�. Klijanienko J, Caly M, Frénaux P, Klos J. GATA3 differential expression in neuroblastoma andnephroblastoma. Cancer Cytopathol. 2018;126(3):215-216. doi:1002/cncy.21952
119. Ghanem MA, Van Steenbrugge GJ, Van Der Kwast TH, Sudaryo MK, Noordzij MA, Nijman RJ.Expression and prognostic value Of CD44 isoforms in nephroblastoma (Wilms tumor). J Urol.2002;168(2):681-686.
120. Li HJ, Chen YX, Wang Q, Zhang YG. S100A4 mRNA as a prognostic marker and therapeutic target inWilms tumor (WT). Eur Rev Med Pharmacol Sci. 2014;18(6):817-827.
121. Chen L, Yuan L, Wang Y, Wang G, Zhu Y, Cao R, Qian G, Xie C, Liu X, Xiao Y et al. Co-expressionnetwork analysis identi�ed FCER1G in association with progression and prognosis in human clearcell renal cell carcinoma. Int J Biol Sci. 2017;13(11):1361-1372. doi:7150/ijbs.21657
122. Zhang Z, Wang Y, Zhang J, Zhong J, Yang R. COL1A1 promotes metastasis in colorectal cancer byregulating the WNT/PCP pathway. Mol Med Rep. 2018;17(4):5037-5042. doi:3892/mmr.2018.8533
123. Kim JH, Lkhagvadorj S, Lee MR, Hwang KH, Chung HC, Jung JH, Cha SK, Eom M5. Orai1 and STIM1are critical for cell migration and proliferation of clear cell renal cell carcinoma. Biochem Biophys ResCommun. 2014;448(1):76-82. doi:1016/j.bbrc.2014.04.064
124. Wang JK, Wang WJ, Cai HY, Du BB, Mai P, Zhang LJ, Ma W, Hu YG, Feng SF, Miao GY. MFAP2promotes epithelial-mesenchymal transition in gastric cancer cells by activating TGF-β/SMAD2/3signaling pathway. Onco Targets Ther. 2018;11:4001-4017. doi:2147/OTT.S160831
125. Wang Z, Cao CJ, Huang LL, Ke ZF, Luo CJ, Lin ZW, Wang F, Zhang YQ, Wang LT. EFEMP1 promotesthe migration and invasion of osteosarcoma via MMP-2 with induction by AEG-1 via NF-κB signaling
Page 25/49
pathway. 2015;6(16):14191-14208. doi:10.18632/oncotarget.3691
12�. Tian X, Ye C, Yang Y, Guan X, Dong B, Zhao M, Hao C. Expression of CD147 and matrixmetalloproteinase-11 in colorectal cancer and their relationship to clinicopathological features. JTransl Med. 2015;13:337. doi:1186/s12967-015-0702-y
127. Shioi K, Komiya A, Hattori K, Huang Y, Sano F, Murakami T, Nakaigawa N, Kishida T, Kubota Y,Nagashima Y et al. Vascular cell adhesion molecule 1 predicts cancer-free survival in clear cell renalcarcinoma patients. Clin Cancer Res. 2006;12(24):7339-7346. doi:1158/1078-0432.CCR-06-1737
12�. Ganapathi MK, Jones WD, Sehouli J, Michener CM, Braicu IE, Norris EJ, Biscotti CV, Vaziri SA,Ganapathi RN. Expression pro�le of COL2A1 and the pseudogene SLC6A10P predicts tumorrecurrence in high-grade serous ovarian cancer. Int J Cancer. 2016;138(3):679-88. doi:1002/ijc.29815
129. JingSong H, Hong G, Yang J, Duo Z, Li F, WeiCai C, XueYing L, YouSheng M, YiWen O, Yue P, Zou C.siRNA-mediated suppression of collagen type iv alpha 2 (COL4A2) mRNA inhibits triple-negativebreast cancer cell proliferation and migration. Oncotarget. 2017;8(2):2585-2593.doi:18632/oncotarget.13716
130. Miyake M, Hori S, Morizawa Y, Tatsumi Y, Toritsuka M, Ohnishi S, Shimada K, Furuya H, Khadka VS,Deng Y et al. Collagen type IV alpha 1 (COL4A1) and collagen type XIII alpha 1 (COL13A1) producedin cancer cells promote tumor budding at the invasion front in human urothelial carcinoma of thebladder. Oncotarget. 2017;8(22):36099-36114. doi:18632/oncotarget.16432
131. Dawoody Nejad L, Biglari A, Annese T, Ribatti D. Recombinant �bromodulin and decorin effects onNF-κB and TGFβ1 in the 4T1 breast cancer cell line. Oncol Lett. 2017;13(6):4475-4480.doi:3892/ol.2017.5960
132. Lu X, Wan F, Zhang H, Shi G, Ye D. ITGA2B and ITGA8 are predictive of prognosis in clear cell renalcell carcinoma patients. Tumour Biol. 2016;37(1):253-62. doi:1007/s13277-015-3792-5
133. Lee SJ, Kim BG, Choi YL, Lee JW. Increased expression of calpain 6 during the progression of uterinecervical neoplasia: immunohistochemical analysis. Oncol Rep. 2008;19(4):859-863.
134. Mertsch S, Schurgers LJ, Weber K, Paulus W, Senner V. Matrix gla protein (MGP): an overexpressedand migration-promoting mesenchymal component in glioblastoma. BMC Cancer. 2009;9:302.doi:1186/1471-2407-9-302
135. Dai W, Huang HL, Hu M, Wang SJ, He HJ, Chen NP, Li MY. microRNA-506 regulates proliferation,migration and invasion in hepatocellular carcinoma by targeting F-spondin 1 (SPON1). Am J CancerRes. 2015;5(9):2697-707.
13�. Huang T, Wang L, Liu D, Li P, Xiong H, Zhuang L, Sun L, Yuan X, Qiu H. FGF7/FGFR2 signal promotesinvasion and migration in human gastric cancer through upregulation of thrombospondin-1. Int JOncol. 2017;50(5):1501-1512. doi:3892/ijo.2017.3927
137. Tian TV, Tomavo N, Huot L, Flourens A, Bonnelye E, Flajollet S, Hot D, Leroy X, de Launoit Y, Duterque-Coquillaud M. Identi�cation of novel TMPRSS2:ERG mechanisms in prostate cancer metastasis:involvement of MMP9 and PLXNA2. Oncogene. 2014;33(17):2204-2214. doi:1038/onc.2013.176

Page 26/49
13�. Struckmann K, Mertz K, Steu S, Storz M, Staller P, Krek W, Schraml P, Moch H. pVHL co-ordinatelyregulates CXCR4/CXCL12 and MMP2/MMP9 expression in human clear-cell renal cell carcinoma. JPathol. 2008;214(4):464-471. doi:1002/path.2310
139. Yao J, Hu XF, Feng XS, Gao SG. Pleiotrophin promotes perineural invasion in pancreatic cancer.World J Gastroenterol. 2013;19(39):6555-6558. doi:3748/wjg.v19.i39.6555
140. Liu YP, Chen WD, Li WN, Zhang M. Overexpression of FNDC1 Relates to Poor Prognosis and ItsKnockdown Impairs Cell Invasion and Migration in Gastric Cancer. Technol Cancer Res Treat.2019;18:1533033819869928. doi:1177/1533033819869928
141. Peng S, Du T, Wu W, Chen X, Lai Y, Zhu D, Wang Q, Ma X, Lin C, Li Z. Decreased expression of serineprotease inhibitor family G1 (SERPING1) in prostate cancer can help distinguish high-risk prostatecancer and predicts malignant progression. Urol Oncol. 2018;36(8):366.e1-366.e9.doi:1016/j.urolonc.2018.05.021
142. Delic S, Lottmann N, Jetschke K, Reifenberger G, Riemenschneider MJ. Identi�cation and functionalvalidation of CDH11, PCSK6 and SH3GL3 as novel glioma invasion-associated candidate genes.Neuropathol Appl Neurobiol. 2012;38(2):201-212. doi:1111/j.1365-2990.2011.01207.x
143. Kojima T, Shimazui T, Horie R, Hinotsu S, Oikawa T, Kawai K, Suzuki H, Meno K, Akaza H, Uchida K.FOXO1 and TCF7L2 genes involved in metastasis and poor prognosis in clear cell renal cellcarcinoma. Genes Chromosomes Cancer. 2010;49(4):379-389. doi:1002/gcc.20750
144. Wang SY, Gao K, Deng DL, Cai JJ, Xiao ZY, He LQ, Jiao HL, Ye YP, Yang RW, Li TT et al. TLE4promotes colorectal cancer progression through activation of JNK/c-Jun signaling pathway.Oncotarget. 2016;7(3):2878-2888. doi:18632/oncotarget.6694
145. Fan Y, Mu J, Huang M, Imani S, Wang Y, Lin S, Fan J, Wen Q. Epigenetic identi�cation of ADCY4 as abiomarker for breast cancer: an integrated analysis of adenylate cyclases. Epigenomics. 2019.doi:2217/epi-2019-0207
14�. Xu Z, Chen H, Liu D, Huo J. Fibulin-1 is downregulated through promoter hypermethylation incolorectal cancer: a CONSORT study. Medicine (Baltimore). 2015;94(13):e663.doi:1097/MD.0000000000000663
147. Hibi K, Mizukami H, Saito M, Kigawa G, Nemoto H, Sanada Y. FBN2 methylation is detected in theserum of colorectal cancer patients with hepatic metastasis. Anticancer Res. 2012;32(10):4371-4374.
14�. Lung HL, Lo PHY, Xie D, Apte SS, Cheung AKL, Cheng Y, Law EWL, Chua D, Zeng YX, Tsao SW et al.Characterization of a novel epigenetically-silenced, growth-suppressive gene, ADAMTS9, and itsassociation with lymph node metastases in nasopharyngeal carcinoma. Int J Cancer.2008;123(2):401-408. doi:1002/ijc.23528
149. Nakamura R, Oyama T, Tajiri R, Mizokami A, Namiki M, Nakamoto M, Ooi A. Expression andregulatory effects on cancer cell behavior of NELL1 and NELL2 in human renal cell carcinoma.Cancer Sci. 2015;106(5):656-664. doi:1111/cas.12649

Page 27/49
150. Zhou D, Tang W., Su G, Cai M, An HX, Zhang Y. PCDH18 is frequently inactivated by promotermethylation in colorectal cancer. Sci Rep. 2017;7(1):2819. doi:1038/s41598-017-03133-w
151. Fosbury E, Szychot E, Slater O, Mathias M, Sibson K. An 11-year experience of acquired vonWillebrand syndrome in children diagnosed with Wilms tumour in a tertiary referral centre. PediatrBlood Cancer. 2017;64(3). doi:1002/pbc.26246
152. Senanayake U, Das S, Vesely P, Alzoughbi W, Fröhlich LF, Chowdhury P, Leuschner I, Hoe�er G, GuertlB. miR-192, miR-194, miR-215, miR-200c and miR-141 are downregulated and their common targetACVR2B is strongly expressed in renal childhood neoplasms. Carcinogenesis. 2012;33(5):1014-1021.doi:1093/carcin/bgs126
153. Messai Y, Noman MZ, Janji B, Hasmim M, Escudier B, Chouaib S. The autophagy sensor ITPR1protects renal carcinoma cells from NK-mediated killing. Autophagy. 2015.doi:1080/15548627.2015.1017194
154. Yu Y, Gaillard S, Phillip JM, Huang TC, Pinto SM, Tessarollo NG, Zhang Z, Pandey A, Wirtz D, Ayhan Aet al. Inhibition of Spleen Tyrosine Kinase Potentiates Paclitaxel-Induced Cytotoxicity in OvarianCancer Cells by Stabilizing Microtubules. Cancer Cell. 2015;28(1):82-96. doi:1016/j.ccell.2015.05.009
155. Liao CH, Chang WS, Hu PS, Wu HC, Hsu SW, Liu YF, Liu SP, Hung HS, Bau DT, Tsai CW. TheContribution of MMP-7 Promoter Polymorphisms in Renal Cell Carcinoma. In Vivo. 2017;31(4):631-635. doi:21873/invivo.11104
15�. Azzato EM, Lee AJ, Teschendorff A, Ponder BA, Pharoah P, Caldas C, Maia AT. Common germ-linepolymorphism of C1QA and breast cancer survival. Br J Cancer. 2010;102(8):1294-1299.doi:1038/sj.bjc.6605625
157. Zhang L, Jiang H, Xu G, Wen H, Gu B, Liu J, Mao S, Na R, Jing Y, Ding Q et al. Proteins S100A8 andS100A9 are potential biomarkers for renal cell carcinoma in the early stages: results from aproteomic study integrated with bioinformatics analysis. Mol Med Rep. 2015;11(6):4093-4100.doi:3892/mmr.2015.3321
15�. Liang W, Yang C, Peng J, Qian Y, Wang Z. The Expression of HSPD1, SCUBE3, CXCL14 and ItsRelations with the Prognosis in Osteosarcoma. Cell Biochem Biophys. 2015;73(3):763-768.doi:1007/s12013-015-0579-7
159. Wright JH, Johnson MM, Shimizu-Albergine M, Bauer RL, Hayes BJ, Surapisitchat J, Hudkins KL,Riehle KJ, Johnson SC, Yeh MM et al. Paracrine activation of hepatic stellate cells in platelet-derivedgrowth factor C transgenic mice: evidence for stromal induction of hepatocellular carcinoma. Int JCancer. 2014;134(4):778-788. doi:1002/ijc.28421
1�0. Zhang C, Li S, Qiao B, Yang K, Liu R, Ma B, Liu Y, Zhang Z, Xu Y. CtBP2 overexpression is associatedwith tumorigenesis and poor clinical outcome of prostate cancer. Arch Med Sci. 2015;11(6):1318-1323. doi:5114/aoms.2015.56359
1�1. Ye H, Wang WG, Cao J, Hu XC. SPARCL1 suppresses cell migration and invasion in renal cellcarcinoma. Mol Med Rep. 2017;16(5):7784-7790. doi:3892/mmr.2017.7535

Page 28/49
1�2. Xiang RH, Hensel CH, Garcia DK, Carlson HC, Kok K, Daly MC, Kerbacher K, van den Berg A, VeldhuisP, Buys CH et al. Isolation of the human semaphorin III/F gene (SEMA3F) at chromosome 3p21, aregion deleted in lung cancer. Genomics. 1996;32(1):39-48. doi:1006/geno.1996.0074
1�3. Wang C, Chen Q, Li S, Li S, Zhao Z, Gao H, Wang X, Li B, Zhang W, Yuan Y et al. Dual inhibition ofPCDH9 expression by miR-215-5p up-regulation in gliomas. Oncotarget. 2017;8(6):10287-10297.doi:18632/oncotarget.14396
1�4. Piao S, Inglehart RC, Scanlon CS, Russo N, Banerjee R, D'Silva NJ. CDH11 inhibits proliferation andinvasion in head and neck cancer. J Oral Pathol Med. 2017;46(2):89-97. doi:1111/jop.12471
1�5. Zhao Z, Zhang M, Duan X, Deng T, Qiu H, Zeng G. Low NR3C2 levels correlate with aggressivefeatures and poor prognosis in non-distant metastatic clear-cell renal cell carcinoma. J Cell Physiol.2018;233(10):6825-6838. doi:1002/jcp.26550
1��. Kim GH, Won JE, Byeon Y, Kim MG, Wi TI, Lee JM, Park YY, Lee JW, Kang TH, Jung ID et al. Selectivedelivery of PLXDC1 small interfering RNA to endothelial cells for anti-angiogenesis tumor therapyusing CD44-targeted chitosan nanoparticles for epithelial ovarian cancer. Drug Deliv.2018;25(1):1394-1402. doi:1080/10717544.2018.1480672
1�7. Li X, Lin R, Li J. Epigenetic silencing of microRNA-375 regulates PDK1 expression in esophagealcancer. Dig Dis Sci. 2011;56(10):2849-2856. doi:1007/s10620-011-1711-1
1��. Li M, Zhang Z, Yuan J, Zhang Y, Jin X. Altered glutamate cysteine ligase expression and activity inrenal cell carcinoma. Biomed Rep. 2014;2(6):831-834. doi:3892/br.2014.359
1�9. Lu Z, Xiao Z, Liu F, Cui M, Li W, Yang Z Li J, Ye L, Zhang X. Long non-coding RNA HULC promotestumor angiogenesis in liver cancer by up-regulating sphingosine kinase 1 (SPHK1). Oncotarget.2016;7(1):241-254. doi:18632/oncotarget.6280
170. Bey EA, Bentle MS, Reinicke KE, Dong Y, Yang CR, Girard L, Minna JD, Bornmann WG, Gao J,Boothman DA. An NQO1- and PARP-1-mediated cell death pathway induced in non-small-cell lungcancer cells by beta-lapachone. Proc Natl Acad Sci U S A. 2007;104(28):11832-11837.doi:1073/pnas.0702176104
171. Chakraborty PK, Xiong X, Musta� SB, Saha S, Dhanasekaran D, Mandal NA, McMeekin S,Bhattacharya R, Mukherjee P. Role of cystathionine beta synthase in lipid metabolism in ovariancancer. Oncotarget. 2015;6(35):37367-37384. doi:18632/oncotarget.5424
172. Zhu Z, He A, Lv T, Xu C, Lin L, Lin J.Overexpression of P4HB is correlated with poor prognosis inhuman clear cell renal cell carcinoma. Cancer Biomark. 2019. doi:3233/CBM-190450
173. Zhao J, Li J, Fan TWM, Hou SX. Glycolytic reprogramming through PCK2 regulates tumor initiationof prostate cancer cells. Oncotarget. 2017;8(48):83602-83618. doi:18632/oncotarget.18787
174. Pirinççi N, Kaya TY, Kaba M, Ozan T, Geçit İ, Özveren H, Eren H, Ceylan K. Serum adenosinedeaminase, catalase, and carbonic anhydrase activities in patients with renal cell carcinoma. RedoxRep 2017;22(6):252-256. doi:1080/13510002.2016.1207364
175. Nikitenko LL, Leek R, Henderson S, Pillay N, Turley H, Generali D, Gunningham S, Morrin HR, PellagattiA, Rees MC et al. The G-protein-coupled receptor CLR is upregulated in an autocrine loop with

Page 29/49
adrenomedullin in clear cell renal cell carcinoma and associated with poor prognosis. Clin CancerRes. 2013;19(20):5740-5748. doi:1158/1078-0432.CCR-13-1712
17�. Salmans ML, Zhao F, Andersen B. The estrogen-regulated anterior gradient 2 (AGR2) protein in breastcancer: a potential drug target and biomarker. Breast Cancer Research. 2013;15(2):204.doi:1186/bcr3408
177. Chang YT, Wu CC, Shyr YM, Chen TC, Hwang TL, Yeh TS, Chang KP, Liu HP, Liu YL, Tsai MH et al.Secretome-based identi�cation of ULBP2 as a novel serum marker for pancreatic cancer detection.PloS one. 2011;6(5):e20029. doi:1371/journal.pone.0020029
17�. Laczmanska I, Karpinski P, Gil J, Laczmanski L, Bebenek M, Sasiadek MM. High PTPRQ expressionand its relationship to expression of PTPRZ1 and the presence of KRAS mutations in colorectalcancer tissues. Anticancer research. 2016;36(2):677-681.
179. Ly K, Essalmani R, Desjardins R, Seidah NG, Day R. An unbiased mass spectrometry approachidenti�es Glypican-3 as an interactor of proprotein convertase subtilisin/Kexin type 9 (PCSK9) andlow density lipoprotein receptor (LDLR) in hepatocellular carcinoma cells. Journal of BiologicalChemistry. 2016;291(47):24676-24687. doi:1074/jbc.M116.746883
1�0. Wang Q, Lu J, Yang C, Wang X, Cheng L, Hu G, Sun Y, Zhang X, Wu M, Liu Z. CASK and its target geneReelin were co-upregulated in human esophageal carcinoma. Cancer letters. 2002;179(1):71-77.doi:1016/s0304-3835(01)00846-1
1�1. Sarlos DP, Yusenko MV, Peter� L, Szanto A, Kovacs G. Dual role of KRT17: development of papillaryrenal cell tumor and progression of conventional renal cell carcinoma. Journal of Cancer.2019;10(21):5124-5129. doi:7150/jca.32579
1�2. Zhang B, Wang J, Huang Z, Wei P, Liu Y, Hao J, Zhao L, Zhang F, Tu Y, Wei T. Aberrantly upregulatedTRAP1 is required for tumorigenesis of breast cancer. Oncotarget. 2015;6(42):44495-44508.doi:18632/oncotarget.6252
1�3. Qin Y, Fu M, Takahashi M, Iwanami A, Kuga D, Rao RG, Sudhakar D, Huang T, Kiyohara M, Torres K etal. Epithelial membrane protein-2 (EMP2) activates Src protein and is a novel therapeutic target forglioblastoma. Journal of Biological Chemistry. 2014;289(20):13974-13985.doi:1074/jbc.M113.543728
1�4. Wu X, Deng F, Li Y, Daniels G, Du X, Ren Q, Wang J, Wang LH, Yang Y, Zhang V et al. ACSL4 promotesprostate cancer growth, invasion and hormonal resistance. Oncotarget. 2015;6(42):44849-44863.doi:18632/oncotarget.6438
1�5. Agarwal D, Goodison S, Nicholson B, Tarin D, Urquidi V. Expression of matrix metalloproteinase 8(MMP-8) and tyrosinase-related protein-1 (TYRP-1) correlates with the absence of metastasis in anisogenic human breast cancer model. Differentiation. 2003;71(2):114-125. doi:1046/j.1432-0436.2003.710202.x
1��. Niu H, Zhou W, Xu Y, Yin Z, Shen W, Ye Z, Liu Y, Chen Y, Yang S, Xiang R et al. Silencing PPA1 inhibitshuman epithelial ovarian cancer metastasis by suppressing the Wnt/β-catenin signaling pathway.Oncotarget. 2017;8(44):76266-76278. doi:18632/oncotarget.19346

Page 30/49
1�7. Fan X, Zhao Y. miR-451a inhibits cancer growth, epithelial-mesenchymal transition and inducesapoptosis in papillary thyroid cancer by targeting PSMB8. J Cell Mol Med. 2019.doi:1111/jcmm.14673
1��. Moser C, Ruemmele P, Gehmert S, Schenk H, Kreutz MP, Mycielska ME, Hackl C, Kroemer A,Schnitzbauer AA, Stoeltzing O et al. STAT5b as molecular target in pancreatic cancer--inhibition oftumor growth, angiogenesis, and metastases. Neoplasia. 2012;14(10):915-925. doi:1593/neo.12878
1�9. Lau WM, Doucet M, Stadel R, Huang D, Weber KL, Kominsky SL. Enpp1: a potential facilitator ofbreast cancer bone metastasis. PLoS One. 2013;8(7):e66752. doi:1371/journal.pone.0066752
190. Ye Y, Yin M, Huang B, Wang Y, Li X, Lou G. CLIC1 a novel biomarker of intraperitoneal metastasis inserous epithelial ovarian cancer. Tumor Biology. 2015;36(6):4175-4179. doi:1007/s13277-015-3052-8
191. Chen B, Zeng X, He Y, Wang X, Liang Z, Liu J, Zhang P, Zhu H, Xu N, Liang S. STC2 promotes theepithelial-mesenchymal transition of colorectal cancer cells through AKT-ERK signaling pathways.Oncotarget. 2016;7(44):71400-71416. doi:18632/oncotarget.12147
192. Koie T, Ohyama C, Mikami J, Iwamura H, Fujita N, Sato T, Kojima Y, Fukushi K, Yamamoto H, Imai A etal. Preoperative butyrylcholinesterase level as an independent predictor of overall survival in clearcell renal cell carcinoma patients treated with nephrectomy. The Scienti�c World Journal. 2014;2014.doi:1155/2014/948305
193. Zhu Y, Luo G, Jiang B, Yu M, Feng Y, Wang M, Xu N, Zhang X. Apolipoprotein M promotesproliferation and invasion in non-small cell lung cancers via upregulating S1PR1 and activating theERK1/2 and PI3K/AKT signaling pathways. Biochemical and biophysical research communications.2018;501(2):520-526. doi:1016/j.bbrc.2018.05.029
194. Takaha N, Sowa Y, Takeuchi I, Hongo F, Kawauchi A, Miki T. Expression and role of HMGA1 in renalcell carcinoma. The Journal of urology. 2012;187(6):2215-2222. doi:1016/j.juro.2012.01.069
195. Park JK, Park SH, So K, Bae IH, Yoo YD, Um HD. ICAM-3 enhances the migratory and invasivepotential of human non-small cell lung cancer cells by inducing MMP-2 and MMP-9 via Akt andCREB. International journal of oncology. 2010;36(1):181-192.
19�. Liang Y, Luo H, Zhang H, Dong Y, Bao Y. Oncogene Delta/Notch-Like EGF-Related Receptor PromotesCell Proliferation, Invasion, and Migration in Hepatocellular Carcinoma and Predicts a PoorPrognosis. Cancer biotherapy & radiopharmaceuticals. 2018;33(9):380-386. doi:1089/cbr.2018.2460
197. Liu F, Shangli Z, Hu Z. CAV2 promotes the growth of renal cell carcinoma through the EGFR/PI3K/Aktpathway. OncoTargets and therapy. 2018;11:6209. doi:2147/OTT.S172803
19�. Ning XH, Li T, Gong YQ, He Q, Shen QI, Peng SH, Wang JY, Chen JC, Guo YL, Gong K. Associationbetween FBP1 and hypoxia-related gene expression in clear cell renal cell carcinoma. Oncol Lett.2016;11(6):4095-4098. doi:3892/ol.2016.4504
199. Kaneda A, Kaminishi M, Nakanishi Y, Sugimura T, Ushijima T. Reduced expression of the insulin-induced protein 1 and p41 Arp2/3 complex genes in human gastric cancers. Int J Cancer.2002;100(1):57-62. doi:1002/ijc.10464

Page 31/49
200. Jin H, Lee K, Kim YH, Oh HK, Maeng YI, Kim TH, Suh DS, Bae J. Scaffold protein FHL2 facilitatesMDM2-mediated degradation of IER3 to regulate proliferation of cervical cancer cells. Oncogene.2016;35(39):5106-5118. doi:1038/onc.2016.54
201. Koster R, Panagiotou OA, Wheeler WA Karlins E, Gastier-Foster JM, Caminada de Toledo SR, PetrilliAS, Flanagan AM, Tirabosco R, Andrulis IL et al. Genome-wide association study identi�es theGLDC/IL33 locus associated with survival of osteosarcoma patients. Int J Cancer. 2018;142(8):1594-1601. doi:1002/ijc.31195
202. Liu Y, Feng X, Lai J, Yi W, Yang J, Du T, Long X, Zhang Y, Xiao Y. A novel role of kynureninase in thegrowth control of breast cancer cells and its relationships with breast cancer. J Cell Mol Med.2019;23(10):6700-6707. doi:1111/jcmm.14547
203. Ren P, Zhang JG, Xiu L, Yu ZT. Clinical signi�cance of phospholipase A2 group IIA (PLA2G2A)expression in primary resected esophageal squamous cell carcinoma. Eur Rev Med Pharmacol Sci.2013;17(6):752-.757.
204. Guo CC, Zhang XL, Yang B, Geng J, Peng B, Zheng JH. Decreased expression of Dkk1 and Dkk3 inhuman clear cell renal cell carcinoma. Molecular medicine reports. 2014;9(6):2367-2373.doi:3892/mmr.2014.2077
205. Burdelski C, Kleinhans S, Kluth M, Hube‐Magg C, Minner S, Koop C, Graefen M, Heinzer H, TsourlakisMC, Wilczak W, Marx A. Reduced AZGP1 expression is an independent predictor of early PSArecurrence and associated with ERG‐fusion positive and PTEN deleted prostate cancers. Internationaljournal of cancer. 2016;138(5):1199-1206. doi:1002/ijc.29860
20�. Watson JV, Kamkar S, James K, Kowbel D, Andaya A, Paris PL, Simko J, Carroll P, McAlhany S,Rowley D, Collins C. Molecular analysis of WFDC1/ps20 gene in prostate cancer. The Prostate.2004;61(2):192-199. doi:1002/pros.20100
207. Das R, Gregory PA, Fernandes RC, Denis I, Wang Q, Townley SL, Zhao SG, Hanson AR, Pickering MA,Armstrong HK et al. MicroRNA-194 promotes prostate cancer metastasis by inhibiting SOCS2.Cancer research. 2017;77(4):1021-1034. doi:1158/0008-5472.CAN-16-2529
20�. Kocabaş NA, Sardaş S, Cholerton S, Daly AK, Karakaya AE. Cytochrome P450 CYP1B1 and catecholO-methyltransferase (COMT) genetic polymorphisms and breast cancer susceptibility in a Turkishpopulation. Arch Toxicol. 2002 Nov;76(11):643-649. doi:1007/s00204-002-0387-x
209. Cox DG, Pontes C, Guino E, Navarro M, Osorio A, Canzian F, Moreno V. Polymorphisms inprostaglandin synthase 2/cyclooxygenase 2 (PTGS2/COX2) and risk of colorectal cancer. Br JCancer. 2004;91(2):339-343. doi:1038/sj.bjc.6601906
210. Yumrutas O, Oztuzcu S, Büyükhatipoglu H, Bozgeyik I, Bozgeyik E, Igci YZ, Bagis H, Cevik MO,Kalender ME, Eslik Z et al. The role of the UTS2 gene polymorphisms and plasma Urotensin-II levelsin breast cancer. Tumor Biology. 2015;36(6):4427-4432. doi:1007/s13277-015-3082-2
211. Zhang J, Fu Y, Chen J, Li Q, Guo H, Yang B. Genetic variant of TMBIM1 is associated with thesusceptibility of colorectal cancer in the Chinese population. Clinics and research in hepatology andgastroenterology. 2019;43(3):324-329. doi:1016/j.clinre.2018.10.013

Page 32/49
212. Hodson I, Bock M, Ritz U, Brenner W, Huber C, Seliger B. Analysis of the structural integrity of theTAP2 gene in renal cell carcinoma. International journal of oncology. 2003;23(4):991-999.
213. Li Y, Nie Y, Cao J, Tu S, Lin Y, Du Y, Li Y. G‐A variant in miR‐200c binding site of EFNA1 alterssusceptibility to gastric cancer. Molecular carcinogenesis. 2014;53(3):219-229. doi:1002/mc.21966
214. Chen FD, Chen HH, Ke SC, Zheng LR Zheng XY. SLC27A2 regulates miR-411 to affect chemo-resistance in ovarian cancer. Neoplasma. 2018;65(6):915-924. doi:4149/neo_2018_180122N48
215. Wu H, Wang K, Liu W, Hao Q. Recombinant adenovirus-mediated overexpression of PTEN and KRT10improves cisplatin resistance of ovarian cancer in vitro and in vivo. Genet Mol Res. 2015;14(2):6591-6597. doi:4238/2015
21�. Moelans CB, Verschuur‐Maes AH, Van Diest PJ. Frequent promoter hypermethylation of BRCA2,CDH13, MSH6, PAX5, PAX6 and WT1 in ductal carcinoma in situ and invasive breast cancer. TheJournal of pathology. 2011;225(2):222-231. doi:1002/path.2930
217. Ohshima J, Haruta M, Arai Y, Kasai F, Fujiwara Y, Ariga T, Okita H, Fukuzawa M, Hata J, Horie H et al.Two candidate tumor suppressor genes, MEOX2 and SOSTDC1, identi�ed in a 7p21 homozygousdeletion region in a Wilms tumor. Genes Chromosomes Cancer. 2009;48(12):1037-1050.doi:1002/gcc.20705
21�. Sehic D, Karlsson J, Sandstedt B, Gisselsson D. SIX1 protein expression selectively identi�esblastemal elements in Wilms tumor. Pediatr Blood Cancer. 2012;59(1):62-68. doi:1002/pbc.24025
219. Percicote AP, Mardegan GL, Gugelmim ES, Ioshii SO, Kuczynski AP, Nagashima S, de Noronha L.Tissue expression of retinoic acid receptor alpha and CRABP2 in metastatic nephroblastomas. DiagnPathol. 2018;13(1):9. doi:1186/s13000-018-0686-z
220. Yoo KH Park YK, Kim HS, Jung WW, Chang SG. Epigenetic inactivation of HOXA5 and MSH2 gene inclear cell renal cell carcinoma. Pathol Int. 2010;60(10):661-666. doi:1111/j.1440-1827.2010.02578.x
221. Luo J, Wang W, Tang Y, Zhou D, Gao Y, Zhang Q, Zhou X, Zhu H, Xing L, Yu J. mRNA and methylationpro�ling of radioresistant esophageal cancer cells: the involvement of Sall2 in acquired aggressivephenotypes. J Cancer. 2017;8(4):646-656. doi:7150/jca.15652
222. Gooskens SL, Gadd S, Guidry Auvil JM, Gerhard DS, Khan J, Patidar R, Meerzaman D, Chen QR, HsuCH, Yan C et al. TCF21 hypermethylation in genetically quiescent clear cell sarcoma of the kidney.Oncotarget. 2015;6(18):15828-15841. doi:18632/oncotarget.4682
223. Cheng SJ, Chang CF, Ko HH, Lee JJ, Chen HM, Wang HJ, Lin HS, Chiang CP. HypermethylatedZNF582 and PAX1 genes in mouth rinse samples as biomarkers for oral dysplasia and oral cancerdetection. Head Neck. 2018;40(2):355-368. doi:1002/hed.24958
224. Brebi P, Maldonado L, Noordhuis MG, Ili C, Leal P, Garcia P, Brait M, Ribas J, Michailidi C, Perez J et al.Genome-wide methylation pro�ling reveals Zinc �nger protein 516 (ZNF516) and FK-506-bindingprotein 6 (FKBP6) promoters frequently methylated in cervical neoplasia, associated with HPV statusand ethnicity in a Chilean population. Epigenetics. 2014;9(2):308-317. doi:4161/epi.27120
225. Kim J, Min SY, Lee HE, Kim WH. Aberrant DNA methylation and tumor suppressive activity of theEBF3 gene in gastric carcinoma. Int J Cancer. 2012;130(4):817-826. doi:1002/ijc.26038

Page 33/49
22�. Li Y, Yang Q, Guan H, Shi B, Ji M, Hou P. ZNF677 Suppresses Akt Phosphorylation and Tumorigenesisin Thyroid Cancer. Cancer Res. 2018;78(18):5216-5228. doi:1158/0008-5472.CAN-18-0003
227. Vider BZ, Zimber A, Chastre E, Gespach C, Halperin M, Mashiah P, Yaniv A, Gazit A. Deregulatedexpression of homeobox-containing genes, HOXB6, B8, C8, C9, and Cdx-1, in human colon cancer celllines. Biochem Biophys Res Commun. 2000;272(2):513-518. doi:1006/bbrc.2000.2804
22�. Li Y, Huang Y, Qi Z, Sun T, Zhou Y. MiR-338-5p Promotes Glioma Cell Invasion by Regulating TSHZ3and MMP2. Cell Mol Neurobiol. 2018;38(3):669-677. doi:1007/s10571-017-0525-x
229. Suzuki H, Ouchida M, Yamamoto H, Yano M, Toyooka S, Aoe M, Shimizu N, Date H, Shimizu K.Decreased expression of the SIN3A gene, a candidate tumor suppressor located at the prevalentallelic loss region 15q23 in non-small cell lung cancer. Lung Cancer. 2008;59(1):24-31.doi:1016/j.lungcan.2007.08.002
230. Henrich KO, Bauer T, Schulte J, Ehemann V, Deubzer H, Gogolin S, Muth D, Fischer M, Benner A, KönigR et al. CAMTA1, a 1p36 tumor suppressor candidate, inhibits growth and activates differentiationprograms in neuroblastoma cells. Cancer Res. 2011;71(8):3142-3151. doi:1158/0008-5472.CAN-10-3014
231. Shulewitz M, Soloviev I, Wu T, Koeppen H, Polakis P, Sakanaka C. Repressor roles for TCF-4 and Sfrp1in Wnt signaling in breast cancer. Oncogene. 2006;25(31):4361-4369. doi:1038/sj.onc.1209470
232. Bhanvadia RR, VanOpstall C, Brechka H, Barashi NS, Gillard M, McAuley EM, Vasquez JM, Paner G,Chan WC, Andrade J et al. MEIS1 and MEIS2 Expression and Prostate Cancer Progression: A Role ForHOXB13 Binding Partners in Metastatic Disease. Clin Cancer Res. 2018;24(15):3668-3680.doi:1158/1078-0432.CCR-17-3673
233. Zheng J, Ge P, Liu X, Wei J, Wu G, Li X. MiR-136 inhibits gastric cancer-speci�c peritoneal metastasisby targeting HOXC10. Tumour Biol. 2017;39(6):1010428317706207. doi:1177/1010428317706207
234. Stenzinger A, von Winterfeld M, Rabien A, Warth A, Kamphues C, Dietel M, Weichert W, Klauschen F,Wittschieber D. Reversion-inducing cysteine-rich protein with Kazal motif (RECK) expression: anindependent prognostic marker of survival in colorectal cancer. Hum Pathol. 2012;43(8):1314-1321.doi:1016/j.humpath.2011.10.012
235. Peng Y, Liu YM, Li LC, Wang LL, Wu XL. MicroRNA-338 inhibits growth, invasion and metastasis ofgastric cancer by targeting NRP1 expression. PLoS One. 2014;9(4):e94422.doi:1371/journal.pone.0094422
23�. Sasahira T, Nishiguchi Y, Fujiwara R, Kurihara M, Kirita T, Bosserhoff AK, Kuniyasu H. Storkhead box2 and melanoma inhibitory activity promote oral squamous cell carcinoma progression. Oncotarget.2016;7(18):26751-26764. doi:18632/oncotarget.8495
237. Feng Q, Wu X, Li F, Ning B, Lu X, Zhang Y, Pan Y, Guan W. miR-27b inhibits gastric cancer metastasisby targeting NR2F2. Protein Cell. 2017;8(2):114-122. doi:1007/s13238-016-0340-z
23�. Feigin ME, Xue B, Hammell MC, Muthuswamy SK. G-protein-coupled receptor GPR161 isoverexpressed in breast cancer and is a promoter of cell proliferation and invasion. Proc Natl AcadSci U S A. 2014;111(11):4191-4196. doi:1073/pnas.1320239111

Page 34/49
239. Zhu X, Wei L, Bai Y, Wu S, Han S. FoxC1 promotes epithelial-mesenchymal transition through PBX1dependent transactivation of ZEB2 in esophageal cancer. Am J Cancer Res. 2017;7(8):1642-1653.
240. Zhao L, Zhang Y, Liu J, Yin W, Jin D, Wang D, Zhang W. miR-185 Inhibits the Proliferation andInvasion of Non-Small Cell Lung Cancer by Targeting KLF7. Oncol Res. 2019;27(9):1015-1023.doi:3727/096504018X15247341491655
241. Shu L, Zhang Z, Cai Y. MicroRNA-204 inhibits cell migration and invasion in human cervical cancerby regulating transcription factor 12. Oncol Lett. 2018;15(1):161-166. doi:3892/ol.2017.7343
242. Wu H, Liu X, Gong P, Song W, Zhou M, Li Y, Zhao Z, Fan H.Elevated TFAP4 regulates lncRNATRERNA1 to promote cell migration and invasion in gastric cancer. Oncol Rep. 2018;40(2):923-931.doi:3892/or.2018.6466
243. Jia C, Zhang Y, Xie Y, Ren Y, Zhang H, Zhou Y, Gao N, Ding S, Han S. miR-200a-3p plays tumorsuppressor roles in gastric cancer cells by targeting KLF12. Artif Cells Nanomed Biotechnol.2019;47(1):3697-3703. doi:1080/21691401.2019.1594857
244. Liu J, Jiang J, Hui X, Wang W, Fang D, Ding L. Mir-758-5p Suppresses Glioblastoma Proliferation,Migration and Invasion by Targeting ZBTB20. Cell Physiol Biochem. 2018;48(5):2074-2083.doi:1159/000492545
245. Tsimafeyeu I, Demidov L, Stepanova E, Wynn N, Ta H. Overexpression of �broblast growth factorreceptors FGFR1 and FGFR2 in renal cell carcinoma. Scand J Urol Nephrol. 2011;45(3):190-195.doi:3109/00365599.2011.552436
24�. Vanderleede B, Opdenoordt T, Vandenbrink C, Ebert T, Vandersaag P. Implication of retinoic Acidreceptor-Beta in renal-cell carcinoma. Int J Oncol. 1995;6(2):391-400. doi:3892/ijo.6.2.391
247. Kataoka H, Tanaka M, Kanamori M, Yoshii S, Ihara M, Wang YJ, Song JP, Li ZY, Arai H, Otsuki Y et al.Expression pro�le of EFNB1, EFNB2, two ligands of EPHB2 in human gastric cancer. J Cancer ResClin Oncol. 2002 Jul;128(7):343-348. doi:1007/s00432-002-0355-0
24�. Tian C, Huang D, Yu Y, Zhang J, Fang Q, Xie C. ABCG1 as a potential oncogene in lung cancer. ExpTher Med. 2017;13(6):3189-3194. doi:3892/etm.2017.4393
249. Han Y, Ru GQ, Mou X, Wang HJ, Ma Y, He XL, Yan Z, Huang D. AUTS2 is a potential therapeutic targetfor pancreatic cancer patients with liver metastases. Med Hypotheses. 2015;85(2):203-206.doi:1016/j.mehy.2015.04.029
250. Jin H, Sun W, Zhang Y, Yan H, Liufu H, Wang S, Chen C, Gu J, Hua X, Zhou L et al. MicroRNA-411Downregulation Enhances Tumor Growth by Upregulating MLLT11 Expression in Human BladderCancer. Mol Ther Nucleic Acids. 2018;11:312-322. doi:1016/j.omtn.2018.03.003
251. Rami F, Baradaran A, Kahnamooi MM, Salehi M. Alteration of GLIS3 gene expression pattern inpatients with breast cancer. Adv Biomed Res. 2016;5:44. doi:4103/2277-9175.178803
252. Zhang C, Liu J, Zhang Y, Luo C, Zhu T, Zhang R, Yao R. LINC01342 promotes the progression ofovarian cancer by absorbing microRNA-30c-2-3p to upregulate HIF3A. J Cell Physiol. 2019.doi:1002/jcp.29289

Page 35/49
253. Takai N, Miyazaki T, Nishida M, Shang S, Nasu K, Miyakawa I. Clinical relevance of Elf-1overexpression in endometrial carcinoma. Gynecol Oncol. 2003;89(3):408-413. doi:1016/s0090-8258(03)00131-8
254. Rae FK, Hooper JD, Nicol DL, Clements JA. Characterization of a novel gene, STAG1/PMEPA1,upregulated in renal cell carcinoma and other solid tumors. Mol Carcinog. 2001;32(1):44-53.doi:1002/mc.1063
255. Khaled WT, Choon Lee S, Stingl J, Chen X, Raza Ali H, Rueda OM, Hadi F, Wang J, Yu Y, Chin SF et al.BCL11A is a triple-negative breast cancer gene with critical functions in stem and progenitor cells.Nat Commun. 2015;6:5987. doi:1038/ncomms6987
25�. Meijer D, Jansen MP, Look MP, Ruigrok-Ritstier K, van Staveren IL, Sieuwerts AM, van Agthoven T,Foekens JA, Dorssers LC, Berns EM. TSC22D1 and PSAP predict clinical outcome of tamoxifentreatment in patients with recurrent breast cancer. Breast Cancer Res Treat. 2009;113(2):253-60.doi:1007/s10549-008-9934-3
257. Sohn EJ, Jung DB, Lee H, Han I, Lee J, Lee H, Kim SH. CNOT2 promotes proliferation andangiogenesis via VEGF signaling in MDA-MB-231 breast cancer cells. Cancer Lett. 2018;431:245-246.doi:1016/j.canlet.2018.05.002
25�. Shi Y, Zhao Y, Zhang Y, AiErken , Shao N, Ye R, Lin Y4 Wang S. AFF3 upregulation mediatestamoxifen resistance in breast cancers. J Exp Clin Cancer Res. 2018;37(1):254. doi:1186/s13046-018-0928-7
259. Lu T, Li L, Zhu J, Liu J, Lin A, Fu W, Liu G, Xia H, Zhang T, He J. AURKA rs8173 G> C PolymorphismDecreases Wilms Tumor Risk in Chinese Children. Journal of oncology. 2019;2019:9074908.doi:1155/2019/9074908
2�0. Yu L, Liu X, Cui K, Di Y, Xin L, Sun X, Zhang W, Yang X, Wei M, Yao Z et al. SND1 acts downstream ofTGFβ1 and upstream of Smurf1 to promote breast cancer metastasis. Cancer research.2015;75(7):1275-1286. doi:1158/0008-5472.CAN-14-2387
2�1. Lou JC, Lan YL, Gao JX, Ma BB, Yang T, Yuan ZB, Zhang HQ, Zhu TZ, Pan N, Leng S et al. SilencingNUDT21 attenuates the mesenchymal identity of glioblastoma cells via the NF-κB pathway. Frontiersin molecular neuroscience. 2017;10:420. doi:3389/fnmol.2017.00420
2�2. Zhang Z, Zhang G, Kong C. FOXM1 participates in PLK1-regulated cell cycle progression in renal cellcancer cells. Oncology letters. 2016;11(4):2685-2691. doi:3892/ol.2016.4228
2�3. Wang W, Yang Y, Chen X, Shao S, Hu S, Zhang T. MAGI1 mediates tumor metastasis through c-Myb/miR-520h/MAGI1 signaling pathway in renal cell carcinoma. Apoptosis. 2019;24(11-12):837-848. doi:1007/s10495-019-01562-8
2�4. Su Y, Xiong J, Hu J, Wei X, Zhang X, Rao L. MicroRNA-140-5p targets insulin like growth factor 2mRNA binding protein 1 (IGF2BP1) to suppress cervical cancer growth and metastasis. Oncotarget.2016;7(42):68397-68411. doi:18632/oncotarget.11722
2�5. Arai T, Kojima S, Yamada Y, Sugawara S, Kato M, Yamazaki K, Naya Y, Ichikawa T, Seki N. Pirin: apotential novel therapeutic target for castration‐resistant prostate cancer regulated by miR‐455‐

Page 36/49
Molecular oncology. 2019;13(2):322-337. doi:10.1002/1878-0261.12405
2��. Elsheikh S, Green AR, Aleskandarany MA, Grainge M, Paish CE, Lambros MB, Reis-Filho JS, Ellis IO.CCND1 ampli�cation and cyclin D1 expression in breast cancer and their relation with proteomicsubgroups and patient outcome. Breast cancer research and treatment. 2008;109(2):325-335.doi:1007/s10549-007-9659-8
2�7. Bissig H, Staehelin F, Tolnay M, Avoledo P, Richter J, Betts D, Bruder E, Kühne T. Co-occurrence ofneuroblastoma and nephroblastoma in an infant with Fanconi's anemia. Human pathology.2002;33(10):1047-1051. doi:1053/hupa.2002.128062
2��. Flores-Pérez A, Marchat LA, Rodríguez-Cuevas S, Bautista VP, Fuentes-Mera L, Romero-Zamora D,Maciel-Dominguez A, de la Cruz OH, Fonseca-Sánchez M, Ruíz-García E et al. Suppression of cellmigration is promoted by miR-944 through targeting of SIAH1 and PTP4A1 in breast cancer cells.BMC cancer. 2016;16(1):379. doi:1186/s12885-016-2470-3
2�9. Wang N, Zhan T, Ke T, Huang X, Ke D, Wang Q, Li H. Increased expression of RRM2 by humanpapillomavirus E7 oncoprotein promotes angiogenesis in cervical cancer. British journal of cancer.2014;110(4):1034-1044. doi:1038/bjc.2013.817
270. Ma F, Bi L, Yang G, Zhang M, Liu C, Zhao Y, Wang Y, Wang J, Bai Y, Zhang Y. ZNF703 promotes tumorcell proliferation and invasion and predicts poor prognosis in patients with colorectal cancer.Oncology reports. 2014;32(3):1071-1077. doi:3892/or.2014.3313
271. Yang F, Zhou X, Miao X, Zhang T, Hang X, Tie R, Liu N, Tian F, Wang F, Yuan J. MAGEC2, an epithelial-mesenchymal transition inducer, is associated with breast cancer metastasis. Breast cancer researchand treatment. 2014;145(1):23-32. doi:1007/s10549-014-2915-9
272. Ma HW, Xie M, Sun M, Chen TY, Jin RR, Ma TS, Chen QN, Zhang EB, He XZ, De W, et al. Thepseudogene derived long noncoding RNA DUXAP8 promotes gastric cancer cell proliferation andmigration via epigenetically silencing PLEKHO1 expression. Oncotarget. 2017;8(32):52211-52224.doi:18632/oncotarget.11075
TablesDue to technical limitations, Tables 1-8 are only available as a download in the supplementary �lessection.
Figures

Page 37/49
Figure 1
Box plots of the gene expression data before normalization (A) and after normalization (B). Horizontalaxis represents the sample symbol and the vertical axis represents the gene expression values. The blackline in the box plot represents the median value of gene expression. (A1 – A36 = normal tissues samples;B1 – B36 = WT tissues samples)
Figure 2

Page 38/49
Volcano plot of differentially expressed genes. Genes with a signi�cant change of more than two-foldwere selected. Green dot signi�cant up regulated genes and red dot signi�cant down regulated genes.
Figure 3
Heat map of up regulated differentially expressed genes. Legend on the top left indicate log fold changeof genes. (A1 – A36 = normal tissues samples; B1 – B36 = WT tissues samples)

Page 39/49
Figure 4
Heat map of down regulated differentially expressed genes. Legend on the top left indicate log foldchange of genes. (A1 – A36 = normal tissues samples; B1 – B36 = WT tissues samples)
Figure 5
Protein–protein interaction network of up regulated genes. Green nodes denotes up regulated genes.

Page 40/49
Figure 6
Regression diagrams for up regulated genes. (A- Node degree; B- Betweenness centrality; C- Stresscentrality ; D-Closeness centrality; E- Clustering coe�cient)
Figure 7
Protein–protein interaction network of down regulated genes. Red nodes denotes down regulated genes.
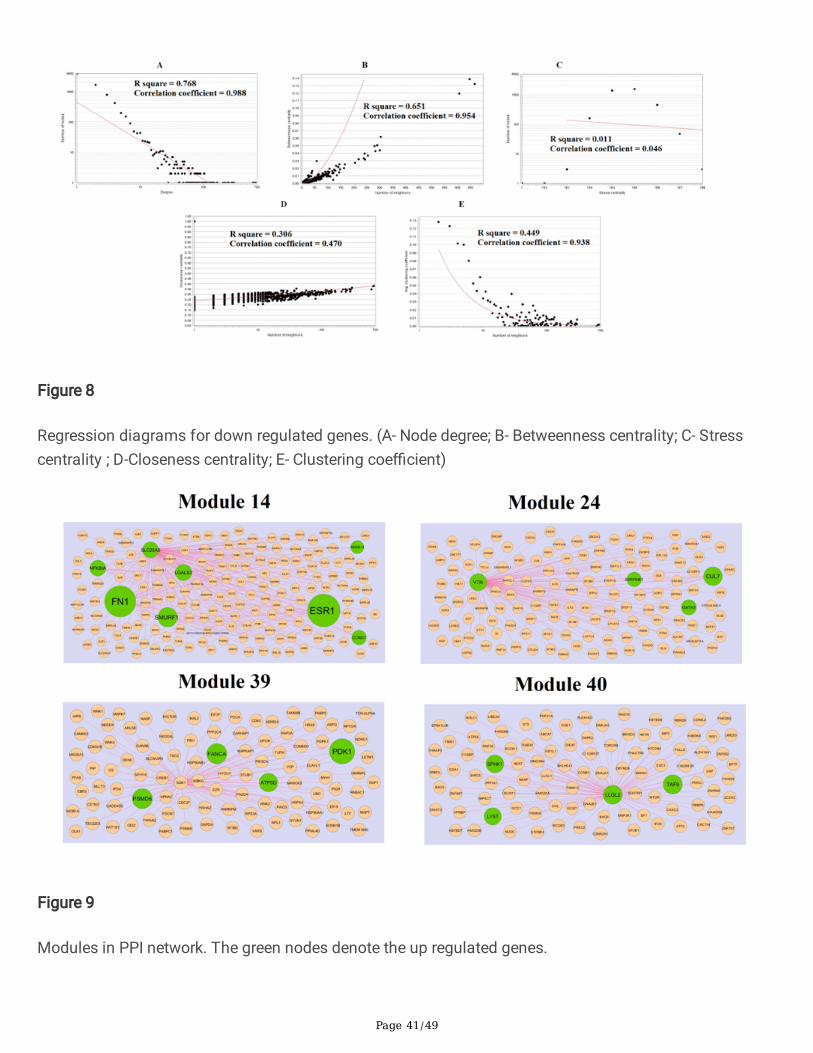
Page 41/49
Figure 8
Regression diagrams for down regulated genes. (A- Node degree; B- Betweenness centrality; C- Stresscentrality ; D-Closeness centrality; E- Clustering coe�cient)
Figure 9
Modules in PPI network. The green nodes denote the up regulated genes.

Page 42/49
Figure 10
Modules in PPI network. The red nodes denote the down regulated genes.
Figure 11
The network of up regulated genes and their related miRNAs. The green circles nodes are the up regulatedgenes, and chocolate color diamond nodes are the miRNAs

Page 43/49
Figure 12
The network of down regulated genes and their related miRNAs. The red circles nodes are the downregulated genes, and blue color diamond nodes are the miRNAs
Figure 13
The network of up regulated genes and their related TFs. The green circles nodes are the up regulatedgenes, and blue color triangle nodes are the TFs

Page 44/49
Figure 14
The network of down regulated genes and their related TFs. The green circles nodes are the downregulated genes, and purple color triangle nodes are the TFs
Figure 15
Overall survival analysis of hub genes. Overall survival analyses were performed using the UALCANonline platform. Red line denotes - high expression; Blue line denotes – low expression A) UCHL1 B) FN1C) AURKA D) TRIM41 E) TXNDC5
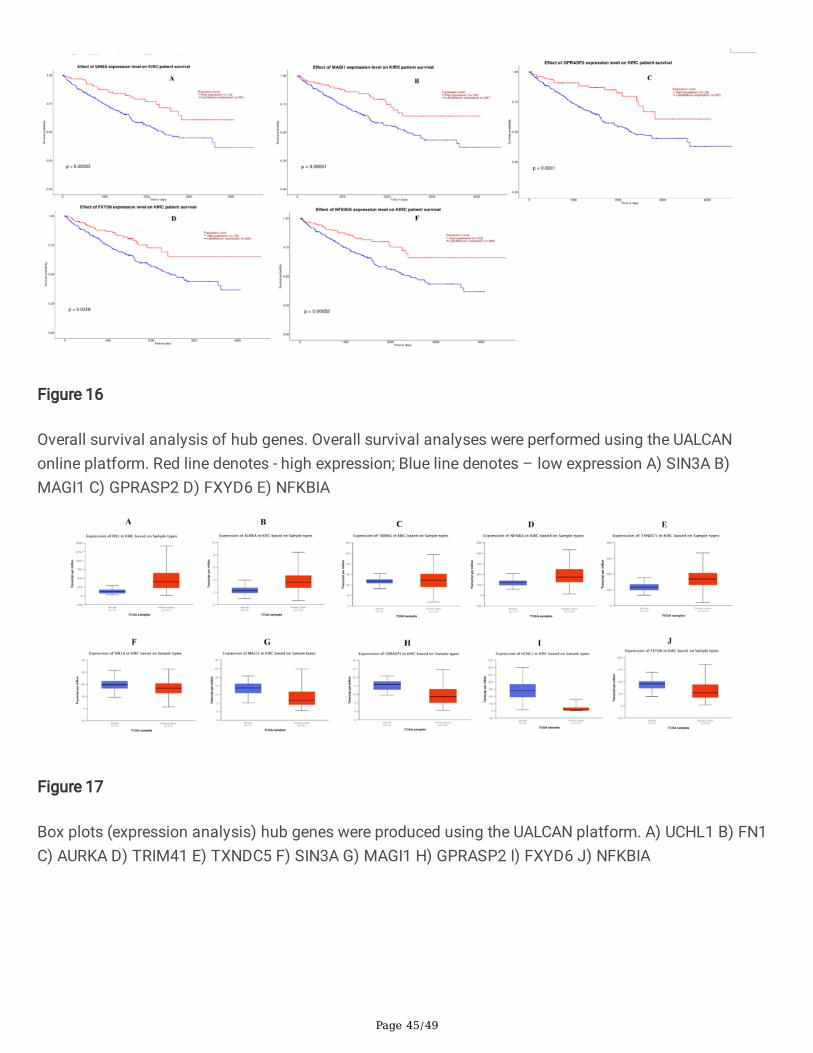
Page 45/49
Figure 16
Overall survival analysis of hub genes. Overall survival analyses were performed using the UALCANonline platform. Red line denotes - high expression; Blue line denotes – low expression A) SIN3A B)MAGI1 C) GPRASP2 D) FXYD6 E) NFKBIA
Figure 17
Box plots (expression analysis) hub genes were produced using the UALCAN platform. A) UCHL1 B) FN1C) AURKA D) TRIM41 E) TXNDC5 F) SIN3A G) MAGI1 H) GPRASP2 I) FXYD6 J) NFKBIA

Page 46/49
Figure 18
Box plots (stage analysis) of hub genes were produced using the UALCAN platform. A) UCHL1 B) FN1 C)AURKA D) TRIM41 E) TXNDC5 F) SIN3A G) MAGI1 H) GPRASP2 I) FXYD6 J) NFKBIA
Figure 19
Mutation analyses of hub genes were produced using the CbioPortal online platform. A) UCHL1 B) FN1C) AURKA D) TRIM41 E) TXNDC5 F) SIN3A G) MAGI1 H) GPRASP2 I) FXYD6 J) NFKBIA

Page 47/49
Figure 20
Immunohisto chemical analyses of hub genes were produced using the human protein atlas (HPA) onlineplatform. A) UCHL1 B) FN1 C) AURKA D) TRIM41 E) TXNDC5 F) SIN3A G) MAGI1 H) GPRASP2 I) FXYD6J) NFKBIA
Figure 21

Page 48/49
ROC curve validated the sensitivity, speci�city of hub genes as a predictive biomarker for WT prognosis.A) UCHL1 B) FN1 C) AURKA D) TRIM41 E) TXNDC5 F) SIN3A G) MAGI1 H) GPRASP2 I) FXYD6 J) NFKBIA
Figure 22
Validation of hub genes (up and down regulated) by RT- PCR. A) UCHL1 B) FN1 C) AURKA D) TRIM41 E)TXNDC5 F) SIN3A G) MAGI1 H) GPRASP2 I) FXYD6 J) NFKBIA
Figure 23
Scatter plot for immune in�ltration for hub genes (up and down regulated). A) UCHL1 B) FN1 C) AURKAD) TRIM41 E) TXNDC5 F) SIN3A G) MAGI1 H) GPRASP2 I) FXYD6 J) NFKBIA

Page 49/49
Supplementary Files
This is a list of supplementary �les associated with this preprint. Click to download.
Tables.docx