Ebola - United States - 22 October 2014 - Yale-Tulane Special Report
Tulane universiTy 2014 ClimaTe aCTion Plan A
Tulane universiTy2014 Climate Action Plan
TABLE OF CONTENTS
I. executive summaryII. The Plan’s DevelopmentIII. Tulane university’s Path to Climate neutralityIV. The Climate action Plan as a living Document
Appendices
A. schedule of investments and GHG reductions, 2015 through 2024B. Abatement Options Profiles C. Key assumptionsD. revolving loan FundE. energy Conservation Measure analysisF. implementing recommended energy Conservation MeasuresG. steps for implementing the near-Term eCM BundleH. Terms and acronyms I. ContributorsJ. Tulane university Contact
13
1425
27334547505456596163
Tulane universiTy 2014 ClimaTe aCTion Plan1 Tulane universiTy 2014 ClimaTe aCTion Plan 2
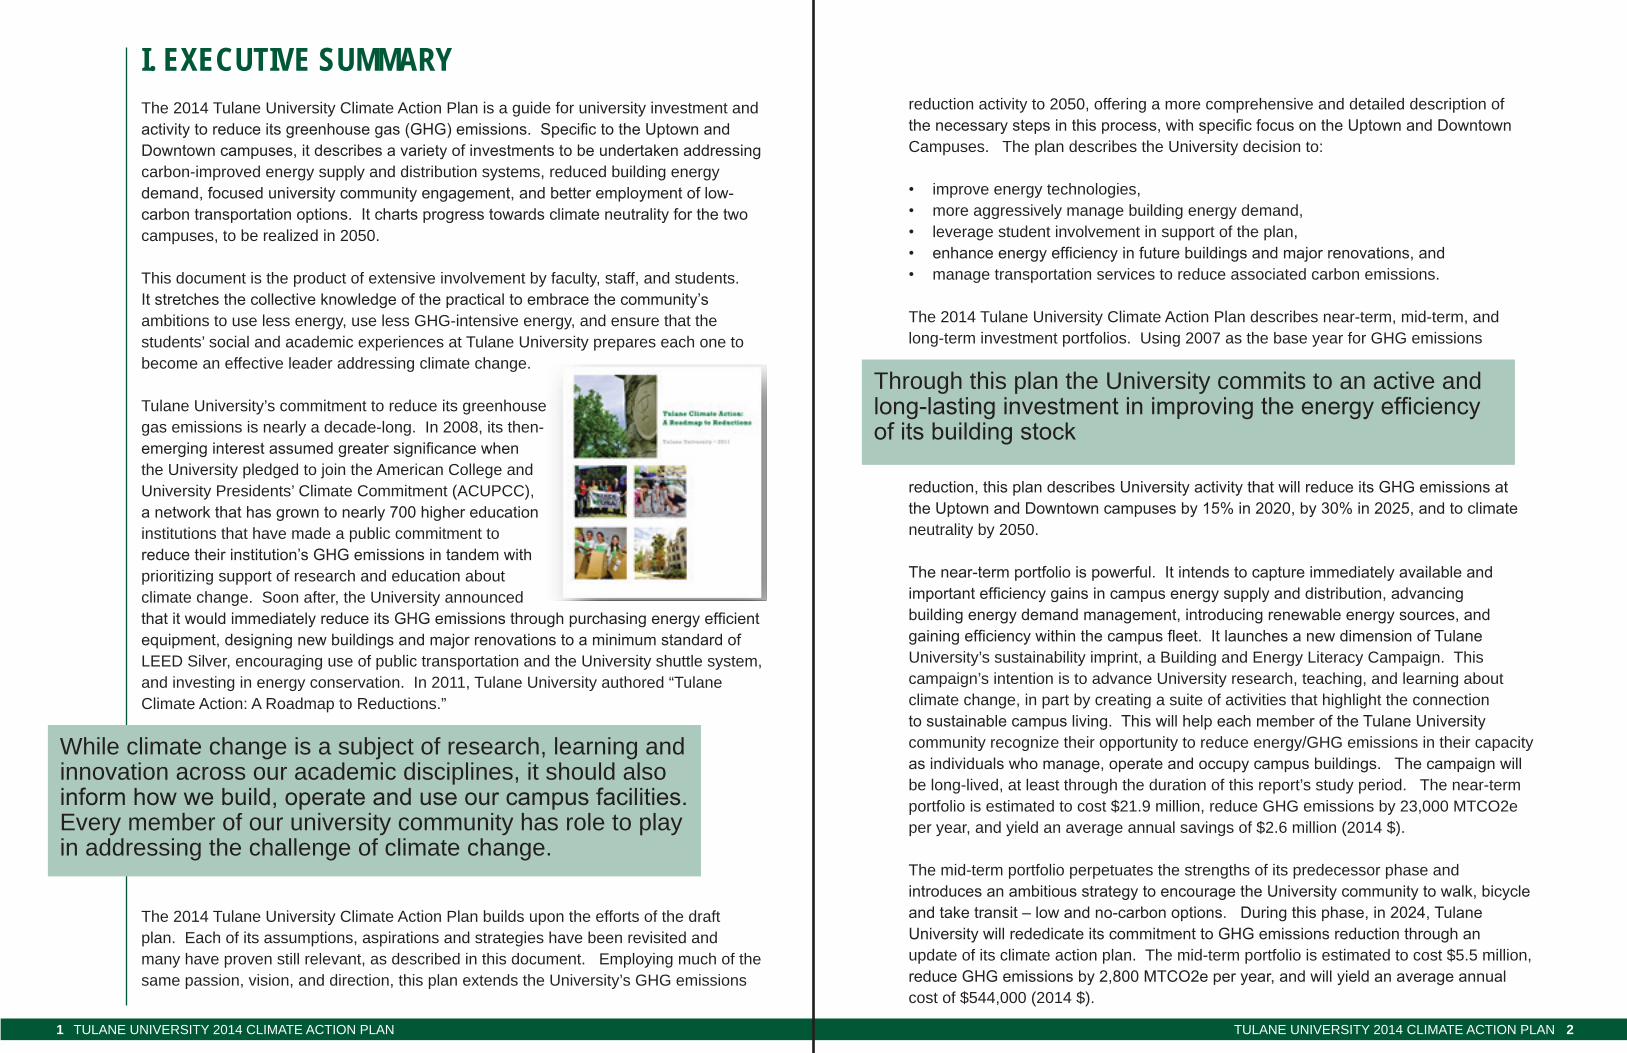
I. ExECuTIvE SummAryThe 2014 Tulane university Climate action Plan is a guide for university investment and activity to reduce its greenhouse gas (GHG) emissions. Specific to the Uptown and Downtown campuses, it describes a variety of investments to be undertaken addressing carbon-improved energy supply and distribution systems, reduced building energy demand, focused university community engagement, and better employment of low-carbon transportation options. It charts progress towards climate neutrality for the two campuses, to be realized in 2050.
This document is the product of extensive involvement by faculty, staff, and students. It stretches the collective knowledge of the practical to embrace the community’s ambitions to use less energy, use less GHG-intensive energy, and ensure that the students’ social and academic experiences at Tulane university prepares each one to become an effective leader addressing climate change.
Tulane university’s commitment to reduce its greenhouse gas emissions is nearly a decade-long. in 2008, its then-emerging interest assumed greater significance when the university pledged to join the american College and university Presidents’ Climate Commitment (aCuPCC), a network that has grown to nearly 700 higher education institutions that have made a public commitment to reduce their institution’s GHG emissions in tandem with prioritizing support of research and education about climate change. soon after, the university announced that it would immediately reduce its GHG emissions through purchasing energy efficient equipment, designing new buildings and major renovations to a minimum standard of leeD silver, encouraging use of public transportation and the university shuttle system, and investing in energy conservation. in 2011, Tulane university authored “Tulane Climate action: a roadmap to reductions.”
The 2014 Tulane university Climate action Plan builds upon the efforts of the draft plan. each of its assumptions, aspirations and strategies have been revisited and many have proven still relevant, as described in this document. employing much of the same passion, vision, and direction, this plan extends the university’s GHG emissions
While climate change is a subject of research, learning and innovation across our academic disciplines, it should also inform how we build, operate and use our campus facilities. every member of our university community has role to play in addressing the challenge of climate change.
reduction activity to 2050, offering a more comprehensive and detailed description of the necessary steps in this process, with specific focus on the Uptown and Downtown Campuses. The plan describes the university decision to:
• improve energy technologies, • more aggressively manage building energy demand,• leverage student involvement in support of the plan, • enhance energy efficiency in future buildings and major renovations, and • manage transportation services to reduce associated carbon emissions.
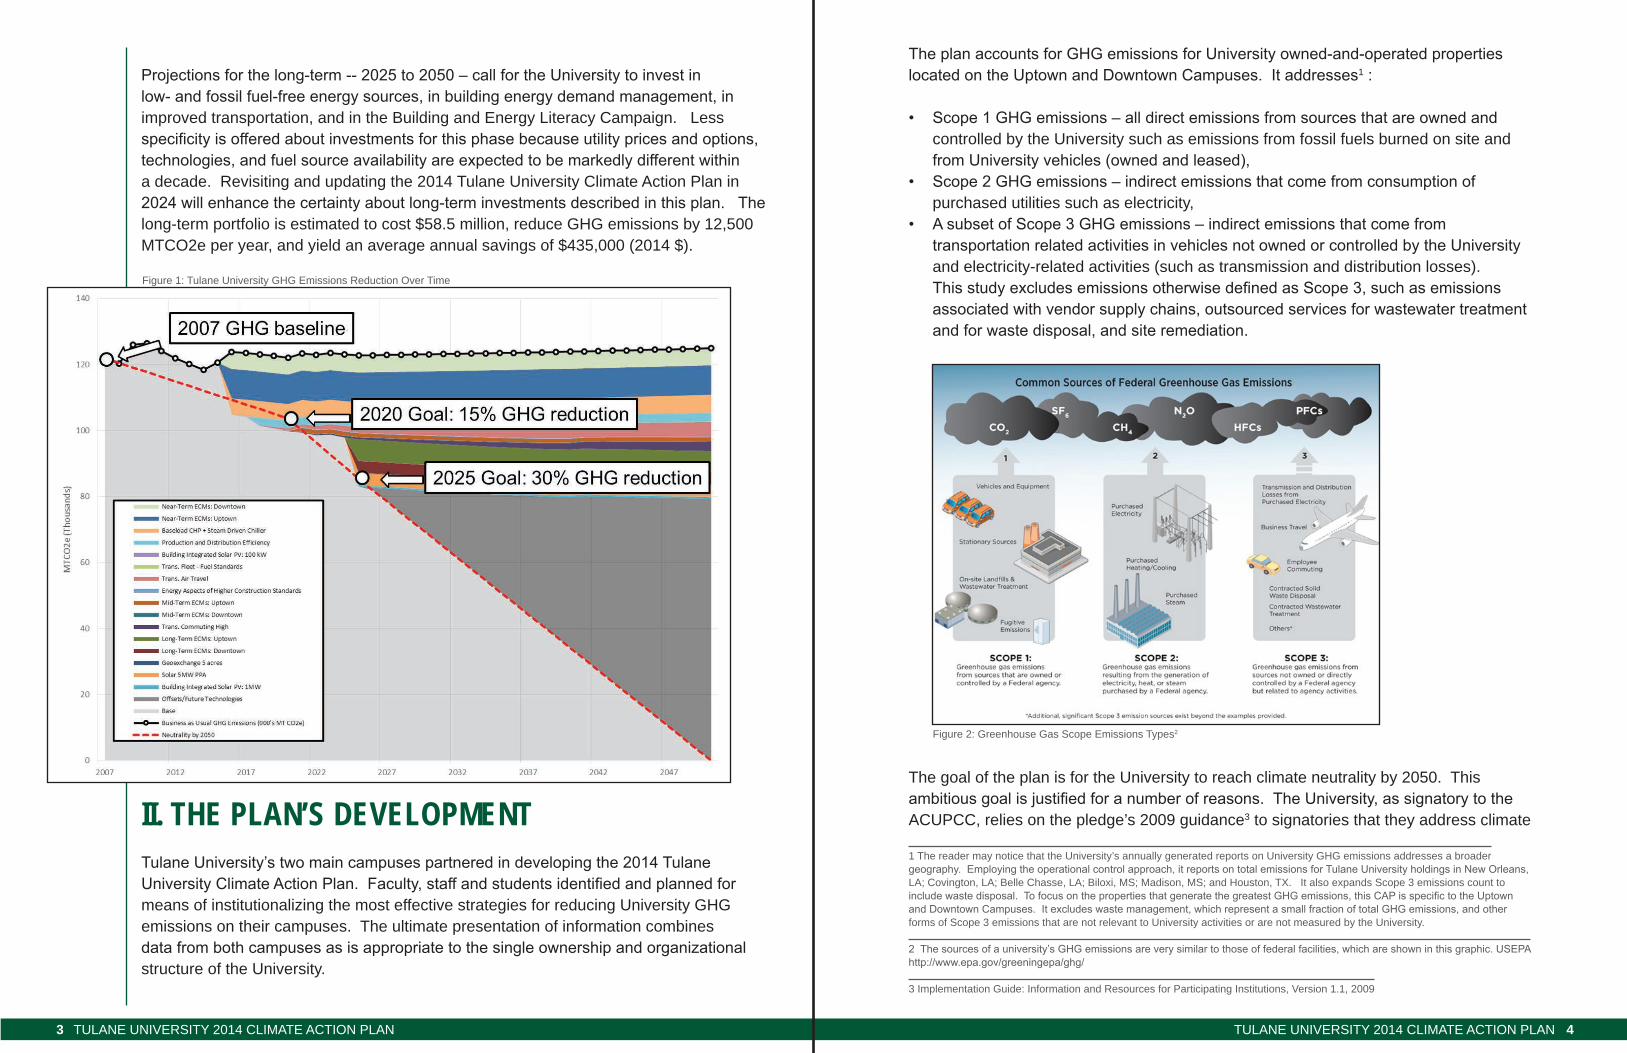
The 2014 Tulane university Climate action Plan describes near-term, mid-term, and long-term investment portfolios. using 2007 as the base year for GHG emissions
reduction, this plan describes University activity that will reduce its GHG emissions at the Uptown and Downtown campuses by 15% in 2020, by 30% in 2025, and to climate neutrality by 2050.
The near-term portfolio is powerful. It intends to capture immediately available and important efficiency gains in campus energy supply and distribution, advancing building energy demand management, introducing renewable energy sources, and gaining efficiency within the campus fleet. It launches a new dimension of Tulane university’s sustainability imprint, a Building and energy literacy Campaign. This campaign’s intention is to advance university research, teaching, and learning about climate change, in part by creating a suite of activities that highlight the connection to sustainable campus living. This will help each member of the Tulane University community recognize their opportunity to reduce energy/GHG emissions in their capacity as individuals who manage, operate and occupy campus buildings. The campaign will be long-lived, at least through the duration of this report’s study period. The near-term portfolio is estimated to cost $21.9 million, reduce GHG emissions by 23,000 MTCO2e per year, and yield an average annual savings of $2.6 million (2014 $). The mid-term portfolio perpetuates the strengths of its predecessor phase and introduces an ambitious strategy to encourage the University community to walk, bicycle and take transit – low and no-carbon options. During this phase, in 2024, Tulane University will rededicate its commitment to GHG emissions reduction through an update of its climate action plan. The mid-term portfolio is estimated to cost $5.5 million, reduce GHG emissions by 2,800 MTCO2e per year, and will yield an average annual cost of $544,000 (2014 $).
Through this plan the university commits to an active and long-lasting investment in improving the energy efficiency of its building stock
Tulane universiTy 2014 ClimaTe aCTion Plan3 Tulane universiTy 2014 ClimaTe aCTion Plan 4
Projections for the long-term -- 2025 to 2050 – call for the University to invest in low- and fossil fuel-free energy sources, in building energy demand management, in improved transportation, and in the Building and energy literacy Campaign. less specificity is offered about investments for this phase because utility prices and options, technologies, and fuel source availability are expected to be markedly different within a decade. revisiting and updating the 2014 Tulane university Climate action Plan in 2024 will enhance the certainty about long-term investments described in this plan. The long-term portfolio is estimated to cost $58.5 million, reduce GHG emissions by 12,500 MTCO2e per year, and yield an average annual savings of $435,000 (2014 $).
II. ThE PLAN’S DEvELOPmENTTulane University’s two main campuses partnered in developing the 2014 Tulane University Climate Action Plan. Faculty, staff and students identified and planned for means of institutionalizing the most effective strategies for reducing university GHG emissions on their campuses. The ultimate presentation of information combines data from both campuses as is appropriate to the single ownership and organizational structure of the university.
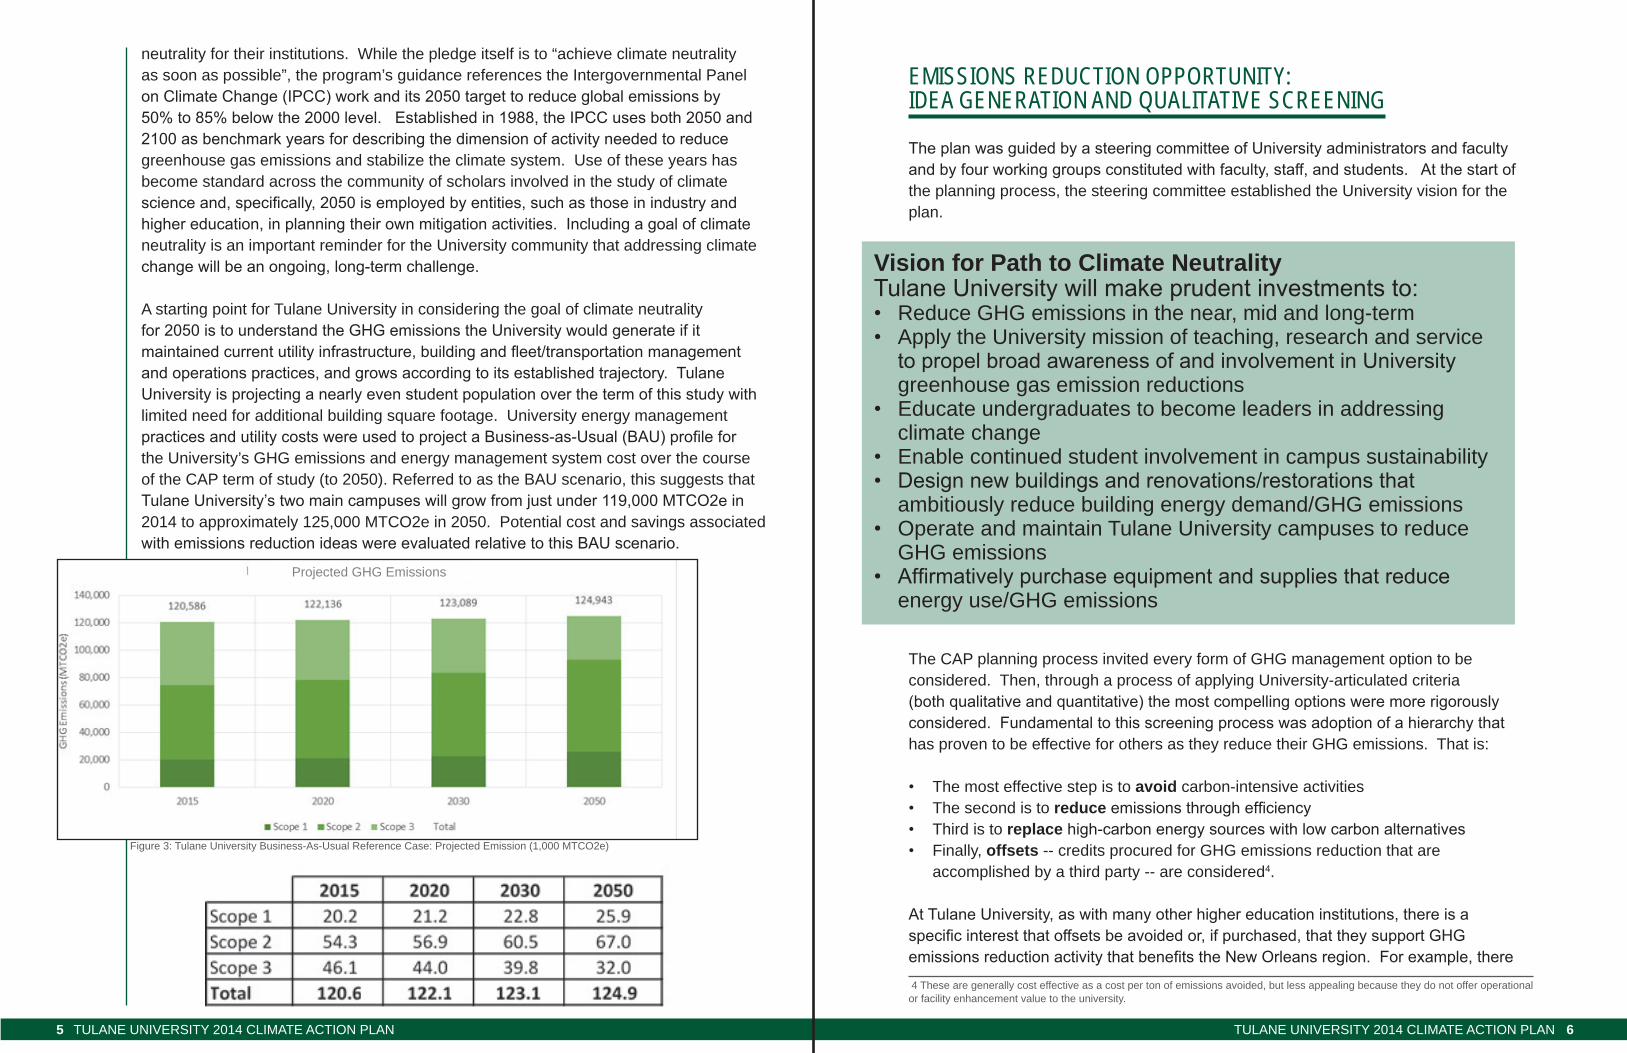
The plan accounts for GHG emissions for University owned-and-operated properties located on the Uptown and Downtown Campuses. It addresses1 :
• Scope 1 GHG emissions – all direct emissions from sources that are owned and controlled by the university such as emissions from fossil fuels burned on site and from University vehicles (owned and leased),
• Scope 2 GHG emissions – indirect emissions that come from consumption of purchased utilities such as electricity,
• A subset of Scope 3 GHG emissions – indirect emissions that come from transportation related activities in vehicles not owned or controlled by the University and electricity-related activities (such as transmission and distribution losses). This study excludes emissions otherwise defined as Scope 3, such as emissions associated with vendor supply chains, outsourced services for wastewater treatment and for waste disposal, and site remediation.
The goal of the plan is for the university to reach climate neutrality by 2050. This ambitious goal is justified for a number of reasons. The University, as signatory to the aCuPCC, relies on the pledge’s 2009 guidance3 to signatories that they address climate
Figure 2: Greenhouse Gas scope emissions Types2
1 The reader may notice that the university’s annually generated reports on university GHG emissions addresses a broader geography. Employing the operational control approach, it reports on total emissions for Tulane University holdings in New Orleans, la; Covington, la; Belle Chasse, la; Biloxi, Ms; Madison, Ms; and Houston, TX. it also expands scope 3 emissions count to include waste disposal. To focus on the properties that generate the greatest GHG emissions, this CAP is specific to the Uptown and Downtown Campuses. It excludes waste management, which represent a small fraction of total GHG emissions, and other forms of scope 3 emissions that are not relevant to university activities or are not measured by the university.
2 The sources of a university’s GHG emissions are very similar to those of federal facilities, which are shown in this graphic. USEPA http://www.epa.gov/greeningepa/ghg/
3 implementation Guide: information and resources for Participating institutions, version 1.1, 2009
Figure 1: Tulane university GHG emissions reduction Over Time
Tulane universiTy 2014 ClimaTe aCTion Plan5 Tulane universiTy 2014 ClimaTe aCTion Plan 6
neutrality for their institutions. While the pledge itself is to “achieve climate neutrality as soon as possible”, the program’s guidance references the intergovernmental Panel on Climate Change (IPCC) work and its 2050 target to reduce global emissions by 50% to 85% below the 2000 level. Established in 1988, the IPCC uses both 2050 and 2100 as benchmark years for describing the dimension of activity needed to reduce greenhouse gas emissions and stabilize the climate system. use of these years has become standard across the community of scholars involved in the study of climate science and, specifically, 2050 is employed by entities, such as those in industry and higher education, in planning their own mitigation activities. Including a goal of climate neutrality is an important reminder for the university community that addressing climate change will be an ongoing, long-term challenge.
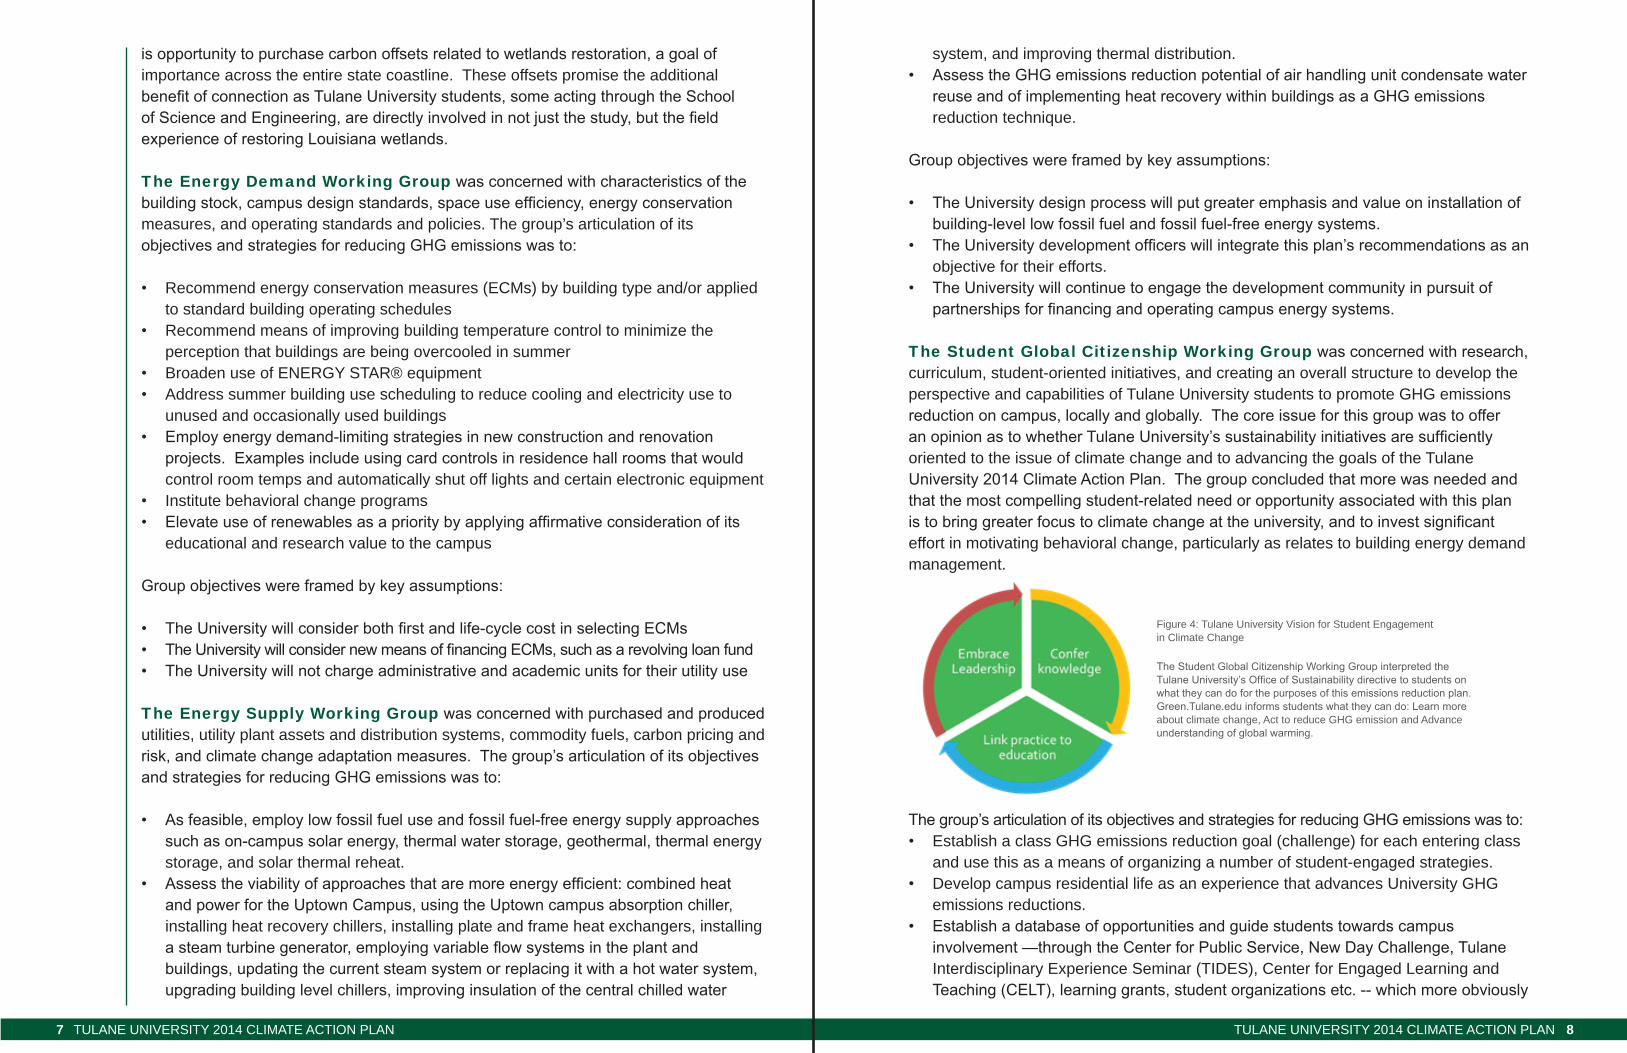
a starting point for Tulane university in considering the goal of climate neutrality for 2050 is to understand the GHG emissions the University would generate if it maintained current utility infrastructure, building and fleet/transportation management and operations practices, and grows according to its established trajectory. Tulane University is projecting a nearly even student population over the term of this study with limited need for additional building square footage. university energy management practices and utility costs were used to project a Business-as-Usual (BAU) profile for the university’s GHG emissions and energy management system cost over the course of the CaP term of study (to 2050). referred to as the Bau scenario, this suggests that Tulane University’s two main campuses will grow from just under 119,000 MTCO2e in 2014 to approximately 125,000 MTCO2e in 2050. Potential cost and savings associated with emissions reduction ideas were evaluated relative to this BAU scenario.
Figure 3: Tulane university Business-as-usual reference Case: Projected emission (1,000 MTCO2e)
Vision for Path to Climate Neutrality Tulane University will make prudent investments to:• reduce GHG emissions in the near, mid and long-term• apply the university mission of teaching, research and service
to propel broad awareness of and involvement in University greenhouse gas emission reductions
• educate undergraduates to become leaders in addressing climate change
• enable continued student involvement in campus sustainability• Design new buildings and renovations/restorations that
ambitiously reduce building energy demand/GHG emissions• Operate and maintain Tulane university campuses to reduce
GHG emissions• Affirmatively purchase equipment and supplies that reduce
energy use/GHG emissions
emissions Reduction oppoRtunity: ideA GeneRAtion And QuAlitAtive scReeninG
The plan was guided by a steering committee of University administrators and faculty and by four working groups constituted with faculty, staff, and students. At the start of the planning process, the steering committee established the university vision for the plan.
The CaP planning process invited every form of GHG management option to be considered. Then, through a process of applying university-articulated criteria (both qualitative and quantitative) the most compelling options were more rigorously considered. Fundamental to this screening process was adoption of a hierarchy that has proven to be effective for others as they reduce their GHG emissions. That is:
• The most effective step is to avoid carbon-intensive activities • The second is to reduce emissions through efficiency• Third is to replace high-carbon energy sources with low carbon alternatives• Finally, offsets -- credits procured for GHG emissions reduction that are
accomplished by a third party -- are considered4.
At Tulane University, as with many other higher education institutions, there is a specific interest that offsets be avoided or, if purchased, that they support GHG emissions reduction activity that benefits the New Orleans region. For example, there
4 These are generally cost effective as a cost per ton of emissions avoided, but less appealing because they do not offer operational or facility enhancement value to the university.
Projected GHG emissions
Tulane universiTy 2014 ClimaTe aCTion Plan7 Tulane universiTy 2014 ClimaTe aCTion Plan 8
is opportunity to purchase carbon offsets related to wetlands restoration, a goal of importance across the entire state coastline. These offsets promise the additional benefit of connection as Tulane University students, some acting through the School of Science and Engineering, are directly involved in not just the study, but the field experience of restoring Louisiana wetlands.
The Energy Demand Working Group was concerned with characteristics of the building stock, campus design standards, space use efficiency, energy conservation measures, and operating standards and policies. The group’s articulation of its objectives and strategies for reducing GHG emissions was to:
• recommend energy conservation measures (eCMs) by building type and/or applied to standard building operating schedules
• recommend means of improving building temperature control to minimize the perception that buildings are being overcooled in summer
• Broaden use of enerGy sTar® equipment• address summer building use scheduling to reduce cooling and electricity use to
unused and occasionally used buildings• Employ energy demand-limiting strategies in new construction and renovation
projects. Examples include using card controls in residence hall rooms that would control room temps and automatically shut off lights and certain electronic equipment
• institute behavioral change programs• Elevate use of renewables as a priority by applying affirmative consideration of its
educational and research value to the campus
Group objectives were framed by key assumptions:
• The University will consider both first and life-cycle cost in selecting ECMs• The University will consider new means of financing ECMs, such as a revolving loan fund• The University will not charge administrative and academic units for their utility use
The Energy Supply Working Group was concerned with purchased and produced utilities, utility plant assets and distribution systems, commodity fuels, carbon pricing and risk, and climate change adaptation measures. The group’s articulation of its objectives and strategies for reducing GHG emissions was to:
• As feasible, employ low fossil fuel use and fossil fuel-free energy supply approaches such as on-campus solar energy, thermal water storage, geothermal, thermal energy storage, and solar thermal reheat.
• Assess the viability of approaches that are more energy efficient: combined heat and power for the Uptown Campus, using the Uptown campus absorption chiller, installing heat recovery chillers, installing plate and frame heat exchangers, installing a steam turbine generator, employing variable flow systems in the plant and buildings, updating the current steam system or replacing it with a hot water system, upgrading building level chillers, improving insulation of the central chilled water
system, and improving thermal distribution.• Assess the GHG emissions reduction potential of air handling unit condensate water
reuse and of implementing heat recovery within buildings as a GHG emissions reduction technique.
Group objectives were framed by key assumptions:
• The University design process will put greater emphasis and value on installation of building-level low fossil fuel and fossil fuel-free energy systems.
• The University development officers will integrate this plan’s recommendations as an objective for their efforts.
• The University will continue to engage the development community in pursuit of partnerships for financing and operating campus energy systems.
The Student Global Citizenship Working Group was concerned with research, curriculum, student-oriented initiatives, and creating an overall structure to develop the perspective and capabilities of Tulane university students to promote GHG emissions reduction on campus, locally and globally. The core issue for this group was to offer an opinion as to whether Tulane University’s sustainability initiatives are sufficiently oriented to the issue of climate change and to advancing the goals of the Tulane University 2014 Climate Action Plan. The group concluded that more was needed and that the most compelling student-related need or opportunity associated with this plan is to bring greater focus to climate change at the university, and to invest significant effort in motivating behavioral change, particularly as relates to building energy demand management.
The group’s articulation of its objectives and strategies for reducing GHG emissions was to:• establish a class GHG emissions reduction goal (challenge) for each entering class
and use this as a means of organizing a number of student-engaged strategies. • Develop campus residential life as an experience that advances university GHG
emissions reductions.• Establish a database of opportunities and guide students towards campus
involvement —through the Center for Public Service, New Day Challenge, Tulane interdisciplinary experience seminar (TiDes), Center for engaged learning and Teaching (CELT), learning grants, student organizations etc. -- which more obviously
Figure 4: Tulane university vision for student engagement in Climate Change
The Student Global Citizenship Working Group interpreted the Tulane University’s Office of Sustainability directive to students on what they can do for the purposes of this emissions reduction plan. Green.Tulane.edu informs students what they can do: Learn more about climate change, act to reduce GHG emission and advance understanding of global warming.
Tulane universiTy 2014 ClimaTe aCTion Plan9 Tulane universiTy 2014 ClimaTe aCTion Plan 10
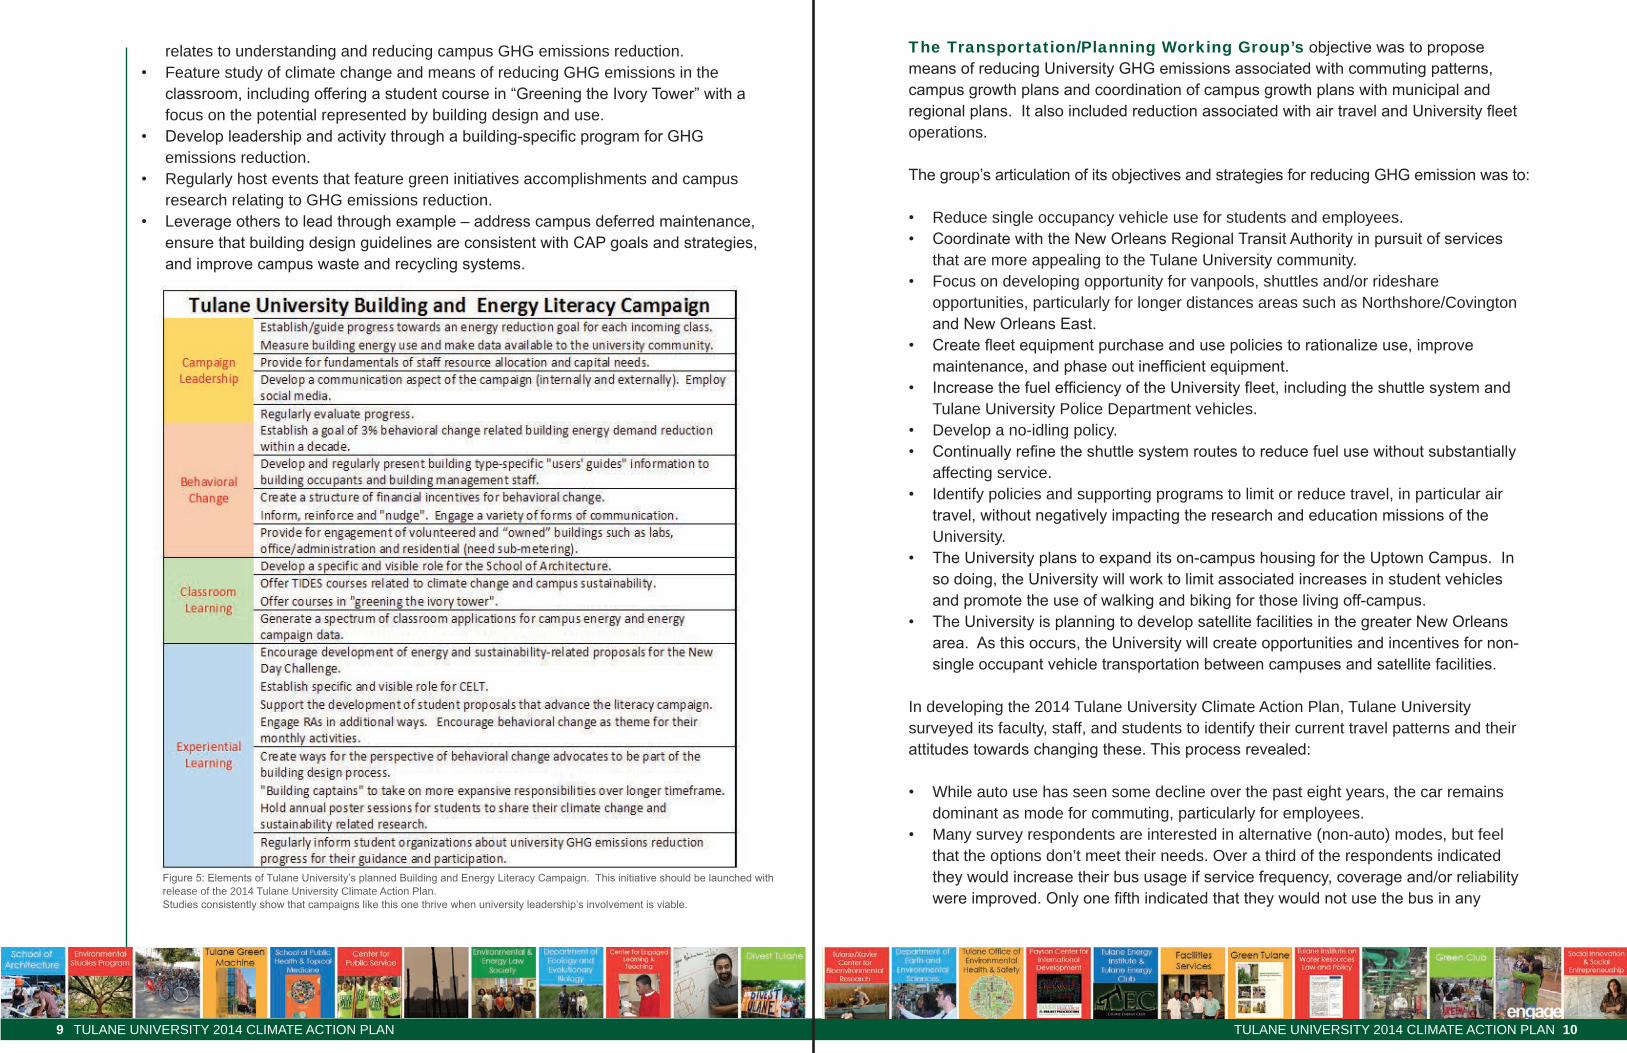
relates to understanding and reducing campus GHG emissions reduction.• Feature study of climate change and means of reducing GHG emissions in the
classroom, including offering a student course in “Greening the Ivory Tower” with a focus on the potential represented by building design and use.
• Develop leadership and activity through a building-specific program for GHG emissions reduction.
• regularly host events that feature green initiatives accomplishments and campus research relating to GHG emissions reduction.
• Leverage others to lead through example – address campus deferred maintenance, ensure that building design guidelines are consistent with CAP goals and strategies, and improve campus waste and recycling systems.
Figure 5: Elements of Tulane University’s planned Building and Energy Literacy Campaign. This initiative should be launched with release of the 2014 Tulane university Climate action Plan.Studies consistently show that campaigns like this one thrive when university leadership’s involvement is viable.
The Transportation/Planning Working Group’s objective was to propose means of reducing University GHG emissions associated with commuting patterns, campus growth plans and coordination of campus growth plans with municipal and regional plans. It also included reduction associated with air travel and University fleet operations.
The group’s articulation of its objectives and strategies for reducing GHG emission was to:
• reduce single occupancy vehicle use for students and employees. • Coordinate with the New Orleans Regional Transit Authority in pursuit of services
that are more appealing to the Tulane university community.• Focus on developing opportunity for vanpools, shuttles and/or rideshare
opportunities, particularly for longer distances areas such as northshore/Covington and New Orleans East.
• Create fleet equipment purchase and use policies to rationalize use, improve maintenance, and phase out inefficient equipment.
• Increase the fuel efficiency of the University fleet, including the shuttle system and Tulane university Police Department vehicles.
• Develop a no-idling policy.• Continually refine the shuttle system routes to reduce fuel use without substantially
affecting service. • identify policies and supporting programs to limit or reduce travel, in particular air
travel, without negatively impacting the research and education missions of the university.
• The University plans to expand its on-campus housing for the Uptown Campus. In so doing, the University will work to limit associated increases in student vehicles and promote the use of walking and biking for those living off-campus.
• The University is planning to develop satellite facilities in the greater New Orleans area. As this occurs, the University will create opportunities and incentives for non-single occupant vehicle transportation between campuses and satellite facilities.
in developing the 2014 Tulane university Climate action Plan, Tulane university surveyed its faculty, staff, and students to identify their current travel patterns and their attitudes towards changing these. This process revealed:
• While auto use has seen some decline over the past eight years, the car remains dominant as mode for commuting, particularly for employees.
• Many survey respondents are interested in alternative (non-auto) modes, but feel that the options don’t meet their needs. Over a third of the respondents indicated they would increase their bus usage if service frequency, coverage and/or reliability were improved. Only one fifth indicated that they would not use the bus in any
Tulane universiTy 2014 ClimaTe aCTion Plan11 Tulane universiTy 2014 ClimaTe aCTion Plan 12
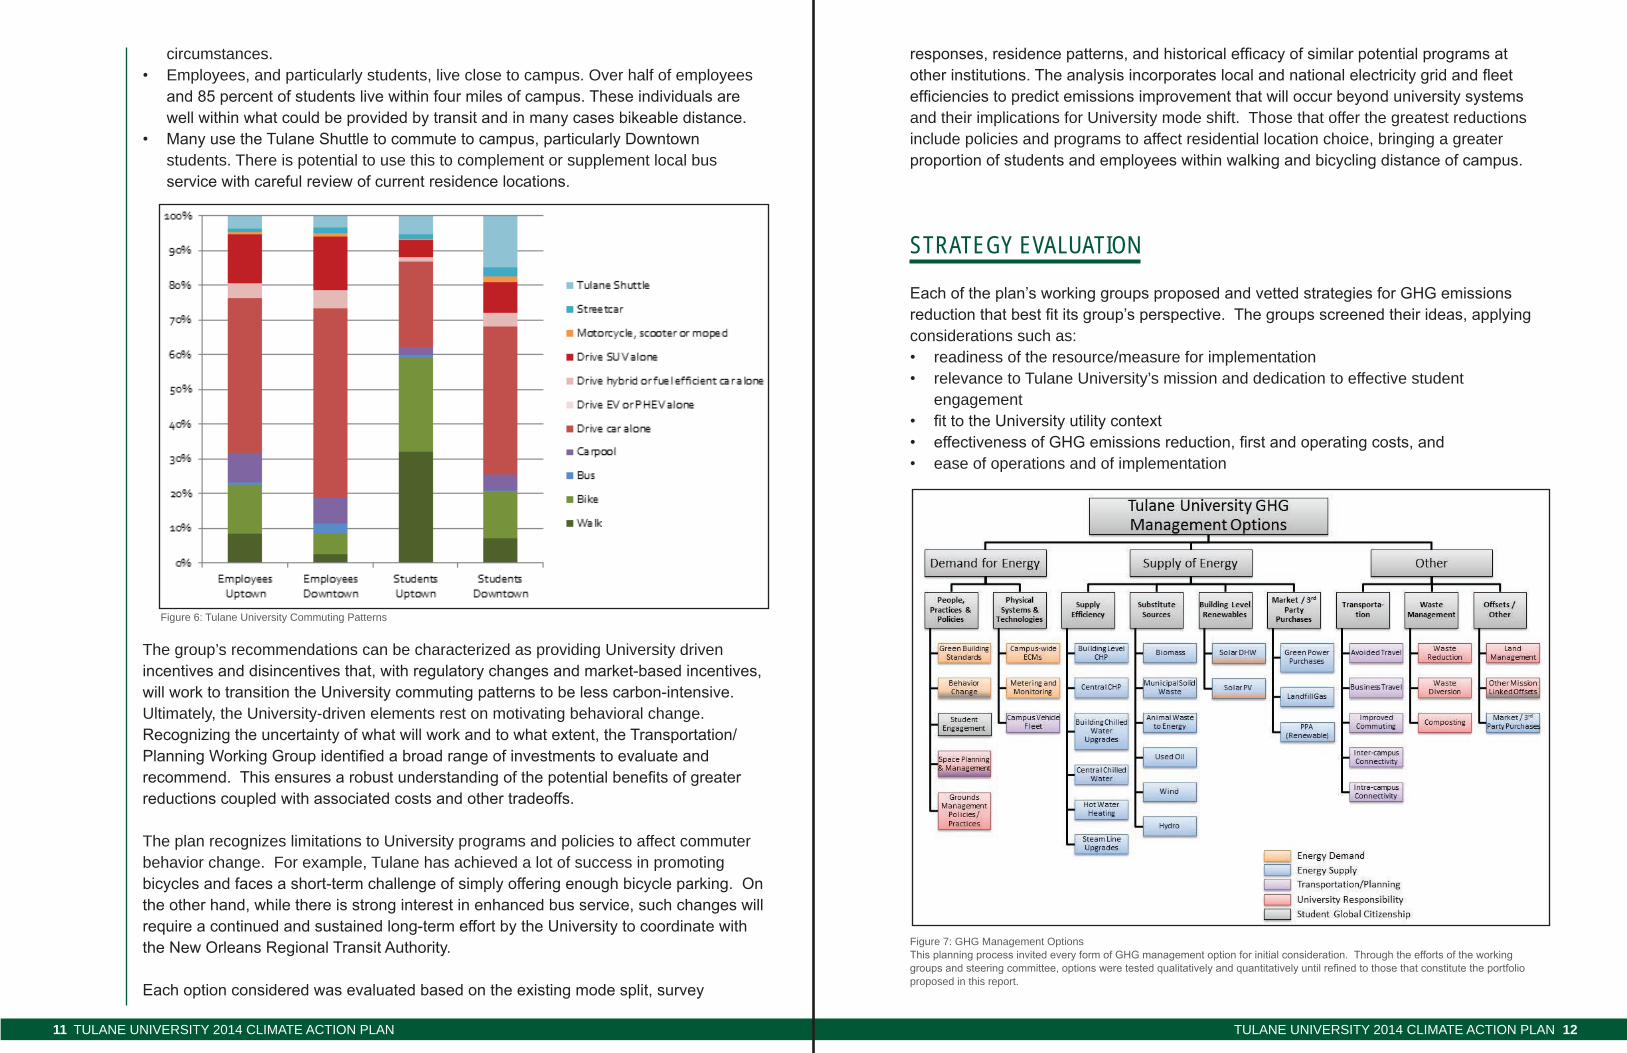
circumstances.• employees, and particularly students, live close to campus. Over half of employees
and 85 percent of students live within four miles of campus. These individuals are well within what could be provided by transit and in many cases bikeable distance.
• Many use the Tulane Shuttle to commute to campus, particularly Downtown students. There is potential to use this to complement or supplement local bus service with careful review of current residence locations.
The group’s recommendations can be characterized as providing university driven incentives and disincentives that, with regulatory changes and market-based incentives, will work to transition the University commuting patterns to be less carbon-intensive. ultimately, the university-driven elements rest on motivating behavioral change. Recognizing the uncertainty of what will work and to what extent, the Transportation/Planning Working Group identified a broad range of investments to evaluate and recommend. This ensures a robust understanding of the potential benefits of greater reductions coupled with associated costs and other tradeoffs.
The plan recognizes limitations to university programs and policies to affect commuter behavior change. For example, Tulane has achieved a lot of success in promoting bicycles and faces a short-term challenge of simply offering enough bicycle parking. On the other hand, while there is strong interest in enhanced bus service, such changes will require a continued and sustained long-term effort by the University to coordinate with the New Orleans Regional Transit Authority.
Each option considered was evaluated based on the existing mode split, survey
Figure 6: Tulane university Commuting Patterns
responses, residence patterns, and historical efficacy of similar potential programs at other institutions. The analysis incorporates local and national electricity grid and fleet efficiencies to predict emissions improvement that will occur beyond university systems and their implications for university mode shift. Those that offer the greatest reductions include policies and programs to affect residential location choice, bringing a greater proportion of students and employees within walking and bicycling distance of campus.
stRAteGy evAluAtion
Each of the plan’s working groups proposed and vetted strategies for GHG emissions reduction that best fit its group’s perspective. The groups screened their ideas, applying considerations such as:• readiness of the resource/measure for implementation• relevance to Tulane university’s mission and dedication to effective student
engagement • fit to the University utility context • effectiveness of GHG emissions reduction, first and operating costs, and • ease of operations and of implementation
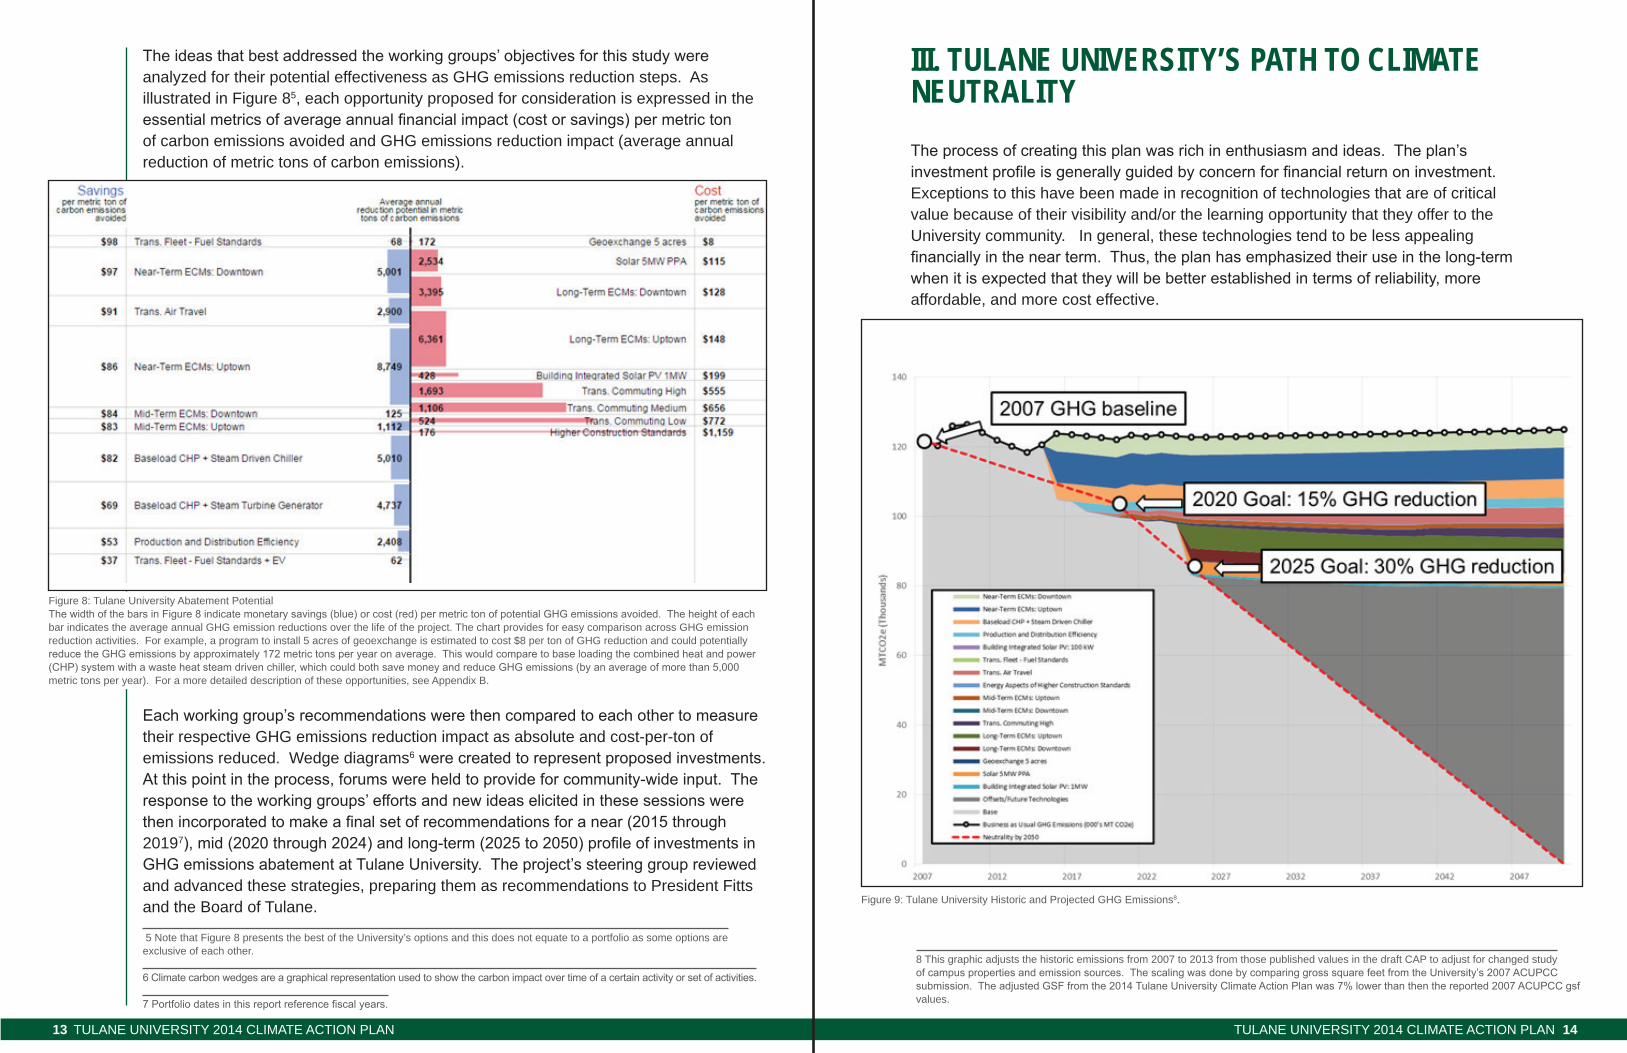
Figure 7: GHG Management OptionsThis planning process invited every form of GHG management option for initial consideration. Through the efforts of the working groups and steering committee, options were tested qualitatively and quantitatively until refined to those that constitute the portfolio proposed in this report.
Tulane universiTy 2014 ClimaTe aCTion Plan13 Tulane universiTy 2014 ClimaTe aCTion Plan 14
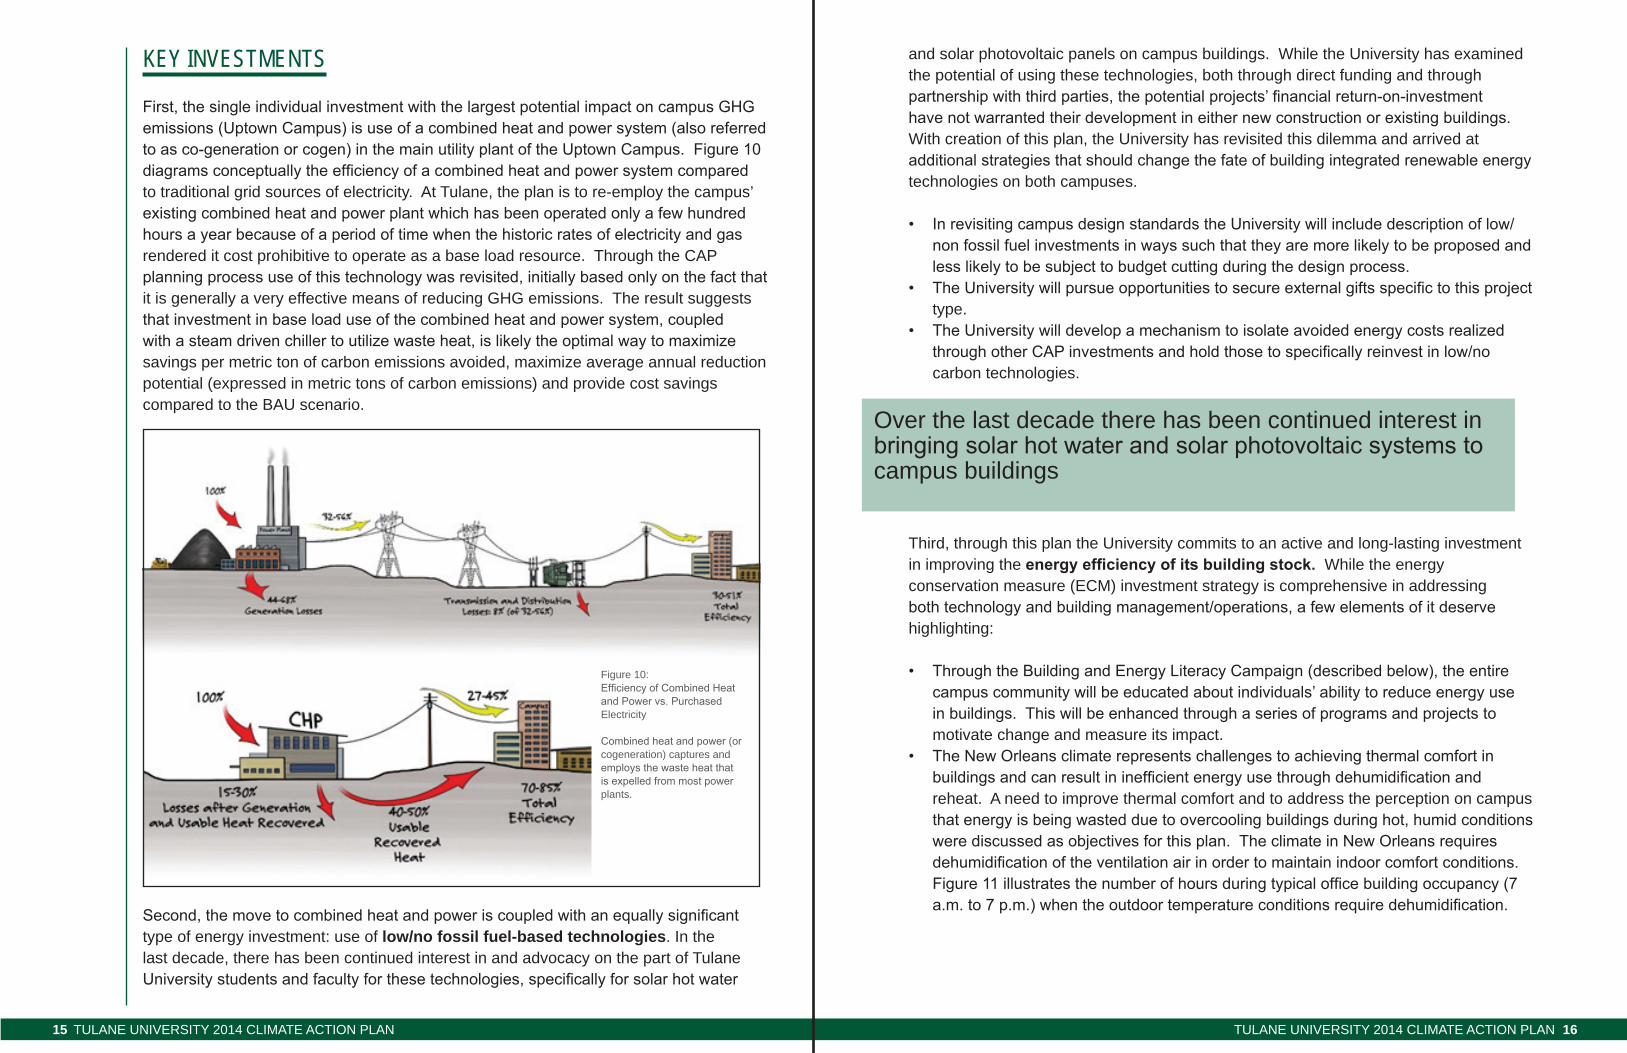
The ideas that best addressed the working groups’ objectives for this study were analyzed for their potential effectiveness as GHG emissions reduction steps. as illustrated in Figure 85, each opportunity proposed for consideration is expressed in the essential metrics of average annual financial impact (cost or savings) per metric ton of carbon emissions avoided and GHG emissions reduction impact (average annual reduction of metric tons of carbon emissions).
Each working group’s recommendations were then compared to each other to measure their respective GHG emissions reduction impact as absolute and cost-per-ton of emissions reduced. Wedge diagrams6 were created to represent proposed investments. At this point in the process, forums were held to provide for community-wide input. The response to the working groups’ efforts and new ideas elicited in these sessions were then incorporated to make a final set of recommendations for a near (2015 through 20197), mid (2020 through 2024) and long-term (2025 to 2050) profile of investments in GHG emissions abatement at Tulane University. The project’s steering group reviewed and advanced these strategies, preparing them as recommendations to President Fitts and the Board of Tulane.
Figure 8: Tulane university abatement PotentialThe width of the bars in Figure 8 indicate monetary savings (blue) or cost (red) per metric ton of potential GHG emissions avoided. The height of each bar indicates the average annual GHG emission reductions over the life of the project. The chart provides for easy comparison across GHG emission reduction activities. For example, a program to install 5 acres of geoexchange is estimated to cost $8 per ton of GHG reduction and could potentially reduce the GHG emissions by approximately 172 metric tons per year on average. This would compare to base loading the combined heat and power (CHP) system with a waste heat steam driven chiller, which could both save money and reduce GHG emissions (by an average of more than 5,000 metric tons per year). For a more detailed description of these opportunities, see appendix B.
5 note that Figure 8 presents the best of the university’s options and this does not equate to a portfolio as some options are exclusive of each other.
6 Climate carbon wedges are a graphical representation used to show the carbon impact over time of a certain activity or set of activities. 7 Portfolio dates in this report reference fiscal years.
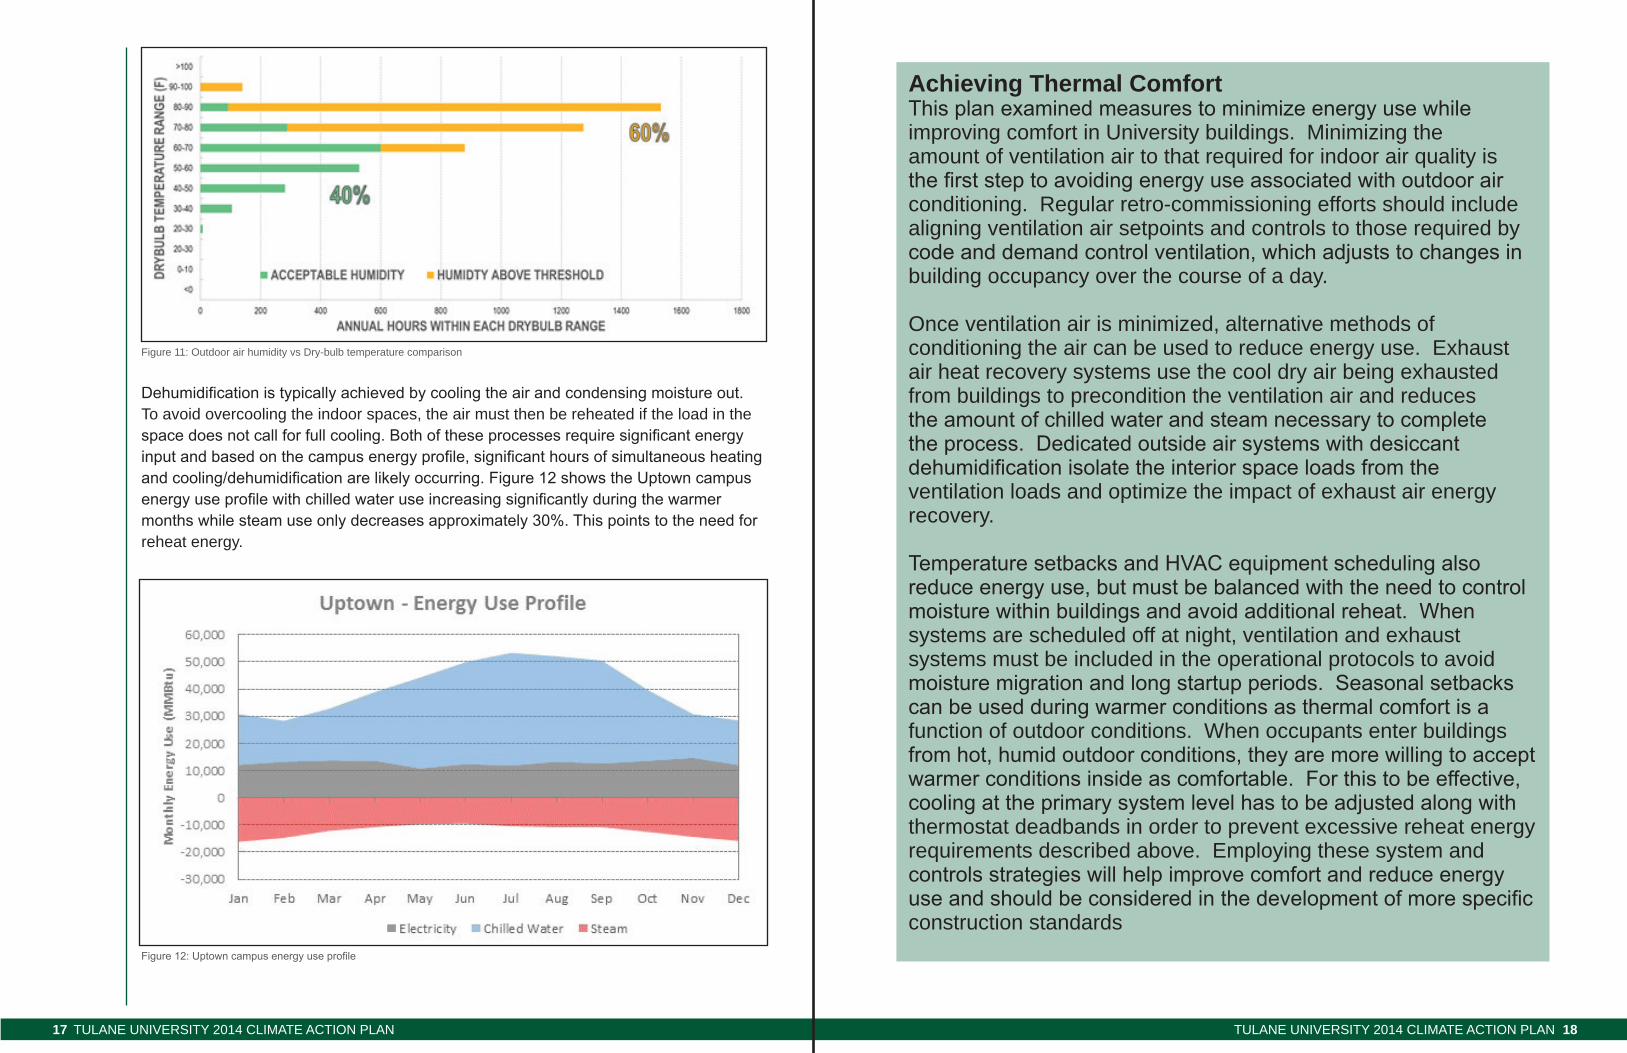
III. TuLANE uNIvErSITy’S PATh TO CLImATE NEuTrALITy The process of creating this plan was rich in enthusiasm and ideas. The plan’s investment profile is generally guided by concern for financial return on investment. exceptions to this have been made in recognition of technologies that are of critical value because of their visibility and/or the learning opportunity that they offer to the university community. in general, these technologies tend to be less appealing financially in the near term. Thus, the plan has emphasized their use in the long-term when it is expected that they will be better established in terms of reliability, more affordable, and more cost effective.
Figure 9: Tulane university Historic and Projected GHG emissions8.
8 This graphic adjusts the historic emissions from 2007 to 2013 from those published values in the draft CaP to adjust for changed study of campus properties and emission sources. The scaling was done by comparing gross square feet from the University’s 2007 ACUPCC submission. The adjusted GSF from the 2014 Tulane University Climate Action Plan was 7% lower than then the reported 2007 ACUPCC gsf values.
Tulane universiTy 2014 ClimaTe aCTion Plan15 Tulane universiTy 2014 ClimaTe aCTion Plan 16
Key investments
First, the single individual investment with the largest potential impact on campus GHG emissions (Uptown Campus) is use of a combined heat and power system (also referred to as co-generation or cogen) in the main utility plant of the Uptown Campus. Figure 10 diagrams conceptually the efficiency of a combined heat and power system compared to traditional grid sources of electricity. at Tulane, the plan is to re-employ the campus’ existing combined heat and power plant which has been operated only a few hundred hours a year because of a period of time when the historic rates of electricity and gas rendered it cost prohibitive to operate as a base load resource. Through the CaP planning process use of this technology was revisited, initially based only on the fact that it is generally a very effective means of reducing GHG emissions. The result suggests that investment in base load use of the combined heat and power system, coupled with a steam driven chiller to utilize waste heat, is likely the optimal way to maximize savings per metric ton of carbon emissions avoided, maximize average annual reduction potential (expressed in metric tons of carbon emissions) and provide cost savings compared to the Bau scenario.
Second, the move to combined heat and power is coupled with an equally significant type of energy investment: use of low/no fossil fuel-based technologies. in the last decade, there has been continued interest in and advocacy on the part of Tulane University students and faculty for these technologies, specifically for solar hot water
Figure 10:Efficiency of Combined Heat and Power vs. Purchased electricity
Combined heat and power (or cogeneration) captures and employs the waste heat that is expelled from most power plants.
and solar photovoltaic panels on campus buildings. While the university has examined the potential of using these technologies, both through direct funding and through partnership with third parties, the potential projects’ financial return-on-investment have not warranted their development in either new construction or existing buildings. With creation of this plan, the university has revisited this dilemma and arrived at additional strategies that should change the fate of building integrated renewable energy technologies on both campuses.
• In revisiting campus design standards the University will include description of low/non fossil fuel investments in ways such that they are more likely to be proposed and less likely to be subject to budget cutting during the design process.
• The University will pursue opportunities to secure external gifts specific to this project type.
• The University will develop a mechanism to isolate avoided energy costs realized through other CAP investments and hold those to specifically reinvest in low/no carbon technologies.
Third, through this plan the university commits to an active and long-lasting investment in improving the energy efficiency of its building stock. While the energy conservation measure (eCM) investment strategy is comprehensive in addressing both technology and building management/operations, a few elements of it deserve highlighting:
• Through the Building and Energy Literacy Campaign (described below), the entire campus community will be educated about individuals’ ability to reduce energy use in buildings. This will be enhanced through a series of programs and projects to motivate change and measure its impact.
• The New Orleans climate represents challenges to achieving thermal comfort in buildings and can result in inefficient energy use through dehumidification and reheat. a need to improve thermal comfort and to address the perception on campus that energy is being wasted due to overcooling buildings during hot, humid conditions were discussed as objectives for this plan. The climate in New Orleans requires dehumidification of the ventilation air in order to maintain indoor comfort conditions. Figure 11 illustrates the number of hours during typical office building occupancy (7 a.m. to 7 p.m.) when the outdoor temperature conditions require dehumidification.
Over the last decade there has been continued interest in bringing solar hot water and solar photovoltaic systems to campus buildings
Tulane universiTy 2014 ClimaTe aCTion Plan17 Tulane universiTy 2014 ClimaTe aCTion Plan 18
Dehumidification is typically achieved by cooling the air and condensing moisture out. To avoid overcooling the indoor spaces, the air must then be reheated if the load in the space does not call for full cooling. Both of these processes require significant energy input and based on the campus energy profile, significant hours of simultaneous heating and cooling/dehumidification are likely occurring. Figure 12 shows the Uptown campus energy use profile with chilled water use increasing significantly during the warmer months while steam use only decreases approximately 30%. This points to the need for reheat energy.
Figure 12: Uptown campus energy use profile
Achieving Thermal ComfortThis plan examined measures to minimize energy use while improving comfort in university buildings. Minimizing the amount of ventilation air to that required for indoor air quality is the first step to avoiding energy use associated with outdoor air conditioning. regular retro-commissioning efforts should include aligning ventilation air setpoints and controls to those required by code and demand control ventilation, which adjusts to changes in building occupancy over the course of a day.
Once ventilation air is minimized, alternative methods of conditioning the air can be used to reduce energy use. exhaust air heat recovery systems use the cool dry air being exhausted from buildings to precondition the ventilation air and reduces the amount of chilled water and steam necessary to complete the process. Dedicated outside air systems with desiccant dehumidification isolate the interior space loads from the ventilation loads and optimize the impact of exhaust air energy recovery.
Temperature setbacks and HVAC equipment scheduling also reduce energy use, but must be balanced with the need to control moisture within buildings and avoid additional reheat. When systems are scheduled off at night, ventilation and exhaust systems must be included in the operational protocols to avoid moisture migration and long startup periods. Seasonal setbacks can be used during warmer conditions as thermal comfort is a function of outdoor conditions. When occupants enter buildings from hot, humid outdoor conditions, they are more willing to accept warmer conditions inside as comfortable. For this to be effective, cooling at the primary system level has to be adjusted along with thermostat deadbands in order to prevent excessive reheat energy requirements described above. employing these system and controls strategies will help improve comfort and reduce energy use and should be considered in the development of more specific construction standards
Figure 11: Outdoor air humidity vs Dry-bulb temperature comparison
Tulane universiTy 2014 ClimaTe aCTion Plan19 Tulane universiTy 2014 ClimaTe aCTion Plan 20
At this writing, the Uptown Campus buildings have electric meters and the Downtown buildings are largely independently metered for electricity and natural gas use. Building level chilled water or steam use is not metered on all Uptown Campus buildings and no submetering (i.e. lights, fans, plug load, etc.) is installed at either campus. a pilot energy dashboard project is being pursued on four buildings, but otherwise, active energy management through the use of building level and submetered energy end use has not been employed. The university’s efforts to reduce energy use have primarily been achieved through employing campus energy standards and performance contracts with Johnson Controls, Inc. on both the Uptown and Downtown campuses. The campus energy standards have resulted in several LEED certified buildings and the performance contracts have replaced outdated primary cooling and heating systems downtown along with multiple building level upgrades such as variable speed pumping and lighting retrofits, but actual measured energy reduction has been limited to comparing overall campus energy use data, which has been inconclusive at this point.
For the university to achieve its ambitious greenhouse gas emissions reduction goals, the university needs to implement building level metering for all utilities (electricity, steam, chilled water, natural gas, and water) and submetering for end use data (lights, plug load, fans, pumps, heating and cooling). With this data, the university’s facility management staff can actively manage energy use through the following methods:
• Benchmark and monitor energy use to establish a known starting point from which to measure future use and diagnosis problems such as equipment failures and overrides so quick corrective action may be taken. These data serve as a foundation for ongoing building commissioning, minimizing the need for future, more extensive commissioning efforts and improving the efficiency of the retro commissioning efforts when they are required.
• Measure impact and success of system upgrades and operational changes associated with energy conservation measures. When building upgrades are implemented, it is important to understand how the changes actually impacted energy use so future efforts can more appropriately target past successes and continuously improve performance.
• inform future campus construction standards. as building energy use data become richer, it can be used to update campus design and construction standards that lead to the desired greenhouse gas reduction levels.
• educate building occupants and students on building energy use and encourage behavioral change by supplying data to building dashboard visualization platforms.
Tulane University’s commitment to extended use of its existing building stock is exemplified in the fact that the Uptown Campus was listed on the National Register of Historic Places in 1978. This provides compelling reason to revisit existing design standards to ensure that renovations include improvements that reduce building energy use as necessary to support the university’s greenhouse gas emission reduction goals. Currently, the Tulane university standards (Green Building Design and Construction standards & Guidelines, 2011) require performance that is measured as a percent
better than an established guide (leeD) or standard (asHrae 90.1). The challenge with this approach is twofold. First, the baseline is constantly changing with each update of the guides and standards which will require the University to adjust the percent savings accordingly. second, the guide and development timeline is not necessarily in line with Tulane’s GHG emissions reduction schedule. For instance, LEED was last updated in 2009 and recent updates have been delayed. The University will likely have better outcomes if it additionally expresses performance standards in terms of its GHG emissions reduction targets and schedule. An example would be using metrics such as energy use intensity (kBtu/square foot/year) and performance requirements specific to certain systems (such as ventilation control, setbacks and shutdowns). As building metering is extended to all of University buildings and for each utility, the University will generate data that will be invaluable to subsequent revisiting of campus standards for the purpose of improving building energy performance.
Finally, the University is committed to helping students and employees travel with a low carbon impact. As travel is often tied to residence and reflects the regional transportation network, the 2014 Tulane University Climate Action Plan recognizes that such change will require a sustained, long-term effort. The approach it adopts is multi-faceted and is intended to grow over time as successful programs are reinforced and efforts respond to external changes. Key elements include:
• Education, awareness, and travel support – these programs would raise awareness of travel options and provide individualized support and information to help employees and students shift to lower carbon intensity modes.
• Incentives – as changing travel choice may represent some level of inconvenience, incentives aim to reward participation and lessen the burden. They can range from rewards to local restaurants and sporting goods stores for not driving to actual cash rebates for a lower-intensity mode.
• Transit subsidies – work with RTA and students and employees to develop a program to promote usage of the regional transit system by the university community. This might be in the form of a u-Pass program or reduced-price (up to complete subsidy) transit passes for those primarily using transit.
• Bicycle infrastructure improvements – expand bicycle parking in the short term. Over time, spending would increase to cover additional bicycle-related improvements such as bicycle locker rooms.
• Shuttle fuel efficiency enhancements – the university would work to enhance the fuel efficiency of its shuttle fleet to lessen the impacts of those commuting to campus via university shuttle.
• Housing incentives program – a comprehensive set of incentives to encourage employees and students to live close enough to campus to walk or bike, primarily. This could be in the form of housing subsidies, loan guarantees/discounts, or assistance with closing costs. It may also be possible to work more broadly to partner with private developers and/or local government to redevelop parcels close to Tulane campuses to provide additional capacity and/or enhanced quality.
Tulane universiTy 2014 ClimaTe aCTion Plan21 Tulane universiTy 2014 ClimaTe aCTion Plan 22
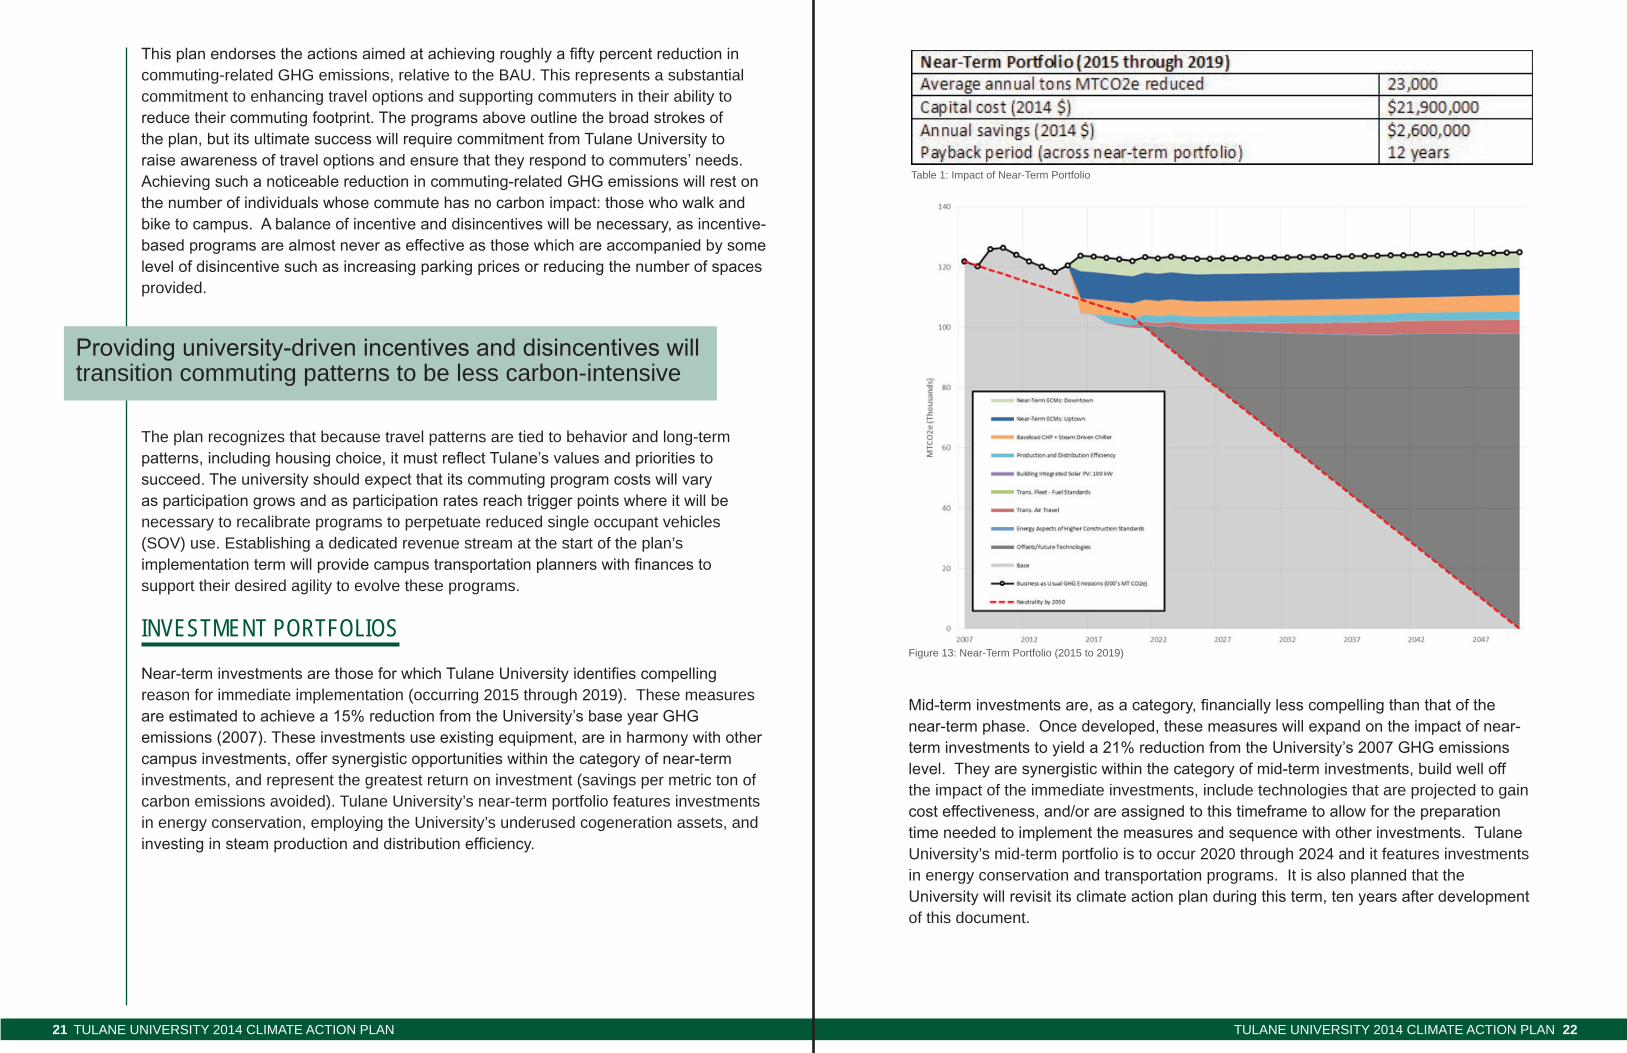
Mid-term investments are, as a category, financially less compelling than that of the near-term phase. Once developed, these measures will expand on the impact of near-term investments to yield a 21% reduction from the University’s 2007 GHG emissions level. They are synergistic within the category of mid-term investments, build well off the impact of the immediate investments, include technologies that are projected to gain cost effectiveness, and/or are assigned to this timeframe to allow for the preparation time needed to implement the measures and sequence with other investments. Tulane university’s mid-term portfolio is to occur 2020 through 2024 and it features investments in energy conservation and transportation programs. it is also planned that the University will revisit its climate action plan during this term, ten years after development of this document.
This plan endorses the actions aimed at achieving roughly a fifty percent reduction in commuting-related GHG emissions, relative to the Bau. This represents a substantial commitment to enhancing travel options and supporting commuters in their ability to reduce their commuting footprint. The programs above outline the broad strokes of the plan, but its ultimate success will require commitment from Tulane University to raise awareness of travel options and ensure that they respond to commuters’ needs. Achieving such a noticeable reduction in commuting-related GHG emissions will rest on the number of individuals whose commute has no carbon impact: those who walk and bike to campus. A balance of incentive and disincentives will be necessary, as incentive-based programs are almost never as effective as those which are accompanied by some level of disincentive such as increasing parking prices or reducing the number of spaces provided.
The plan recognizes that because travel patterns are tied to behavior and long-term patterns, including housing choice, it must reflect Tulane’s values and priorities to succeed. The university should expect that its commuting program costs will vary as participation grows and as participation rates reach trigger points where it will be necessary to recalibrate programs to perpetuate reduced single occupant vehicles (sOv) use. establishing a dedicated revenue stream at the start of the plan’s implementation term will provide campus transportation planners with finances to support their desired agility to evolve these programs.
investment poRtfolios
Near-term investments are those for which Tulane University identifies compelling reason for immediate implementation (occurring 2015 through 2019). These measures are estimated to achieve a 15% reduction from the University’s base year GHG emissions (2007). These investments use existing equipment, are in harmony with other campus investments, offer synergistic opportunities within the category of near-term investments, and represent the greatest return on investment (savings per metric ton of carbon emissions avoided). Tulane university’s near-term portfolio features investments in energy conservation, employing the university’s underused cogeneration assets, and investing in steam production and distribution efficiency.
Table 1: impact of near-Term Portfolio
Figure 13: near-Term Portfolio (2015 to 2019)
Providing university-driven incentives and disincentives will transition commuting patterns to be less carbon-intensive
Tulane universiTy 2014 ClimaTe aCTion Plan23 Tulane universiTy 2014 ClimaTe aCTion Plan 24
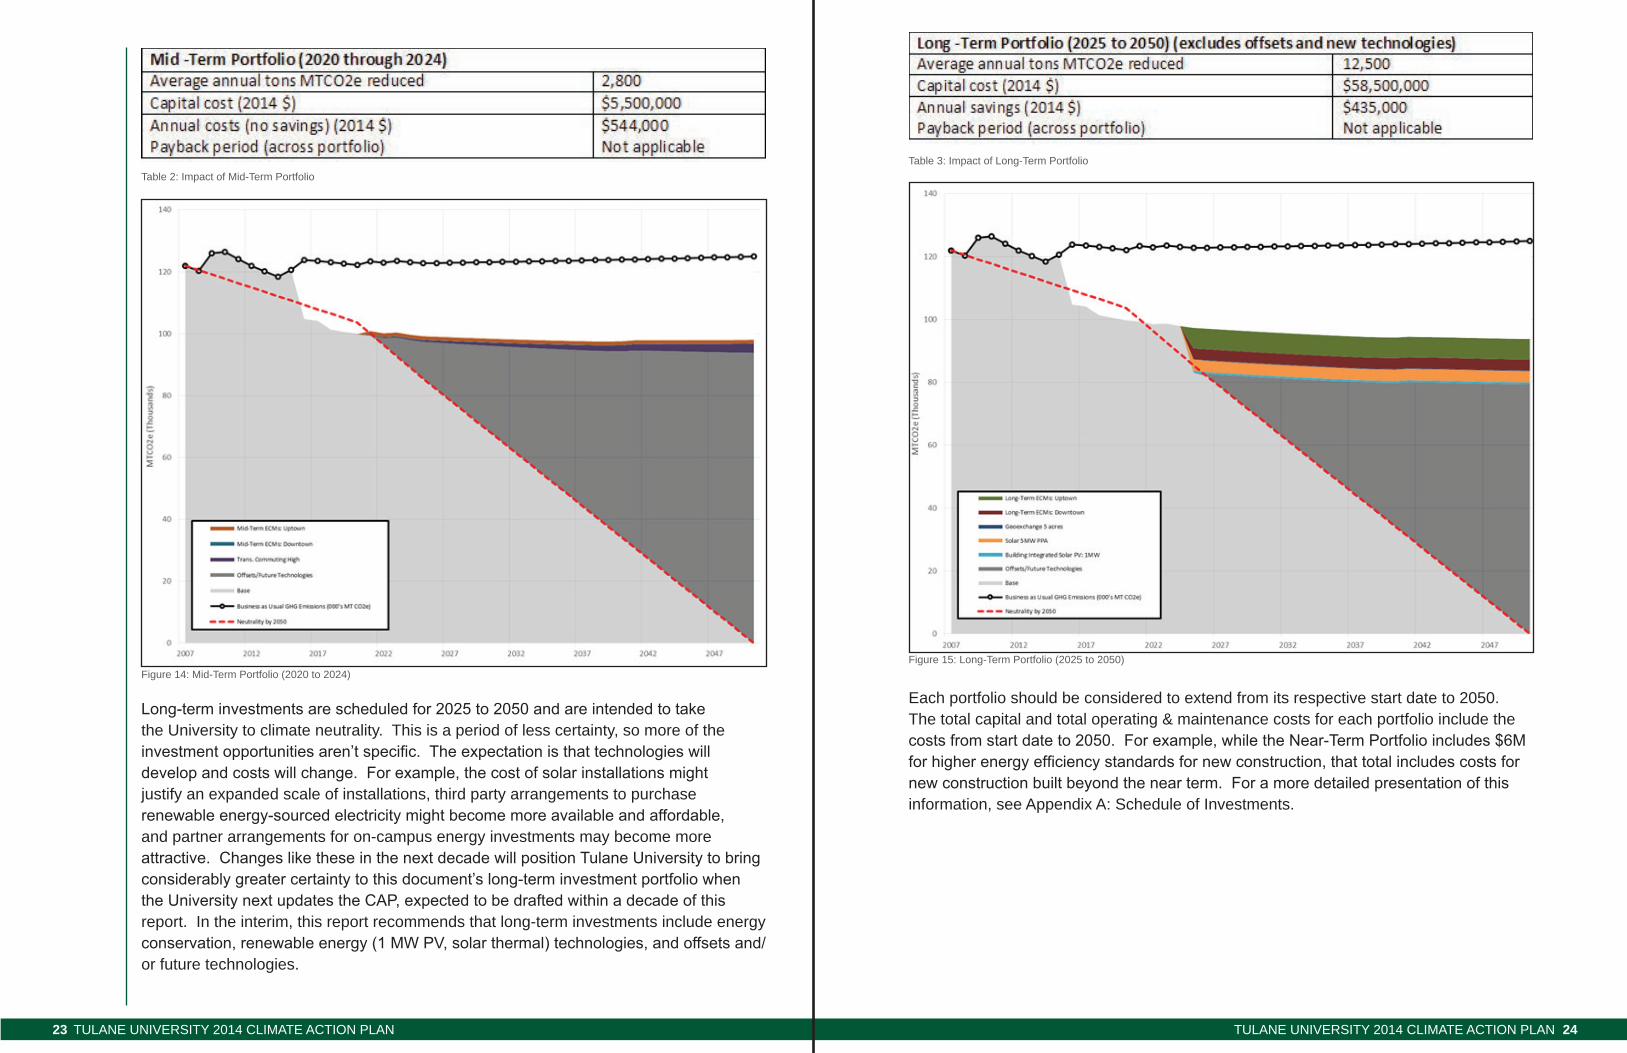
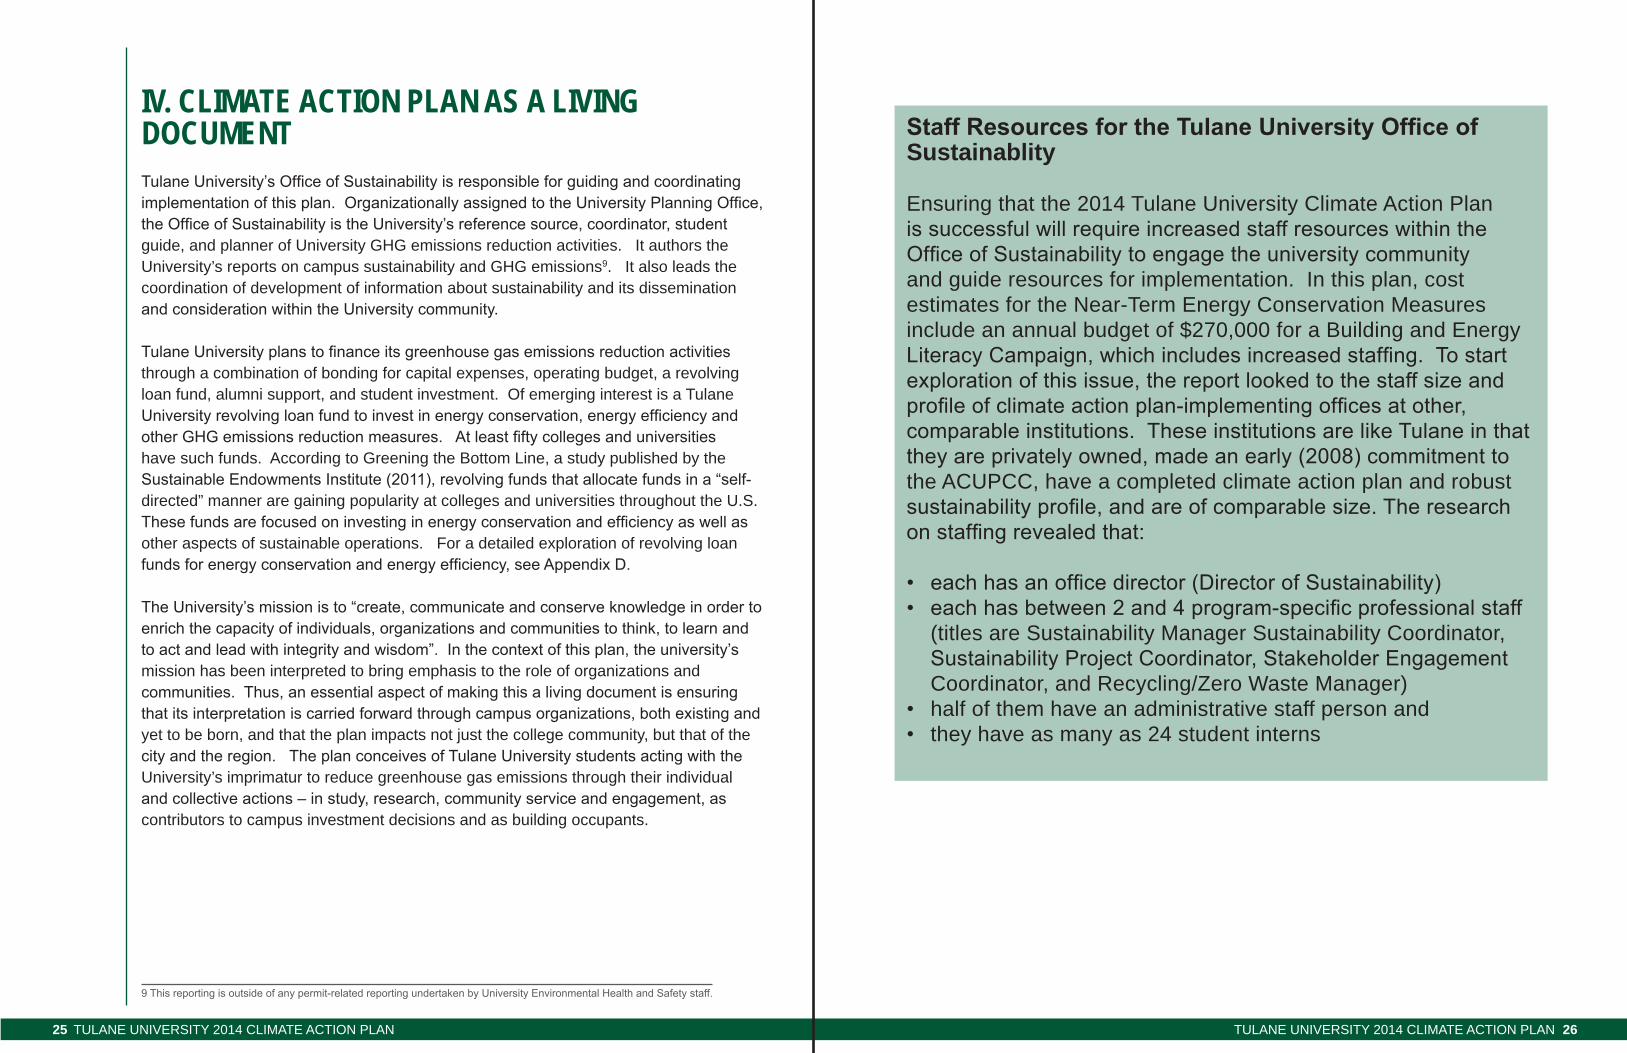
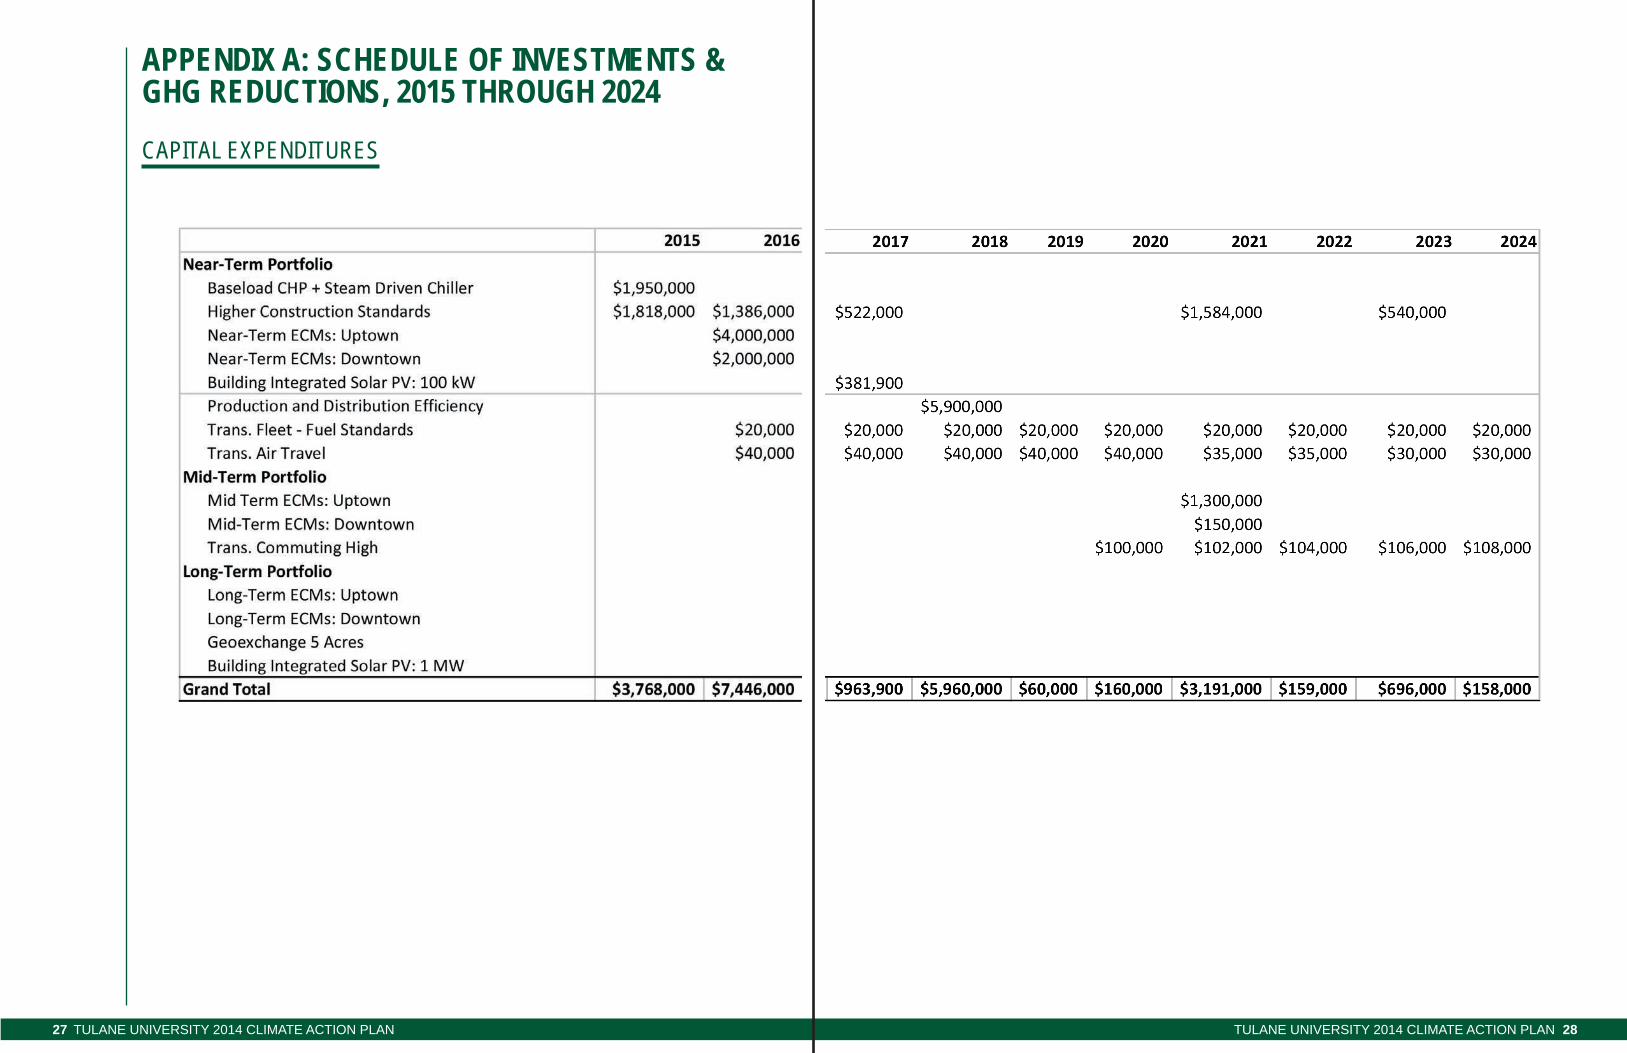
each portfolio should be considered to extend from its respective start date to 2050. The total capital and total operating & maintenance costs for each portfolio include the costs from start date to 2050. For example, while the Near-Term Portfolio includes $6M for higher energy efficiency standards for new construction, that total includes costs for new construction built beyond the near term. For a more detailed presentation of this information, see appendix a: schedule of investments.
Long-term investments are scheduled for 2025 to 2050 and are intended to take the university to climate neutrality. This is a period of less certainty, so more of the investment opportunities aren’t specific. The expectation is that technologies will develop and costs will change. For example, the cost of solar installations might justify an expanded scale of installations, third party arrangements to purchase renewable energy-sourced electricity might become more available and affordable, and partner arrangements for on-campus energy investments may become more attractive. Changes like these in the next decade will position Tulane University to bring considerably greater certainty to this document’s long-term investment portfolio when the University next updates the CAP, expected to be drafted within a decade of this report. in the interim, this report recommends that long-term investments include energy conservation, renewable energy (1 MW PV, solar thermal) technologies, and offsets and/or future technologies.
Table 3: impact of long-Term Portfolio
Figure 15: long-Term Portfolio (2025 to 2050)
Table 2: impact of Mid-Term Portfolio
Figure 14: Mid-Term Portfolio (2020 to 2024)
Tulane universiTy 2014 ClimaTe aCTion Plan25 Tulane universiTy 2014 ClimaTe aCTion Plan 26
Iv. CLImATE ACTION PLAN AS A LIvINg DOCumENTTulane University’s Office of Sustainability is responsible for guiding and coordinating implementation of this plan. Organizationally assigned to the University Planning Office, the Office of Sustainability is the University’s reference source, coordinator, student guide, and planner of university GHG emissions reduction activities. it authors the university’s reports on campus sustainability and GHG emissions9. it also leads the coordination of development of information about sustainability and its dissemination and consideration within the University community.
Tulane University plans to finance its greenhouse gas emissions reduction activities through a combination of bonding for capital expenses, operating budget, a revolving loan fund, alumni support, and student investment. Of emerging interest is a Tulane University revolving loan fund to invest in energy conservation, energy efficiency and other GHG emissions reduction measures. At least fifty colleges and universities have such funds. according to Greening the Bottom line, a study published by the Sustainable Endowments Institute (2011), revolving funds that allocate funds in a “self-directed” manner are gaining popularity at colleges and universities throughout the u.s. These funds are focused on investing in energy conservation and efficiency as well as other aspects of sustainable operations. For a detailed exploration of revolving loan funds for energy conservation and energy efficiency, see Appendix D.
The University’s mission is to “create, communicate and conserve knowledge in order to enrich the capacity of individuals, organizations and communities to think, to learn and to act and lead with integrity and wisdom”. In the context of this plan, the university’s mission has been interpreted to bring emphasis to the role of organizations and communities. Thus, an essential aspect of making this a living document is ensuring that its interpretation is carried forward through campus organizations, both existing and yet to be born, and that the plan impacts not just the college community, but that of the city and the region. The plan conceives of Tulane University students acting with the university’s imprimatur to reduce greenhouse gas emissions through their individual and collective actions – in study, research, community service and engagement, as contributors to campus investment decisions and as building occupants.
Staff Resources for the Tulane University Office of Sustainablity
ensuring that the 2014 Tulane university Climate action Plan is successful will require increased staff resources within the Office of Sustainability to engage the university community and guide resources for implementation. in this plan, cost estimates for the near-Term energy Conservation Measures include an annual budget of $270,000 for a Building and energy Literacy Campaign, which includes increased staffing. To start exploration of this issue, the report looked to the staff size and profile of climate action plan-implementing offices at other, comparable institutions. These institutions are like Tulane in that they are privately owned, made an early (2008) commitment to the aCuPCC, have a completed climate action plan and robust sustainability profile, and are of comparable size. The research on staffing revealed that:
• each has an office director (Director of Sustainability) • each has between 2 and 4 program-specific professional staff
(titles are sustainability Manager sustainability Coordinator, Sustainability Project Coordinator, Stakeholder Engagement Coordinator, and recycling/Zero Waste Manager)
• half of them have an administrative staff person and • they have as many as 24 student interns
9 This reporting is outside of any permit-related reporting undertaken by University Environmental Health and Safety staff.
Tulane universiTy 2014 ClimaTe aCTion Plan27 Tulane universiTy 2014 ClimaTe aCTion Plan 28
APPENDIx A: SChEDuLE OF INvESTmENTS & ghg rEDuCTIONS, 2015 ThrOugh 2024cApitAl expendituRes
Tulane universiTy 2014 ClimaTe aCTion Plan29 Tulane universiTy 2014 ClimaTe aCTion Plan 30
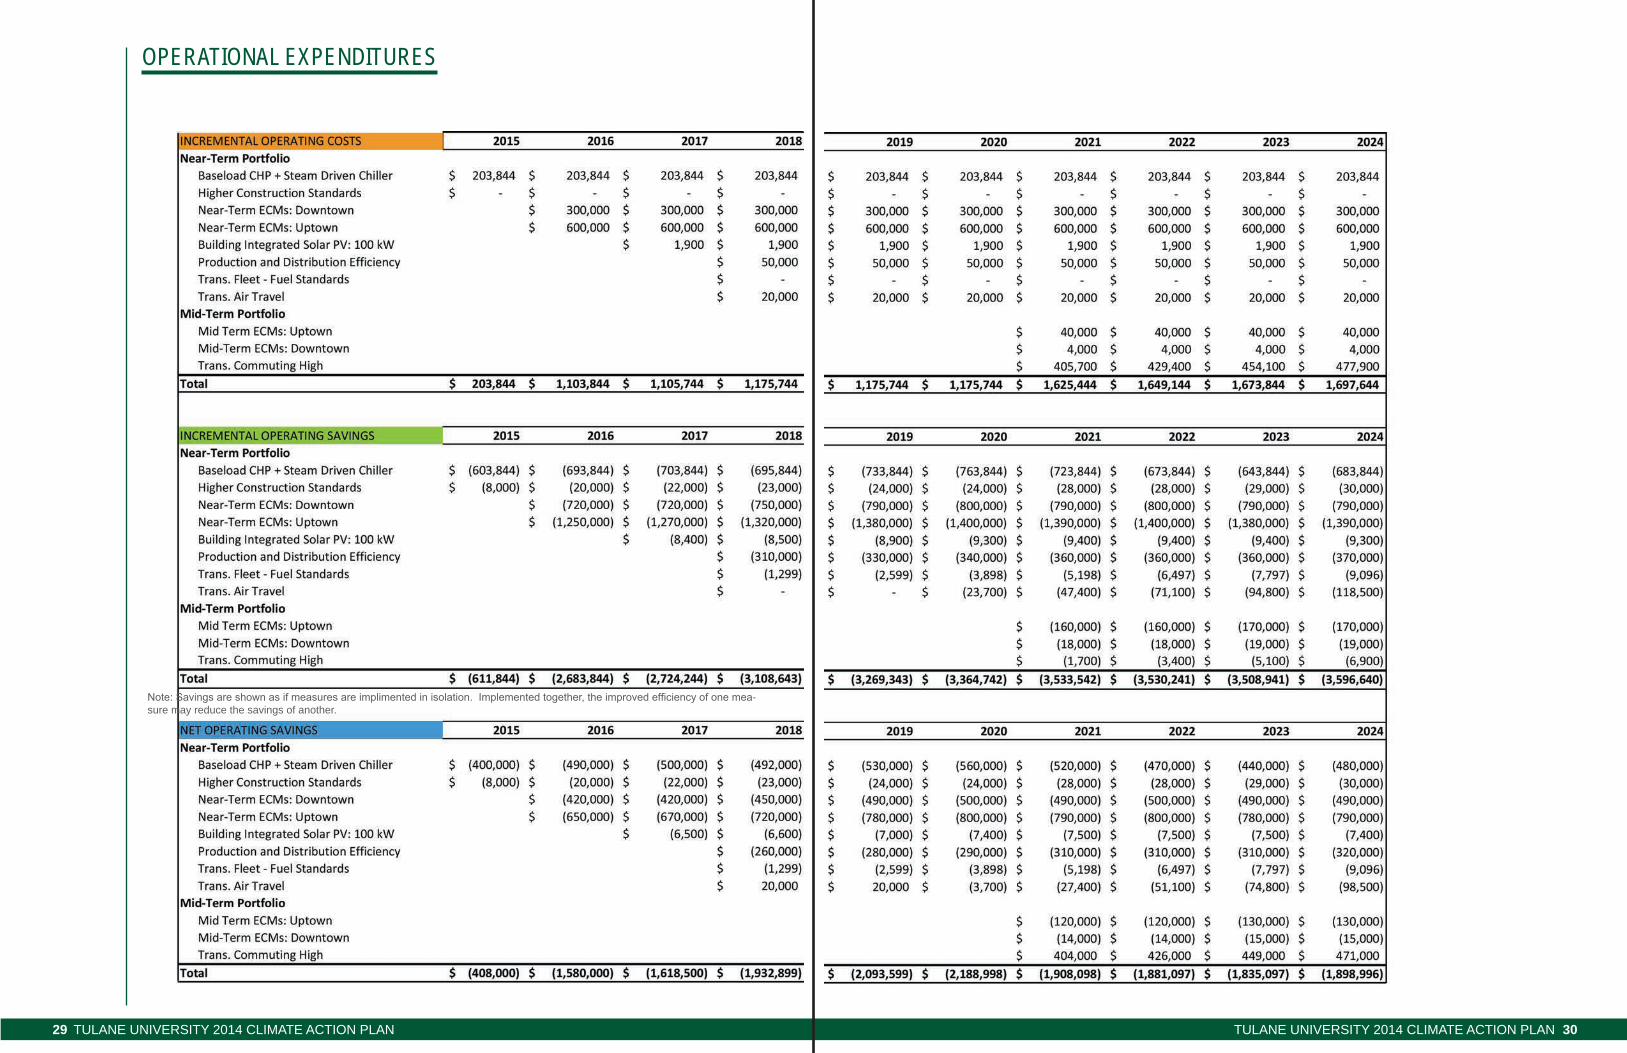
opeRAtionAl expendituRes
Note: Savings are shown as if measures are implimented in isolation. Implemented together, the improved efficiency of one mea-sure may reduce the savings of another.
Tulane universiTy 2014 ClimaTe aCTion Plan31 Tulane universiTy 2014 ClimaTe aCTion Plan 32
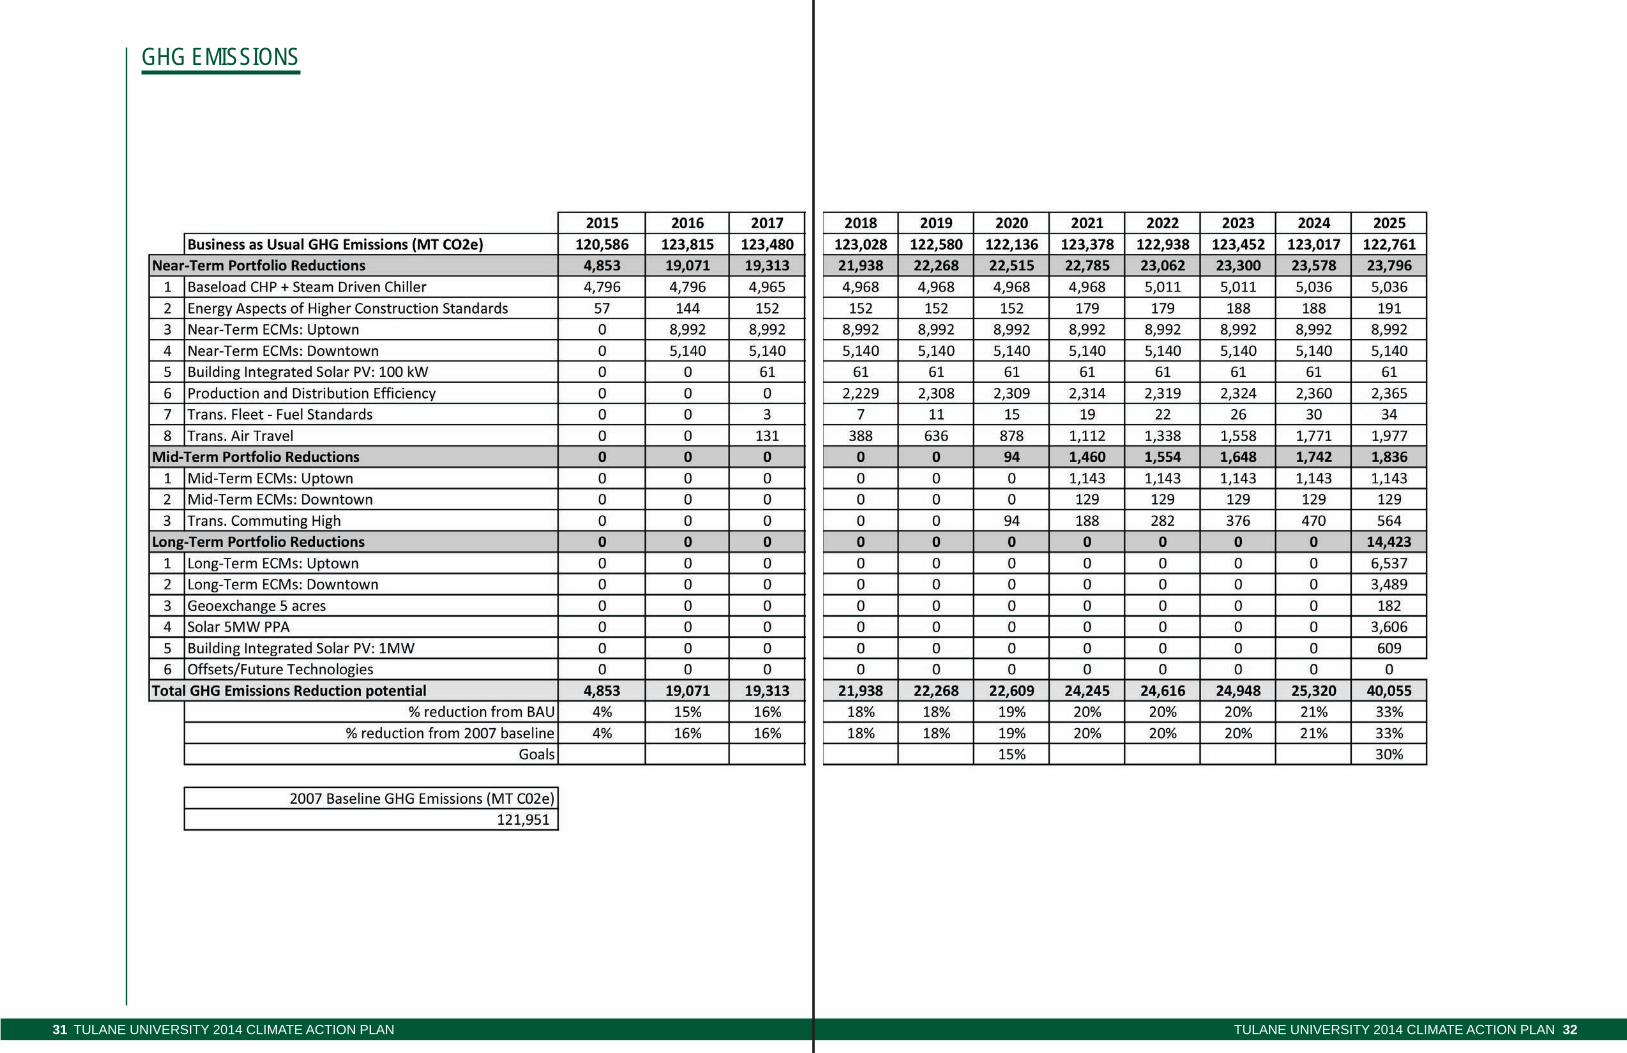
GHG emissions
Tulane universiTy 2014 ClimaTe aCTion Plan33 Tulane universiTy 2014 ClimaTe aCTion Plan 34
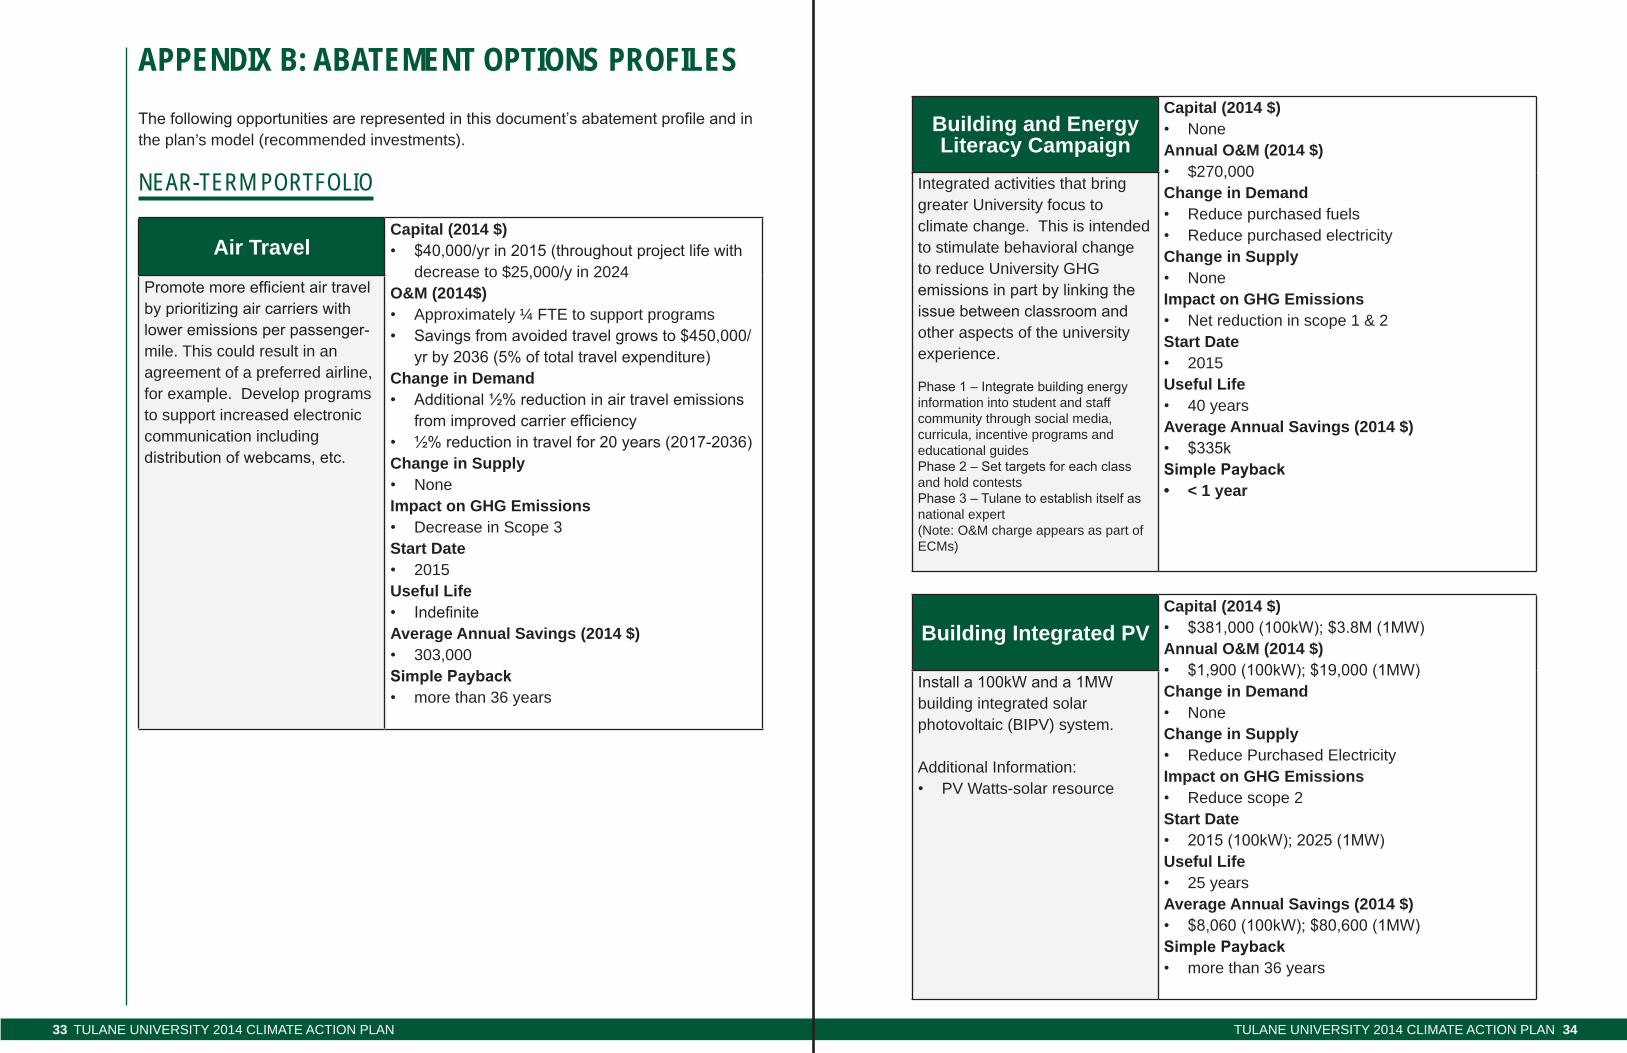
APPENDIx B: ABATEmENT OPTIONS PrOFILESThe following opportunities are represented in this document’s abatement profile and in the plan’s model (recommended investments).
neAR-teRm poRtfolio
Air TravelCapital (2014 $)• $40,000/yr in 2015 (throughout project life with
decrease to $25,000/y in 2024O&M (2014$)• approximately ¼ FTe to support programs• Savings from avoided travel grows to $450,000/
yr by 2036 (5% of total travel expenditure)Change in Demand• Additional ½% reduction in air travel emissions
from improved carrier efficiency• ½% reduction in travel for 20 years (2017-2036)Change in Supply• noneImpact on GHG Emissions• Decrease in scope 3 Start Date• 2015Useful Life• IndefiniteAverage Annual Savings (2014 $)• 303,000Simple Payback• more than 36 years
Promote more efficient air travel by prioritizing air carriers with lower emissions per passenger-mile. This could result in an agreement of a preferred airline, for example. Develop programs to support increased electronic communication including distribution of webcams, etc.
Building and Energy Literacy Campaign
Capital (2014 $)• noneAnnual O&M (2014 $)• $270,000Change in Demand• reduce purchased fuels• reduce purchased electricityChange in Supply• noneImpact on GHG Emissions• net reduction in scope 1 & 2Start Date• 2015Useful Life• 40 yearsAverage Annual Savings (2014 $)• $335kSimple Payback• < 1 year
integrated activities that bring greater university focus to climate change. This is intended to stimulate behavioral change to reduce university GHG emissions in part by linking the issue between classroom and other aspects of the university experience.
Phase 1 – Integrate building energy information into student and staff community through social media, curricula, incentive programs and educational guidesPhase 2 – Set targets for each class and hold contestsPhase 3 – Tulane to establish itself as national expert(note: O&M charge appears as part of eCMs)
Building Integrated PVCapital (2014 $)• $381,000 (100kW); $3.8M (1MW)Annual O&M (2014 $)• $1,900 (100kW); $19,000 (1MW)Change in Demand• noneChange in Supply• reduce Purchased electricityImpact on GHG Emissions• reduce scope 2Start Date• 2015 (100kW); 2025 (1MW)Useful Life• 25 yearsAverage Annual Savings (2014 $)• $8,060 (100kW); $80,600 (1MW)Simple Payback• more than 36 years
Install a 100kW and a 1MW building integrated solar photovoltaic (BiPv) system.
additional information:• Pv Watts-solar resource
Tulane universiTy 2014 ClimaTe aCTion Plan35 Tulane universiTy 2014 ClimaTe aCTion Plan 36
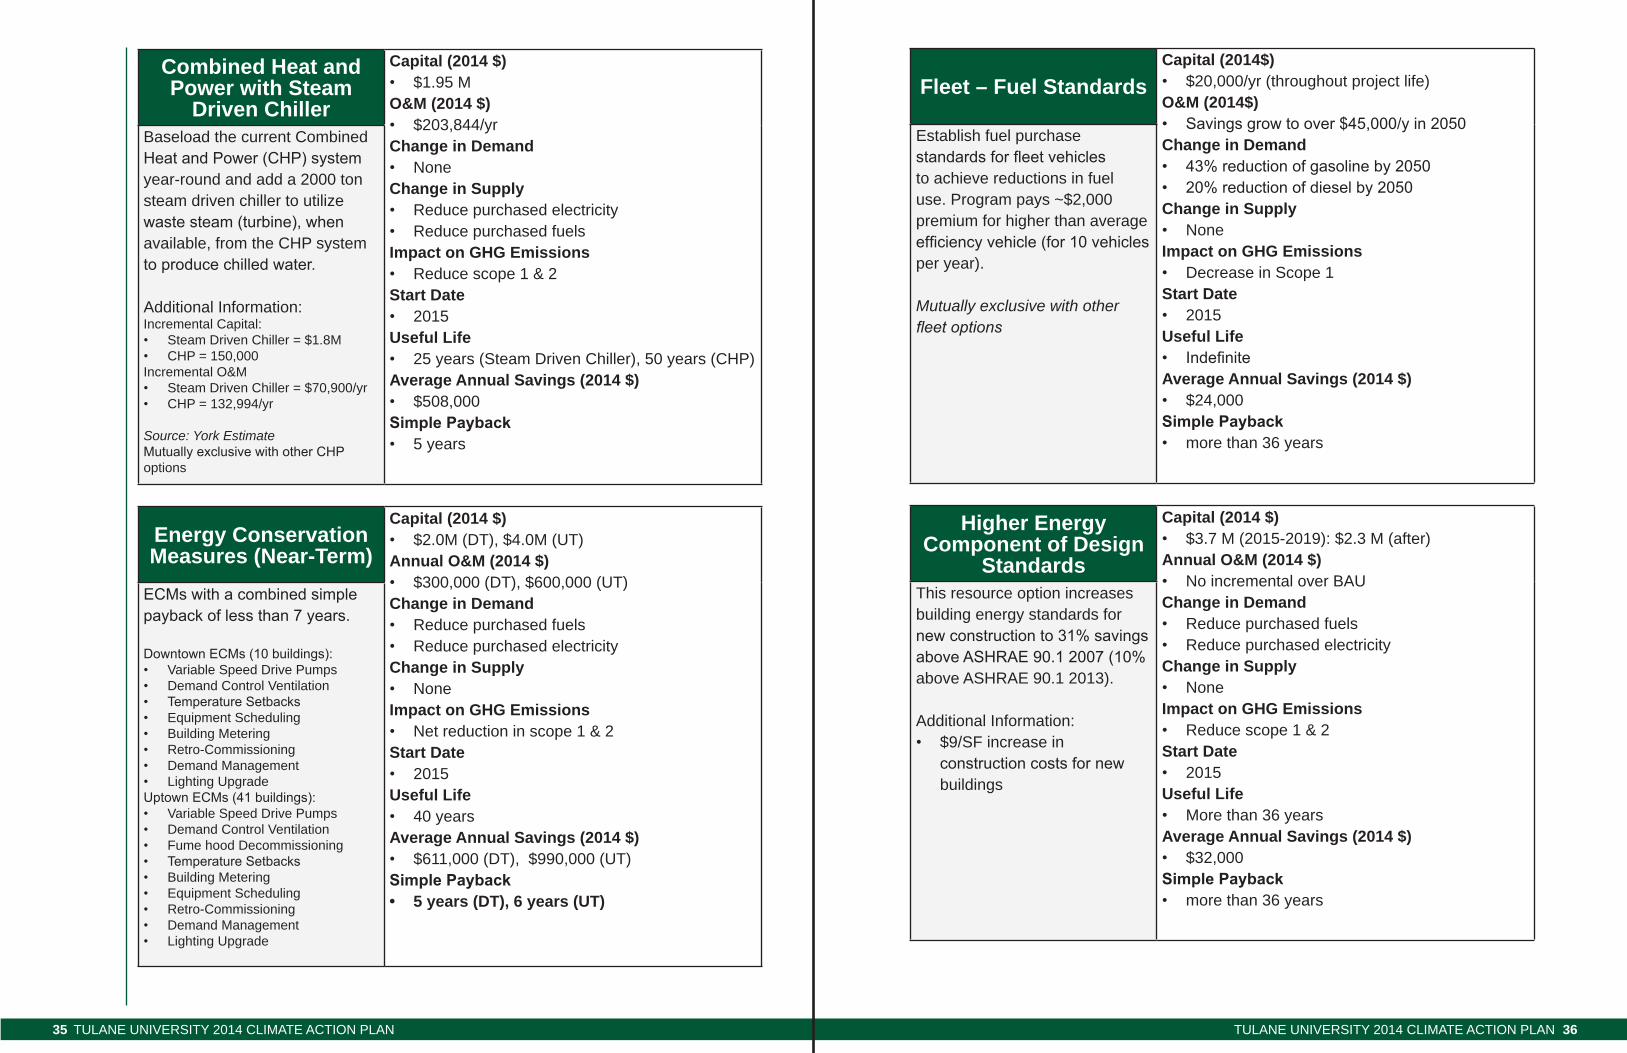
Combined Heat and Power with Steam
Driven Chiller
Capital (2014 $)• $1.95 MO&M (2014 $)• $203,844/yrChange in Demand• noneChange in Supply• reduce purchased electricity• reduce purchased fuelsImpact on GHG Emissions• reduce scope 1 & 2Start Date• 2015Useful Life• 25 years (steam Driven Chiller), 50 years (CHP)Average Annual Savings (2014 $)• $508,000 Simple Payback• 5 years
Baseload the current Combined Heat and Power (CHP) system year-round and add a 2000 ton steam driven chiller to utilize waste steam (turbine), when available, from the CHP system to produce chilled water.
additional information:incremental Capital:• steam Driven Chiller = $1.8M• CHP = 150,000incremental O&M• steam Driven Chiller = $70,900/yr• CHP = 132,994/yr
Source: York EstimateMutually exclusive with other CHP options
Energy Conservation Measures (Near-Term)
Capital (2014 $)• $2.0M (DT), $4.0M (uT)Annual O&M (2014 $)• $300,000 (DT), $600,000 (uT)Change in Demand• reduce purchased fuels• reduce purchased electricityChange in Supply• noneImpact on GHG Emissions• net reduction in scope 1 & 2Start Date• 2015Useful Life• 40 yearsAverage Annual Savings (2014 $)• $611,000 (DT), $990,000 (uT)Simple Payback• 5 years (DT), 6 years (UT)
ECMs with a combined simple payback of less than 7 years.
Downtown ECMs (10 buildings): • variable speed Drive Pumps• Demand Control ventilation• Temperature Setbacks• equipment scheduling• Building Metering• retro-Commissioning• Demand Management• lighting upgradeUptown ECMs (41 buildings): • variable speed Drive Pumps• Demand Control ventilation• Fume hood Decommissioning• Temperature Setbacks• Building Metering• equipment scheduling• retro-Commissioning• Demand Management• lighting upgrade
Fleet – Fuel StandardsCapital (2014$)• $20,000/yr (throughout project life) O&M (2014$)• Savings grow to over $45,000/y in 2050Change in Demand• 43% reduction of gasoline by 2050• 20% reduction of diesel by 2050Change in Supply• noneImpact on GHG Emissions• Decrease in scope 1Start Date• 2015Useful Life• IndefiniteAverage Annual Savings (2014 $)• $24,000Simple Payback• more than 36 years
establish fuel purchase standards for fleet vehicles to achieve reductions in fuel use. Program pays ~$2,000 premium for higher than average efficiency vehicle (for 10 vehicles per year).
Mutually exclusive with other fleet options
Higher Energy Component of Design
Standards
Capital (2014 $)• $3.7 M (2015-2019): $2.3 M (after)Annual O&M (2014 $)• no incremental over Bau Change in Demand• reduce purchased fuels• reduce purchased electricityChange in Supply• noneImpact on GHG Emissions• reduce scope 1 & 2Start Date• 2015Useful Life• More than 36 yearsAverage Annual Savings (2014 $)• $32,000Simple Payback• more than 36 years
This resource option increases building energy standards for new construction to 31% savings above ASHRAE 90.1 2007 (10% above asHrae 90.1 2013).
additional information:• $9/sF increase in
construction costs for new buildings
Tulane universiTy 2014 ClimaTe aCTion Plan37 Tulane universiTy 2014 ClimaTe aCTion Plan 38
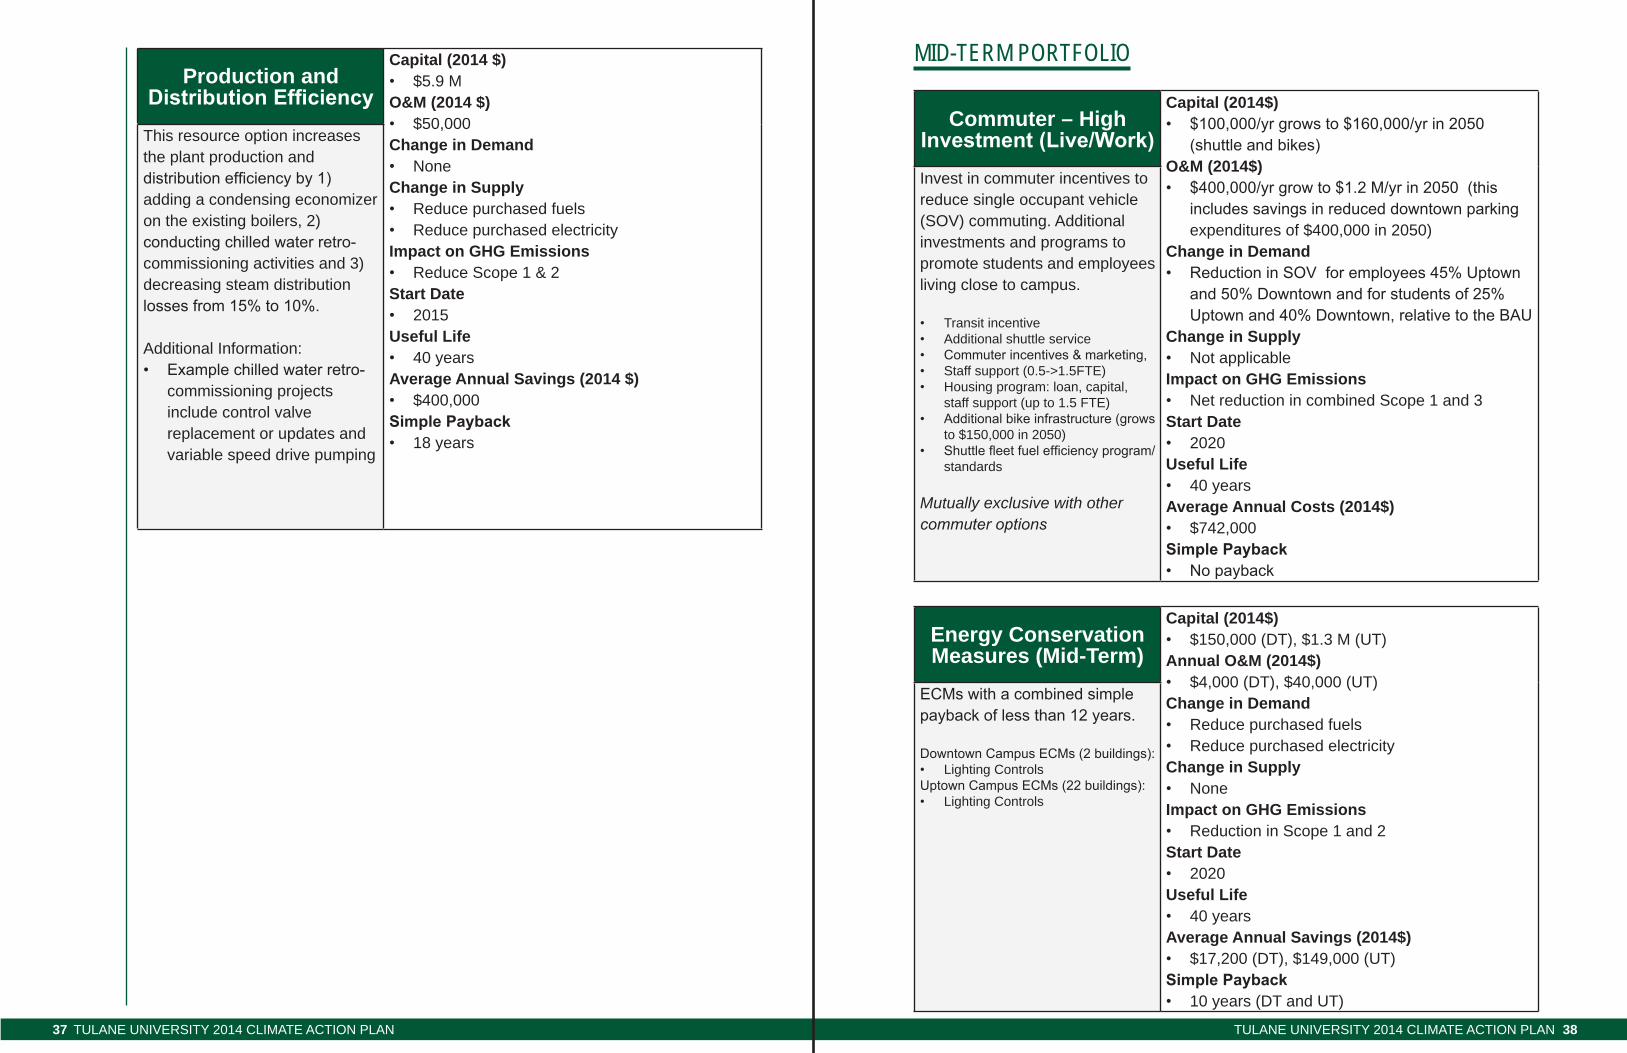
Production and Distribution Efficiency
Capital (2014 $)• $5.9 MO&M (2014 $)• $50,000Change in Demand• noneChange in Supply• reduce purchased fuels• reduce purchased electricityImpact on GHG Emissions• reduce scope 1 & 2Start Date• 2015Useful Life• 40 yearsAverage Annual Savings (2014 $)• $400,000Simple Payback• 18 years
This resource option increases the plant production and distribution efficiency by 1) adding a condensing economizer on the existing boilers, 2) conducting chilled water retro-commissioning activities and 3) decreasing steam distribution losses from 15% to 10%.
additional information:• Example chilled water retro-
commissioning projects include control valve replacement or updates and variable speed drive pumping
mid-teRm poRtfolio
Commuter – High Investment (Live/Work)
Capital (2014$)• $100,000/yr grows to $160,000/yr in 2050
(shuttle and bikes)O&M (2014$)• $400,000/yr grow to $1.2 M/yr in 2050 (this
includes savings in reduced downtown parking expenditures of $400,000 in 2050)
Change in Demand• Reduction in SOV for employees 45% Uptown
and 50% Downtown and for students of 25% Uptown and 40% Downtown, relative to the BAU
Change in Supply• not applicable Impact on GHG Emissions• net reduction in combined scope 1 and 3Start Date• 2020Useful Life• 40 yearsAverage Annual Costs (2014$)• $742,000Simple Payback• No payback
invest in commuter incentives to reduce single occupant vehicle (sOv) commuting. additional investments and programs to promote students and employees living close to campus.
• Transit incentive• additional shuttle service• Commuter incentives & marketing, • staff support (0.5->1.5FTe)• Housing program: loan, capital,
staff support (up to 1.5 FTe)• Additional bike infrastructure (grows
to $150,000 in 2050)• Shuttle fleet fuel efficiency program/
standards
Mutually exclusive with other commuter options
Energy Conservation Measures (Mid-Term)
Capital (2014$)• $150,000 (DT), $1.3 M (uT)Annual O&M (2014$)• $4,000 (DT), $40,000 (uT)Change in Demand• reduce purchased fuels• reduce purchased electricityChange in Supply• noneImpact on GHG Emissions• reduction in scope 1 and 2Start Date• 2020Useful Life• 40 yearsAverage Annual Savings (2014$)• $17,200 (DT), $149,000 (uT)Simple Payback• 10 years (DT and uT)
ECMs with a combined simple payback of less than 12 years.
Downtown Campus ECMs (2 buildings): • lighting ControlsUptown Campus ECMs (22 buildings): • lighting Controls
Tulane universiTy 2014 ClimaTe aCTion Plan39 Tulane universiTy 2014 ClimaTe aCTion Plan 40
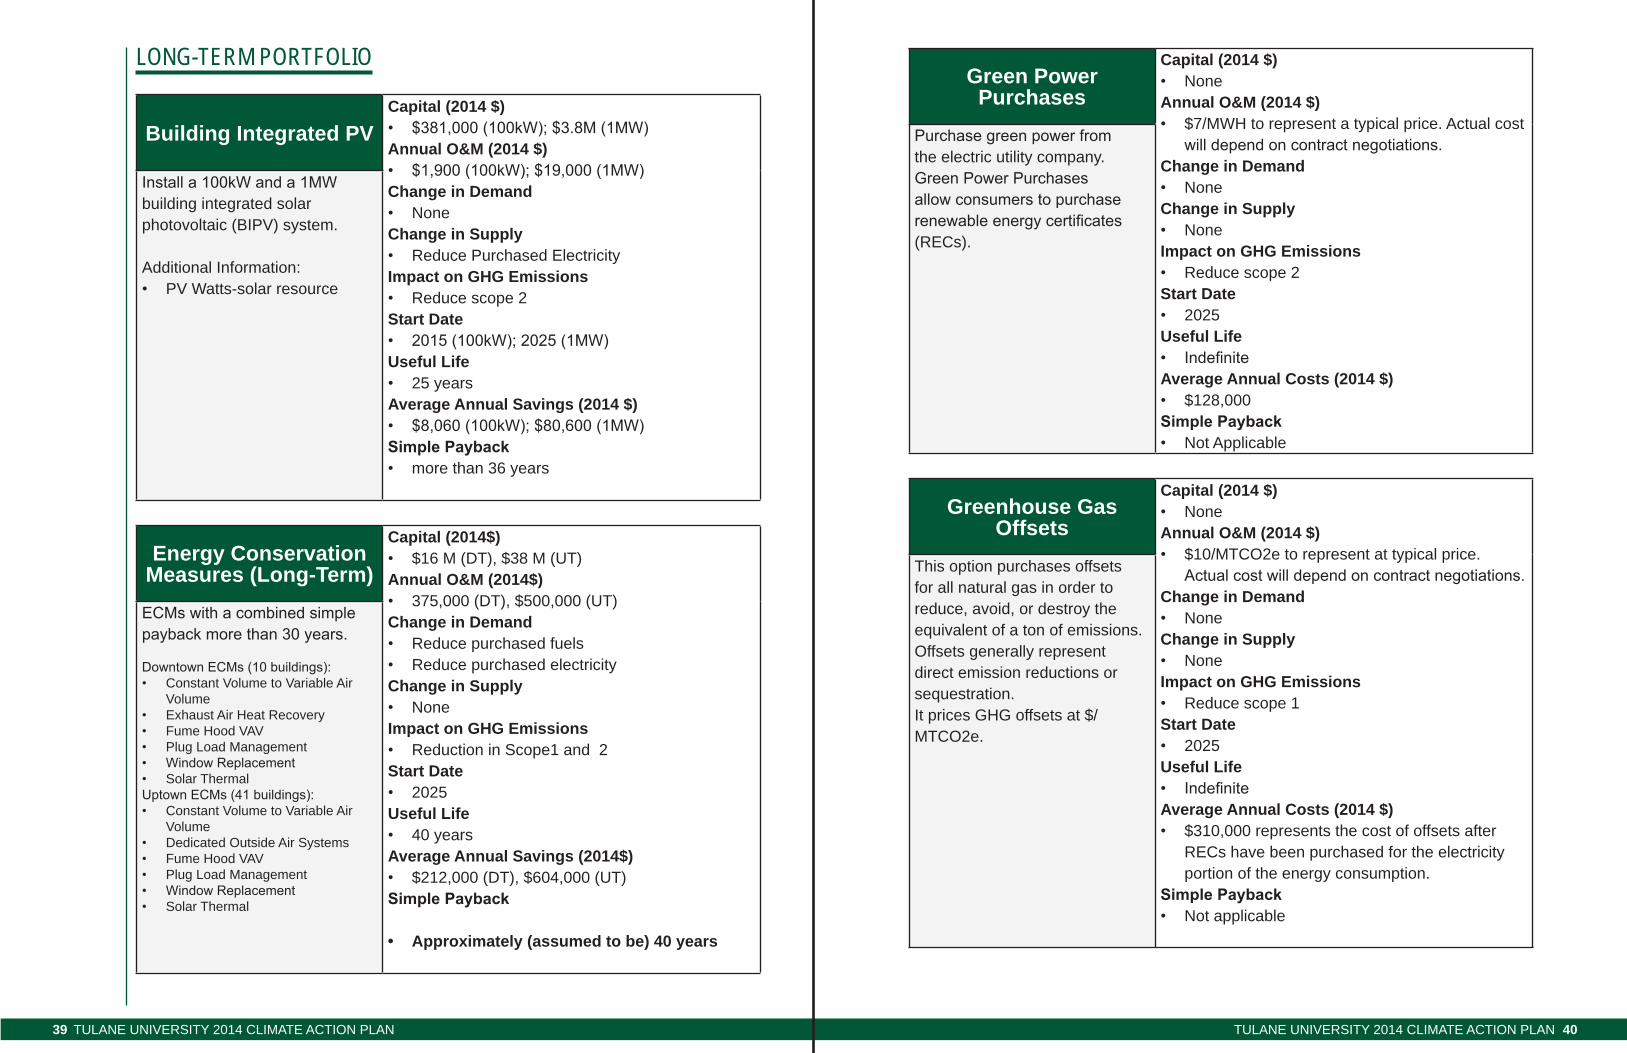
lonG-teRm poRtfolio
Building Integrated PVCapital (2014 $)• $381,000 (100kW); $3.8M (1MW)Annual O&M (2014 $)• $1,900 (100kW); $19,000 (1MW)Change in Demand• noneChange in Supply• reduce Purchased electricityImpact on GHG Emissions• reduce scope 2Start Date• 2015 (100kW); 2025 (1MW)Useful Life• 25 yearsAverage Annual Savings (2014 $)• $8,060 (100kW); $80,600 (1MW)Simple Payback• more than 36 years
Install a 100kW and a 1MW building integrated solar photovoltaic (BiPv) system.
additional information:• Pv Watts-solar resource
Energy Conservation Measures (Long-Term)
Capital (2014$)• $16 M (DT), $38 M (uT)Annual O&M (2014$)• 375,000 (DT), $500,000 (uT)Change in Demand• reduce purchased fuels• reduce purchased electricityChange in Supply• noneImpact on GHG Emissions• reduction in scope1 and 2Start Date• 2025 Useful Life• 40 yearsAverage Annual Savings (2014$)• $212,000 (DT), $604,000 (uT)Simple Payback
• Approximately (assumed to be) 40 years
ECMs with a combined simple payback more than 30 years.
Downtown ECMs (10 buildings): • Constant volume to variable air
volume• exhaust air Heat recovery• Fume Hood vav• Plug load Management• Window Replacement• solar ThermalUptown ECMs (41 buildings): • Constant volume to variable air
volume• Dedicated Outside air systems• Fume Hood vav• Plug load Management• Window Replacement• solar Thermal
Green Power Purchases
Capital (2014 $)• noneAnnual O&M (2014 $)• $7/MWH to represent a typical price. actual cost
will depend on contract negotiations.Change in Demand• noneChange in Supply• noneImpact on GHG Emissions• reduce scope 2Start Date• 2025Useful Life• IndefiniteAverage Annual Costs (2014 $)• $128,000 Simple Payback• not applicable
Purchase green power from the electric utility company. Green Power Purchases allow consumers to purchase renewable energy certificates (reCs).
Greenhouse Gas Offsets
Capital (2014 $)• noneAnnual O&M (2014 $)• $10/MTCO2e to represent at typical price.
Actual cost will depend on contract negotiations.Change in Demand• noneChange in Supply• noneImpact on GHG Emissions• reduce scope 1Start Date• 2025Useful Life• IndefiniteAverage Annual Costs (2014 $)• $310,000 represents the cost of offsets after
reCs have been purchased for the electricity portion of the energy consumption.
Simple Payback• not applicable
This option purchases offsets for all natural gas in order to reduce, avoid, or destroy the equivalent of a ton of emissions. Offsets generally represent direct emission reductions or sequestration. it prices GHG offsets at $/MTCO2e.
Tulane universiTy 2014 ClimaTe aCTion Plan41 Tulane universiTy 2014 ClimaTe aCTion Plan 42
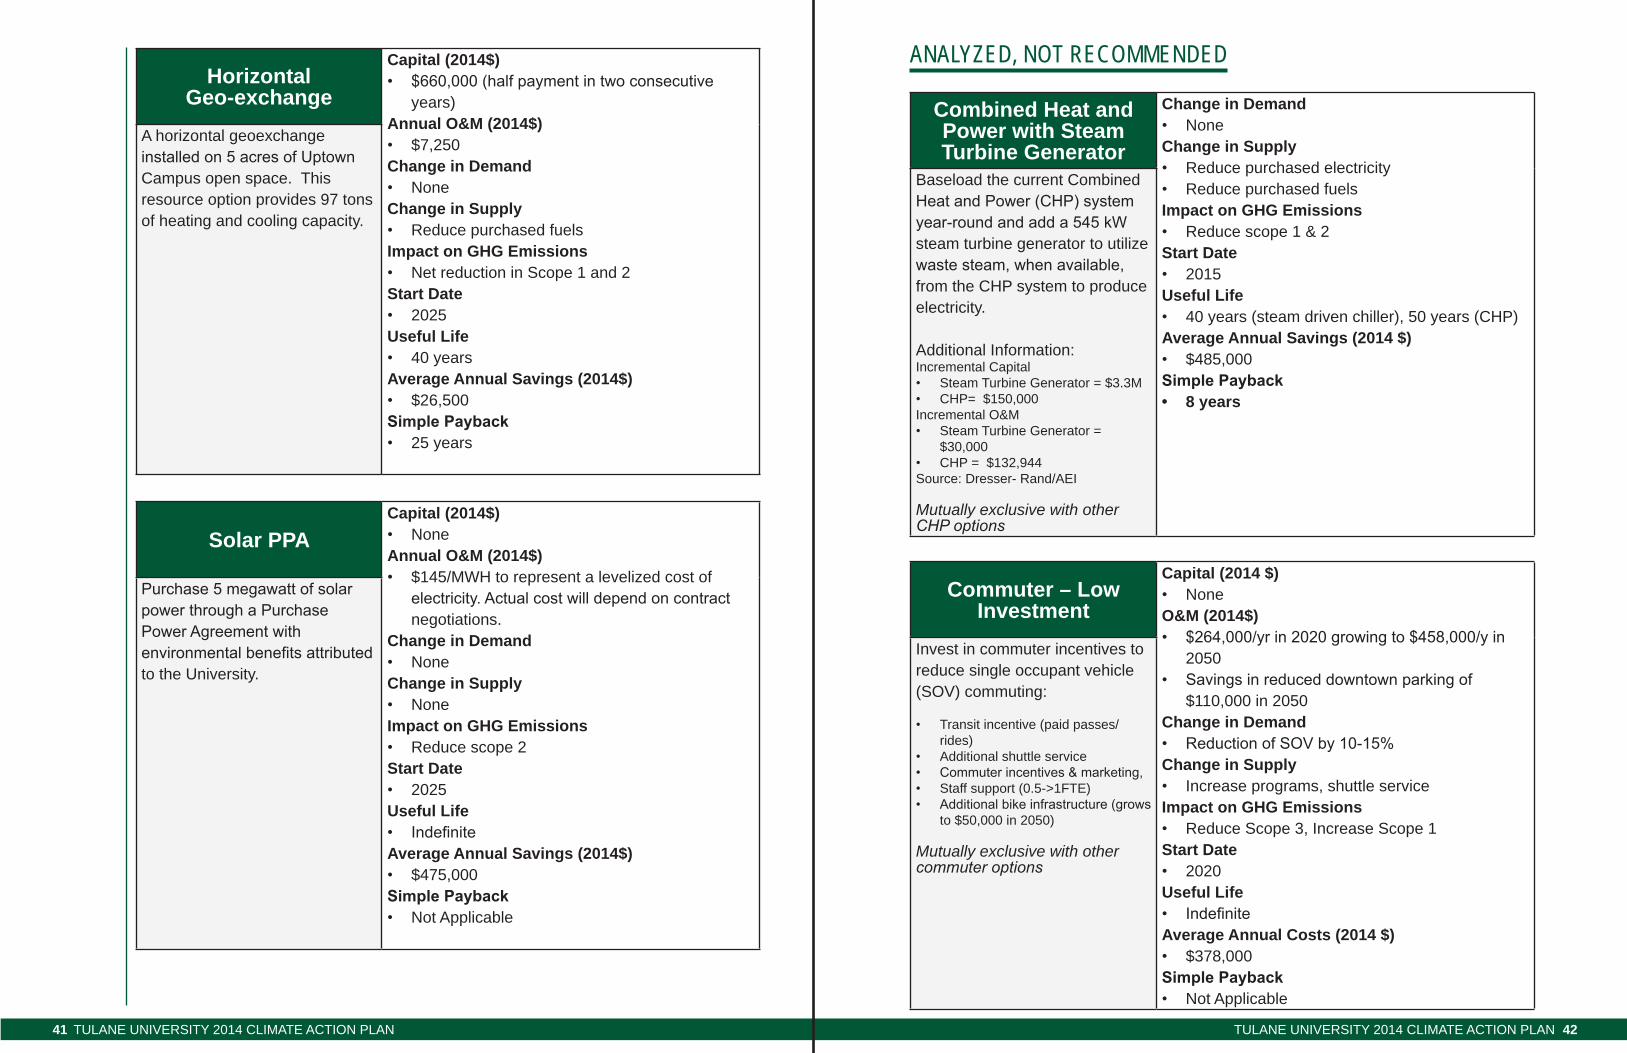
HorizontalGeo-exchange
Capital (2014$)• $660,000 (half payment in two consecutive
years)Annual O&M (2014$)• $7,250Change in Demand• noneChange in Supply• reduce purchased fuelsImpact on GHG Emissions• net reduction in scope 1 and 2Start Date• 2025Useful Life• 40 yearsAverage Annual Savings (2014$)• $26,500Simple Payback• 25 years
a horizontal geoexchange installed on 5 acres of Uptown Campus open space. This resource option provides 97 tons of heating and cooling capacity.
AnAlyzed, not Recommended
Combined Heat and Power with Steam Turbine Generator
Change in Demand• noneChange in Supply• reduce purchased electricity• reduce purchased fuelsImpact on GHG Emissions• reduce scope 1 & 2Start Date• 2015Useful Life• 40 years (steam driven chiller), 50 years (CHP)Average Annual Savings (2014 $)• $485,000Simple Payback• 8 years
Baseload the current Combined Heat and Power (CHP) system year-round and add a 545 kW steam turbine generator to utilize waste steam, when available, from the CHP system to produce electricity.
additional information:incremental Capital• steam Turbine Generator = $3.3M• CHP= $150,000incremental O&M• steam Turbine Generator =
$30,000 • CHP = $132,944source: Dresser- rand/aei
Mutually exclusive with other CHP options
Commuter – Low Investment
Capital (2014 $)• noneO&M (2014$)• $264,000/yr in 2020 growing to $458,000/y in
2050 • Savings in reduced downtown parking of
$110,000 in 2050Change in Demand• Reduction of SOV by 10-15%Change in Supply• increase programs, shuttle serviceImpact on GHG Emissions• reduce scope 3, increase scope 1Start Date• 2020Useful Life• IndefiniteAverage Annual Costs (2014 $)• $378,000Simple Payback• not applicable
invest in commuter incentives to reduce single occupant vehicle (sOv) commuting:
• Transit incentive (paid passes/rides)
• additional shuttle service• Commuter incentives & marketing, • staff support (0.5->1FTe)• Additional bike infrastructure (grows
to $50,000 in 2050)
Mutually exclusive with other commuter options
Solar PPACapital (2014$)• noneAnnual O&M (2014$)• $145/MWH to represent a levelized cost of
electricity. Actual cost will depend on contract negotiations.
Change in Demand• noneChange in Supply• noneImpact on GHG Emissions• reduce scope 2Start Date• 2025Useful Life• IndefiniteAverage Annual Savings (2014$)• $475,000Simple Payback• not applicable
Purchase 5 megawatt of solar power through a Purchase Power Agreement with environmental benefits attributed to the university.
Tulane universiTy 2014 ClimaTe aCTion Plan43 Tulane universiTy 2014 ClimaTe aCTion Plan 44
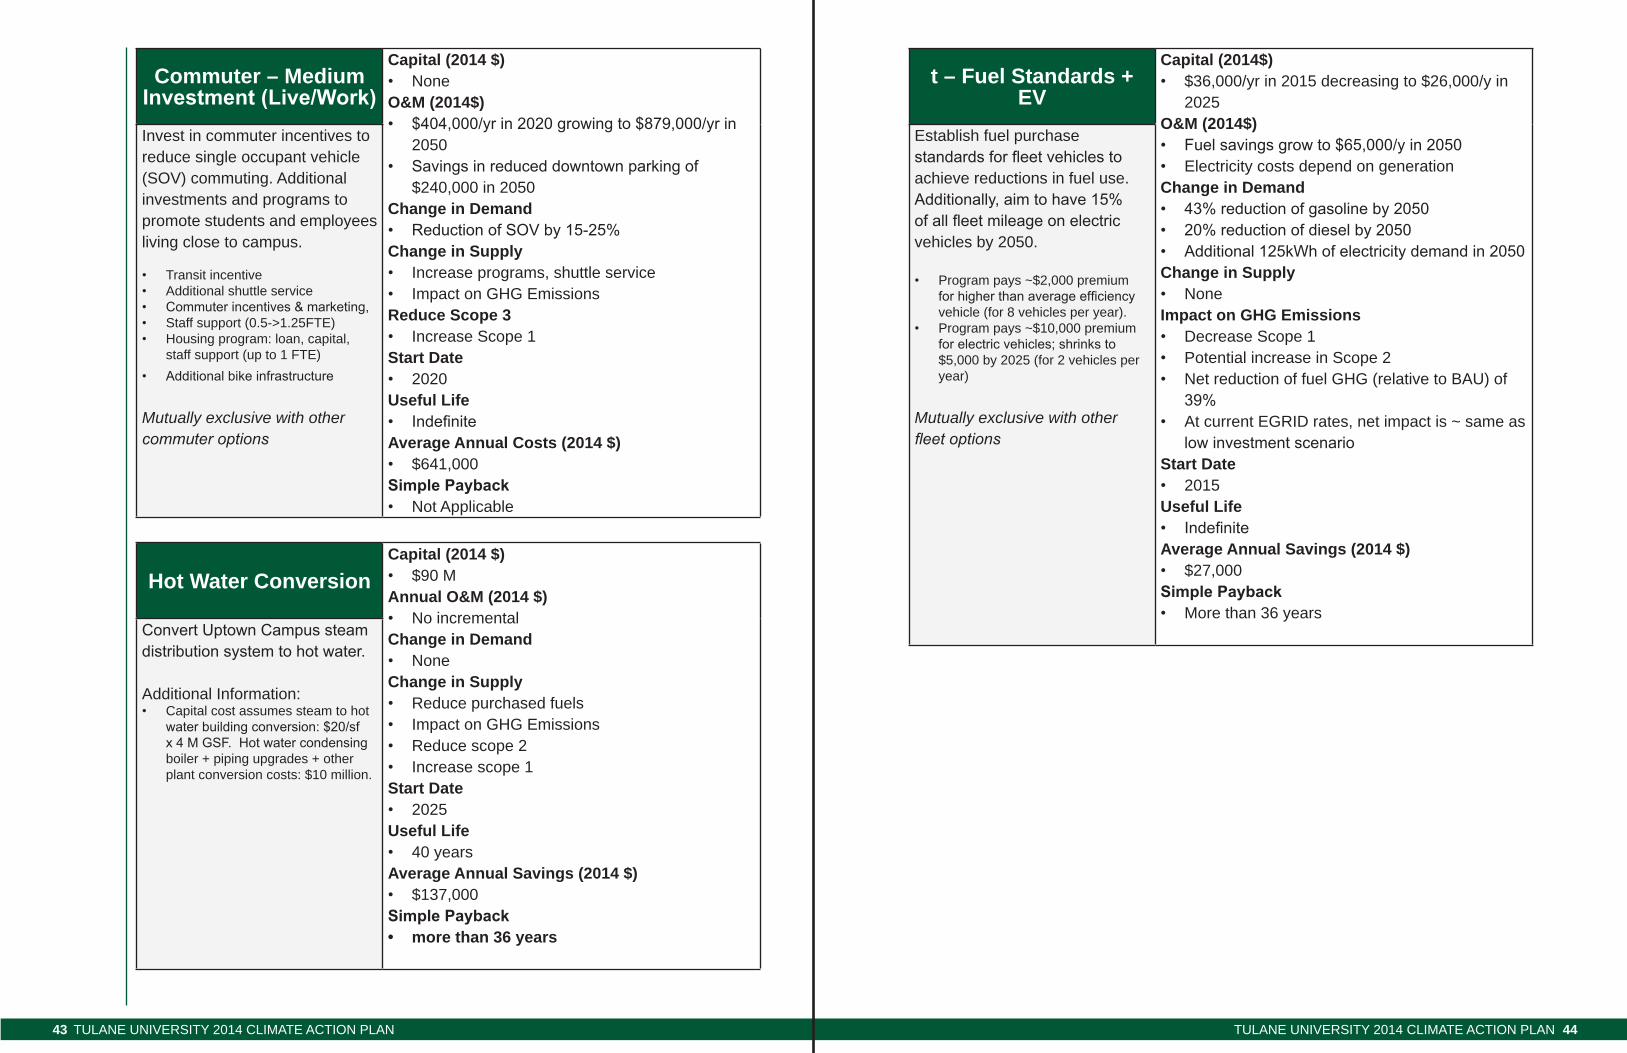
Commuter – Medium Investment (Live/Work)
Capital (2014 $)• noneO&M (2014$)• $404,000/yr in 2020 growing to $879,000/yr in
2050 • Savings in reduced downtown parking of
$240,000 in 2050Change in Demand• Reduction of SOV by 15-25%Change in Supply• increase programs, shuttle service• impact on GHG emissionsReduce Scope 3• increase scope 1Start Date• 2020Useful Life• IndefiniteAverage Annual Costs (2014 $)• $641,000Simple Payback• not applicable
invest in commuter incentives to reduce single occupant vehicle (sOv) commuting. additional investments and programs to promote students and employees living close to campus.
• Transit incentive• additional shuttle service• Commuter incentives & marketing, • staff support (0.5->1.25FTe)• Housing program: loan, capital,
staff support (up to 1 FTe)• Additional bike infrastructure
Mutually exclusive with other commuter options
Hot Water ConversionCapital (2014 $)• $90 MAnnual O&M (2014 $)• no incremental Change in Demand• noneChange in Supply• reduce purchased fuels• impact on GHG emissions• reduce scope 2• increase scope 1Start Date• 2025Useful Life• 40 yearsAverage Annual Savings (2014 $)• $137,000Simple Payback• more than 36 years
Convert Uptown Campus steam distribution system to hot water.
additional information: • Capital cost assumes steam to hot
water building conversion: $20/sf x 4 M GSF. Hot water condensing boiler + piping upgrades + other plant conversion costs: $10 million.
t – Fuel Standards + EV
Capital (2014$)• $36,000/yr in 2015 decreasing to $26,000/y in
2025O&M (2014$)• Fuel savings grow to $65,000/y in 2050• electricity costs depend on generationChange in Demand• 43% reduction of gasoline by 2050• 20% reduction of diesel by 2050• Additional 125kWh of electricity demand in 2050Change in Supply• noneImpact on GHG Emissions• Decrease scope 1• Potential increase in scope 2• net reduction of fuel GHG (relative to Bau) of
39%• at current eGriD rates, net impact is ~ same as
low investment scenarioStart Date• 2015Useful Life• IndefiniteAverage Annual Savings (2014 $)• $27,000Simple Payback• More than 36 years
establish fuel purchase standards for fleet vehicles to achieve reductions in fuel use. Additionally, aim to have 15% of all fleet mileage on electric vehicles by 2050.
• Program pays ~$2,000 premium for higher than average efficiency vehicle (for 8 vehicles per year).
• Program pays ~$10,000 premium for electric vehicles; shrinks to $5,000 by 2025 (for 2 vehicles per year)
Mutually exclusive with other fleet options
Tulane universiTy 2014 ClimaTe aCTion Plan45 Tulane universiTy 2014 ClimaTe aCTion Plan 46
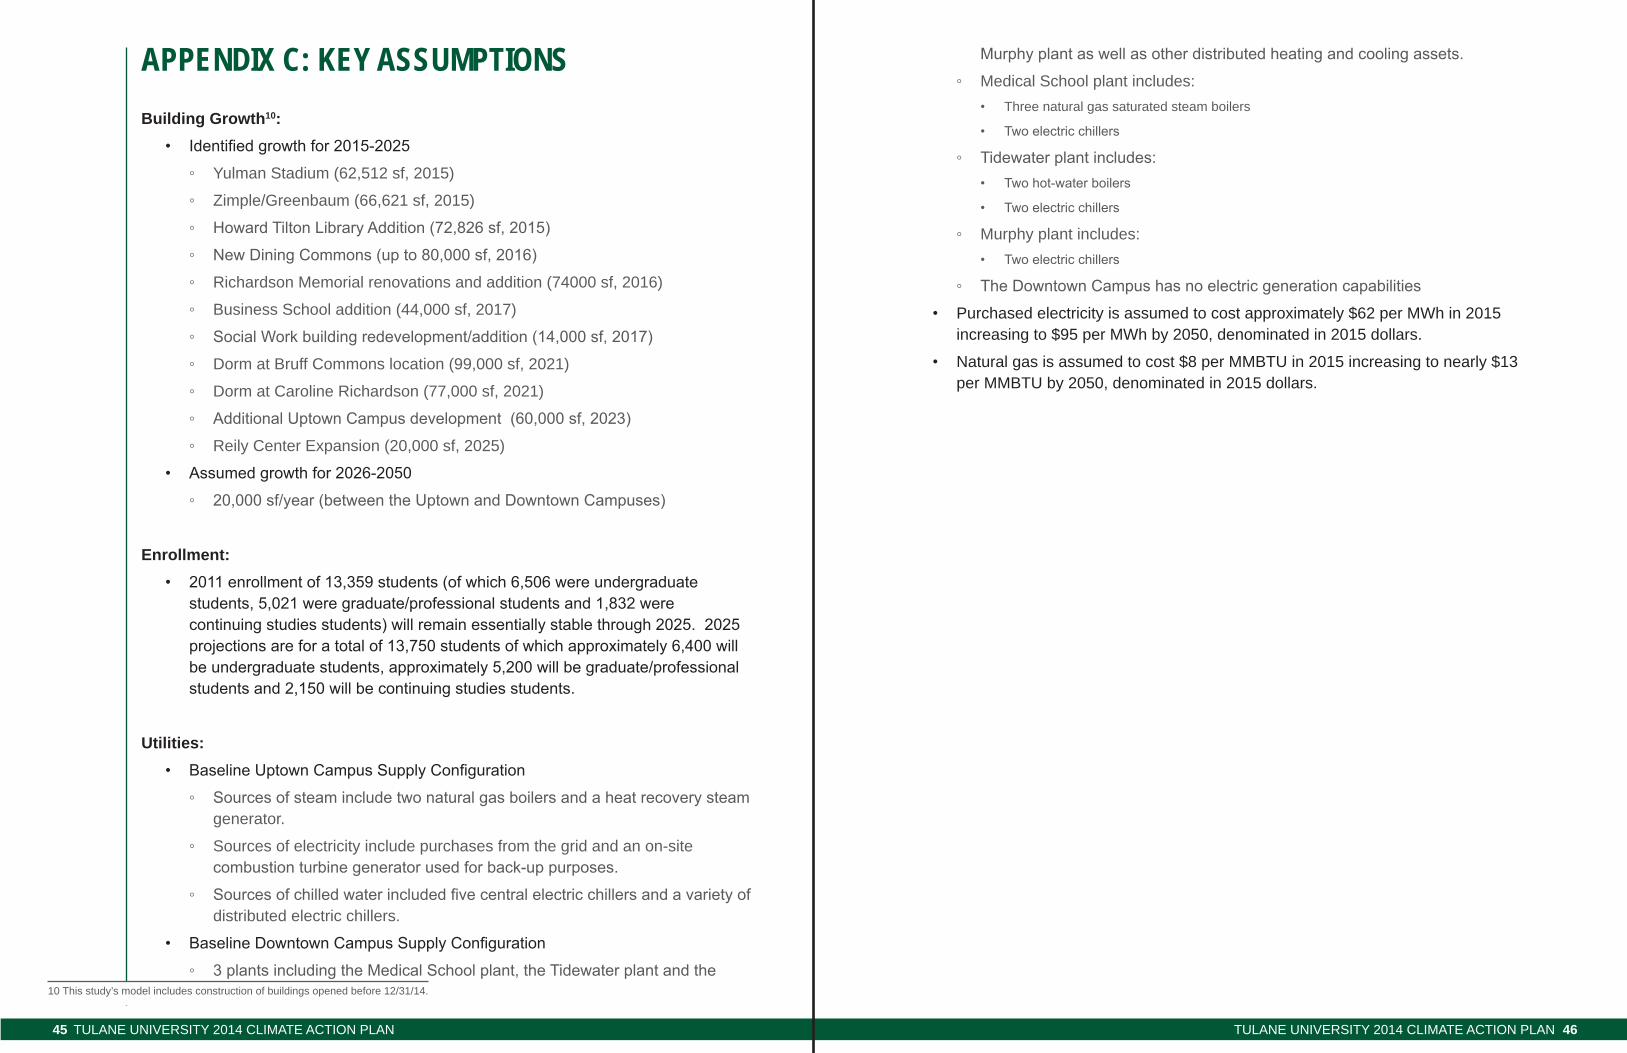
APPENDIx C: KEy ASSumPTIONSBuilding Growth10:
• Identified growth for 2015-2025
◦ yulman stadium (62,512 sf, 2015)
◦ Zimple/Greenbaum (66,621 sf, 2015)
◦ Howard Tilton Library Addition (72,826 sf, 2015)
◦ New Dining Commons (up to 80,000 sf, 2016)
◦ richardson Memorial renovations and addition (74000 sf, 2016)
◦ Business school addition (44,000 sf, 2017)
◦ Social Work building redevelopment/addition (14,000 sf, 2017)
◦ Dorm at Bruff Commons location (99,000 sf, 2021)
◦ Dorm at Caroline richardson (77,000 sf, 2021)
◦ Additional Uptown Campus development (60,000 sf, 2023)
◦ reily Center expansion (20,000 sf, 2025)
• Assumed growth for 2026-2050
◦ 20,000 sf/year (between the Uptown and Downtown Campuses)
Enrollment:• 2011 enrollment of 13,359 students (of which 6,506 were undergraduate
students, 5,021 were graduate/professional students and 1,832 were continuing studies students) will remain essentially stable through 2025. 2025 projections are for a total of 13,750 students of which approximately 6,400 will be undergraduate students, approximately 5,200 will be graduate/professional students and 2,150 will be continuing studies students.
Utilities:• Baseline Uptown Campus Supply Configuration
◦ Sources of steam include two natural gas boilers and a heat recovery steam generator.
◦ sources of electricity include purchases from the grid and an on-site combustion turbine generator used for back-up purposes.
◦ Sources of chilled water included five central electric chillers and a variety of distributed electric chillers.
• Baseline Downtown Campus Supply Configuration
◦ 3 plants including the Medical School plant, the Tidewater plant and the 10 This study’s model includes construction of buildings opened before 12/31/14.
Murphy plant as well as other distributed heating and cooling assets.
◦ Medical school plant includes:• Three natural gas saturated steam boilers
• Two electric chillers
◦ Tidewater plant includes:• Two hot-water boilers
• Two electric chillers
◦ Murphy plant includes:• Two electric chillers
◦ The Downtown Campus has no electric generation capabilities
• Purchased electricity is assumed to cost approximately $62 per MWh in 2015 increasing to $95 per MWh by 2050, denominated in 2015 dollars.
• natural gas is assumed to cost $8 per MMBTu in 2015 increasing to nearly $13 per MMBTu by 2050, denominated in 2015 dollars.
Tulane universiTy 2014 ClimaTe aCTion Plan47 Tulane universiTy 2014 ClimaTe aCTion Plan 48
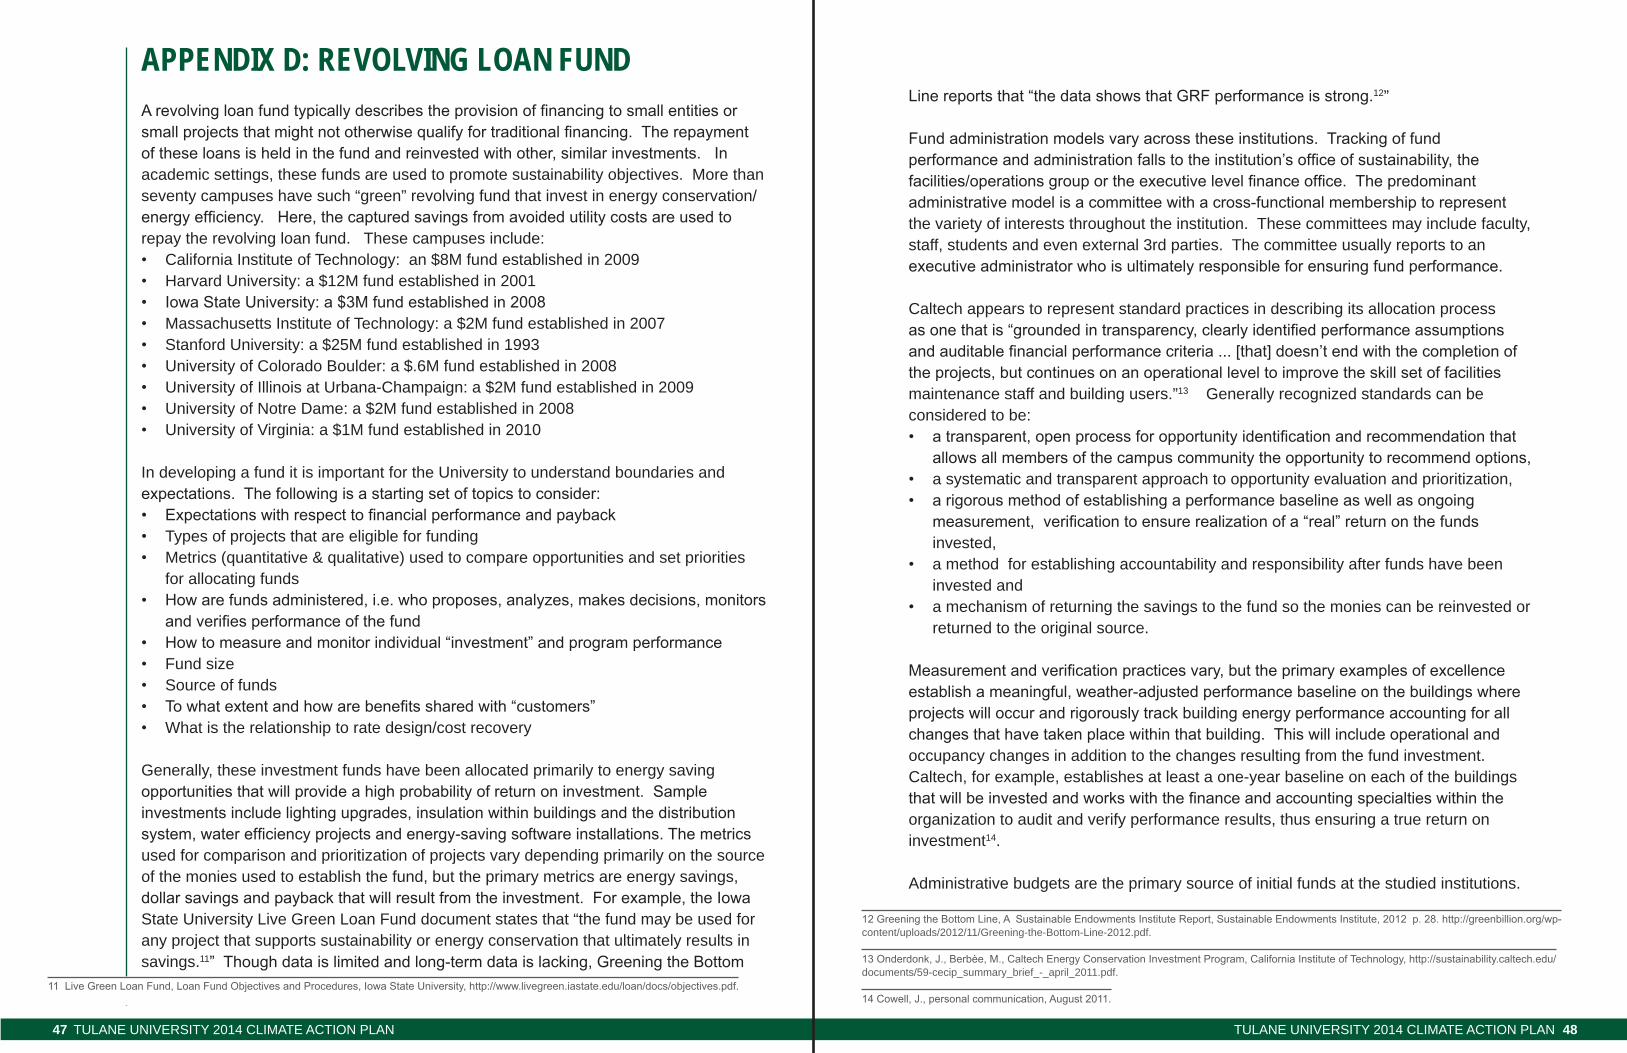
APPENDIx D: rEvOLvINg LOAN FuNDA revolving loan fund typically describes the provision of financing to small entities or small projects that might not otherwise qualify for traditional financing. The repayment of these loans is held in the fund and reinvested with other, similar investments. In academic settings, these funds are used to promote sustainability objectives. More than seventy campuses have such “green” revolving fund that invest in energy conservation/energy efficiency. Here, the captured savings from avoided utility costs are used to repay the revolving loan fund. These campuses include:• California institute of Technology: an $8M fund established in 2009• Harvard university: a $12M fund established in 2001• Iowa State University: a $3M fund established in 2008• Massachusetts institute of Technology: a $2M fund established in 2007• stanford university: a $25M fund established in 1993• university of Colorado Boulder: a $.6M fund established in 2008• university of illinois at urbana-Champaign: a $2M fund established in 2009• university of notre Dame: a $2M fund established in 2008• university of virginia: a $1M fund established in 2010
in developing a fund it is important for the university to understand boundaries and expectations. The following is a starting set of topics to consider:• Expectations with respect to financial performance and payback• Types of projects that are eligible for funding• Metrics (quantitative & qualitative) used to compare opportunities and set priorities
for allocating funds• How are funds administered, i.e. who proposes, analyzes, makes decisions, monitors
and verifies performance of the fund• How to measure and monitor individual “investment” and program performance• Fund size• source of funds• To what extent and how are benefits shared with “customers”• What is the relationship to rate design/cost recovery
Generally, these investment funds have been allocated primarily to energy saving opportunities that will provide a high probability of return on investment. Sample investments include lighting upgrades, insulation within buildings and the distribution system, water efficiency projects and energy-saving software installations. The metrics used for comparison and prioritization of projects vary depending primarily on the source of the monies used to establish the fund, but the primary metrics are energy savings, dollar savings and payback that will result from the investment. For example, the Iowa state university live Green loan Fund document states that “the fund may be used for any project that supports sustainability or energy conservation that ultimately results in savings.11” Though data is limited and long-term data is lacking, Greening the Bottom
11 Live Green Loan Fund, Loan Fund Objectives and Procedures, Iowa State University, http://www.livegreen.iastate.edu/loan/docs/objectives.pdf.
Line reports that “the data shows that GRF performance is strong.12”
Fund administration models vary across these institutions. Tracking of fund performance and administration falls to the institution’s office of sustainability, the facilities/operations group or the executive level finance office. The predominant administrative model is a committee with a cross-functional membership to represent the variety of interests throughout the institution. These committees may include faculty, staff, students and even external 3rd parties. The committee usually reports to an executive administrator who is ultimately responsible for ensuring fund performance.
Caltech appears to represent standard practices in describing its allocation process as one that is “grounded in transparency, clearly identified performance assumptions and auditable financial performance criteria ... [that] doesn’t end with the completion of the projects, but continues on an operational level to improve the skill set of facilities maintenance staff and building users.”13 Generally recognized standards can be considered to be:• a transparent, open process for opportunity identification and recommendation that
allows all members of the campus community the opportunity to recommend options, • a systematic and transparent approach to opportunity evaluation and prioritization, • a rigorous method of establishing a performance baseline as well as ongoing
measurement, verification to ensure realization of a “real” return on the funds invested,
• a method for establishing accountability and responsibility after funds have been invested and
• a mechanism of returning the savings to the fund so the monies can be reinvested or returned to the original source.
Measurement and verification practices vary, but the primary examples of excellence establish a meaningful, weather-adjusted performance baseline on the buildings where projects will occur and rigorously track building energy performance accounting for all changes that have taken place within that building. This will include operational and occupancy changes in addition to the changes resulting from the fund investment. Caltech, for example, establishes at least a one-year baseline on each of the buildings that will be invested and works with the finance and accounting specialties within the organization to audit and verify performance results, thus ensuring a true return on investment14.
administrative budgets are the primary source of initial funds at the studied institutions.
12 Greening the Bottom Line, A Sustainable Endowments Institute Report, Sustainable Endowments Institute, 2012 p. 28. http://greenbillion.org/wp-content/uploads/2012/11/Greening-the-Bottom-line-2012.pdf. 13 Onderdonk, J., Berbèe, M., Caltech Energy Conservation Investment Program, California Institute of Technology, http://sustainability.caltech.edu/documents/59-cecip_summary_brief_-_april_2011.pdf. 14 Cowell, J., personal communication, August 2011.
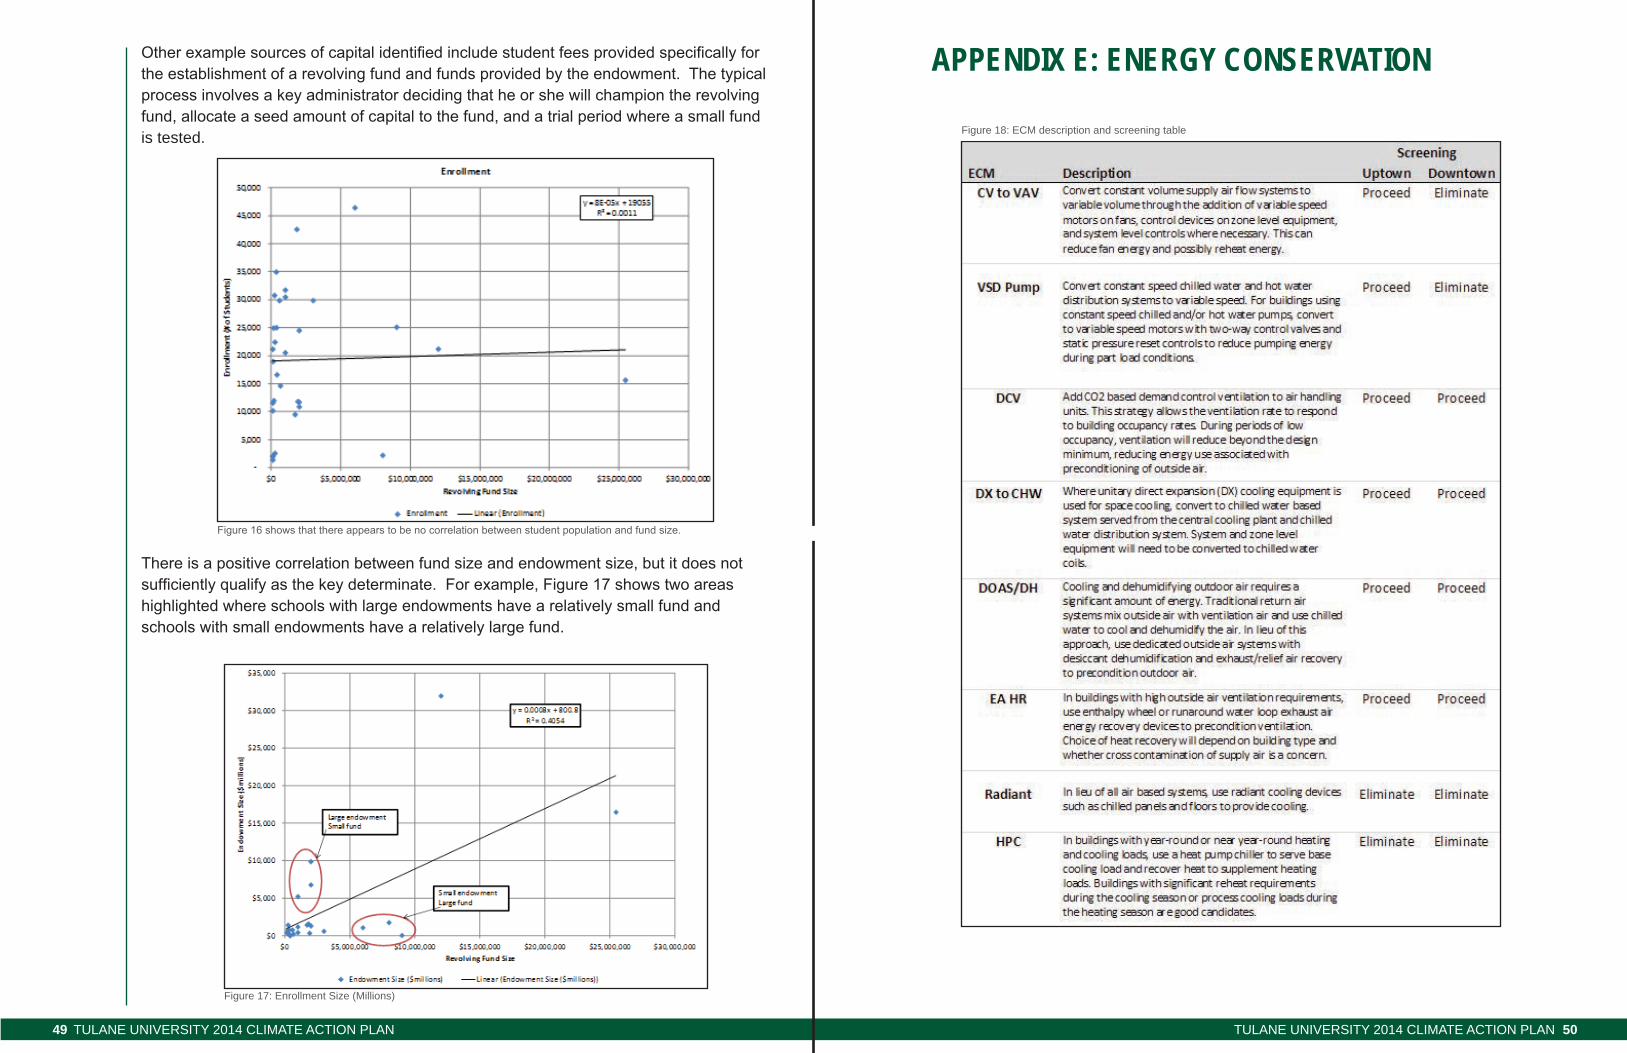
Tulane universiTy 2014 ClimaTe aCTion Plan49 Tulane universiTy 2014 ClimaTe aCTion Plan 50
Other example sources of capital identified include student fees provided specifically for the establishment of a revolving fund and funds provided by the endowment. The typical process involves a key administrator deciding that he or she will champion the revolving fund, allocate a seed amount of capital to the fund, and a trial period where a small fund is tested.
There is a positive correlation between fund size and endowment size, but it does not sufficiently qualify as the key determinate. For example, Figure 17 shows two areas highlighted where schools with large endowments have a relatively small fund and schools with small endowments have a relatively large fund.
Figure 16 shows that there appears to be no correlation between student population and fund size.
APPENDIx E: ENErgy CONSErvATION
Figure 18: eCM description and screening table
Figure 17: enrollment size (Millions)
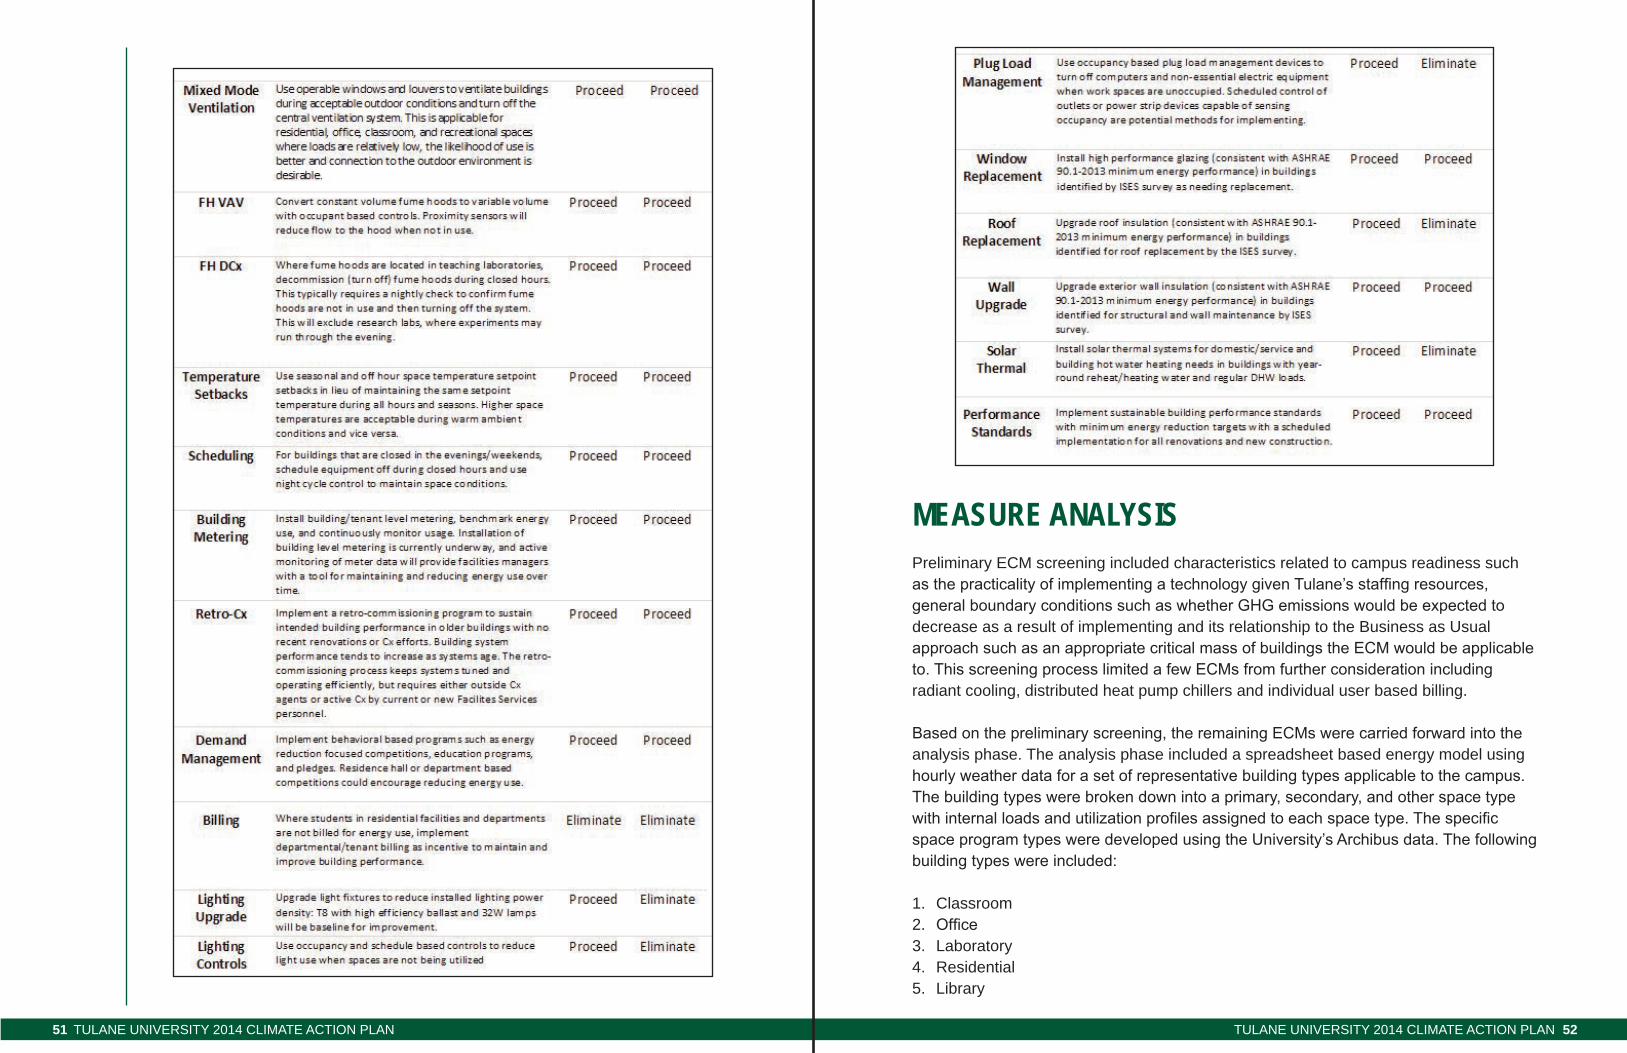
Tulane universiTy 2014 ClimaTe aCTion Plan51 Tulane universiTy 2014 ClimaTe aCTion Plan 52
mEASurE ANALySISPreliminary eCM screening included characteristics related to campus readiness such as the practicality of implementing a technology given Tulane’s staffing resources, general boundary conditions such as whether GHG emissions would be expected to decrease as a result of implementing and its relationship to the Business as usual approach such as an appropriate critical mass of buildings the ECM would be applicable to. This screening process limited a few ECMs from further consideration including radiant cooling, distributed heat pump chillers and individual user based billing.
Based on the preliminary screening, the remaining ECMs were carried forward into the analysis phase. The analysis phase included a spreadsheet based energy model using hourly weather data for a set of representative building types applicable to the campus. The building types were broken down into a primary, secondary, and other space type with internal loads and utilization profiles assigned to each space type. The specific space program types were developed using the University’s Archibus data. The following building types were included:
1. Classroom2. Office3. laboratory4. residential5. library
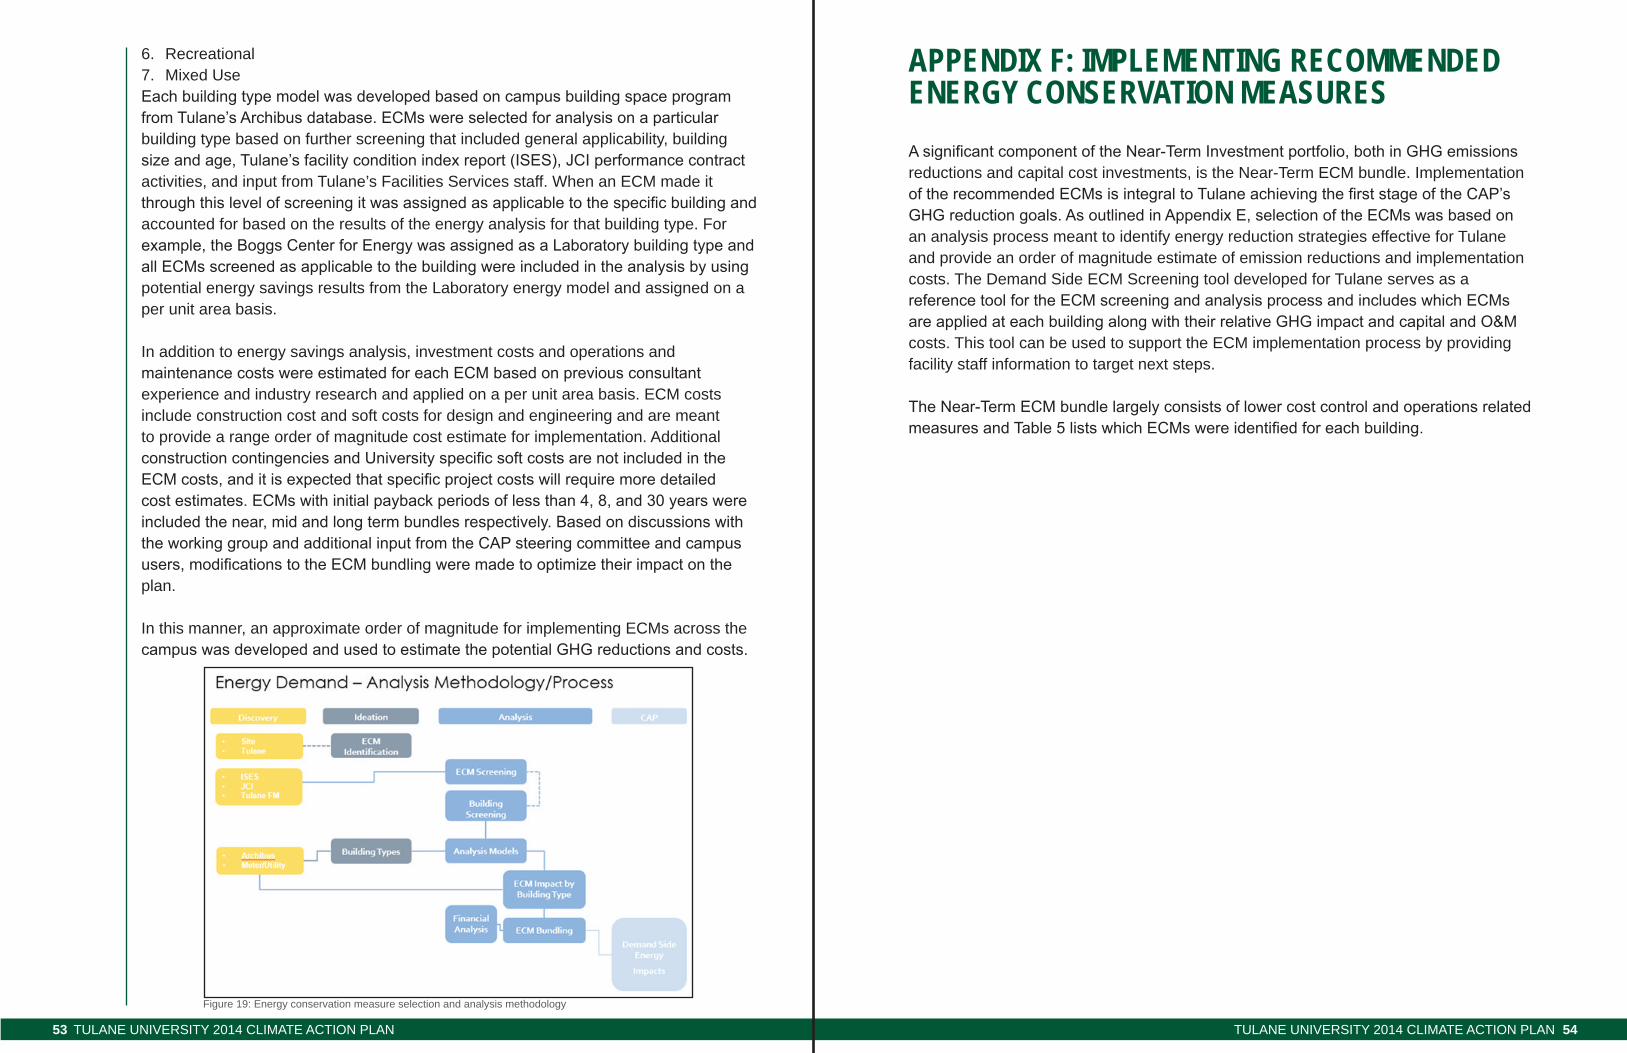
Tulane universiTy 2014 ClimaTe aCTion Plan53 Tulane universiTy 2014 ClimaTe aCTion Plan 54
6. recreational7. Mixed useEach building type model was developed based on campus building space program from Tulane’s Archibus database. ECMs were selected for analysis on a particular building type based on further screening that included general applicability, building size and age, Tulane’s facility condition index report (ISES), JCI performance contract activities, and input from Tulane’s Facilities services staff. When an eCM made it through this level of screening it was assigned as applicable to the specific building and accounted for based on the results of the energy analysis for that building type. For example, the Boggs Center for Energy was assigned as a Laboratory building type and all ECMs screened as applicable to the building were included in the analysis by using potential energy savings results from the laboratory energy model and assigned on a per unit area basis.
in addition to energy savings analysis, investment costs and operations and maintenance costs were estimated for each ECM based on previous consultant experience and industry research and applied on a per unit area basis. eCM costs include construction cost and soft costs for design and engineering and are meant to provide a range order of magnitude cost estimate for implementation. additional construction contingencies and University specific soft costs are not included in the ECM costs, and it is expected that specific project costs will require more detailed cost estimates. ECMs with initial payback periods of less than 4, 8, and 30 years were included the near, mid and long term bundles respectively. Based on discussions with the working group and additional input from the CAP steering committee and campus users, modifications to the ECM bundling were made to optimize their impact on the plan.
in this manner, an approximate order of magnitude for implementing eCMs across the campus was developed and used to estimate the potential GHG reductions and costs.
Figure 19: energy conservation measure selection and analysis methodology
APPENDIx F: ImPLEmENTINg rECOmmENDED ENErgy CONSErvATION mEASurESA significant component of the Near-Term Investment portfolio, both in GHG emissions reductions and capital cost investments, is the near-Term eCM bundle. implementation of the recommended ECMs is integral to Tulane achieving the first stage of the CAP’s GHG reduction goals. As outlined in Appendix E, selection of the ECMs was based on an analysis process meant to identify energy reduction strategies effective for Tulane and provide an order of magnitude estimate of emission reductions and implementation costs. The Demand side eCM screening tool developed for Tulane serves as a reference tool for the ECM screening and analysis process and includes which ECMs are applied at each building along with their relative GHG impact and capital and O&M costs. This tool can be used to support the eCM implementation process by providing facility staff information to target next steps.
The Near-Term ECM bundle largely consists of lower cost control and operations related measures and Table 5 lists which ECMs were identified for each building.
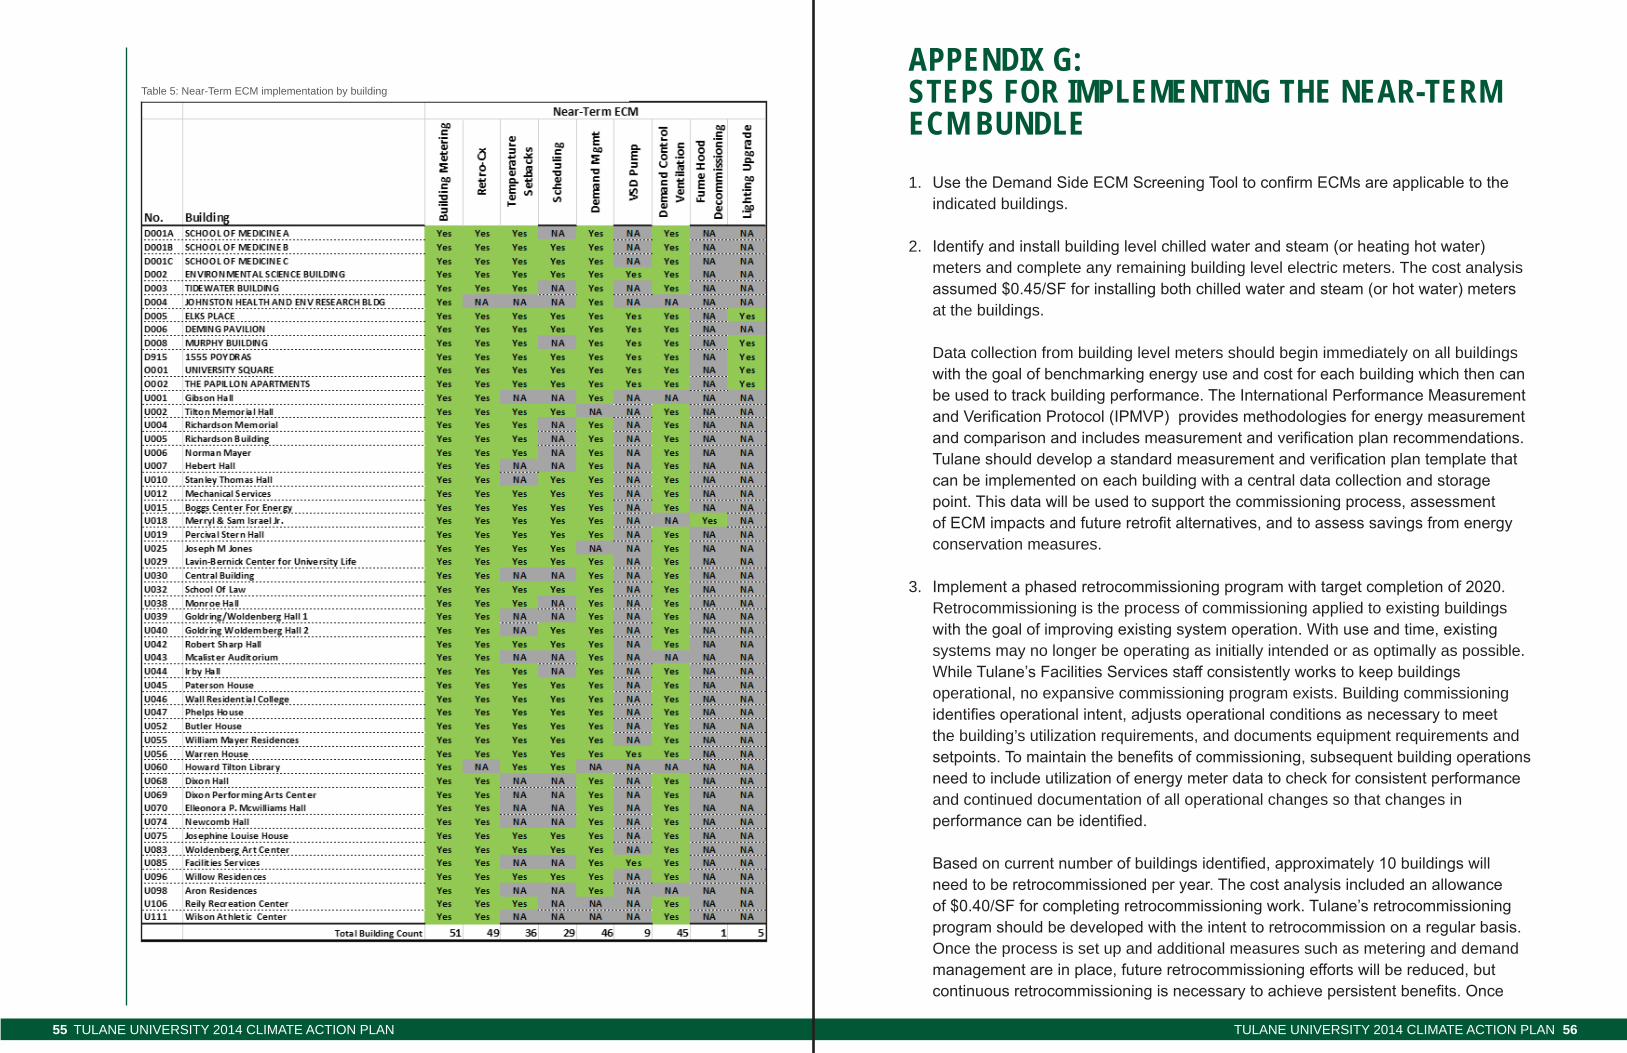
Tulane universiTy 2014 ClimaTe aCTion Plan55 Tulane universiTy 2014 ClimaTe aCTion Plan 56
Table 5: near-Term eCM implementation by building
APPENDIx g: STEPS FOr ImPLEmENTINg ThE NEAr-TErm ECm BuNDLE1. Use the Demand Side ECM Screening Tool to confirm ECMs are applicable to the
indicated buildings.
2. Identify and install building level chilled water and steam (or heating hot water) meters and complete any remaining building level electric meters. The cost analysis assumed $0.45/SF for installing both chilled water and steam (or hot water) meters at the buildings.
Data collection from building level meters should begin immediately on all buildings with the goal of benchmarking energy use and cost for each building which then can be used to track building performance. The International Performance Measurement and Verification Protocol (IPMVP) provides methodologies for energy measurement and comparison and includes measurement and verification plan recommendations. Tulane should develop a standard measurement and verification plan template that can be implemented on each building with a central data collection and storage point. This data will be used to support the commissioning process, assessment of ECM impacts and future retrofit alternatives, and to assess savings from energy conservation measures.
3. Implement a phased retrocommissioning program with target completion of 2020. retrocommissioning is the process of commissioning applied to existing buildings with the goal of improving existing system operation. With use and time, existing systems may no longer be operating as initially intended or as optimally as possible. While Tulane’s Facilities Services staff consistently works to keep buildings operational, no expansive commissioning program exists. Building commissioning identifies operational intent, adjusts operational conditions as necessary to meet the building’s utilization requirements, and documents equipment requirements and setpoints. To maintain the benefits of commissioning, subsequent building operations need to include utilization of energy meter data to check for consistent performance and continued documentation of all operational changes so that changes in performance can be identified.
Based on current number of buildings identified, approximately 10 buildings will need to be retrocommissioned per year. The cost analysis included an allowance of $0.40/SF for completing retrocommissioning work. Tulane’s retrocommissioning program should be developed with the intent to retrocommission on a regular basis. Once the process is set up and additional measures such as metering and demand management are in place, future retrocommissioning efforts will be reduced, but continuous retrocommissioning is necessary to achieve persistent benefits. Once
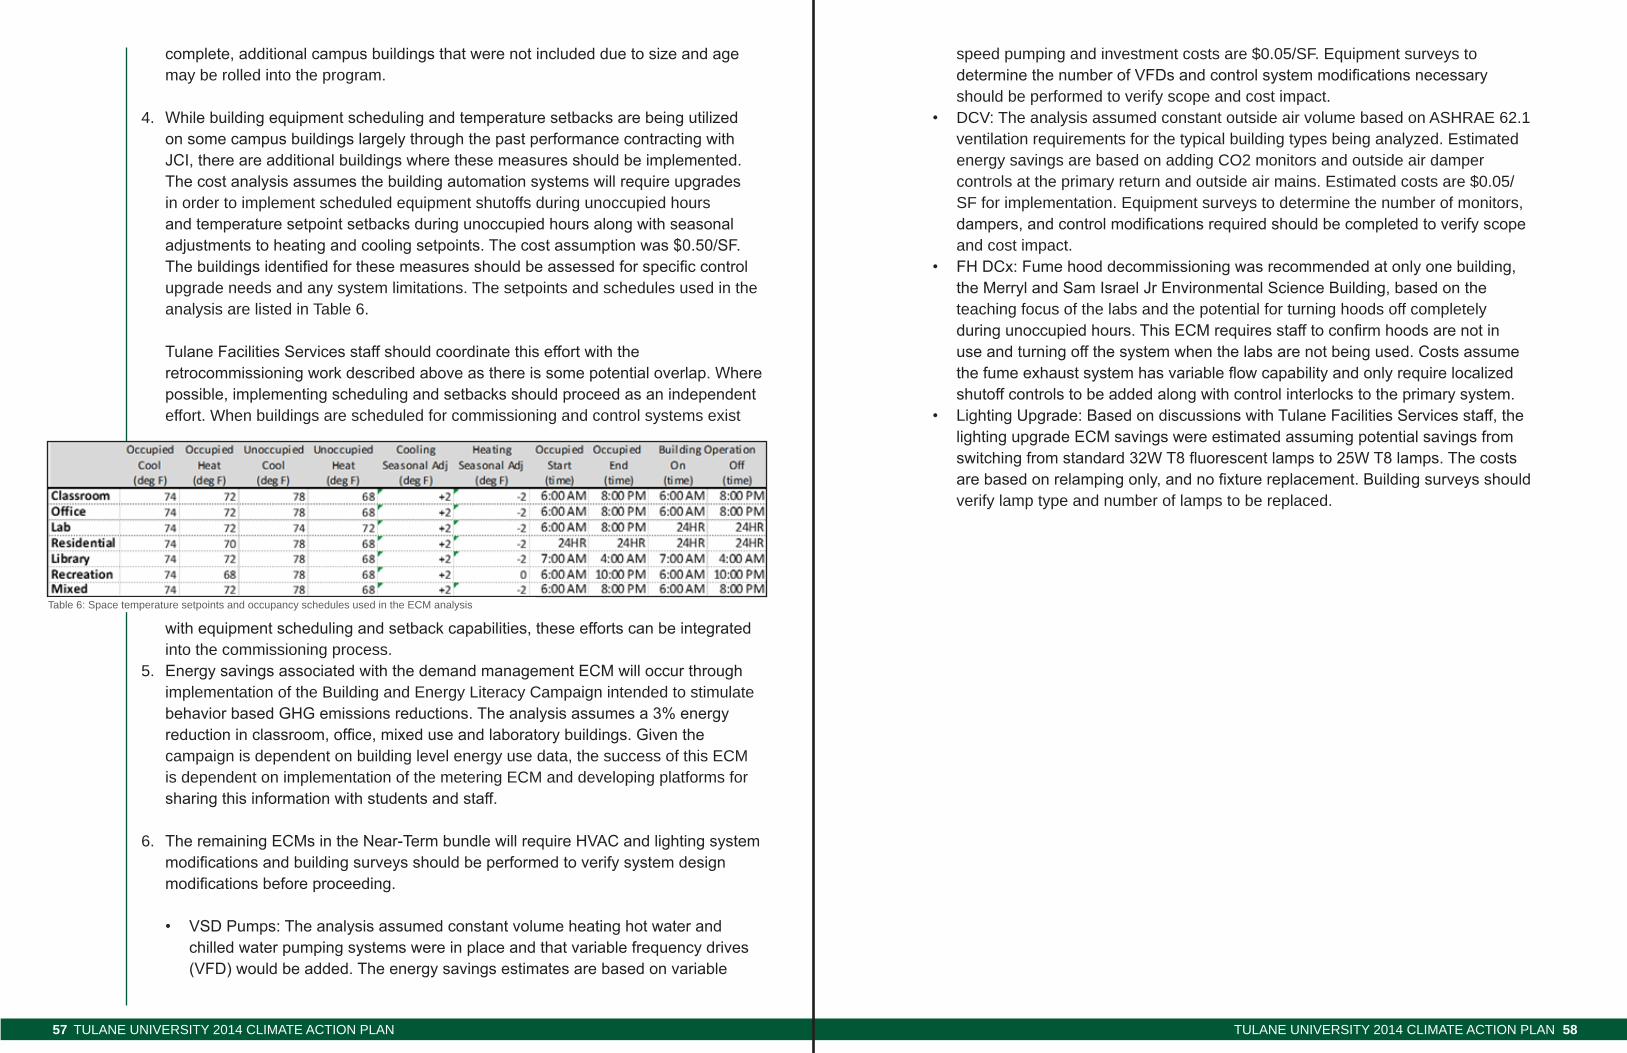
Tulane universiTy 2014 ClimaTe aCTion Plan57 Tulane universiTy 2014 ClimaTe aCTion Plan 58
complete, additional campus buildings that were not included due to size and age may be rolled into the program.
4. While building equipment scheduling and temperature setbacks are being utilized on some campus buildings largely through the past performance contracting with JCI, there are additional buildings where these measures should be implemented. The cost analysis assumes the building automation systems will require upgrades in order to implement scheduled equipment shutoffs during unoccupied hours and temperature setpoint setbacks during unoccupied hours along with seasonal adjustments to heating and cooling setpoints. The cost assumption was $0.50/SF. The buildings identified for these measures should be assessed for specific control upgrade needs and any system limitations. The setpoints and schedules used in the analysis are listed in Table 6.
Tulane Facilities Services staff should coordinate this effort with the retrocommissioning work described above as there is some potential overlap. Where possible, implementing scheduling and setbacks should proceed as an independent effort. When buildings are scheduled for commissioning and control systems exist
with equipment scheduling and setback capabilities, these efforts can be integrated into the commissioning process.
5. Energy savings associated with the demand management ECM will occur through implementation of the Building and energy literacy Campaign intended to stimulate behavior based GHG emissions reductions. The analysis assumes a 3% energy reduction in classroom, office, mixed use and laboratory buildings. Given the campaign is dependent on building level energy use data, the success of this eCM is dependent on implementation of the metering eCM and developing platforms for sharing this information with students and staff.
6. The remaining ECMs in the Near-Term bundle will require HVAC and lighting system modifications and building surveys should be performed to verify system design modifications before proceeding.
• VSD Pumps: The analysis assumed constant volume heating hot water and chilled water pumping systems were in place and that variable frequency drives (VFD) would be added. The energy savings estimates are based on variable
Table 6: space temperature setpoints and occupancy schedules used in the eCM analysis
speed pumping and investment costs are $0.05/sF. equipment surveys to determine the number of VFDs and control system modifications necessary should be performed to verify scope and cost impact.
• DCv: The analysis assumed constant outside air volume based on asHrae 62.1 ventilation requirements for the typical building types being analyzed. estimated energy savings are based on adding CO2 monitors and outside air damper controls at the primary return and outside air mains. estimated costs are $0.05/sF for implementation. equipment surveys to determine the number of monitors, dampers, and control modifications required should be completed to verify scope and cost impact.
• FH DCx: Fume hood decommissioning was recommended at only one building, the Merryl and Sam Israel Jr Environmental Science Building, based on the teaching focus of the labs and the potential for turning hoods off completely during unoccupied hours. This ECM requires staff to confirm hoods are not in use and turning off the system when the labs are not being used. Costs assume the fume exhaust system has variable flow capability and only require localized shutoff controls to be added along with control interlocks to the primary system.
• Lighting Upgrade: Based on discussions with Tulane Facilities Services staff, the lighting upgrade ECM savings were estimated assuming potential savings from switching from standard 32W T8 fluorescent lamps to 25W T8 lamps. The costs are based on relamping only, and no fixture replacement. Building surveys should verify lamp type and number of lamps to be replaced.
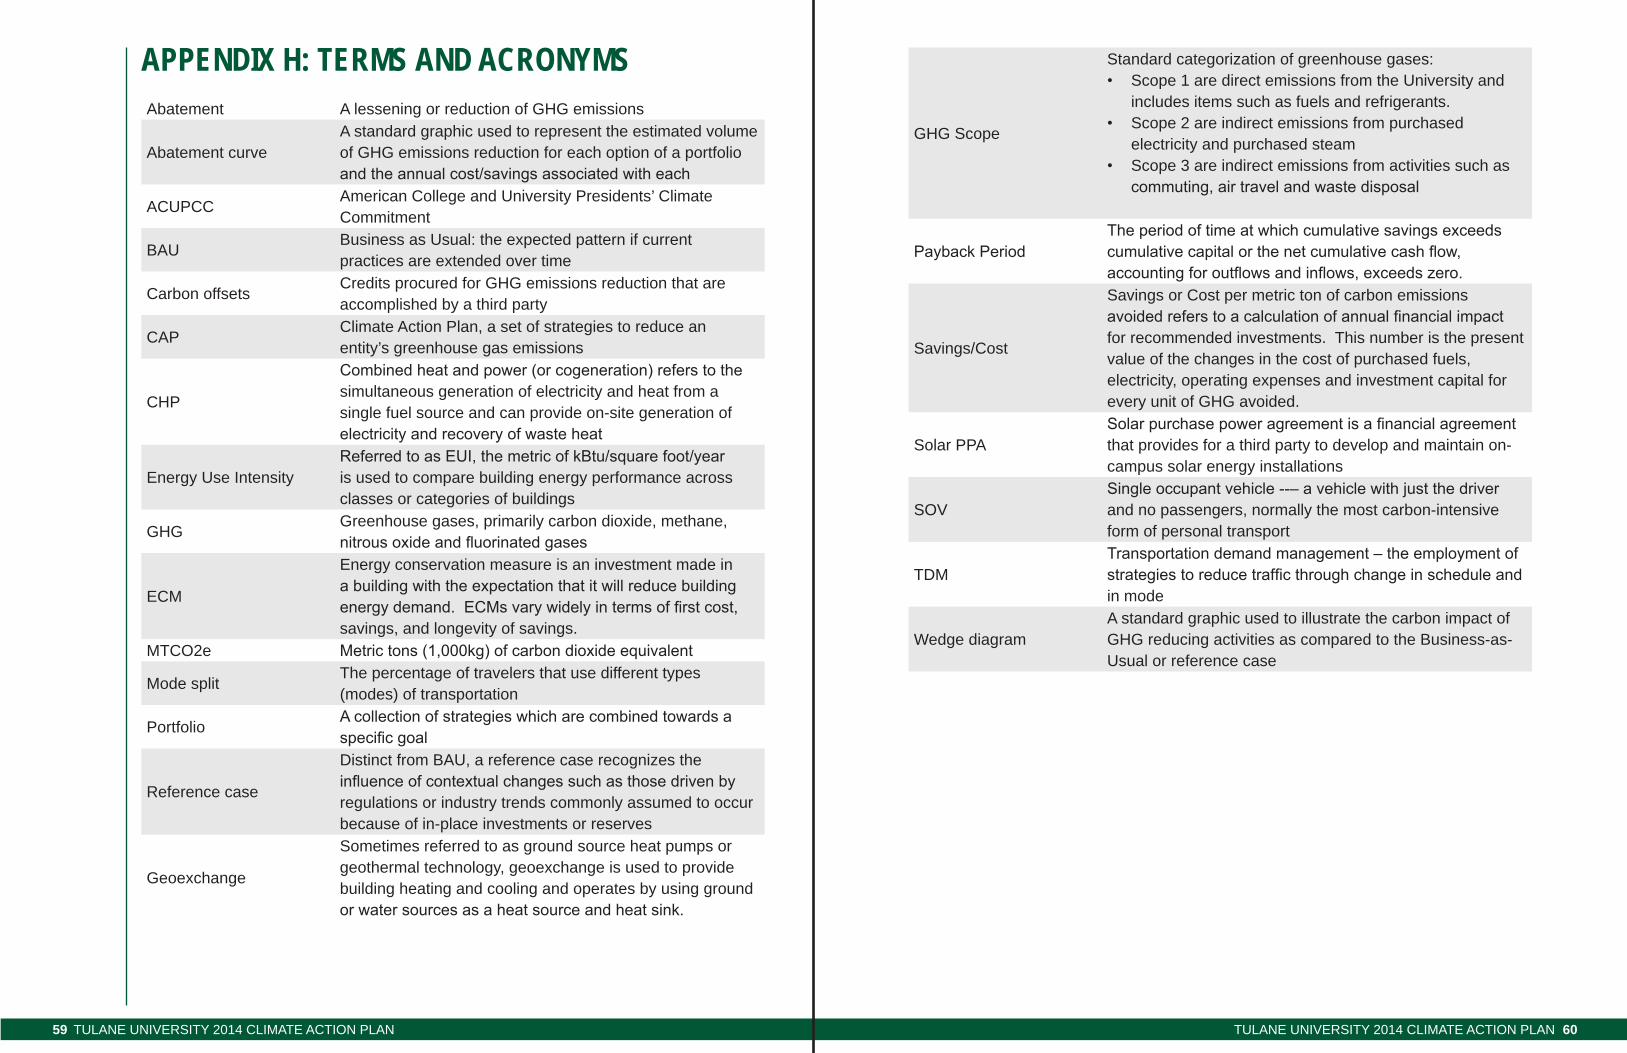
Tulane universiTy 2014 ClimaTe aCTion Plan59 Tulane universiTy 2014 ClimaTe aCTion Plan 60
APPENDIx h: TErmS AND ACrONymSabatement a lessening or reduction of GHG emissions
abatement curvea standard graphic used to represent the estimated volume of GHG emissions reduction for each option of a portfolio and the annual cost/savings associated with each
aCuPCCamerican College and university Presidents’ Climate Commitment
BauBusiness as usual: the expected pattern if current practices are extended over time
Carbon offsetsCredits procured for GHG emissions reduction that are accomplished by a third party
CaPClimate action Plan, a set of strategies to reduce an entity’s greenhouse gas emissions
CHP
Combined heat and power (or cogeneration) refers to the simultaneous generation of electricity and heat from a single fuel source and can provide on-site generation of electricity and recovery of waste heat
energy use intensityReferred to as EUI, the metric of kBtu/square foot/year is used to compare building energy performance across classes or categories of buildings
GHGGreenhouse gases, primarily carbon dioxide, methane, nitrous oxide and fluorinated gases
eCM
energy conservation measure is an investment made in a building with the expectation that it will reduce building energy demand. ECMs vary widely in terms of first cost, savings, and longevity of savings.
MTCO2e Metric tons (1,000kg) of carbon dioxide equivalent
Mode splitThe percentage of travelers that use different types (modes) of transportation
PortfolioA collection of strategies which are combined towards a specific goal
reference case
Distinct from Bau, a reference case recognizes the influence of contextual changes such as those driven by regulations or industry trends commonly assumed to occur because of in-place investments or reserves
Geoexchange
sometimes referred to as ground source heat pumps or geothermal technology, geoexchange is used to provide building heating and cooling and operates by using ground or water sources as a heat source and heat sink.
GHG scope
standard categorization of greenhouse gases: • scope 1 are direct emissions from the university and
includes items such as fuels and refrigerants. • scope 2 are indirect emissions from purchased
electricity and purchased steam • scope 3 are indirect emissions from activities such as
commuting, air travel and waste disposal
Payback PeriodThe period of time at which cumulative savings exceeds cumulative capital or the net cumulative cash flow, accounting for outflows and inflows, exceeds zero.
savings/Cost
savings or Cost per metric ton of carbon emissions avoided refers to a calculation of annual financial impact for recommended investments. This number is the present value of the changes in the cost of purchased fuels, electricity, operating expenses and investment capital for every unit of GHG avoided.
solar PPaSolar purchase power agreement is a financial agreement that provides for a third party to develop and maintain on-campus solar energy installations
sOvSingle occupant vehicle --– a vehicle with just the driver and no passengers, normally the most carbon-intensive form of personal transport
TDMTransportation demand management – the employment of strategies to reduce traffic through change in schedule and in mode
Wedge diagrama standard graphic used to illustrate the carbon impact of GHG reducing activities as compared to the Business-as-usual or reference case
Tulane universiTy 2014 ClimaTe aCTion Plan61 Tulane universiTy 2014 ClimaTe aCTion Plan 62
APPENDIx I: CONTrIBuTOrSProject Leadership
• amber Beezley, interim Director, university Planning
• Liz Davey, Director Office of Sustainability
Steering Committee• anthony lorino, senior vice President for Operations and Chief Financial
Officer
• Michael Bernstein, senior vice President for academic affairs and Provost
• anne Baños, Chief of staff and vice President for administrative services
• Yvette Jones, Executive Vice President for University Relations and Development
• lee Hamm, senior vice President and Dean, school of Medicine
• Rick Dickson, Director of Athletics
Working Groups energy Demand
• amber Beezley, interim Director, university Planning
• richard Fullerton, Director, Design services
• Mike Guidry, Sr. Associate VP, Facilities Services
• John Nonnamaker, Associate Vice President, Student Affairs
• Sue Pollack, Assistant Dean, Program Review & Strategic Analysis, School of Medicine
• Rickie Kramer, Energy Manager, Facilities Services
• ico sulejmanagic, Project engineer, Facilities services
• sylvia Berenguer, sr. associate vP for university Design and Construction
energy supply
• Geoff Parker, Prof. and Director, Tulane Energy Institute
• Mike Guidry, Sr. Associate VP, Facilities Services
• Brian Mitchell, associate Provost for Graduate studies & research
• anjali sheffrin, research Professor, a.B. Freeman school of Business
• Andrew Grin, Student, A.B. Freeman School of Business
• Rickie Kramer, Energy Manager, Facilities Services
• ico sulejmanagic, Project engineer, Facilities services
Transportation and Campus Planning
• amber Beezley, interim Director, university Planning
• Brandon Macneill, executive associate athletic Director
• rob Hailey, sr. assoc. vP, university services
• Brian Lowe, Director, Shuttles and Transportation
• Stephen Wright, Executive Director, State & Local Affairs (Office of Govt. affairs)
• Jon Barnwell, Police Superintendent
• Dan Jatres, Bicycle and Ped. Program Manager, Regional Planning Commission
student Global Citizenship and sustainability
• Ken Schwartz, Dean of Architecture
• Michael Mahoney, President, Tulane Green Club
• Katharine Jack, Assoc. Prof. and Director, Environmental Studies
• Agnieszka Nance, Interim Executive Director, Center for Public Service
• Jordan Karubian, Asst. Professor, EEB and SISE Fellow
• Stephanie Barksdale, Director, University Partnerships and Social Innovation
• Torbjörn Törnqvist, Prof. and Chair, earth and environmental sciences
• Michael Blum, assoc. Prof. and Director, Tulane/Xavier Center for Bioenvironmental research
• Claire Fitch, Divest Tulane
Consultant Team• nathaniel Grier, env sP: vanasse Hangen Brustlin, inc.
• Willa Kuh: Affiliated Engineers
• Rob McKenna: Confluenc
• Amy Nagengast: Confluenc
• Bill Talbert, PE, LEED AP BD+C: Affiliated Engineers
Tulane universiTy 2014 ClimaTe aCTion Plan63 Tulane universiTy 2014 ClimaTe aCTion Plan 64
APPENDIx J: TuLANE uNIvErSITy CONTACTLiz Davey, Director Office of Sustainability107-a richardson BuildingTulane universityNew Orleans, Louisiana 70118
504/865-5145 (phone) 504/865-8455 (fax) [email protected]

Tulane universiTy 2014 ClimaTe aCTion Plan65