Tug Fleet and Ground Operations Schedules and Controls · Tug Fleet and Ground Operations Schedules...
159
MCR-74-488 NAS8-31011 Program Cost Volume III Estimates February 1975 Tug Fleet and Ground Operations Schedules and Controls (NASA-CR-120 648 ) TUG FLEET AND GROUND N75-18 307 OPERATIONS SCHEDULES AND CONTROLS. VOLUME .3: PROGRAM COST ESTIMATES (Martin Marietta Corp.) 163 p HC $6.25 CSCL 22B Unclas G3/18 13587 4/ !7 AX~- https://ntrs.nasa.gov/search.jsp?R=19750010235 2018-05-31T02:20:30+00:00Z
Transcript of Tug Fleet and Ground Operations Schedules and Controls · Tug Fleet and Ground Operations Schedules...

MCR-74-488NAS8-31011
ProgramCost
Volume III Estimates February 1975
Tug Fleet andGround OperationsSchedules andControls
(NASA-CR-1206 4 8 ) TUG FLEET AND GROUND N75-18 3 0 7
OPERATIONS SCHEDULES AND CONTROLS. VOLUME
.3: PROGRAM COST ESTIMATES (Martin Marietta
Corp.) 163 p HC $6.25 CSCL 22B UnclasG3/18 13587
4/ !7 AX~-
https://ntrs.nasa.gov/search.jsp?R=19750010235 2018-05-31T02:20:30+00:00Z

MCR-74-488NAS8-31011 Program
CostVolume III Estimates February 1975
TUG FLEET AND GROUNDOPERATIONS SCHEDULESAND CONTROLS
MARTIN MARIETTA CORPORATIONP. O. Box 179Denver, Colorado 80201

FOREWORD----------------------------------------------------------------
This final report, submitted in accordance with Data Procurement
Document number 480 dated June 1974, contract NAS8-31011, ispublished in three volumes:
Volume I - Executive Summary (DRL MA-04)
Volume II - Part I Final Report (DRL MA-03)
Part II Addenda (DRL MA-03)
Part III Appendixes (DRL MA-03)
Volume III - Program Study Cost Estimates (DRL MF003M)
The content of each volume is shown in the diagram on the follow-
ing page.
Questions regarding this study activity should be directed to
the following persons:
Ray D. Etheridge, CORNASA-George C. Marshall Space Flight CenterMarshall Spaceflight CenterHuntsville, Alabama 35812Mail Stop: PS-02
Mike Cardone, AlternateNASA-John F. Kennedy Space Flight Center
Kennedy Space.Flight CenterFlorida 32899Mail Stop: LV/TMO
John L. BestStudy ManagerMartin Marietta AerospaceP.O. Box 179Denver, CO 80201Mail Stop: 5191
Tom J. GoyetteDeputy Space Tug DirectorMartin Marietta AerospaceP. O. Box 179Denver, CO 80201Mail Stop: 5191
ii

TUG FLEET AND GROUND OPERATIONS SCHEDULES AND CONTROLS, FINAL REPORT (NAS8-31011)
Volume I Volume II Volume III
Executive Part I Program Cost
Summary Final Report Estimates
-Introduction -Introduction -Introduction
-Method of Approach -Synopsis of Study Elements -DDT&E Launch Site Activation-
-Basic Data and Significant Results -Subplans Timeline Funding
-Concluding Remarks A-Tug Operational Subplan -Operations - Tug Launch Site
B-IUS/Tug Fleet Utilization Support Timeline Funding
Subplan -General Information
C-IUS/Tug Payload
Integration Subplan
D-Space Tug Site Activation
Subplan
E-IUS/Tug Transition Phase
SubplanF-Tug Acqusition Phase Subplan
-Supporting Research & Technology-Recommended Additional Effort
-References and Bibliography
Volume II Volume II
Part II Part III
Addenda Appendixes
1. Tug Safing Requirements at Postlanding A. Tug Function Description Data
2. Tug/Shuttle Mating/Demating Functions and Constraints Sheet
3. Tug Access Provision before Prelaunch B. Tug GSE Requirements Specifi-
4. Reverification and Checkout of Tug-to-Orbiter Interfaces in cation Data Sheet
Event of Tug and/or Payload Changeout at the Pad C. Tug Facility Requirements
5. Propellant Loading Special Assessment Study Specification Data Sheet
S 6. Tug Processing in a Factory Clean Environment D. Software Requirements Data Sheet
7. Impact of Tug Launches at WTR E. Maintenance Requirements
8. Sensitivity Analysis9. Tug Vertical vs Horizontal Handling

CONTENTS
Page
I. INTRODUCTION .. . . . . . . . . .. 1
A. Life Cycle Cost Methodology . . . ............ 1
B. Work Breakdown Structure ................ 4
C. Selected Option Facility, GSE, and Manpower.
Requirements . . . . . . . . . . . . . . . . . .4
1.0 Facility and GSE . . . . . . ................. 4
1.1 Facility - New and Modified . . .. ........... . . 12
1.2 GSE . . . ........................ 20
1.3 Transportation Requirements and Support . . . . . 20
1.4 Site Activation and Verification . . ......... 25
2.0 Manpower Staffing . . .. . . ................. . 26
II. DDT&E LAUNCH SITE ACTIVATION - TIMELINE FUNDING . . . 32
Total Cost Summary by WBS Element . . . ........ . 34
DDT&E Cost by Month (WBS Level 3) . . ........ . 36
Cost by Project Function by Year (WBS Level PF) . • • 38
Cost by Project Function by Year (WBS Level 4). . . 39
Cost by WBS by Project Function by Month
(WBS Level 5) . .. . . .............. . . ... . . 42
Summary of Other Direct Charges by Type by Month. 65
Total Manpower Summary by Project Function
(WBS Level PF) . . .. . . . .................. . 67
Total Manpower Summary by Project Function and
Elements (WBS Level 5). . . . . . . . ..... .. . 68
III. OPERATIONS - TUG LAUNCH SITE SUPPORT -
TIMELINE FUNDING . . . . . . . . . . . . . . . . . . 73
Total Cost Summary by WBS Element . . ......... . 79
Operations Total Cost by Year ... ... * * * ...... 82
Cost by Project Function by Year (BS Level PF) . 83
Cost by Level 4 WBS by Project Function by Year . . . 84'
Cost by WBS Project Function by Year (WBS Level 5). 89
Summary of Other Direct Charges by Type by Month. 102
Total Manpower Summary by Project Function
(WBS Level PF) . . . . . . . . . . . . . . . . . .. 105
Total Manpower Summary by Project Function and WBS
Elements (WBS Level 5) . . . . . . . . . . . . . . . 106
IV. GENERAL INFORMATION .... . . . . . . . . . . . . .. . 119
A. Subdivisions of Work . . . ................ 119
B. Work Breakdown Structure Dictionary ......... 120
C. WBS Definitions . . . . . . . . . . . . . . . . . . . 123
D. Basis for Estimate . . . . . . . . . . . . . . . . . 132
E. Pricing Factors . . . . . . . . . . . . . . . . . . . 133
iv

Figure
Page
1. Tug Ground Operations Life Cycle Cost Approach. . . . 22. DDT&E Phase Work Breakdown Structure. . ....... 73. Operations Phase. . ............. . . . . 94. Factory Clean Processing in Joint IUS/Tug
Processing Facility . ................ 115. VAB Low Bay TPF Layout. . .............. . 146. VAB Low Bay Tug Processing Area . .......... 187. VAB Low Bay IUS Processing Area . .......... 188. VAB Low Bay Area K. . ................ . 199. VAB Low Bay Cell Clean Area . ............ 1910. Canister Transporter. ................ 24ii. Design Construction Flow, Site Activation . ..... 2512. ETR Site Activation, Construction Crew Size ..... 2713. ETR Launch Site Operations Crew Size. . ........ 2714. Construction Phase Milestones . .. ......... 3015. Construction Phase Schedule ............. * * * * * * * * 3016. Engineering Model and First Flight Article
Schedule . ................ .... . . 3117. DDT&E Phase Costs 1980-1984 ... .......... . 3218. ETR Launch Site Operations Crew Size. . ........ 7419. ETR Crew Organization (With WTR Launch
Capability) . ............ . . ..... .. 7420. Fleet Utilization Management Organization ..... 7521. Tug Ground Operations Yearly Funding. . ........ 7622. Operations Phase Costs 1984-1991. . ........ . 77
Table
1. Summary, Option Trade Studies . .......... . 5
2. Option 6 Facility and GSE Requirements. . ....... 13
3. Ground Support Equipment Matrix ........... 21
4. ETR Site Activation, Construction Period. . ..... . 28
5. ETR Site Activation, Engineering Model and FirstFlight Article. .......... . . . ........ 29
6. Ground DDT&E Timeline Funding . .......... . 33
7. Operations Phase Timeline Funding .......... 768. Tug WBS Identification Number Sequence. ....... 121
v
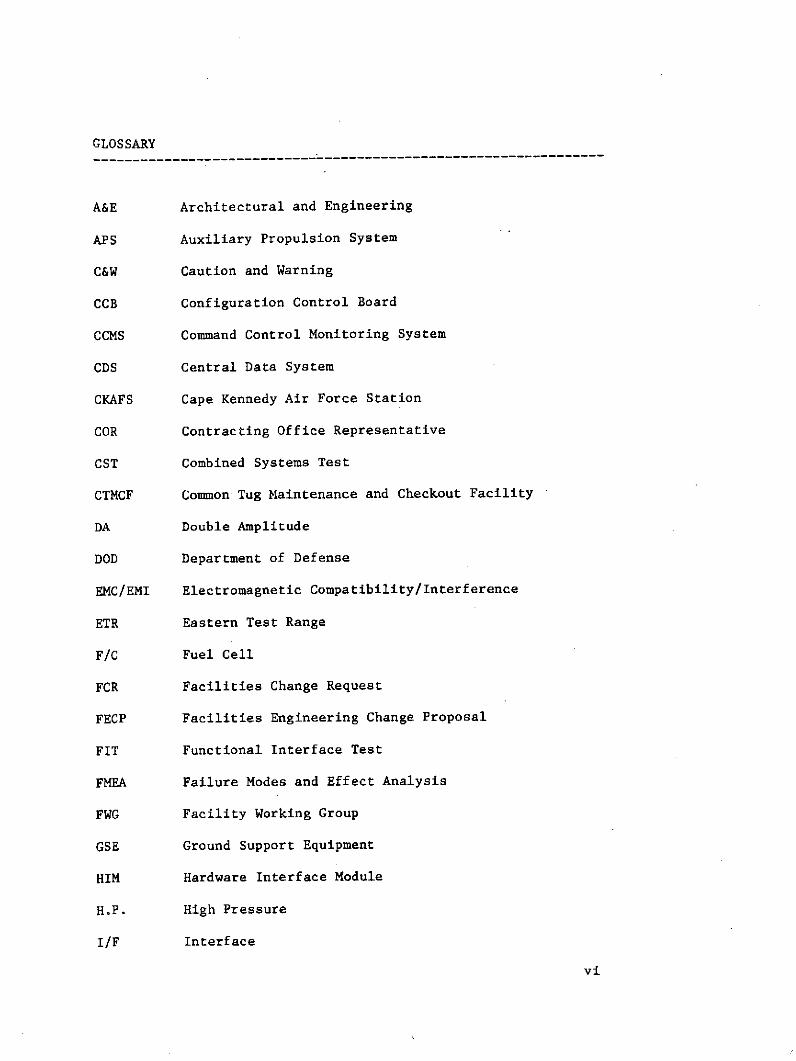
GLOSSARY
A&E Architectural and Engineering
APS Auxiliary Propulsion System
C&W Caution and Warning
CCB Configuration Control Board
CCMS Command Control Monitoring System
CDS Central Data System
CKAFS Cape Kennedy Air Force Station
COR Contracting Office Representative
CST Combined Systems Test
CTMCF Common Tug Maintenance and Checkout Facility
DA Double Amplitude
DOD Department of Defense
EMC/EMI Electromagnetic Compatibility/Interference
ETR Eastern Test Range
F/C Fuel Cell
FCR Facilities Change Request
FECP Facilities Engineering Change Proposal
FIT Functional Interface Test
FMEA Failure Modes and Effect Analysis
FWG Facility Working Group
GSE Ground Support Equipment
HIM Hardware Interface Module
H.P. High Pressure
I/F Interface
vi

I/O Input/Output
IOC Initial Operational Capability
IUS Interim Upper Stage
JSC Johnson Space Center
KPF Kick Stage Processing Facility
KSC Kennedy Space Center
LCC Launch Control Center
L.P. Low Pressure
LPS Launch Processing System
LRU Line Replaceable Unit
MDF Mate-Demate Fixture
MIC Management Information Center
MPS Main Propulsion System
MSFC Marshall Space Flight Center
MSI Maintainability Significant Item
MSS/PSS Mission Specialist Station/Payload Specialist Station
MTBF Mean Time between Failure
MTBR Mean Time between Repair
NASA National Aeronautics Space Administration
NN/D Non-NASA/DOD
O&M Operation and Maintenance
OFI Operational Flight Instrumentation
OIS Operational Intercommunication System
OLF Orbiter Landing Field
OMD Operations Maintenance Documentation
vii

OMI Operational Maintenance Instruction
OPF Orbiter Processing Facility
PCR Payload Changeout Room
P/L Payload
PMF Payload Mate Facility
PPR Payload Processing Room
RFP Request for Proposal
RMS Remote Manipulator System
RTG Radioisotopic Thermal Generator
S&E Science and Engineering
SAWG Site Activation Working Group
S/C Spacecraft
SCF Satellite (Spacecraft) Control Facility
SGLS Space Ground Link System
SHE System Health Evaluation
SPF Spacecraft Processing Facility
SSPD Space Shuttle Payload Description
SRT Supporting Research and Technology
STDN Space Tracking and Data Network
STS Space Transportation System
TBD To be determined
TFP Tug Processing Facility
TSE Transportation Support Equipment
VAB Vertical Assembly Building
VSWR Voltage Standing Wave Ratio
WBS Work Breakdown Structure
viii

INTRODUCTION

I. INTRODUCTION
This volume contains detailed cost data for the Tug DDT&E andoperations phases. Option 6 is the recommended option selected fromseven options considered and was used as the basis for ground pro-cessing estimates. Option 6 provides for processing the Tug in afactory clean environment in the low bay area of VAB with subsequentcleaning to visibly clean. The basis and results of the trade studyto select Option 6 processing plan is included. Cost estimatingmethodology, a work breakdown structure, and a dictionary of WBSdefinitions is also provided.
A. LIFE CYCLE COST METHODOLOGY
1.0 Introduction
The costing approach used in this study draws upon the historicaldata applied to the selected ground operations functional configura-tion, augmented with new data to cost the DDT&E and operationalphases. Trade and sensitivity studies were used to refine the dataused. This costing approach is illustrated in Figure 1.
A detailed manpower timeline and staffing was developed by analysisof job functions necessary to perform the specific site activities.Appropriate engineering personnel estimated manpower requirementsat WBS Level 5 for each task. Propellant costs were developed fromdetailed estimates of quantities with current pricing and loss factorsfrom the KSC propellant plan for Shuttle. Miscellaneous materialswere estimated at $0.17/manhour for each site to cover normal materialusage by engineers and technicians. Skylab history was used todevelop the cost of $0.81/manhour for travel between the launch sitesand the central project management site. Special travel of launchcrews was estimated using airline fares, car rental, per diem and TDYallowances currently in effect. Other direct charges are estimatedat 2.5% of total direct labor dollars and provide for equipmentrental, freight costs, operating supplies and other direct expenses.
2.0 Data Bank
Computer usage was categorized as either business or scientific.The IBM 370 system was used for business management and the usagerate estimated from past experience requirements from similar tasks.For front end processing, keypunch effort of 13 hrs/computer unit isbased on past performance.
The requirements of engineering usage by the Central Fleet Managementsustaining engineering department, and the complex job of FleetManagement of the entire Tug program, seems to warrant the fulltime availability of a high speed, large scale computer. The CDC 6000computer was used to establish the rates for full time usage require-ments.
1

Newly Developed DataActual History e Facilities Inout
Existing Data On Manpower EngineeringManpower Staffing, Staffing * ManufacturingGSE and Software:
* GSE * TestTitan IIIEICentaur
SIntegration Team Software * Quality & Reliability Assurance* Integration Team
Experience at WTR * Experience * Tooling & STE
e Operational Experience Learning Curve * ManagementOf Support Role At ETR * Other 1 Other Direct ChargesAnd WTR
* Skylab Systems En-gineering & Integra- Historical Cost Estimatingtion Task Data Relationships
* Skylab Multiple Dock-ing Adapter OperationExperience Baseline Data
Collection andOperations Phase EvaluationDDT&E Phase
Baseline Program Costs TugGround Operations
WBS Inputs Support/Maintenance OutputPricing Approach CostFiscal Year Funding
IICost/Flight
S Sensitivity Studies
C Trade Studies
Clean & Unclean ProcessingFacility Usage RatesGSE Usage RateWork Crew Usage
Figure 2 Tug Ground Operations Life Cycle Cost Approach

The historical data and newly developed data was collected andinput to the appropriate WBS elements. Under NASA direction basicpricing rules such as a uniform overhead rate was established.
3.0 Trade and Sensitivity Studies
Two interdependent trades were required to establish a basis for theTug processing plan. One trade involved whether the Tug should beprocessed in a factory clean environment or in a 100K clean environment.Concurrently, it was necessary to make a choice of the facilitieswhere the processing was to take place.
Numerous approaches of IUS-Tug operations were considered. Througha selective process these approaches were reduced to seven options:
1) 100K clean Tug processing in dedicated facilities;
2) 100K clean Tug processing, spacecraft mate in user facility;
3) 100K clean Tug processing, PCR mate option;
4) Factory clean Tug processing, spacecraft mate in separateintegration facility;
5) Factory clean Tug processing, single security area for DODpayloads;
6) Factory clean Tug processing in joint IUS/Tug facility;
7) Factory clean Tug processing, separate IUS and Tug facilities.
4.0 Operations Philosophy
In all seven options, there are three common considerations thatimpact the ground operations philosophy.
1) DOD is responsible for IUS development and procurement;
2) NASA is responsible for Tug development and procurement;
3) NASA is responsible for kick stage development and procurement.
These considerations affect ground operation in that the agencyresponsible for development and procurement of the stage is alsoresponsible for the procurement, provisioning, and inventory manage-ment of flight vehicle spares, the GSE and GSE spares, GSE maintenance,the logistics system, crew training and certification, checkoutprocedure preparation, revision and update, GSE and checkout softwarepreparation and update. These factors, plus the DOD security require-ments, have been included in the evaluation and reduction of theapproaches considered to the seven options selected to be furtherdiscussed.

A cost summary of these seven options are shown in Table 1. Detaileddescription and technical assessment and comparison of each optionis shown in Subplan D, Volume II, Part I.
The operations phase manpower is held at a constant level to supportthe program. Fluxuations in cost is driven by spares and propellantusage rates which are related to launch rates. The average cost perflight is developed from the cost of the operations phase only anddoes not include the vehicle cost nor mission operations cost.
B. WORK BREAKDOWN STRUCTURE
The Space Tug Ground Operations Study Work Breakdown Structure (WBS)is derived from a WBS used for the Space Tug Systems Study. Itprovides the framework for structuring the various technical plans,operational schedules, cost and manpower estimates for the DDT&Eand operations phases.
Figures 2 and 3 display the WBS Identification Number Sequence.This numbering sequence is consistent with the established TugProgram WBS levels throughout; however, between Level 3 and Level 4a Project Function (PF) designator is added to present the separatecosts for Tug Fleet Utilization Project Management and Ground andLaunch Operations at ETR and WTR. This change in structure from theoriginal study WBS presents the data under the same WBS numbers.However, data cannot be directly correlated to the earlier study results.
Definitions for each element displayed in the WBS are found in thedictionary in Section IV.
C. SELECTED OPTION FACILITY, GSE AND MANPOWER REQUIREMENTS
1.0 Facility and GSE
The trade study of the various options for processing involved thelisting of all facility modifications and additions. The costs of themodification were estimated by construction estimating personnelfamiliar with the Eastern Test Range facilities current status andfuture plans for development. The lists of ground support equipmentfor Tug, IUS and Kick Stage processing were developed and costsestimated on each individual item when it was practical to do so.The quantities of the individual GSE items were assigned to theoptions and the results are shown in Table 1. The costs were furthersummarized to show the cost of the various GSE and facilities.The "other facilities" are not vehicle unique and are launch pad mods,warehouse and orbiter processing facility costs. Figure 4 depictsthe IUS, Tug and Kick Stage flight hardware flow for this option.Upon return from a mission, the Tug is removed from the Orbiter andis separated from the spacecraft in the OPF. The Tug is moved to theTPF where it undergoes refurbishment and checkout in the as-receivedcondition in a factory clean area. For IUS missions, a new IUS fromthe manufacturer or storage will be moved to the TPF for checkout.
4

Table 1 Summary, Option Trade Studies
Option Option Option . Option Option Option OptionDESCRIPTION I II III IV V VI VII
DOLLARS IN THOUSANDS $ $ $ $ $ $ $
Tug Avionics 3,048 1,853 2,038 2,038 2,038 1,853 1,853Tug Handling & Transportation 7,751 5,061.5 4,833 4,563 4,311.5 3,978 3,978Propulsion & Mech. GSE (Tug) 2,489. 1,586 1,626 1,626 1,626 1,536 1,536
Tug Facility Mods (SAEF) 1,314.7 1,134.7 1,134.7 330 .280 0 0" " " (VAB) 0 0 0 375 1,375 1,375 1,375
Structural (GSE) 240 120 120 120 120 120 120Secure Area 50 90 50 30 20 30 15L.P.S. Terminal 4,650 4,650 4,650 9,900 4,450 4,450 4,650IUS Facilities (SAEF & VAB) 297.5 270.6 270.6 60 453.3 60 60Kick Stage (GSE "H") 1,550 1,290 1,290 1,280 1,290 1,290 1,290Avionics "A" 936 936 936 936 936 936 936Propulsion & Mech. 576 576 576 576 576 576 576Engine Area Facility 92.5 92.5 92.5 50 50 50 50Warehouse & Roads 270.5 270.5 270.5 270.5 270.5 270.5 270.5
IUS Unique GSE 20 200 200 200 200 0 0SLaunch Pad Mods 78. 78 156 78 78 78 78
Orbiter Processing Facility 217.5 217.5 217.5 217.5 217.5 217.5 217.5Payload Mate IUS Facility 268.6
TOTAL 23,760.7 18,426.3 18,460.8 22,918.6 18,291.8 16 820 17 005
SUMMARY
Group 1 Tug Unique GSE 13,528 8,620.5 8,617 8,347 8,095.5 7,487 7,487" 2 Tug Facilities 6,107.2 5,967.2 5,927.2 10,685 6,175 5,905 6,090" 3 IUS Unique GSE 200, 200 200 200 200 0 0" 4 IUS Facilities 297.5 270.6 270.6 328.6 453.3 60 60" 5 Kick Stage GSE 3,062 2,802 2,802 2,792 2,802 2,802 2,802" 6 Other Fac. 566 566 644 566 566 566 566
I OPTION TOTAL 23,760.7 18,426.3 .18.460.8 22,918.6 18,291.8 16 820 17 005
C1Mi_

320
SPACE TUG PROJECT
LEVEL 3
32A
DDT&E
(GROUND OPERATIONS)
PROJECT 32A-1A 32A-1B32A-C
FUNCTIONS I TUG FLEET UTILIZATION/ J I GROUND & LAUNCH i GROUND & LAUNCHSPROJECT MANAGEMENT OPERATIONS -ETR OPERATIONS - WT _
32A-1A-01 32A-1A-02 32A-1A-05 32A-1A-15 32A-1B-01 32A-1B-06 32A-lB-07 32A-1C-01 32A-1C-06 32A-1C-07LEVEL 4 PROJECT SYSTEMS ENGR SITE FACILITIES | GROUND SUPPORT SITE FACILITIES | GROUND SUPPORT
MANAGEMENT & INTEGRATION LOGISTICS SOFTWARE MANAGEMENT - ETR E(ETR) QUIPMENT (ETR) MANAGEMENT - WTR (WTR) EQUIPMENT (WTR)
01 COST/PERFORM- -01 TUG SYSTEMS -01 TRANS PORTATION 03, GSE -02 PROJECT - 03 ETR MAINT 02 EAST TEST RAGE -02 PROJECT 05 WTR MAINT 03 WEST TEST RANGEANCE MGMT ENGINEERING & HANDLING MANAGEMENT & REFURBISH GSE MANAGEMENT & REFURB GSE
-02 PROJECT L 04 SUSTAINING 02 TRAINING 03 INFORMATION . 04 ETR LAUNCH - 03 INFORMATION 06 WTR LAUNCHx DIRECTION ENGINEERING MANAGEMENT MANAGEMENT
0-03 INVENTORY CONTROL -07 FACILITY 08 FACILITY03 INFORMATION & WAREHOUSING OPERATION SUPPORT OPERATION SUPPORT
MANAGEMENTMANAGEMENT 04 DEPOT MAINTENANCE
S04 FLEET UTILIZATION
SUBDIVISIONS OF WORK
ENGINEERING
MANUFACTURING
TEST
QUALITY & RELIABILITYASSURANCE
TOOLING & STE
MANAGEMENT/OTHER WORK BREAKDOWN STRUCTURE FOR THE TUG FLEET ANDGROUND OPERATIONS SCHEDULES AND CONTROLS STUDY
FIGURE 2 DDT&E WBS
FOLDOUT FRAME FOLDOUT F M FOLDOUT FRAME 7 and 8!_4 PlaeoPI~LIi~~p~ i '

320
SPACE TUG PROJECT
.LEVEL 3
320 I ORIGINAL PAGE ISOPERATIONS OF POOR QUALITY(GROUND)
o -r - r 1
32C-1A 32C-1B 32C-1CPROGECi r -
GR NLC
FUNCTIONS I TUG FLEET UTILIZATION/ GROUND& LAUNCH GROUND & AUNCH
FUNCTIOS PROJECT MANAGEMENT OPERATIONS - ETR OPERATIONS - WTR
3Cl- 32C 0 I I A-0 II0132C-1A-01 T32C-1A-02 3C-1A-05 32C-1A-15 32C-1B-01 32C-1B-06 32C-1B-07 32C-1B-10 32C-1B-14 32C-1C-01 32C-1C-06 320-10-07 32C-1C-09 32-1-13
MANAGEEN I & INTEGRATION LOGISTICS SOFTWARE MAiNAGEMENT - TR- (ETR) EQUIPMENT (ETR) ETR INTEGRATION - ETR MANAGEMEN - WTR (WTR) EQUIPMENT (WTR) WTR INTEGRATION - WTR
-01 COST/PERFORM- 04 SUSTAINING 01 TRANSPORTATION 03 GSE 02 PROJECT -- 03 ETR MAINT -. 02 EAST TEST 01 LAUNCH SITE "01 SCHEDULED .02 PROJECT 05 WTR MAINT 03 WEST TEST 01 LAUNCH SITE 01 SCHEDULED
S ANCE MG ENGINEERING & HANDLING MANAGEMENT & REFURBISH RANGE - GSE SERVICES/SUPP MAIN. & MANAGEMENT & REFURB RANGE - GSE SERVICES/SUPP MAINT AND
> 02 PROJECT 02 TRAINING 03 INFORMATION 04 ETR LAUNCH 02 TUG/SHUTTLE REFURBISH NFORMATION06 WTR02 TUG/SHUTREFURBISH
DIRECTION INVENTORYCONTROL MANAGEMENT MATING & C/O 02 UNSCHEDULED MANAGEMENT MATING&C/O 02 UNSCHEDULED03 I03 INVENTORY CONTROL 07 FACILITY U MANCGE
03 INFORMATION & WAREHOUSING OPERATION SUPPORT - 03 PRELAUNCH C/O I OPERATION SUPPORT. 03 PRELAUNCH C/O MAINT &03FURBEST
OPERATION SUPPORT -03
PRELAUNCH C/O
MANAGEMENT & COUNTDOWN & COUNTDOWN REFURBISHA E04 DEPOT MAINTENANCE 03 POST MAINT
S04 FLEET UTILIZATION 04 PROPELLANTS & CHECKOUT 04 PROPELLANTS CHECKOUTCHECKOUT HECKOUT
GASES & GASES
05 POST FLIGT 04TUG/SPACECRAFT05 POST FLIGHT 04 TUG/SPACECRAFT
SAFING MATING & C/OSAFING MATING & C/O
SUBDIVISIONS OF WORK I, 05 REFURBISHMENT 05 REFURBISHMENT
REQUIREMENTS REQUIREMENTS
ENGINEERINS PLANNING PLANNING
MANUFACTURING
TEST
QUALITY & RELIABILITY P GEASSURANCE ORIGINAL PAGE ISTOOLING & STE OF POOR QUALITYMANAGEMENT/OTHER WORK BREAKDOWN STRUCTURE FOR THE TUG FLEET AND
GROUND OPERATIONS SCHEDULES AND CONTROLS STUDY
FIGURE 3 OPERATIONS WBS
9 and 10
.,, FRAW E FOLDOUT ERAME
FOLFOOUT FRAME

WTR Tug
SPF . NASA and NN/DSpacecraft
NASA SpacecraftProcessing
NN/D Spacecraft All
Processing Payloads PCR/Pad--- PCR/Pad
TTug
NASA and NN/D Tu.
OLSpacecraft Tug ProcessingOLF (Uncleaned) IUS Propellant
IUS Processing DOD Spacecraft Loading
(Uncleaned) Payload to Orbiter
J IUS/Tug Cleaning MateKick Stage Mate Tug Propellant
S NASA, NN/D and LoadingDOD Spacecraft - - Countdown
to IUS/Tug Mate DOD Facilities Launch
Initial Safing Safe for Payload Classified Operations
Removal
SSeparate Tug.from Spacecraft DOD Spacecraft
DOD SpacecraftProcessing
Classified Operations
Figure 4 Factory Clean Processing in Joint IUS/Tug Processing Facility

The Tug is cleaned to be compatible with a 100K level after
completion of refurbishment, postmaintenance checkout and APS
propellant loading. The spacecraft (DOD, NASA, and NN/D), and
any Kick Stages required, are moved to the TPF and mated to the
IUS/Tug. Integrated testing is then performed, and the payload
is moved to the PCR/pad for Shuttle mate and prelaunch operations.
In the recommended option, all IUS and Tug processing is done in a
facility jointly occupied by NASA and DOD. Secure areas/cells will
be required for DOD operations in the TPF. The PCR/pad and OPF
will require the same security provisions as on other options.
Table 2 is a summary of facility and GSE requirements for this
option.
1.1 Facility - New and Modified
1.1.1 General - The new and modified facilities identified in this
study follow:
1) TPF - VAB low-bay - An existing building and support facilities
at KSC, modified to provide the Tug/IUS processing facility by:
a) Modifying two existing checkout cells for Tug processing,and two existing checkout cells for IUS processing. These
four cells are identified in Figure 5.
b) Modifying existing shop, lab, office, and storage areas
to support Tug and IUS processing.
2) Launch Complex 39A - The assumption is made that the PCR had
been constructed and in use for the IUS program, and that an
IUS-to-Orbiter insertion manipulator is in existence. The
principal modifications to LC39A to accommodate the full
Tug/Spacecraft/Kick Stage combination then become:
a) Modification/adjustment of PCR platforms to accommodate
Tug/spacecraft diameters and work stations;
b) Modification/adjustment of the PCR manipulator for the Tug
diameter and hard point locations;
c) Modification of existing LH2 and LO2 piping to interface
with new GSE Tug LH2/LO2 propellant loading units;
d) Addition/modification of LPS interfaces for Tug require-
ments;
e) Provision of electrical interfaces at the LCC for GSE
Tug monitoring and propellant loading consoles.
12

Table 2 Option 6 Facility and GSE Requirements
Pad/
Consideration TPF DOD PCR OPF KPF
Secure Area x x x x
LPS Terminal x x x x
Clean Area (Bldg) x
Airlock
Tug Unique GSE
Avionics x
Handling and Support x x
Propulsion and Mechanical x
Structural x
Tug Facilities
Engine Area . x
Avionics Area x
H2 Burn System c x x
02 Vent System x x
GSE Area x
APS Load System x
Portable Clean Room x
Kick Stage GSE
Avionics x
Handling and Transport x x
Propulsion and Mechanical x x
Kick Stage Facility
Buildup and Checkout Area x
Avionics Area x
GSE Area x
13
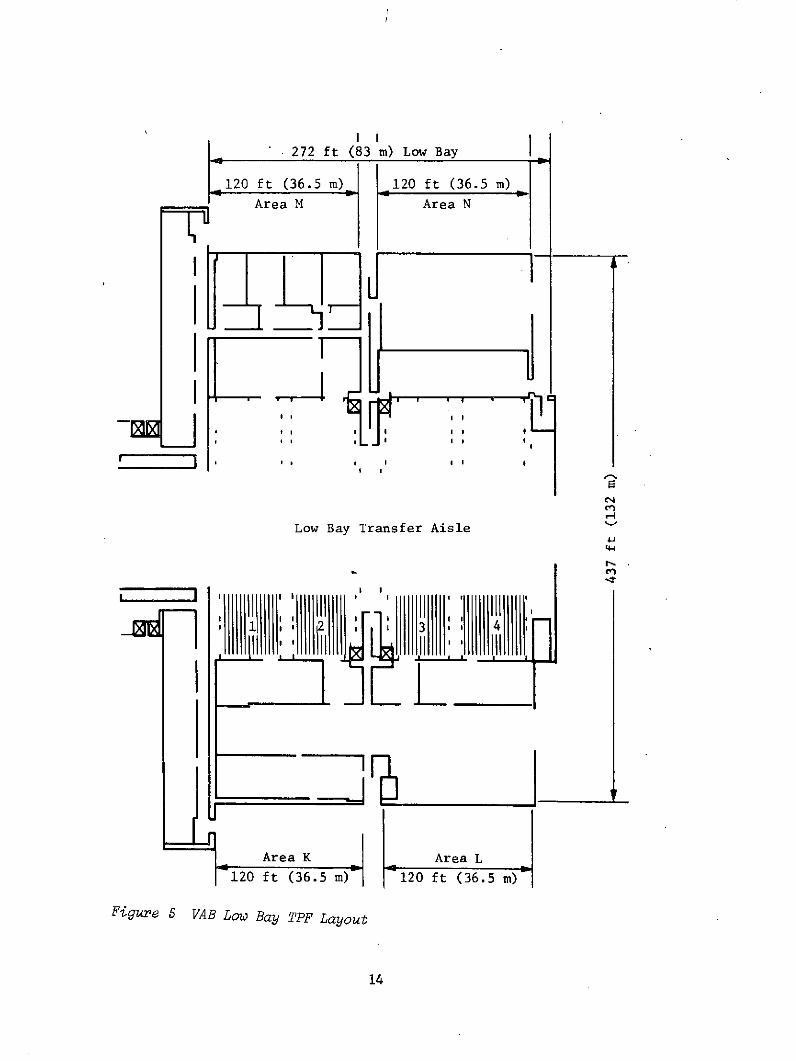
_ -272 ft (83 m) Low Bay
120 ft (36.5 m) 120 ft (36.5 m)
Area M Area N
I I
Low Bay Transfer Aisle
I I
L !
Area K Area L
120 ft (36.5 m) 120 ft (36.5 m)
Figure 5 VAB Low Bay TPF Layout
14

3) Kick Stage Processing Facility - An existing facility (to be
determined) for.processing the solid rocket motor kick stage.Facilities under consideration include:
a) Explosive Safe Area-60-A (CCAFS);
b) TIIIC SRM Facility (CCAFS).
Peculiar handling equipment would be provided as GSE. Existing
electrical/pneumatic sources would accommodate Kick Stage
requirements using GSE adapters.
4) Orbiter Processing Facility - The existing facility being
developed for Shuttle postflight processing should include
these Tug peculiar requirements, including:
a) An 8-ton (7260 kg) overhead crane capability;
b) 150 x 60 ft (48 x 18.2 m) floor area;
c) Storage and maintenance area;
d) Eye washes and showers;
e) Added/relocated electrical outlets and pneumaticconnections;
f) Office and crew space.
Tank purge, propellant disposal and Tug/spacecraft handlingequipment would be furnished as GSE.
5) Spacecraft Processing Facilities - Individual spacecraft require-
ments will determine any facility modification requirements to
the existing facilities at CKAFS and KSC where NASA and DOD
spacecraft are processed at present. These include buildingsAO, AM, AE, SAB (at CKAFS) and the O&C Building SAEF #1 andSAEF #2 (MILA Industrial Area). Additional facilities may be
required depending upon spacecraft launch rate and launchpreparation/checkout time.
6) WTR Facilities - With the Tug processing facility at ETR only,the new/modified WTR facilities required to support Tugoperations would include:
a). OPF - Modified to provide crane support, Tug-peculiarcommodities, office, crew, shop, and storage space;
15
b) PCU/PAD SLC-6 - Modified to provide propellant and
pneumatic interfaces for the GSE LH2 and LO loadingunits and LPS interfaces; platform modifica ions/adjust-ments for Tug diameter and working stations; modification/
adjustment of the PCR manipulator to accommodate Tug hard
points; addition of electrical interfaces in the Control
Center for Tug monitor and loading consoles;
c) Payload Processing Facility (PPR) - A facility modified
to accept Tug and Tug GSE for Tug/spacecraft integrated
checkout.
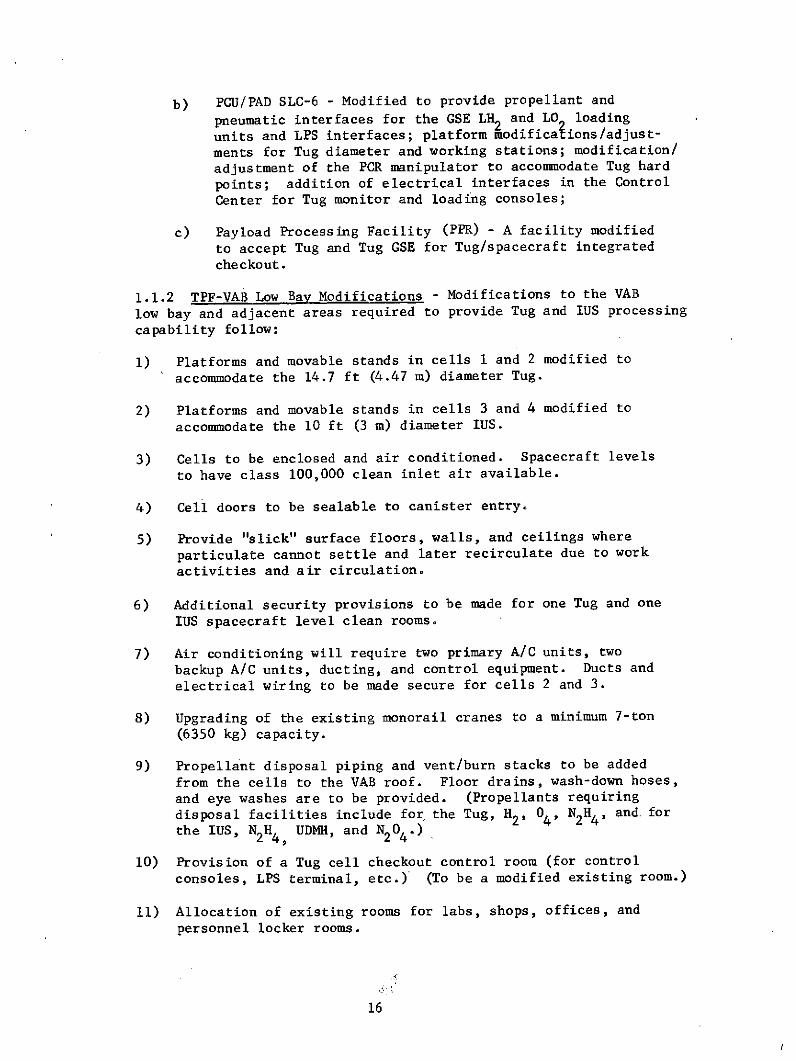
1.1.2 TPF-VAB Low Bay Modifications - Modifications to the VAB
low bay and adjacent areas required to provide Tug and IUS processingcapability follow:
1) Platforms and movable stands in cells 1 and 2 modified to
accommodate the 14.7 ft (4.47 m) diameter Tug.
2) Platforms and movable stands in cells 3 and 4 modified to
accommodate the 10 ft (3 m) diameter IUS.
3) Cells to be enclosed and air conditioned. Spacecraft levels
to have class 100,000 clean inlet air available.
4) Cell doors to be sealable to canister entry.
5) Provide "slick" surface floors, walls, and ceilings where
particulate cannot settle and later recirculate due to work
activities and air circulation.
6) Additional security provisions to be made for one Tug and one
IUS spacecraft level clean rooms.
7) Air conditioning will require two primary A/C units, two
backup A/C units, ducting, and control equipment. Ducts and
electrical wiring to be made secure for cells 2 and 3.
8) Upgrading of the existing monorail cranes to a minimum 7-ton
(6350 kg) capacity.
9) Propellant disposal piping and vent/burn stacks to be added
from the cells to the VAB roof. Floor drains, wash-down hoses,
and eye washes are to be provided. (Propellants requiring
disposal facilities include for the Tug, H2, 04, N2H , and. for
the IUS, N2H4, UDMH, and N2 04 .)
10) Provision of a Tug cell checkout control room (for control
consoles, LPS terminal, etc.) (To be a modified existing room.)
11) Allocation of existing rooms for labs, shops, offices, and
personnel locker rooms.
16

12) Modification of existing areas to provide environmentally
controlled bonded storage areas.
13) Blast barriers to be provided between adjacent cells.
Figure 6 shows a proposed layout of the VAB low bay cells 1 and 2
and the adjoining support areas to accommodate the Tug processing
facility requirements. Figure 7 shows cells 3 and 4, which would
be modified to accommodate IUS checkout facility requirements.
Figure 8 depicts a typical external view of the checkout cells
showing the door arrangement into the transfer aisle. Figure 9
presents a typical internal view of the checkout cells showing the
clean area locations.
1.1.3 Security Provisions - Additional security provisions will be
added to one Tug and one IUS cell at the spacecraft levels for use
during checkout of DOD spacecraft. Included in these provisions
will be the following:
1) Entry into the spacecraft clean room by authorized personnel
will be via an airlock at one level only. The airlock will
be constructed so that there is no direct line-of-sight into
the secure area from outside, and inner and outer doors will be
interlocked. A security guard will be posted at the entrance
to the airlock. All personnel will be logged in and out.
2) Equipment entry will be provided at one level via airlock. This
entry will normally be closed except when moving equipment and
will not be used for personnel entry.
3) Emergency exit doors will be provided at all work levels.
These doors will be made so they cannot be opened from the
outside.
4) Movement of personnel between levels will be by ladder or
stairway within the secure area.
5) A display panel will be provided at the guard station to
indicate when a door is open or closed.
6) Blue, revolving beacon lights will be provided to indicate
when a DOD spacecraft is in the secure area.
7) Wide-band rejection filters will be installed in all power and
lighting circuits entering the secure area.
8) All necessary openings into the area will be baffled to prevent
viewing and/or provided with steel bar grills to prevent
personnel entry (including inlet and outlet airconditioning
ducts).
17

Fuel Cell Battery Lab
Lab 300 ft 484 ft2
(29 m2 ) (45 m
2 )
LPS and ESE Checkout
2074 ft2
Bonded Cell 1(195 M2) Storage(195 m2) GSE 24511 ft
2 Dolly
60 ft (18.3 m) 565 ft2
(230 m2)
(53 m2 )
Avionics Lab1296 ft2
120 ft (36.6 m) (120 m2) BondedkoutStorage Cell 2
60 ft (18.3 m) 1673.6 ft2
I,(155 m 2) ii;:iiil
' I;'j ili'ii :iji ll:: l; :,!l ii
t !
Figure 6 VAB Low Bay Tug Processing Area
JC Wr
124 t2
4 ---"30 ft (9.15 in) (m2
,-;'CheckoutCell"3Dolly---
30 ft (9.15 m)4
120 ft
(36.6i )
30 ft(9.15) (282 m2
Checkout Cell 4 -4Dolly
30 ft(9.15 m)
-Upi-!-_-- i- i-
Figure 7 VAB Low Bay IUS Processing Area
ORIGINAL PAGE IS18 OF POOR QUALITY

Figure 8 VAB Low Bay Area K
I IL
Ships Ladder
Airlock and PassageWay Ladder to CleanArea
Key Plan
Figure 9 VAB Low Bay Cell Clean Area
ORIGINAL PAGE IS19 OF POOR QUALITy

9) There will be no direct view into the secure area from the lower
cell levels.
10) The opening at the bottom of the spacecraft will be sealed
with a boot that is provided with an R-F seal.
1.1.4 Tug Facility Requirements Specification Data Sheets - The
new/modified facilities requirements are described in detail in the
Tug Facility Requirements Specification Data Sheets contained in
Appendix D, Vol. II, Part III.
1.1.5 IUS Facility Requirements - The IUS checkout cell facilities
in the VAB low bay have been described previously. IUS facilityrequirements at the OPF, launch pad and other sites are outside
the scope of this study.
1.2 GSE
The new/modified operational GSE to be used during Tug site activation
will include:
1) Avionics checkout and monitoring equipment;
2) Handling, access, and transportation equipment;
3) Propulsion, pneumatic, and mechanical checkout and servicing
equipment;
4) Structural integrity inspection equipment.
The Tug GSE required is identified and described in detail in the
Tug GSE specification data sheets contained in Appendix B, Volume II,Part II, and summarized in Table 3.
1.3 Transportation Requirements and Support
1.3.1 Tug Canister/Transporter - The canister/transporter concept
developed in previous studies could be used on the Tug program.
Figure 10 shows one proposed concept.for this equipment. This canister/
transporter is not Tug unique and is not priced in the GSE costs.
Should the equipment final design evolve a universal canister/
transporter, then adaptation for Tug would involve only adjustment
of the internal mounting hard points to accommodate the Tug diameter
and hard point locations. If the universal concept proves impractical,
the basic requirements for Tug would be the following:
1) Capability of housing a 15.0 ft (4.57 m) diameter by 60 ft
(18.3 m) length payload that could consist of Tug/Kick Stage,spacecraft or other configurations in a vertical position;
20

Table 3 Ground Support Equipment Matrix
OPF TPF
A-003 Electrical Load BanksL x x
4J 01 U :1 J
W0Z0 0 W -H0
No! Nomenclature Avionics E
A-001 Electrical Power Supply x X! X X X
A-002 Electrical Power Test Set x x
A-003 Electrical Load Banks. x X
A-004 Battery Test Set xI
A-005 Battery Charger x x
A-006 Communication Test and i x xCheckout Equipment
A-007 Guidance and Navigation Test i x xand Checkout Equipment
A-008 Control and Data Acquisition x x x xConsole
A-009 Memory Load and Verify Unit x x x
A-010 Electronics Calibration xEquipment
A-011 Orbiter Cable Simulator x x
A-012 Umbilical Simulator x x
A-013 Star Sensor Simulator x x
A-014 Tug/Spacecraft Simulator x
A-015 Fuel Cell Dummy Load Unit x
A-016 Ordnance Event Verification x xCables
A-017 Latch Mechanism Test Set x
A-018 Hardware Interface Module (HIM),. x x
21

Table 3 (cont)
No. Handling and Transportation < i < M 0 on oH-001 Tug U Workstand x x x
H-002 Engine Workstand x
H-003 Deployment Adapter Workstand x x
H-004 Tug Transportatidn Dolly x x
!H-005 Cargo Bay Work Platform Set x x
IH-006 Internal Platform x x
;H-007 Deployment Adapter Dolly x
H-008 Deployment Adapter Protective xCover Kit
H-009 Spacecraft Adapter Transport/ I x xStorage Pallet
H-010 Kick Stage Protective Cover xKit
H-011 Kick Stage Motor Cradle x
H-012 Kick Stage Buildup/Checkout xFixture
H-013 Kick Stage SRM Storage Pallet x.:
H-014 Kick Stage Storage Pallet x
H-015 Tug Storage Pallet x
H-016 I Tug Fngine Handling Kit x
H-017 Deployment Adapter Storage xPallet
H-018 Handling Sling Kit x x x x x
H-019 Tug Protective Cover Kit ix x
H-020 Tug Desiccant Kit x
H-021 Battery Handling Kit x x x
H-022 Air Carry Tie Down Kit x x
H-023 Transport Data Recorder x
H-024 Tug Transtainer x x x x
H-025 Tug Lifting Rings x x x x
H-026 Inspection Workstands x x x x
H-027 Spacecraft Docking xSimulator
H-028 Kick Stage Transtainer x
H-029 Vertical Adapter x
H-030 Kick Stage Motor Support xFixture
22
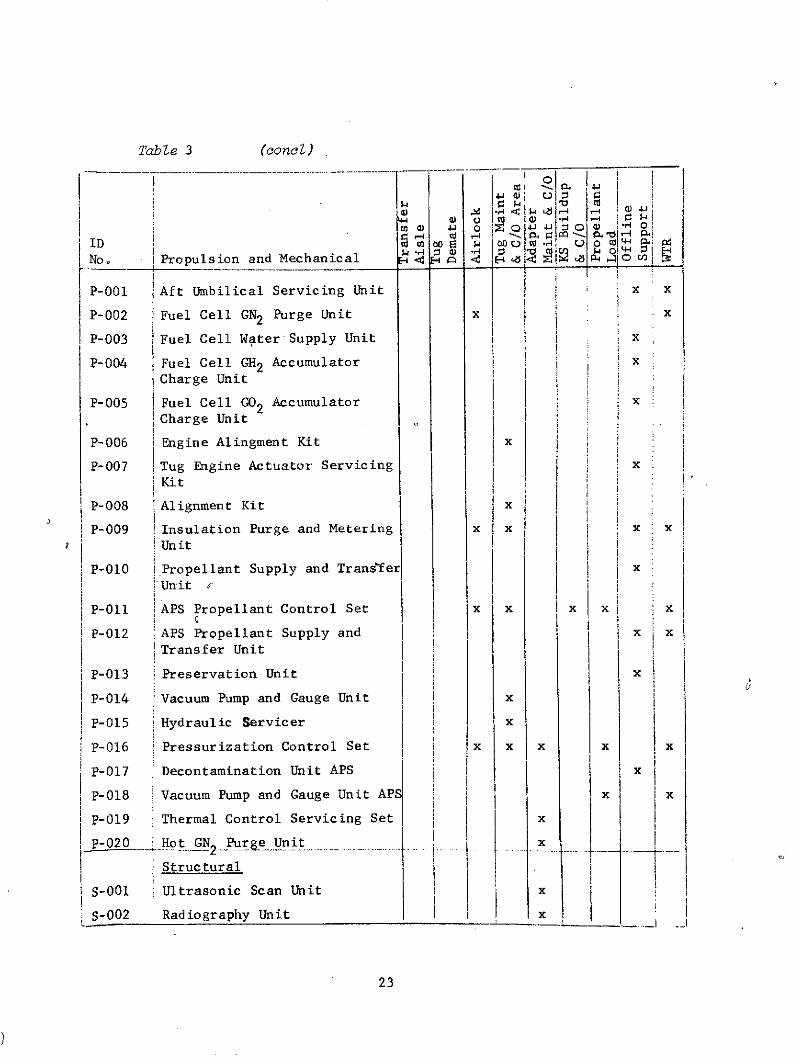
Table 3 (concZ)
ID s 4o -i
No. Propulsion and Mechanical i '
P-001 Aft Umbilical Servicing Unit x x
P-002 Fuel Cell GN2 Purge Unit x x
P-003 Fuel Cell Water Supply Unit x
P-004 Fuel Cell GH2 Accumulator x
Charge Unit
P-005 IFuel Cell GO2 Accumulator xCharge Unit
P-006 Engine Alingment Kit i x
P-007 Tug Engine Actuator Servicing xKit
P-008 Alignment Kit x
P-009 Insulation Purge and Metering x x x x
Unit
P-010 Propellant Supply and Transfer xUnit
P-011 APS Propellant Control Set Ix x x x x
P-012 APS Propellant Supply and x x
Transfer Unit
P-013 Preservation Unit x
P-014 Vacuum Pump and Gauge Unit x
P-015 Hydraulic Servicer x
P-016 Pressurization Control Set I x x x x x
P-017 Decontamination Unit APS x
P-018 Vacuum Pump and Gauge Unit AP x ;xP-019 Thermal Control Servicing Set x
P-020 Hot GN2 Purge Unit xr-- ---- - - 2 -- - --- - .------
Structural
S-001 Ultrasonic Scan Unit
S-002 Radiography Unit x
23

Approximately78 ft (23.8m)
rl Ji
Figure 10 Canister Transporter
2) Environmental control of the canister during transport;
3) Swing-open door entry and through-the-top access;
4) Capability of sealing the entrance against the TPF celldoor opening and at the PCRo
5) Self-leveling of the transporter during the ascent of thelaunch pad ramp at ETR.
1.3.2 Tug Transportation - The Tug peculiar transportation require-ments are described in detail in the GSE Requirement SpecificationData Sheets in Appendix B, Col. II, Part III. These requirementscan be summarized as follows:
1) A Tug transtainer for transport to and from the aircraft, withprovision for maintaining a clean environment when shippinga checked-out Tug from ETR to WTR;
2) A kick stage transtainer;
3) A spacecraft transport vehicle (provided as a spacecraft-peculiar requirement).
24

Transportation of the Tug and major ship-separate subassemblies from
the supplier to ETR will be by air, with the Tug horizontal. There
are no requirements for keeping the Tug vertical during transportation.
1.4 Site Activation and Verification
The principal activities identified with Tug design/construction
at ETR and WTR are shown in Figure 11. The following activities
are critical in achieving orderly activation and are considered
appropriate in the DDT&E cost estimates contained herein:
1) Facility criteria and design development;
2) Facility construction and validation;
3) GSE criteria and design development;
4) GSE construction and validation;
5) GSE installation and checkout;
6) Functional checkout of the facility and GSE using and engineer-
ing model Space Tug.
7) Checkout and launch of the first flight article.
Procedure
Long Lead Procurement
o go Pack and Ship
GSE FabricationGSE Criteria GSE Design \ Iaoi
GSE
SAcceptances \To Engineering
Program > VerificationRequirementae GSE Installation SoW and Det aode
Design Material Procedure
Long-Lead GSE Installation
Facility Facility Procurement and Checkout
Criteria Design TP (ETR Only)
LPad
Facility Construction and Validation
TPF (ETR Only)OPP
Long Lead Procurement
SteelAluminumPipeWireHardware
Figure 11 Design Construction Flow, Site Activation
ORIGINAL PAGE IS
OF POOR QUALITY
25

The functional flow diagram shown in Figure III-D-31, Vol. II,Part I, shows in detail the sequence and interrelationship ofthese activities.
2.0 Manpower Staffing
The Tug site activation phase can be divided as follows:
1) Planning, design, and construction;
2) Facility/GSE verification with a Tug engineering model;
3) Processing, checkout, and launch of the first flight article.
The manpower staffing during the activation period is based on therequirements through these phases, resulting in gradual buildupfrom a skeleton force to a full operational crew.
For purposes of organizational responsibility, the activation phaseessentially consists of a facility/GSE construction period and avehicle utilization period. The construction period covers activitiesfrom facility/GSE criteria development through construction, andvalidation of the facility/GSE installations. The proposedorganization during the construction period for ETR is shown inFigure 12. The manpower buildup during the transition to thevehicle utilization period will occur on completion of theconstruction/installation validation effort. It is anticipatedthat the transition will be smooth because personnel used in thefirst period will now have support functions in the second period.The proposed organization during the vehicle utilization period atETR is shown in Figure 13. The detailed manpower buildup during thisperiod (through launch of the first flight article) is shown inTables 4 and 5. It should be noted that the WTR launch crew isincluded in the total.
The construction phase milestones are shown in Figure 14. Constructionphase schedule are displayed in Figure 15. The 1983 schedule for theprocessing of the engineering model and the flight article at ETRis shown in Figure 16. These schedules were used to form the basisof manpower requirements for the DDT&E phase.
26

(64)
Ver fica..onnMnager
feputy Manger
(28) (7) (8) (3) (9)
Test L stc s acilitn Cefr o Qulity
Avionics Engineer Bonded Storage Tehni (2) Typist ayoad/onf uraton Quality En n
_____-- L---------
_________ _________-------
( f (7) (f (f (2())
Propulsion Engineer Shipping Technician (2) GSE Engineer (2) Eneineer Inspetr (iftrucura hancal/ L Cib Attende (2) Avionics Engineer (2) rogr r re - - fey Engine
Therofi Engineer --- - - - - - ------ /in Engineer EngineerAvinics Tehnician (4) 1rcuril/nchglcal/Propulsion Technician (4) -er l EngineerStructural/Mechanical/ GSE Technician (2)
Therl Technician (8) Cere Operations (2)Sety Suit Technicit (2)
Paint She Technicia
Figure 12 ETR Site Activation, Construction Crew Size
(107)
VerificationManager
Deputy Manager Secretary
(20) (17) (11) (52) (4)
Chief Chief Chief Chief ChiefFacility Test Quality Test
Support Engineering Control Operations Safety
Facility Supervisor -Typist Quality Engineer (2) Test Conductor (3) safetyGSE Engineer (3) Avionics Engineer (3) Inspectors (8) Avionics Engineer (6) Engineer (3)Bonded Storage Technician (2) Propulsion Engineer (2) Propulsion Engineer (6)Shipping Technician (2) - Structural/Mechanical/ Structural/Mechanical/GSE Technicians (4) Thermal Engineer (2) Thermal Engineer (3)Crane Operators (2) - Configuration Control Avionics Technician (10)Paint Shop Technician Engineer (2) Propulsion Technician (13)Safety Technicians (2) Logistics Engineer(2) Structural/Mechanical/Tool Crib Attendant (2) Payload Configuration Thermal Technician (10)
EngineerProgrammer/SoftwareEngineer (2)
Administrator/Scheduler
Figure 13 ETR Launch Site Operations Crew Size
27 ORIGINAL PAGE ISOF POOR QUALIT1

1980 1981 1982
Description J F M A M J J A S O N D J F M A M J J A S O N D J F M A M . J A S 0 N D
Activation Chief 1 1 1 1 1 1 1 1 1 1 1 1 1 1 1 1 1 1 1 1 1 1 1 1 1 1 1 1 1 1 1 1 1 1 1 1
Administration/Scheduler 1 1 1 1 1 1 1 1 1 1i. 1 1 1 1 11 1 1 1 1 1 1 1 1 1 1 1 1 1 1 1 1 1 1 1 1
Secretary/Typist 1 1 1 1 1 1 2 2 2 2 2 2 2 2 2 2 2 2 2 2 2 2 2 2 2 2 2 2 2 2 2 2 2 2 2 2
Facility Supervisor 1 1 1 1 1 1 1 1 1 1 1 1 1 1 1 1 1 1 1 1 1 1 1 1 1 1 1 1 1 1 1 1 1 1 1 1
Engineers 2 2 2 2 2 2 4 4 4 4 4 6 6 6 6 6 6 6 6 6 6 6 6 6 6 6 6 6 6 6 6 6 6 6 6 6
Test Conductor 1 1 1 1 1 1 1 1 1 1 1 1 1 1 1 1 1 1 2 2 2 2 2 2 2 2 2 2 2 2
Engineers 1 1 1 1 1 1 1 1 1 1 1 1 2 2 2 3 3 3 3 3 3 3 3 3 3 3 3 3 3 3
Technicians 2 2 2 3 3 3 11 11 11 22 22 22 23 23 23 23 23 23
Logistics Engineer 1 1 1 1 1 1 1 1 1 1 1 1 1 1 1 1 1 1 1 1 1 1 1 1 1 1 1 1 1 1 1 1 1 1 1 1
Technicians 1 1 1 1 1 2 2 2 2 2 2 2 4 4 4 4 4 4 5 5 5 6 6 6 6 6 6 6 6 6
Configuration Engineer 1 1 1 1 1 1 1 1 1 1 1 1 1 1 1 1 1 1 1 1 1 1 1 1 1 1 1 1 1 1 1 1 1 1 1 1
Engineers 1 1 1 1 1 11 1 1 1 1 1 2 2 2 2 2 2 222222222222
Quality Control Chief 1 1 1 1 1 1 1 1 1 1 1 1 1 1 1 1 1 1 1 1 1 1 1 1 1 1 1 1 1 1 1 1 1 1 1 1
Engineers 1 1 1 2 2 2 2 2 2 2 2 2 2 2 2 3 3 3 3 3 3 3 3 3 3 3 3 3 3 3 3 3 3
Inspectors 1 11 1 1 2 2 2 2 2 2 2 4 4 4 4 4 4 5 5 5 6 6 6 6 6 6 6 6 6
Subtotal 9 9 9 10 10 10 19 19 19 19 19 23 23 23 23 23 23 23 32 32 32 34 34 34 45 45 45 58 58 58 59 59 59 59 59 59
Verification Manager 1 1 1 1 1 1 1 1 1 1 1 1 1 1 1 1 1 1 1 1 1 1 1 1 1 1 1 1 1 1 1 1 1 1 1 1
Deputy Manager 1 1 1 111 1 1 1 1 1 1 1 1 1 .1 1 1 1 1 1 1 1 1 111
Chief Test Operations 1 1 1 1 1 1 1 1 1 11 1
Chief Test Engineering 1 1 1 1 1 1 1 1 1 1 1 11 1 1 1 1 1 1 1 1 1 1 1 1
Chief Safety 1 1 1 1 1 1 1 1 1 1 1 1
Subtotal 1 1 1 1 1 1 1 1 1 1 1 3 3 3 3 3 3 3 3 3 3 3 3 35 5 5 5 5 5 5 5 5 5 5 5
Total 10 10 10 11 11 11 20 20 20 20 20 26 26 26 26 26 26 26 35 35 35 37 37 37 50 50 50 63 63 63 64 64 64 64 64 64
TabZe 4 ETR Site Activation, Construction Period

Manpower Control
1982 1983
Description J F M A M J J A S O N D J F M A M J J A S O N t)
Verification Manager 1 1 1 1 1 11 1 I 1 1 1.
Deputy Manager 1 1 1 1 1 1 1 1 1 1 1 1
Secretary/Typist 2 2 2 2 2 2 2 2 2 2 2 2
Chief Facility Support 1 1 1 1 1 1 1 1 1 1 1
Facility Supervisor 1 1 1 1 1 1 1 1 1 1 1 1
Engineers 2 2 2 2 2 2 2 3 3 3 3 3
Technicians 13 13 13 13 13 13 13 15 15 15 15 15
Chief Test Engineering 1 1 1 1 1 1 1 1 1 1 1 1
Engineers 7 7 7 7 7 7 7 14 14 14 14 14
Administrator/Scheduler 1 1 1 1 1 1 1 1 1 1 1 1
Chief Quality Control 1 1 1 1 1 1 1 1 1 1 1 1
Quality Engineers 2 2 2 2 2 2 2 2 2 2 2 2-
Inspectors 6 6 6 6 6 6 6 8 8 8 8 8
Chief Test Operations 1 1 1 1 1 1 1 1 1 1 1 1
Test Conductor 2 2 2 2 2 2 2 3 3 3 3 3
Engineers 4 4 4 4 4 4 4 4 4 4 4 4 8 11 11 11 11 11 11 15 15 15 15 15
Technicians 16 24 24 24 24 24 24 33 33 33 33 33
Chief Safety 1 1 1 1 11 1 1 1 1 1 1
Safety Engineers 1 2 2 2 2 2 2 3 3 3 3 3
Total 4 4 4 4 4 4 4 4 4 4 4 4 68 80 80 80 0 800 80 107 107 107 107 107
Table 5 ETR Site Activation, Engineering Model and First Flight Article

1980 1981 19821 2 3 4 1 2 3 4 1 2 3 4
V Program Requirements
V A&E Selection
V Facility Contractor Selection
V JODIDOD
V GSE Contractor Selection
V Pack & Ship GSE
V Long Lead Materials
Selection Subcontractor V
Material Available V
GSE Available V
GSE Inst'l Complete V
GSE Checkout CompleteFigure 14 Construction Phase Milestones
1980 1981 19821 2 3 4 1 3 4 1 2 3 4
Facility Criteria DevelopmentFacility A&E Design
Facility ConstructionFacility Procedure Prep.
Facility ValidationGSE Criteria Development
GSE DesignGSE ManufacturingGSE Procedure Prep.
- GSE Acceptance TestGSE Installation Design-Statement of Work
Detail MaterialGSE Installation
Installation Procedure Prep.iGSE Installation Checkout
Figure 15 Construction Phase ScheduZe
30

1983
Feb Mar Apr May Jun Jul Aug Sep Oct Nov Dec
Prep for Fli ht Article
ATP - Operations
10 1 Receive, Transport, Purge, Clean, Install in Cell #1
m io Complete EM Pre-Mate CIO
Tug CIO
Receive Operational SpacecraftI
Mate & CIO DummylOperational SpacecraftI II APS Loading & Pressurization a
I IInsert EM or Tug/SC in Canister & Move to Launch Pad -
Sm Install EM or TugISC in PCR& Insert in OrbiterI I I
im EM in Orbiter CIO Tug CIO, Countdown, Load Prop. & Press. -I I
*l Load & Unload EM Cryo Tanks, Purge & Safe Tug Launch AIOC
n 1Return EM to TPF & Demate SCI I I
m Fitcheck EM in CIO Cell #2I
I i Resolve Problems With EMI I
Prep., Pack & Ship EM to VAFB
Engineering Model . - First Flight Article
Possible IUSlOrbiter Program Conflict"
Figure 16 Engineering Model and First Flight Article Schedule

II DDT&E LAUNCH SITE ACTIVATION -TIMELINE FUNDING
II. DDT&E TUG LAUNCH SITE ACTIVAT'ION - TIMELINE FUNDING------------------------------------------------------------------
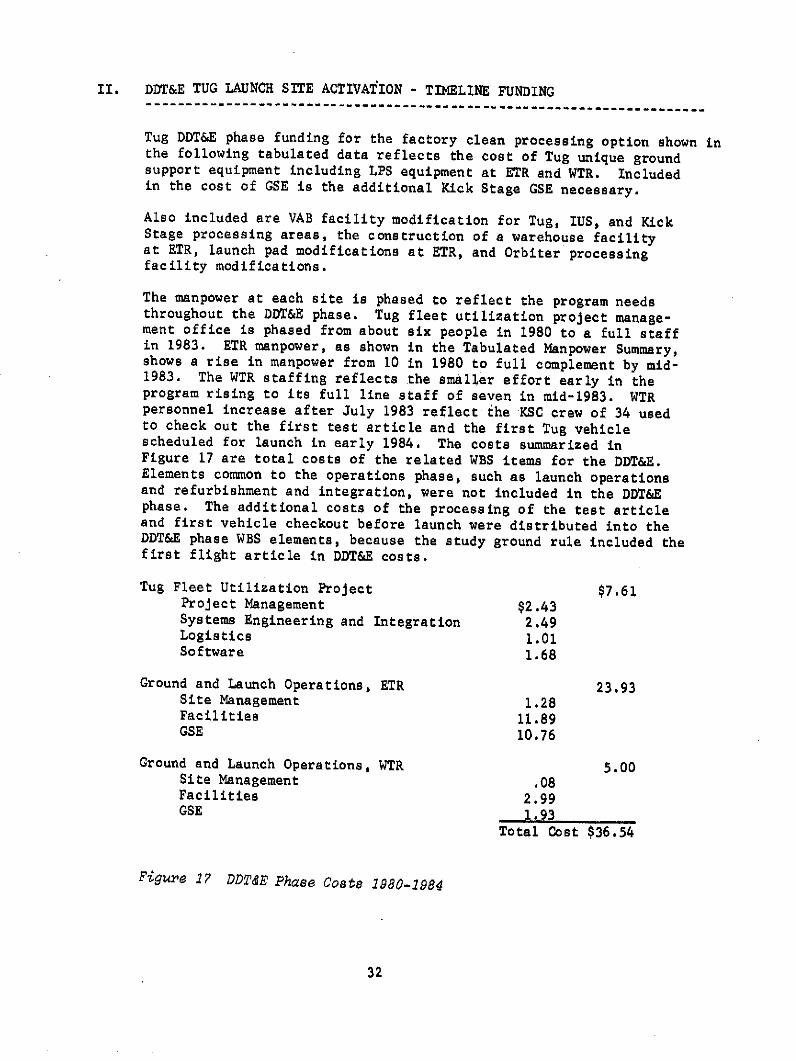
Tug DDT&E phase funding for the factory clean processing option shown inthe following tabulated data reflects the cost of Tug unique groundsupport equipment including LPS equipment at ETR and WTR. Includedin the cost of GSE is the additional Kick Stage GSE necessary.
Also included are VAB facility modification for Tug, IUS, and KickStage processing areas, the construction of a warehouse facilityat ETR, launch pad modifications at ETR, and Orbiter processingfacility modifications.
The manpower at each site is phased to reflect the program needsthroughout the DDT&E phase. Tug fleet utilization project manage-ment office is phased from about six people in 1980 to a full staffin 1983. ETR manpower, as shown in the Tabulated Manpower Summary,shows a rise in manpower from 10 in 1980 to full complement by mid-1983. The WTR staffing reflects the smaller effort early in theprogram rising to its full line staff of seven in mid-1983. WTRpersonnel increase after July 1983 reflect the KSC crew of 34 usedto check out the first test article and the first Tug vehiclescheduled for launch in early 1984. The costs summarized inFigure 17 are total costs of the related WBS items for the DDT&E.Elements common to the operations phase, such as launch operationsand refurbishment and integration, were not included in the DDT&Ephase. The additional costs of the processing of the test articleand first vehicle checkout before launch were distributed into theDDT&E phase WBS elements, because the study ground rule included thefirst flight article in DDT&E costs.
Tug Fleet Utilization Project $7.61Project Management $2.43Systems Engineering and Integration 2.49Logistics 1.01Software 1.68
Ground and Launch Operations, ETR 23.93Site Management 1.28Facilities 11.89GSE 10.76
Ground and Launch Operations, WTR 5.00Site Management .08Facilities 2.99GSE 1.93
Total Cost $36.54
Figure 17 DDT&E Phase Costa 1980-1984
32

A summary of the DDT&E time line funding is shown in Table 6.Detailed information is contained in the tabulated data in thissection.
Table 6 Ground DDT&E Timeline Funding
Function 1980 1981 1982 1983 Total
Fleet Utilization 0.26 0.50 2.07 I 4.78 7.61Project Management
Ground and Launch 0.62 1.19 2.47 19.67 23.95Operations, ETR
Ground and Launch -- 0.50 2.52 1.96 4.98
Operations, WTR
DDT&E Phase Total 0.88 2.19 7.06 26.41 36.54
The data shown on the following tabulated formats shows the DDT&Ecost at the WBS levels shown in Figure 2. The costs are shown ona monthly basis and breakout the manpower from equipment costsand show the manpower time phasing and its effect on the cost of DDT&E.Detailed definitions of the WBS items are found in the dictionary inSection IV.
33

DDT&E - Total Cost Summary By WBS Element
DT - .Ttlcst umr

DDTEE - TUG LAUNCH SITE ACTIVATION732-ROOTOTAL COST SUMMARY BY WBS ELEMENT
WBS ELEMENT DESCRIPTION TOTAL
2A DDT&E (GROUND OPERATIONS) $. 36,541,776
2A.1A TUG FLEET UTILIZATION/PROJECT MGMT 7,604,216
2A.1A.01 PROJECT MANAGEMENT 2,425,764
2A.IA.01.01 COST/PERFORMANCE MANAGEMENT 568,224
2A.IA.01.02 PROJECT DIRECTION 524,448
2A.1A.01.03 INFORMATION MANAGEMENT 502,656
2A.1A.01.04 FLEET UTILIZATION 830,436
2A.1A.02 SYSTEMS ENGINEERING E INTEGRATION 2,491,296
2A.IA.02.01 TUG SYSTEMS ENGINEERING 480,768
2A.1A.02.04 SUSTAINING ENGINEERING 2,010,528
2A.lA.05 LOGISTICS 1,005,264
2A.IA.05.02 TRAINING 699,312
2A.IA.05.03 INVENTORY CONTROL E WAREHOUSING 262,248
2A.1A.05.04 DEPOT MAINTENANCE 43,704
2A.IA.15 SOFTWARE 1,681,892
2A.1A.15.03 GSE SOFTWARE 1,681,892
2A.1B GROUND E LAUNCH OPERATIONS - ETR 23,944,576
2A.1B.01 SITE MANAGEMENT (FTR) 1,284,071
2A.1B.01.02 PROJECT MANAGEMENT 1,166,226
2A.1B.01.03 INFORMATION MANAGEMENT 117,845
2A.1B.06 FACILITIES - ETR 11,896,730

DDTEE - TUG LAUNCH SITE ACTIVATION
732-R00TOTAL COST SUMMARY BY WBS ELEMENT
;WBS ELEMENT DESCFIPTION TOTAL
2A.1B.06.03 ETR MAINTENANCE t REFURBISHMENT $ 11,818730
2A.18.06.04 ETR LAUNCH 78,000
2A.IF.07 GROUND SUPPORT EQUIPMENT - FTR 10,763,775
2A.1B.07.02 EASTERN TEST RANGE GSE 10,763,775
2A.1C GROUND & LAUNCH OPERATIONS - WTR 4,992,984
2A.1C.01 SITE MANAGEMENT (WTR) 75,756
2A.IC.01.02 PROJECT MANAGEMENT 37,878
2A.1C.01.03 INFORMATION MANAGEMENT 37,676
2A.IC.06 FACILITIES - WTR 2,991,304
2A.IC.06.05 WTR MAINTENANCE E REFURBISHMENT 2,972,380
2A.1C.06.08 FACILITY OPERATIONS SUPPORT 18,924
2A.IC.07 CROUND SUPPORT EQUIPMENT - WTR 1,925,924
2A.1C.07.03 WESTERN TEST RANGE GSE 1,925,924
PROPOSAL TOTAL S 36,541,776
pt

DDT&E - DDT&E Total Cost By Month
By Month

DDTEE - TUG LAUNCH SITE ACTIVATION732-R00DDTEE TOTAL COST BY MONTH
MAN MAN LABOR OVERHEAD MATL/S/C OTHER DIR TOTAL CUMULATIVEMO/YR MONTHS HOURS COST COST COST CHARGES GFE M & A AMOUNT AMOUNT
01/80 15.6 29558 22,589 26,979 279 12,963 1,763 64,573 64,57302/80 15.6 2,558 22,589 26,979 279 2,403 52,250 116,82303/80 15.6 2,558 22,589 26,979 279 2,403 52,250 169,07304/80 16.6 2,722 23,912 28,648 306 2,569 55,435 224,50805/80 16.6 2,722 23,912 28,648 306 2,569 55,435 279,94306/80 16.6 2,722 23,912 28,648 306 2,569 55,435 335,37807/80 26.6 4,362 37,147 45,338 585 4,229 87,299 422,67708/80 26.6 4,362 37,147 45,338 585 4,229 87,299 509,97609/80 26.6 4,362 37,147 45,338 585 4,229 87,299 597,27510/80 26.6 4,362 37,147 45,338 585 4,229 87,299 684.57411/80 26.6 4,362 37,147 45,338 585 4,229 87,299 771,87312/80 31.6 5,182 43,764 53,685 725 5,058 103,232 875,105
TOTAL 261.2 42,832 369,002 447,256 5,405 51,679 1,763 875,105
01/81 37.1 6,084 52,955 63,795 500,725 16,349 1,763 635,587 1,510,69202/81 37.1 6,084 52,955 63,795 725 5,789 123,264 1,633,95603/81 37.1 6,084 52,955 63,795 725 5,789 123,264 1,757,22004/81 37.1 6,084 52,955 63,795 725 5,789 123,264 1,880,48405/81 37.1 6,084 52,955 63,795 725 5,789 123,264 2,003,74806/81 37.1 6,084 52,955 63,795 725 5,789 123,264 2,127,01207/81 46.1 7,560 64,866 78,816 976 7,283 151,941 2,278,95308/81 46.1 7,560 64,866 78,816 976 7,283 151,941 29430,89409/81 46.1 7,560 64,866 78,816 976 7,283 151,941 2,582,83510/81 48.1 7,868 67,513 82,153 1,032 7,615 158,313 2,741,14811/81 48.1 7,888 67,513 82,153 1,032 7,615 158,313 2.899,46112/81 50.1 8,216 70,160 85,488 1,088 7,946 164,682 3,064,143
TOTAL 507.2 83,176 717,514 869,012 510,430 90,319 1,763 2,189,038
01/82 101.1 16,580 150,174 176,703 2,381,506 25,777 1,763 2,735,923 5,800,06602/82 101.1 16,580 150,174 176,703 1,506 15,217 343,600 6,143,66603/82 101.1 16,580 150,174 176,703 1,506 15,217 343,600 6,487,26604/82 114.1 18,712 167,379 198,401 1,869 17,375 385,024 6,872,29005/82 114.1 18,712 167,379 198,401 1,869 17,375 385,024 7,257,31406/82 114.1 18,712 167,379 198,401 1,869 17,375 385,024 7,642,33807/82 114.1 18,712 167,379 198,401 25,869 17,375 409,024 8,051,36208/82 116.1 19,040 170,026 201,741 25,924 17,708 415,399 8,466,76109/82 116.1 19,040 170,026 201,741 25,924 17,708 415.399 8,882,16010/82 116.1 19,040 170,026 201,741 25,924 17,708 415,399 9,297,55911/82 116.1 19,040 170,026 201,741 25,924 17,708 415,399 9,712,95812/82 116.1 19,040 170,026 201,741 25,924 17,708 415,399 10,128,357
TOTAL 1,340.2 219,788 1,970,168 2,332,418 2,545,614 214,251 1,763 7,064,214

DDTEE - TUG LAUNCH SITE ACTIVATION732-ROODDTEE TOTAL COST BY MONTH
MAN MAN LABOR OVERHEAD MATL/S/C OTHER DIR TOTAL CUMULATIVE
MO/YR MONTHS HOURS COST COST COST CHARGES GFE M & A AMOUNT AMOUNT
01/83 144.1 23,632 216,819 253,179 12,431,424 349,985 54,869 13,306,276 23,434,633
02/83 156.1 25,600 232,701 273,208 26,259 23,416 555,584 23,990,217
03/83 156.1 25,600 232,701 273,208 26,259 23,416 555,584 24,545,801
04/83 156.1 25,600 232,701 273,208 5,170,759 341,416 53,106 6,071,190 30,616,991
05/83 156.1 25,600 232,701 273,208 26,259 23,416 555,584 31,172,575
06/83 156.1 25,600 232,701 273,208 26,259 23,416 555,584 319728,159
07/83 162.1 26,584 240,641 283,038 2,427 342,412 53,106 921,624 32,649,783
08/83 185.1 30,356 271,081 381,422 3,068 83,718 739t289 33,389,072
09/83 185.1 30,356 271,081 354,045 3,068 58,830 16,751 703,775 34,092,847
10/83 185.1 30,356 271,081 354,045 3,068 376,830 53,106 1,058,130 35,150,977
11/83 185.1 30,356 271,081 354,045 3,068 58,830 687,024 35,838,001
12/83 185.1 30,356 271,081 354,045 3,068 58,830 16,751 703,775 36,541,776
TOTAL 2,012.2 329,996 2,976,370 3,699,859 17,724,986 1,764,515 33,502 214,187 26,413,419
PROP.TOTAL 4,120.8 675,792 6,033,054 7,348,545 20,786,435 2,120,764 33,502 219t476 36,541,776
-Y

DDT&E - Cost By Project Function By Year (WBS Level PF)
a (BS Levl

DDTEE - TUG LAUNCH SITE ACTIVATION732-R00COST BY PROJECT FUNCTION BY YEAR. (WBS LEVEL PF)
NO: 2A.1ANAME: TUG FLEET UTILIZATION/PROJECT MGMT
MAN MAN LABOR OVERHEAD MATL/S/C OTHER DIR TOTAL CUMULATIVEMO/YR MONTHS HOURS COST COST COST CHARGES GFE M & A AMOUNT AMOUNT
1980 67.2 11,016 112,248 123,468 19,488 1,763 256,967 256,9671981 133.2 21,840 222,540 244,788 28,260 1,763 497,351 754,3181982 565.2 92,688 944,484 1,038,936 85,644 1,763 2,070,827 2,825,1451983 901.2 147,792 1,506,000 1,656,612 1,402,272 214,187 4,779,071 7,604,216
NO: 2A.1BNAME: GROUND & LAUNCH OPERATIONS - ETR
1980 194.0 31,816 256,754 323,788 5,405 32,191 618,138 61891381981 374.0 61,336 494,974 624,224 10,430 62,059 1,191,687 1,809,8251982 775.0 127,100 1,025,684 1,293,482 21,614 128,607 2,469,387 4,279,2121983 893.0 146,452 1,181,859 1,490,421 16,844,902 148,182 19,665,364 23,944,576
NO: 2A.1CNAME: GROUND E LAUNCH OPERATIONS - WTR
1981 500,000 500,000 500,000oo 1982 2,524,000 2,524,000 3,024,000
1983 218.0 35,752 288,511.. 552,826 880,084 214,061 33,502 1,968,984 4,992,984PROP.TOTAL 4,120.8 675,792 69033,054 7,348,545 20,786,435 2,120,764 33,502 219,476 36,541,776

DDT&E - Cost By Project Function By Year (WBS Level 4)
By Ya S Leve*

DDT8E - TUG LAUNCH SITE ACTIVATION732-ROOCOST BY PROJECT FUNCTION BY YEAR(WBS LEVEL 4)
NO: 2A.1A.01NAME: PROJECT MANAGEMENT
MAN MAN LABOR OVERHEAD MATL/S/C OTHER DIR TOTAL CUMULATIVE
MO/YR MONTHS HOURS COST COST COST CHARGES GFE M & A AMOUNT AMOUNT
1980 66.0 10,824 110,292 121,320 8,772 240,384 240,384
1981 108.0 17,712 180,480 198,528 14,352 393,360 633,744
1982 204.0 33,456 340,920 375,024 27,096 743,040 1,376,784
1983 288.0 47,232 481,296 529,428 38,256 1,048,980 2,425,764
NO: 2A.1A.02NAME: SYSTEMS ENGINEERING E INTEGRATION
1981 24.0 3,936 40,104 44,112 3,192 87,408 87968
1982 264.0 43,296 441,180 485,292 35,076 961,548 1,048,956
1983 396.0 64,944 661,776 727,956 52,608 1,442,340 2,491,296
TASK NO: 2A.1A.05TASK NAME: LOGISTICS
1982 96.0 15,744 160,428 176,472 12,756 349,656 349,56
1983 180.0 29,520 300,804 330,888 23,916 655,608 1,005,264
NO: 2A.1A.15NAME: SOFTWARE
1980 1.2 192 1,956 2,148 10,716 1,763 16,583 16 3
1981 1.2 192 1,956 2,148 1 0,76 1,763 16,583 33,166
1982 1.2 192 1,956 2,1408 10716 1,763 16,583 49,749
1983 37.2 6,096 62,124 68,340 1,287,492 214,187 1,632,143 1,681,892
O-

DDTEE - TUG LAUNCH SITE ACTIVATION732-R00COST BY PROJECT FUNCTION BY YEARfIBS LEVEL 4)
NO: 2A.1B.01NAME: SITE MANAGEMENT (ETR)
MAN MAN LABOR OVERHEAD MATL/S/C. OTHER DIR TOTAL CUMULATIVEMO/YR MONTHS HOURS COST COST COST CHARGES GFE M & A AMOUNT AMOUNT
1980 79.0 12,956 104t553 131,856 2,200 13,114 251,723 251,7231981 96.0 15,744 127,044 160,212 2,676 15,936 305,868 55795911982 120.0 19,680 158,80e 200,280 3,348 19,920 382,356 939,9471983 108.0 17,712 142,932 180,252 3,012 17,928 344,124 1,284,071
NO: 2A.1B.06NAME: FACILITIES - ETR
1980 113.0 18,532 149,554 188,592 3,149 189745 360,040 360,0401981 252.0 41,328 333,519 420,597 7,026 41,808 802,950 1,162,9901982 597.0 97,908 790,113 996,402 16,647 99,066 1,902,228 3,065,2181983 722.0 118,408 955,549 1,205,029 6,551,131 119,803 8,831,512 11,896,730
NO: 2A.1B.07NAME: GROUND SUPPORT EQUIPMENT - ETR
•s 1980 2.0 328 2,647 3,340 56 332 6,375 6,375D 1981 26.0 4,264 34,411 43,415 728 4,315 82,869 899244
1982 58.0 9,512 76,763 96,800 1,619 9,621 184,803 274,0471983 63.0 10,332 83,378 105,140 10,290,759 10,451 10,489,728 10,763,775
NO: 2A.IC.01NAME: SITE MANAGEMENT (WTR)
1983 24.0 3,936 31,764 - 39,336 672 3,984 75,756 759756

DDT&E - TUG LAUNCH SITE ACTIVATION732-R00COST BY PROJECT FUNCTION BY YEAR WBS LEVEL 4
NO: 2A.1C.06NAME: FACILITIES - WTR
MAN MAN LABOR OVERHEAD MATL/S/C OTHER DIR TOTAL CUMULATIVEMO/YR MONTHS HOURS COST COST COST CHARGES GFE M&A AMOUNT AMOUNT
1981 500,000 500,000 500,0001982 761,000 761,000 1,261,0001983 188.0 30,832 248,809 503,668 735,244 209,081 33,502 1,730t304 2,991,304
NO: 2A.1C.07NAME: GROUND SUPPORT EQUIPMENT - WTR
1982 1,763,000 197639000 1976390001983 6.0 984 7,938 9,822 144,168 996 162,924 1,925,924PROP.TOTAL 4,120.8 675,792 6,033,054 7,348,545 20,786,435 2,120,764 33,502 219,476 36,541,776

DDT&E - Cost By Project Function By Month (WBS Level 5)

DDTE - TUG LAUNCH SITE ACTIVATION732-ROOCOST BY WBS BY PROJECT FUNCTION BY MONTH (WBS LEVEL 5)
NO: 2A.1A.01.01NAME: COST/PERFORMANCE MANAGEMENT
MAN MAN LABOR OVERHEAD MATL/S/C OTHER DIR TOTAL CUMULATIVEMO/YR MONTHS HOURS COST COST COST CHARGES GFE M&A AMOUNT AMOUNT
01/80 1.5 246 2,507 2,758 199 5,464 5,46402/80 1.5 246 2,507 2,758 199 5,464 10,92803/80 1.5 246 2,507 2,758 199 5,464 16,39204/80 1.5 246 2,507 2,758 199 59464 21,85605/80 1.5 246 2,507 2,758 199 5,464 27,32006/80 1.5 246 2,507 2,758 199 5,464 32,78407/80 1.5 246 2,507 2,758 199 5,464 38,24808/80 1.5 246 2,507 2,758 199 5,464 43,71209/80 1.5 246 2,507 2,758 199 5,464 49,17610/80 1.5 246 2,507 2,758 199 5,464 54,64011/80 1.5 246 2,507 2,758 199 5,464 60,10412/80 1.5 246 2,507 2,758 199 5,464 65,568
TOTAL 18.0 2,952 30,084 33,096 2,388 65,568
01/81 1.5 246 2,507 2,758 199 5,464 71,03202/81 1.5 246 2,507 2,758 199 5,464 76,49603/81 1.5 246 2,507 2,758 199 5,464 81,96004/81 1.5 246 2,507 2,758 199 5,464 87,424
05/81 1.5 246 2,507 2,758 199 5,464 92,88806/81 1.5 246 2,507 2,758 199 5,464 98,35207/81 1.5 246 2,507 2,758 199 5,464 103,81608/81 1.5 246 2,507 2,758 199 5,464 109,28009/81 1.5 246 2,507 2,758 199 5,464 114,744
10/81 1.5 246 2,507 2,758 199 5,464 120,20811181 1.5 246 2,507 2,758 199 5,464 125,67212/81 1.5 246 2,507 2,758 199 5,464 131,136
TOTAL 18.0 2,952 30,084 33,096 2,388 65,568
01/82 4.0 656 6,685 7,354 531 14,570 145,70602/82 4.0 656 6,685 7,354 531 14,570 160,27603/82 4.0 656 6,685 7,354 531 14,570 174,84604/82 4.0 656 6,685 7,354 531 14,570 189,41605/82 4.0 656 6,685 7,354 531 14,570 203,98606/82 4.0 656 6,685 7,354 531 14,570 218,55607/82 4.0 656 6,685 7,354 531 14,570 233,12608/82 4.0 656 6,685 7,354 531 14,570 2479696
09/82 4.0 656 6,685 7,354 531 14,570 262,26610/82 4.0 656 6,685 7,354 531 14,570 276,83611/82 4.0 656 6,685 7,354 531 14,570 291,40612/82 4.0 656 6,685 7,354 531 14,570 305,976
TOTAL 48.0 7,872 80,220 88,248 6,372 174,840

DDT&E - TUG LAUNCH SITE ACTIVATION732-R00COST BY WES BY PROJECT FUNCTION BY MONTH (BS LEVEL 5)
NO: 2A.1A.01.01NAME: COST/PERFORMANCE MANAGEMENT
MAN MAN LABOR OVERHEAD MATL/S/C. OTHER DIR TOTAL CUMULATIVEMO/YR MONTHS HOURS COST COST COST CHARGES GFE. M & A AMOUNT AMOUNT
01/83 6.0 984 10,027 11,030 797 219854 327,83002/83 6.0 984 10,027 11,030 797 21,854 349,68403/83 6.0 984 10,027 11,030 797 21,854 371,53804/83 6.0 984 10,027 11,030 797 21,854 393,39205/83 6.0 984 10,027 11,030 797 21,854 415t24606/83 6.0 984 10,027 11,030 797 21e854 437,10007/83 6.0 984 10,027 11,030 797 21,854 458,95408/83 6.0 984 10,027 11,030 797 21,854 480,80809/83 6.0 984 10,027 11,030 797 21,854 502,66210/83 6.0 984 10,027 11,030 797 219854 524,51611/83 6.0 984 10,027 11,030 797 21,854 546,37012/83 6.0 984 10,027 11,030 797 21v854 568,224
TOTAL 72.0 11,808 120,324 132,360 9,564 262,248
TASK NO: 2A.1A.01.02TASK NAME: PROJECT DIRECTION
01/80 3.0 492 5,013 5,514 399 10,926 10,92602/80 3.0 492 5,013 5,514 399 10,926 21,85203/80 3.0 492 5,013 5,514 399 10,926 32,77804/80 3.0 492 5,013 5,514 399 10,926 43,70405/80 3.0 492 5,013 5,514 399 10,926 54,63006/80 3.0 492 5,013 5,514 399 10,926 65,55607/80 3.0 492 5,013 5,514 399 10,926 76,48208/80 3.0 492 5,013 5,514 399 10,926 87,408,09/80 3.0 492 5,01.3 5,514 -39.9 10,926 98,33410/80 3.0 492 5,013 5,514 399 10,926 109,26011/80 3.0 492 5,013 5,514 :399 10,926 120,18612/80 3.0 492 5,013 5,514 .399 10,926 1319112
TOTAL 36.0 5,904 60,156 66,168 4,788 131,112

DDTEE - TUG LAUNCH SITE ACTIVATION732-R00COST BY WBS BY PROJECT FUNCTION BY MONTH (WBS LEVEL 5)
NO: 2A.1A.O1.02NAME: PROJECT DIRECTION
MAN MAN LABOR OVERHEAD MATL/S/C. OTHER DIR TOTAL CUMULATIVEMO/YR MONTHS HOURS COST COST COST CHARGES GFE M & A AMOUNT AMOUNT
01/81 3.0 492 5,013 5,514 399 10,926 142,03802/81 3.0 492 5,013 5,514 399 10926 152,96403/81 3.0 492 5,013 5,514 399 10t926 163,89004/81 3.0 492 5,013 5,514 399 10,926 174,81605/81 3.0 492 5,013 5,514 399 10t926 185,74206/81 3.0 492 5,013 5,514 399 10,926 196,66807/81 3.0 492 5,013 5,514 399 10,926 207,59408/81 3.0 492 5,013 5,514 399 10,926 218,52009/81 3.0 492 5,013 5,514 399 10,926 229,44610/81 3.0 492 5,013 5,514 399 10,926 240,37211/81 3.0 492 5,013 5,514 399 10,926 251929812/81 3.0 492 5,013 5,514 399 10,926 262,224
TOTAL 36.0 5,904 60,156 66,168 4,788 131,112
01/82 3.0 492 5,013 5,514 399 10,926 273,15002/82 3.0 492 5,013 5,514 399 10,926 284,07603/82 3.0 492 5,013 5,514 399 10926 295,00204/82 3.0 492 5,013 5,514 399 10,926 305t92805/82 3.0 492 5,013 5,514 399 10,926 3169854
06/82 3.0 492 5,013 5,514 399 10,926 327,78007/82 3.0 492 5,013 5,514 399 10,926 338,70608/82 3.0 492 5,013 5,514 399 10,926 349,63209/82 3.0 492 5,013 5,514 399 10,926 360,55810/82 3.0 492 5,013 5,514 399 10,926 371,48411/82 3.0 492 5,013 5,514 399 109926 382,41012/82 3.0 492 5,013 5,514 399 10,926 393,336
TOTAL 36.0 5,904 60,156 66,168 4,788 1319112
01/83 3.0 492 5,013 5,514 399 10,926 404,26202/83 3.0 492 5,013 5,514 399 10,926 415,18803/83 3.0 492 5,013 5,514 399 10,926 426911404/83 3.0 492 5,013 5,514 399 10,926 437,04005/83 3.0 492 5,013 5,514 399 10,926 447.96606/83 3.0 492 5,013 5,514 399 10,926 45689207/83 3.0 492 5,013 5,514 399 109926 469,81808/83 3.0 492 5,013 5,514 399 10,926 480,74409/83 3.0 492 5,013 5,514 399 10,926 491t67010/83 3.0 492 5,013 5,514 399 10,926 502,59611/83 3.0 492 5,013 5,514 399 10,926 513,52212/83 3.0 492 • 5,013 5,514 399 10,926 524,448
TOTAL 36.0 5,904 60,156 66,168 4,788 131,112

DDTEE - TUG LAUNCH SITE ACTIVATION732-ROOCOST BY WBS BY PROJECT FUNCTION BY MONTH (WBS LEVEL 5)
NO: 2A.1A.01.03NAME: INFORMATION MANAGEMENT
MAN MAN LABCR OVERHEAD MATL/S/C OTHER DIR TOTAL CUMULATIVEMO/YR MONTHS HOURS COST COST COST CHARGES GFE M & A AMOUNT AMOUNT
01/80 1.0 164 1,671 1,838 133 3,642 3,64202/80 1.0 164 1,671 1,838 133 3,642 7,28403/80 1.0 164 1,671 1,838 133 3t642 10,92604/80 1.0 164 1,671 1,838 133 3,642 14,56805/80 1.0 164 1,671 1,838 133 39642 18921006/80 1.0 164 1,671 1,838 133 3,642 21,85207/80 1.0 164 1,671 1,838 133 39642 25,49408/80 1.0 164 1,671 1,838 133 3,642 29,13609/80 1.0 164 1,671 1,838 133 3,642 32,77810/80 1.0 164 1,671 1,838 133 3,642 36,42011/80 1.0 164 1,671 1,838 133 3,642 40,06212/80 1.0 164 1,671 1,838 .133 3,642 439704
TOTAL 12.0 1,968 20,052 2?,056 1,596 43,704
01/81 2.5 410 4,178 4,596 332 9,106 52,81002/81 2.5 410 4,178 4,596 332 9,106 61,91603/81 2.5 410 4,178 4,596 332 9,106 71,02204/81 2.5 410 4,178 4,596 332 9,106 80,12805/81 2.5 410 4,178 4,596 332 9,106 89,23406/81 2.5 410 4,178 4,596 332 9,106 98,34007/81 2.5 410 4,178 4,596 332 9,106 107,44608/81 2.5 410 4,178 4,596 332 9,106 116,55209/81 2.5 410 4,178 4,596 332 9,106 125,65810/81 2.5 410 4,178 4,596 332 99106 134,76411/81 2.5 410 4,178 4,596 332 9,106 143,87012/81 2.5 410 4,178 4,596 332 9,106 152,976
TOTAL 30.0 4,920 50,136 55,152 3,984 109,272
01/82 4.0 656 6,685 7.354 531 14,570 167,54602/82 4.0 656 6,685 7354 531 14,570 182,11603/82 4.0 656 6,685 7,354 531 14,570 196,68604/82 4.0 656 6,685 7,354 531 14,570 211,25605/82 4.0 656 6,685 7,354 531 14T570 225,82606/82 4.0 656 6,685 7,354 531 14,570 240,39607/82 4.0 656 6,685 7,354 531 14,570 254,96608/82 4.0 656 6,685 7,354 531 14,570 269,53609/82 4.0 656 6,685 7,354 531 14,570 284,10610/82 4.0 656 6,685 7,354 531 14,570 298,67611/82 4.0 656 6,685 7,354 531 14,570 313,24612/82 4.0 656 6,685 7,354 531 14,570 327,816
TOTAL 48.0 7,872 80,220 88,248 6,372 174,840

DDTEF - TUG LAUNCH SITE ACTIVATION732-R 00COST BY WBS BY PROJECT FUNCTION BY MONTH (WBS LEVEL 5)-
NO: 2A.1A.01.03NAME: INFORMATION MANAGEMENT
MAN MAN LABOR OVERHEAD MATL/S/C OTHER DIR TOTAL CUMULATIVE
MO/YR MONTHS HOURS COST COST COST CHARGES GFE M & A AMOUNT AMOUNT
01/83 4.0 656 6,685 7,354 531 14,570 342.386
02/83 4.0 656 6,685 7,354 531 14,570 356,95603/83 4.0 656 6,685 7,354 531 14,570 3719526
04/83 4.0 656 6,6e5 7,354 531 14,570 3869096
05/83 4.0 656 6,685 7,354 531 14,570 400,66606/83 4.0 656 6,685 7,354 531 14,570 415,236
07/83 4.0 656 6,685 7,354 531 14,570 429,806
08/83 4.0 656 6,685 7,354 531 14,570 444,376
09/83 4.0 656 6,685 7,354 531 149570 4589946
10/83 4.0 656 6,685 7,354 531 14,570 473,516
11/83 4.0 656 6,685 7,354 531 14,570 4889086
12/83 4.0 656 6,685 7,354 .531 14570 502,656
TOTAL 48.0 7,872 80,220 88,248 6,372 174,840
TASK NO: 2A.1A.01.04TASK NAME: FLEET UTILIZATION
01/81 2.0 328 3,342 3,676 266 7,284 79284
02/81 2.0 328 3,342 3,676 266 7,284 14,56803/81 2.0 328 3,342 3,676 266 7,284 219852
04/81 2.0 328 3,342 3,676 266 7,284 299136
05/81 2.0 328 3,342 3,676 266 79284 36,420
06/81 2.0 328 3,342 3,676 266 7,284 43,704
07/81 2.0 328 3,342 3,676 266 7,284 50,988
08/81 2.0 328 3,342 3,676 266 7,284 58,272
09/81 2.0 328 3,342 3,676 266 7,284 659556
10/81 2.0 328 3,342 3,676 266 7,284 72,84011/81 2.0 328 3,342 3,676 266 7,284 80,12412/81 2.0 328 3,342 3,676 266 7,284 879408
TOTAL 24.0 3,936 40,104 44,112 3.192 87,408

DDTEE - TUG LAUNCH SITE ACTIVATION732-R00COST BY WBS BY PROJECT FUNCTION BY MONTH (WBS LEVEL 5)
0: 2A.1A.01.04NAME: FLEET UTILIZATION
MAN MAN LABOR OVERHEAD MATL/S/C OTHER DIR TOTAL CUMULATIVEMO/YR MONTHS HOURS COST COST COST CHARGES GFE M & A AMOUNT AMOUNT
01/82 6.0 984 10,027 11,030 797 21,854 109,26202/82 6.0 984 10,027 11,030 797 21,854 131t11603/82 6.0 984 10,027 11,030 797 21,854 152,97004/82 6.0 984 10,027 11,030 797 21,854 174,82405/82 6.0 984 10,027 11,030 797 21,854 196,67806/82 6.0 984 10,027 11,030 797 21,854 218,53207/82 6.0 984 10,027 11,030 797 219854 240,38608/82 6.0 984 10,027 11,030 797 21,854 262t24009/82 6.0 984 10,027 11,030 797 21,854 284,09410/82 6.0 984 10,027 11,030 797 21,854 305994811/82 6.0 984 10,027 11,030 797 21,854 327,80212/82 6.0 984 10,027 11,030 797 21,854 349,656
TOTAL 72.0 11,808 120,324 132,360 9,564 262,248
01/83 11.0 1,804 18,383 20,221 1,461 40,065 389,72102/83 11.0 1,804 18,383 20,221 1,461 40,065 429,78603/83 11.0 1,804 18,383 20,221 1,461 40,065 4699851
"J 04/83 11.0 1,804 168,383 20,221 1,461 40,065 509,91605/83 11.0 1,804 18,383 20,221 1,461 40,065 549,98106/83 11.0 1,804 18,383 20,221 1,461 40,065 590,04607/83 11.0 1,804 18,383 20,221 1,461 40,065 630t11108/83 11.0 1,804 18,383 20,221 1,461 40,065 670,17609/83 11.0 1,804 18,383 20,221 1,461 40,065 710,24110/83 11.0 1,804 18,383 20,221 1,461 40,065 750,30611/83 11.0 1,804 18,383 20,221 19461 40,065 790,37112/83 11.0 1,804 18,383 20,221 1,461 40,065 830,436
TOTAL 132.0 21,648 220,596 242,652 17,532 480,780

DDTE - TUG LAUNCH SITE ACTIVATION732-ROOCOST BY WBS BY PROJECT FUNCTION BY MONTH (WBS LEVEL 5)
NO: 2A.1A.02.01NAME: TUG SYSTEMS ENGINEERING
MAN MAN LABOR OVERHEAD IMATL/S/C. OTHER DIR TOTAL CUMULATIVEMO/YR MONTHS HOURS COST COST COST CHARGES GFE M & A AMOUNT AMOUNT
01/82 2.0 328 3,342 3,676 266 7,284 7928402/82 2.0 328 3,342 3,676 266 7,284 14,56803/82 2.0 328 3,342 3,676 266 7,284 21,85204/82 2.0 328 3,342 3,676 266 7,284 29,13605/82 2.0 328 3,342 3,676 266 7,284 36,42006/82 2.0 328 3,342 3,676 266 7,284 43,70407/82 2.0 328 3,342 3,676 266 7284 50,98808/82 2.0 328 3,342 3,676 266 7t284 58927209/82 2.0 328 3,342 3,676 266 7,284 65,55610/82 2.0 328 3,342 3,676 266 7,284 72,84011/82 2.0 328 3,342 3,676 266 7,284 80,12412/82 2.0 328 3,342 3.676 266 7,284 87,408
TOTAL 24.0 3,936 40,104 44,112 3,192 87,408
01/83 9.0 1,476 15,040 16,544 1,196 32,780 120,188.cX 02/83 9.0 1,476 15,040 16,544 1,196 32,780 152,968OO 03/83 9.0 1,476 159040 16,544 19196 32,780 185,748
04/83 9.0 1,476 15,040 16,544 1,196 32,780 218,52805/83 9.0 1,476 15,040 16,544 1,196 32,780 251,30806/83 9.0 1,476 15,040 16,544 1,196 32,780 284,08807/83 9.0 1,476 15,040 16,544 1,196 32,780 316,86808/83 9.0 1,476 15,040 16,544 1,196 32,780 349,64809/83 9.0 1,476 15,040 16,544 1,196 32,780 382,42810/83 9.0 1,476 15,040 16,544 1,196 32,780 415,20811/83 9.0 1,476 15,040 16,544 1,196 32,780 447,98812/83 9.0 1,476 15,040 16,544 1,196 32,780 480,768
TOTAL 108.0 17,712 180,480 198,528 14,352 393,360

DDTEE - TUG LAUNCH SITE ACTIVATION732-R00COST BY WBS BY PROJECT FUNCTION BY MONTH (WBS LEVEL 5)
NO: 2A.1A.02.04NAME: SUSTAINING ENGINEERING
MAN MAN LABOR OVERHEAD IMATL/S/C. OTHER DIR TOTAL CUMULATIVE
MO/YR MONTHS HOURS COST COST COST CHARGES GFE M & A AMOUNT AMOUNT
01/81 2.0 328 3,342 3,676 266 7 284 17284
02/81 2.0 328 3,342 3,676 266 7,284 14,568
03/81 2.0 328 3,342 3,676 266 7,284 21,852
04/81 2.0 328 3,342 3,676 266 7,284 29,136
05/81 2.0 328 3,342 3,676 266 7,284 369420
06/81 2.0 328 3,342 3t676 266 7,284 43t704
07/81 2.0 328 3,342 3,676 266 79284 50,988
08/81 2.0 328 3,342 3,676 266 7,284 58,272
09/81 2.0 328 3,342 3,676 266 7,284 65,556
10/81 2.0 328 3,342 3,676 266 7,284 721840
11/81 2.0 328 3,342 3,676 266 7,284 80,124
12/81 2.0 328 3,342 3,676 266 7,284 87,408
TOTAL 24.0 3,936 40,104 44,112 3,192 87,408
01/82 20.0 3,280 33,423 36,765 2,657 72,845 160253
J. 02/82 20.0 3,280 33,423 36,765 2,657 72,845 233,098
S03/82 20.0 3,280 33,423 36,765 2,657 729845 3059943
04/82 20.0 3,280 33,423 36,765 2,657 729845 3789788
05/82 20.0 3,280 33,423 36,765 2,657 72,845 451,633
06/82 20.0 3,280 33,423 36,765 2,657 72,845 524478
07/82 20.0 3,280 33,423 36,765 2,657 72,845 597,323
08/82 20.0 3,280 33,423 36,765 2,657 72,845 670,168
09/82 20.0 3,280 33,423 36,765 2,657 72,845 743,013
10/82 20.0 3,280 33,423 36,765 2,657 72,845 815t858
11/82 20.0 3,280 33,423 36,765 2,657 72,845 8889703
12/82 20.0 3,280 33,423 36,765 2,657 729845 9619548
TOTAL 240.0 39,360 401,076 441,180 31,884 874,140
01/83 24.0 3,936 40,108 44,119 3,188 87,415 1,048,963
02/83 24.0 3,936 40,108 44,119 3,188 87,415 19136,378
03/83 24.0 3,936 40,108 44,119 3,188 879415 1,2239793
04/83 .24.0 3,936 40,108 44,119 3,188 87,415 1,311,208
05/83 24.0 3,936 40,108 44,119 3,188 87,415 1,398,623
06/83 24.0 3,936 40,108 44,119 3,188 87,415 1,486,038
07/83 24.0 3,936 40,108 44,119 3,188 879415 .15739453
08/83 24.0 3,936 40,108 44,119 3,188 87,415 1,6609868
09/83 24.0 3,936 40,108 44,119 3,188 87t415 1,748,283
10/83 24.0 3,936 40,108 44,119 3,188 87,415 1,835,698
11/83 24.0 3,936 40,108 44,119 3,188 87,415 1,9239113
12/83 24.0 3,936 40,108 44,119 3,188 87,415 2,010,528
TOTAL 288.0 47,232 481,296 529,428 38,256 1,048,980

DDTCE - TUG LAUNCH SITE ACTIVATION732-ROOCOST BY WBS BY PROJECT FUNCTION BY MONTH (WBS LEVEL 5)
NO: 2A.1A.05.02NAME: TRAINING
MAN MAN LABOR OVERHEAD MATL/s/C. OTHER DIR TOTAL CUMULATIVEMO/YR MONTHS HOURS COST COST COST CHARGES I GFE M & A AMOUNT AMOUNT
01/82 8.0 1,312 13,369 14,706 1,063 29,138 29,13802/82 8.0 1,312 13,369 14,706 1,063 299138 58,27603/82 8.0 1,312 13,369 14,706 1,063 29,138 87,41404/82 8.0 1,312 13,369 14,706 1,063 29,138 116,55205/82 8.0 1,312 13,369 14,706 1,063 29,138 145,69006/82 8.0 1,312 13,369 14,706 1,063 29,138 174,82807/82 8.0 1,312 13,369 14,706 1,063 29,138 203,96608/82 8.0 1,312 13,369 14,706 1,063 29,138 233,10409/82 8.0 1,312 13,369 14,706 1,063 29,138 262,24210/82 8.0 1,312 13,369 14,706 1,063 29,138 291,38011/82 8.0 1,312 13,369 14,706 1,063 29,138 320,51812/82 8.0 1,312 13,369 14,706 1063 29,138 349,656
TOTAL 96.0 15,744 160,428 176,472 12,756 349,656
01/83 8.0 1,312 13,369 14,706 1,063 29,138 378,79402/83 8.0 1,312 13,369 14,706 1,063 29*138 407,93203/83 8.0 1,312 13,369 14,706 1,063 29,138 437,07004/83 8.0 1,312 13,369 14,706 1,063 29,138 466,20805/83 8.0 1,312 13,369 14,706 1,063 29,138 495*34606/83 8.0 1,312 13,369 14,706 1,063 29,138 524,48407/83 8.0 1,312 13,369 14,706 1,063 29,138 553,62208/83 e.0 1,312 13,369 14,706 1,063 29,138 582,76009/83 8.0 1,312 13,369 14,706 1,063 29,138 611,89810/83 8.0 19312 13,369' 14,706 1,063 29,138 641,03611/83 8.0 1,312 13,369 14,706 1,063 29,138 670,17412/83 8.0 1,312 13,369 14,706 1,063 29,138 699,312
TOTAL 96.0 15,744 160,428 176,472 12,756 349t656

DDTEE - TUG LAUNCH SiTE ACTIVATION732-R00COST BY WBS BY PROJECT FUNCTION BY MONTH (WBS LEVEL 5)
NO: 2A.1A.05.03NAME: INVENTORY CONTROL £ WAREHOUSING
MAN MAN LABOR OVERHEAD MATL/S/C. OTHER DIR TOTAL CUMULATIVE
MO/YR MONTHS HOURS COST COST COST CHARGES GFE M & A AMOUNT AMOUNT
01/83 6.0 984 10,027 11,030 797 21,854 21,854
02/83 6.0 984 10,027 11,030 797 21,854 43,708
03/83 6.0 984 10,027 11,030 797 21,854 65,562
04/83 6.0 984 10,027 111030 797 21,854 87t416
05/83 6.0 984 10,027 11,030 797 21,854 109,270
06/83 6.0 984 10,027 11,030 797 21,854 131,124
07/83 6.0 984 10,027 11,030 797 21,854 152,978
08/83 6.0 984 10,027 11,030 797 21,854 174,832
09/83 6.0 984 10,027 11,030 797 21,854 196,686
10/83 6.0 984 10,027 11,030 797 21,854 218,540
11/83 6.0 984 10,027 11,030 797 21,854 240,394
12/83 6.0 984 109027 11,030 797 21,854 262,248
TOTAL 72.0 11,808 120,324 132,360 9,564 262,248
U'

DDT&E - TUG LAUNCH SITE ACTIVATION732-R00COST BY WBS BY PROJECT FUNCTION BY MONTH OqBS LEVEL 5)
NO: 2A.1A.05.04NAME: DEPOT MAINTENANCE
MAN MAN LABOR OVERHEAD MATL/S/C- OTHER DIR TOTAL CUMULATIVEMO/YR MONTHS HOURS COST COST COST CHARGES GFE M & A AMOUNT AMOUNT
01/83 1.0 164 1,671 1,838 133 3#642 3,64202/83 1.0 164 1,671 1,838 133 3,642 7,28403/83 1.0 164 1,671 1,838 133 3,642 10,92604/83 1.0 164 1,671 1,838 133 3,642 14,56805/83 1.0 164 1,671 1,838 133 3,642 18,21006/83 1.0 164 1,671 1,838 133 3,642 21,85207/83 1.0 164 1,671 1,838 133 3,642 25,49408/83 1.0 164 1,671 1,838 133 3,642 29,13609/83 1.0 164 1,671 1,838 133 3,642 32,77810/83 1.0 164 1,671 1,838 133 3,642 36,42011/83 1.0 164 1,671 1,838 133 3,642 40,06212/83 1.0 164 1,671 1,838 133 3,642 43,704
TOTAL 12.0 1,968 20,052 22,056 1,596 43,704
NOT 2A.1A.15.03NAME: GSE SOFTWARE
01/80 .1 16 163 179 10,573 1,9763 12,678 12,67802/80 .1 16 163 179 13 355 13,03303/80 .1 16 163 179 13 355 13,38804/80 .1 16 163 179 13 355 13974305/80 .1 16 163 179 13 355 14,09806/80 .1 16 163 179 13 355 14,45307/80 .1 16 163 179 13 355 14,80808/80 .1 16 163 179 13 355 15916309/80 .1 16 163 179 13 355 15,51810/80 .1 16 163 179 13 355 15,87311/80 .1 16 163 179 13 355 16,22812/80 .1 16 163 179 13 355 16,583
TOTAL 1.2 192 1,956 2,148 10,716 1,763 16,583

DDTEE - TUG LAUNCH SITE ACTIVATION732-R00COST BY WBS BY PROJECT FUNCTION BY MONTH (WBS LEVEL 5)
NO: 2A.1A.15.03INAME: GSE SOFTWARE
MAN MAN LABOR OVERHEAD MATL/S/C OTHER DIR TOTAL CUMULATIVE
MO/YR MONTHS HOURS COST CCST COST CHARGES GFE I & A AMOUNT AMOUNT
01/81 .1 16 163 179 10,573 1,763 12,678 29,261
02/81 .1 16 163 179 13 355 29,616
03/81 .1 16 163 179 13 355 29,971
04/81 .1 16 163 179 13 355 30,326
05/81 .1 16 163 179 13 355 30,681
06/81 .1 16 163 179 13 355 31,036
07/81 .1 16 163 179 13 355 31,391
08/81 .1 16 163 179 13 355 31,746
09/81 .1 16 163 179 13 355 32,101
10/81 .1 16 163 179 13 355 32,456
11/81 .1 16 163 179 13 355 32,811
12/81 .1 16 163 179 13 355 33,166
TOTAL 1.2 192 1,956 2.,148 10,716 1,763 16,583
01/82 .1 16 163 179 10,573 1,763 12,678 45,844
02/82 .1 16 163 179 13 355 46,199
03/82 .1 16 163 179 13 355 46,554
04/82 .1 16 163 179 13 355 46,909
05/82 .1 16 163 179 13 355 47,264
06/82 .1 16 163 179 ( 13 355 47,619
07/82 .1 16 163 179 13 355 47,974
08/82 .1 16 163 179 13 355 489329
09/82 .1 16 163 179 13 355 48,684
10/82 .1 16 163 179 13 355 49,039
11/82 .1 16 163 179 13 355 499394
12/82 .1 16 163 179 13 355 49,749
TOTAL 1.2 192 1,956 2,148 10,716 1,763 16,583
01/83 3.1 506 5,177 5,695 328,971 54,869 394,712 4449461
02/83 3.1 508 5,177 5,695 411 11,283 455,744
03/83 3.1 508 5,177 5,695 411 11,283 467,027
04/83 3.1 508 5,177 5,695 318,411 53,106 382,389 849,416
05/83 3.1, 508 5,177 5,695 411 11,283 860,699
06/83 3.1 508 5,177 5,695 411 11,283 871,982
07/83 3.1 508 5,177 5,695 318,411 53,106 382,389 19254,371
08/83 3.1 508 5,177 5,695 411 11,283 1,265,654
09/83 3.1 508 5,177 5,695 411 11,283 1,2769937
10/83 3.1 508 5,177 5,695 318,411 53,106 382,389 1,659,326
11/83 3.1 508 5,177 5,695 411 11,283 1,670,60912/83 3.1 508 5,177 5,695 411 11,283 1.681,892
TOTAL 37.2 6,096 62,124 68,340 1,287,492 214,187 1,632,143

DDTEE - TUG LAUNCH SITE ACTIVATION732-R00COST BY WBS BY PROJECT FUNCTION BY MONTH (WBS LEVEL 5)
NO: 2A.1B.01.02NAME: PROJECT MANAGEMENT
MAN MAN LABOR OVERHEAD MATL/S/C OTHER DIR TOTAL CUMULATIVEMO/YR MONTHS HOURS COST COST COST CHARGES GFE M & A AMOUNT AMOUNT
01/80 6.0 984 7,941 10,015 .167 996 19,119 19,11902/80 6.0 984 7,941 10,015 167 996 19,119 38,23803/80 6.0 984 7,941 10,015 167 996 19,119 57,35704/80 6.0 984 7,941 10,015 167 996 19,119 76,47605/80 6.0 984 7,941 10,015 167 996 19,119 95,59506/80 6.0 984 7,941 10,015 167 996 19,119 114,71407/80 7.0 1,148 9,264 11,683 195 1,162 22,304 137,01808/80 7.0 19148 9,264 11,683 195 1,162 22,304 159,32209/80 7.0 1,148 9,264 11,683 195 1,162 22,304 181,62610/80 7.0 1,148 9,264 11,683 195 1,162 22,304 203,93011/80 7.0 1,148 9,264 11,683 195 1,162 22,304 226,23412/80 7.0 1,148 9,264 11,683 195. 1,162 22,304 248,538
TOTAL 78.0 12,792 103,230 130,188 2,172 12,948 248,538
01/81 7.0 1,148 9,264 11,683 . 195 1,162 22,304 270,84202/81 7.0 1,148 9,264 11,683 195 1,162 22,304 293,14603/81 7.0 1,148 9,264 11,683 195 1,162 22,304 315,45004/81 7.0 1,148 9,264 11,683 195 1,162 22,304 337,75405/81 7.0 1,148 9,264 11,683 195 1,162 22,304 360,05806/81 7.0 1,148 9,264 11,683 195 1,162 22,304 382,36207/81 7.0 1,148 9,264 11,683 195 1,162 22,304 404,66608/81 7.0 1,148 9,264 11,683 195 1,162 22,304 426,97009/81 7.0 1,148 4,264 11,683 195 1,162 22,304 449,27410/81 7.0 1,148 9,264 11,683 195 1,162 22,304 471,57811/81 7.0 1,148 9,264 11,683 195 1,162 22,304 493,88212/81 7.0 1,148 9,264 11,683 195 1,162 22,304 516,186
TOTAL 84.0 13,776 111,168 140,196 2,340 13,944 267,648
01/82 9.0 1,476 11,911 15,022 251 1,494 28,678 544,86402/82 9.0 1,476 11,911 15,022 251 19494 28t678 573,54203/82 9.0 1,476 11,911 15,022 251 1,494 28,678 602,22004/82 9.0 1,476 11,911 15,022 251 1,494 28,678 630,89805/82 9.0 1,476 11,911 15,022 251 1,494 28,678 659,57606/82 9.0 1,476 11',911 15,022 251 1,494 28,678 688,25407/82 9.0 1,476 11,911 15,022 251 1,494 28,678 716,93208/82 9.0 1,476 11,911 15,022 251 1,494 28,678 745,61009/82 9.0 1,476 11,911 15,022 251 1,494 28,678 774,28810/82 9.0 1,476 11,911 15,022 251 1,494 28,678 802,96611/82 9.0 1,476 11,911 15,022 25. 1,494 28,678 831,64412/82 9.0 1,476 11,911 15,022 251 1,494 28,678 860,322
TOTAL 108.0 17,712 142,932 180,264 3.012 17.928 344,136

DDTEE - TUG LAUNCH SITE ACTIVATION732-ROOCOST BY WBS BY PROJECT FUNCTION BY MONTH (WBS LEVEL 5)
NO: 2A.1B.01.02NAME: PROJECT MANAGEMENT
MAN MAN LABOR OVERHEAD MATL/S/C OTHER DIR TOTAL CUMULATIVE
MO/YR MONTHS HOURS COST COST COST CHARGES GFE M & A AMOUNT, AMOUNT
01/83 8.0 1,312 10,588 13,353 223 1,328 25,492 885,814
02/83 8.0 1,312 10,588 13,353 223 19328 25,492 911,306
03/83 8.0 1,312 10,588 13,353 223 1,328 25,492 936,798
04/83 8.0 1,312 10,588 13,353 223 1,328 25,492 962t290
05/83 8.0 1,312 10,588 13,353 223 1,328 25,492 987.782
06/83 8.0 1,312 10,588 13,353 223 1,328 25,492 le013,274
07/83 8.0 1,312 10,588 13,353 223 1,328 25,492 19038,766
08/83 8.0 1,312 10,588 13,353 223 1,328 25,492 1,064,258
09/83 8.0 1,312 10,588 13,353 223 19328 25,492 1,089,750
10/83 8.0 1,312 10,588 13,353 223 1,328 25,492 1,115,242
11/83 8.0 19312 10,588 13,353 223 1,328 25,492 19140,734
12/83 8.0 1,312 10,588 139353 223 1,328 25,492 1,166,226
TOTAL 96.0 15,744 127,056 160,236 2,676 15,936 305,904
NO: 2A.1B.01.03NAME: INFORMATION MANAGEMENT
01/8002/8003/8004/8005/8006/8007/8008/8009/8010/8011/8012/80 1.0 164 1,323 1,668 28 166 3,185 3,185
TOTAL 1.0 164 1,323 1,668 28 166 3,185

DDTEE - TUG LAUNCH SITE ACTIVATION732-RO0COST BY WBS BY PROJECT FUNCTION BY MONTH (WBS LEVEL 5)
NO: 2A.1B.01.03NAME: INFORMATION MANAGEMENT
MAN MAN LABOR OVERHEAD MATL/S/C OTHER DIR TOTAL CUMULATIVEMO/YR MONTHS HOURS COST COST COST CHARGES GFE M & A AMOUNT AMOUNT
01/81 1.0 164 1,323 19668 28 166 3,185 6,37002/81 1.0 164 1,323 1,668 28 166 3,185 9,55503/81 1.0 164 1,323 1,668 28 166 3,185 12,74004/81 1.0 164 1,323 19668 28 166 3,185 15,92505/81 1.0 164 1,323 1,668 28 166 3,185 19911006/81 1.0 164 1,323 1,668 28 166 3,185 22,29507/81 1.0 164 1,323 1,668 28 166 3,185 25,48008/81 1.0 164 1,323 1,668 28 166 3,185 28,66509/81 1.0 164 1,323 1,668 28 166 3,185 31,85010/81 1.0 164 1,323 1,668 28 166 3,185 35,03511/81 1.0 164 1,323 1,668 28 166 3,185 38,22012/81 1.0 164 1,323 1,668 28 166 3,185 41,405
TOTAL 12.0 1,968 15,876 20,016 336 1,92 38,220
01/82 1.0 164 1,323 1,668 28 166 3,185 44,59002/82 1.0 164 1,323 1,668 28 166 3,185 47,77503/82 1.0 164 1,323 1,668 26 166 3,185 50,96004/82 1.0 164 1,323 1,668 28 166 3,185 54,14505/82 1.0 164 1,323 1,668 28 166 3,185 57.33006/82 1.0 164 1,323 1,668 28 166 39185 60,51507/82 1.0 164 1,323 1,668 28 166 3,165 63,70008/82 1.0 164 1,323 1,668 28 166 3,185 66,88509/82 1.0 164 1,323 1,668 28 166 3,185 70,07010/82 1.0 164 1,323 1,668 28 166 3,185 73,25511/82 1.0 164 1,323 1,668 28 166 3,185 76,44012/82 1.0 164 1,323 1,668 28 166 3,185 79,625
TOTAL 12.0 1,968 15,876 20,016 336 1,992 38,220
01/83 1.0 164 1,323 1,668 28 166 3,185 82,81002/83 1.0 164 1,323 1,668 28 166 3,185 85,99503/83 1.0 164 1,323 1,668 28 166 3,185 89,18004/83 1.0 164 1,323 1,668 28 166 3,185 92,36505/83 1.0 164 1,323 1,668 28 166 3,185 95,55006/83 1.0 164 1,323 1,668 28 166 3,185 98,73507/83 1.0 164 1,323 1,668 28 166 3,185 101,92008/83 1.0 164 1,323 1,668 28 166 3,185 105,10509/83 1.0 164 1,323 1,668 28 166 3,185 108929010/83 1.0 164 1,323 1,668 28 166 3,185 111,47511/83 1.0 164 1,323 1,668 28 166 3,185 114,66012/83 1.0 164 1,323 1,666 28 166 3,185 117,845
TOTAL 12.0 1,968 15,876 20,016 336 1,992 38.220

DDTEE - TUG LAUNCH SITE ACTIVATION732-R00COST BY WBS BY PROJECT FUNCTION BY MONTH. (WBS LEVEL 5)
NO: 2A.18.06.03NAME: ETR MAINTENANCE £ REFURBISHMENT
MAN MAN LABOR OVERHEAD MATL/S/C OTHER DIR TOTAL CUMULATIVE
MO/YR MONTHS HOURS COST COST COST CHARGES GFE M & A AMOUNT AMOUNT
01/80 4.0 656 5,294 6,675 112 663 12t744 12,744
02/80 4.0 656 5,294 69675 112 663 12,744 25,488
03/80 4.0 656 5,294 6,675 112 663 12,744 389232
04/80 5.0 820 6,617 8,344 139 829 15,929 54,161
05/80 5.0 820 6,617 8,344 139 829 15,929 70,090
06/80 5.0 820 6,617 8,344 139 829 159929 86,019
07/80 14.0 2,296 18,529 23,366 390 2,323 44,608 130,627
08/80 14.0 2,296 18,529 23,366 390 2,323 44,608 175,235
09/80 14.0 2,296 18,529 23,366 390 2,323 44,608 219,843
10/80 14.0 2,296 18,529 23,366 390 2,323 44,608 2649451
11"/80 14.0 2,296 18,529 23,366 390 2,323 44,608 309,059
12/80 16.0 2,624 21,176 26,705 446 2,654 50,981 360,040
TOTAL 113.0 18,532 149,554 188,592 3,149 18,745 360,040
01/81 16.0 2,624 21,176 26,705 446 2,654 50,981 411,021
n 02/81 16.0 2,624 21,176 26,705 446 2,654 50,981 462,002
03/81 16.0 2,624 21,176 26,705 446 2,654 50,981 512,983
04/81 16.0 2,624 21,176 26,705 446 2,654 50,981 563,964
05/81 16.0 2,624 21,176 26,705 446 2,654 50,981 614,945
06/81 16.0 2,624 21,176 26,705 446 29654 50,981 665,926
07/81 25.0 4,100 33,087 41,726 697 4,148 79,658 745,584
08/81 25.0 4,100 33,087 41,726 697 4,148 79,658 825,242
09/81 25.0 4,100 33,087 41,726 697 4,148 79,658 904,900
10/81 27.0 4,428 35,734 45,063 753 4,480 86,030 990,930
11/81 27.0 4,428 35,734 45,063 753 4,480 86,030 1,0769960
12/81 27.0 4,428 35.734 45,063 753 4,480 86,030 1,1629990
TOTAL 252.0 41,328 333,519 420,597 7,026 41,808 802,950
01/82 40.0 6,560 52,939 66,760 1,115 6,637 127,451 1,290,441
02/82 40.0 6,560 52,939 66,760 1,115 6,637 127,451 1,417,892
03/82 40.0 6,560 52,939 66,760 1,115 6,637 127,451 1,545,343
04/82 53.0 8,692 70,144 88,458 1,478 8,795 168,875 1,714t218
05/82 53.0 8,692 70,144 68,458 1,478 8,795 168,875 1,883,093
06/82 53.0 8,692 70,144 88,458 1,478 8,795 168,875 2,051,968
07/82 53.0 8,692 70,144 88,458 1,478 -8,795 168,875 2,220,843
08/82 53.0 8,692 70,144 88,458 1,478 8,795 168,875 2,389,718
09/82 53.0 8,692 70,144 88,458 1,478 8,795 168,875 2,558,593
10/82 53.0 8,692 70,144 88,458 1,478 8,795 168,875 2,7279468
11/82 53.0 8,692 70,144 88,458 1,47E 8,795 168,875 2,896,343
12/82 53.0 8,692 70,144 88,458 1,476 8,795 168,875 3,065,218
TOTAL 597.0 97,908 790,113 996,402 16,647 99,066 1,902t228

DDT&E - TUG LAUNCH SITE ACTIVATION732-R00COST BY WBS BY PROJECT FUNCTION BY MONTH (WBS LEVEL 5)
NO: 2A.18.06.03NAME: ETR MAINTENANCE E REFURBISHMENT
MAN MAN LABOR OVERHEAD MATL/S/C OTHER DIR TOTAL CUMULATIVEMO/YR MONTHS HOURS COST COST COST CHARGES GFE M & A AMOUNT AMOUNT
01/83 55.0 9,020 72,791 91,795 6,454,533 9,126 6,628,245 9,693,46302/83 67.0 10,988 88,673 111,824 1,868 11,117 213,482 9,906,94503/83 67.0 10,988 88,673 111,824 1,868 11,117 213,482 10,120,42704/83 67.0 10,988 88,673 111,824 1,868 11,117 213,482 10,333,90905/83 67.0 10,988 88,673 111,824 1,868 11,117 213,482 10,547,39106/83 67.0 10,988 88,673 111,824 1,868 11,117 2139482 10,760,87307/83 67.0 10,988 88,673 111,824 1,868 11,117 213,482 10974935508/83 53.0 8,692 70,144 88,458 1,478 8,795 168,875 11,143,23009/83 53.0 8,692 70,144 88,458 1,478 8,795 168,875 11,312,10510/83 53.0 8,692 70,144 88,458 1,478 8,795 168,875 11,480,98011/83 53.0 8,692 70,144 88,458 1,478 8,795 168,875 11,649,85512/83 53.0 8,692 70,144 88,458 1,478 8,795 168.875 11,818,730
TOTAL 722.0 118,408 955,549 1,205,029 6,473,131 119,803 8,753,512
1nOO

DDTGE - TUG LAUNCH SITE ACTIVATION732-R00COST BY WES BY PROJECT FUNCTION BY MONTH ('WB LEVEL 5)
NO: 2A.18.06.04NAME: ETR LAUNCH
MAN MAN LABOR OVERHEAD MATL/S/C OTHER DIR TOTAL CUMULATIVE
MO/YR MONTHS HOURS COST COST COST CHARGES GFE M & A AMOUNT AMOUNT
01/83 78,000 78,000 78,000
02/83 78,000
03/83 78,000
04/83 78,000
05/83 78,000
06/83 78,000
07/83 78,000
08/83 78,000
09/83 78,000
10/83 78,000
11/83 78,000
12/83 78,000
TOTAL 78,000 78,000
- NO: 2A.1B.07.02
NAME: EASTERN TEST RANGE GSE
01/8002/8003/8004/8005/8006/8007/8008/8009/8010/8011/8012/80 2.0 328 2,647 3,340 56 332 6,375 6,375
TOTAL 2.0 328 2,647 3,340 56 332 6,375

DDTCE - TUG LAUNCH SITE ACTIVATION732-R00COST BY WBS BY PROJECT FUNCTION BY MONTH (WBS LEVEL 5)
NO: 2A.1B.07.02NAME: EASTERN TEST RANGE GSE
MANa MAN LABOR OVERHEAD MATL/S/C OTHER DIR TOTAL 'CUMULATIVEMO/YR MONTHS HOURS COST COST COST CHARGES GFE M & A AMOUNT AMOUNT
01/81 2.0 328 2,647 3,340 56 332 6,375 12,75002/81 2.0 328 2,647 3,340 56 332 6,375 19,12503/81 2.0 328 2,647 3,340 56 332 6,375 25,50004/81 2.0 328 2,647 3,340 56 332 6,375 31,87505/81 2.0 328 2,647 3,340 56 332 6,375 38,25006/81 2.0 328 2,647 3,340 56 332 6,375 44,62507/81 2.0 328 2,647 3,340 56 332 6,375 51,00008/81 2.0 328 2,647 3,340 56 332 6,375 .57,37509/81 2.0 328 2,647 3,340 56 332 6,375 63,75010/81 2.0 328 2,647 3,340 56 332 6,375 70,12511/81 2.0 328 2,647 3,340 56 332 6,375 76,50012/81 4.0 656 5,294 6,675 112 663 12,744 899244
TOTAL 26.0 4,264 34,411 43,415 728 4*315 82,869
01/82 4.0 656 5,294 6,675 112 663 12,744 101,98802/82 4.0 656 5,294 6,675 112 663 12,744 114,73203/82 4.0 656 5,294 6,675 112 663 12,744 127,47604/82 4.0 656 5,294 6,675 112 663 12,744 140,22005/82 4.0 656 5,294 6,675 112 663 12,744 152,96406/82 4.0 656 5,294 6,675 112 663 12,744 165,70807/82 4.0 656 5,294 6,675 112 663 12,744 178,45208/82 6.0 984 7,941 10,015 167 996 19,119 197,57109/82 6.0 984 7,941 10,015 167 996 19,119 216,69010/82 6.0 984 7,941 10,015 167 996 19,119 235,80911/82 6.0 984 7,941 10,015 167 996 19,119 254,92812/82 6.0 984 7,941 10,015 167 996 19,119 274,047
TOTAL 58.0 9,512 76,763 96,800 1,619 9,621 184,803
01/83 4.0 656 5,294 6,675 5,144,612 663 5,157,244 5,431,29102/83 4.0 656 5,294 6,675 112 663 12,744 5444903503/83 4.0 656 5,294 6,675 112 663 12,744 5,456,77904/83 4.0 656 5,294 6,675 5,144,612 663 5,157,244 10,614,02305/83 4.0 656 5,294 6,675 112 663 12,744 10,626,76706/83 4.0 656 5,294 6,675 112 663 12,744 10639,51107/83 4.0 656 5,294 6,675 112 663 12,744 10,652,25508/83 7.0 1,148 9,264 11,683 195 1,162 22,304 10,674,55909/83 7.0 1,148 9,264 11,683 195 1,162 22,304 10,696t86310/83 7.0 1,148 9,264 11,683 195 1,162 22,304 10O19,16711/83 7.0 1,148 9,264 11,683 195 1,162 22,304 10,741,47112/83 7.0 1,148 9,264 11,683 195 1,162 22,304 10,763,775
TOTAL 63.0 10,332 83,378 105,140 10,290,759 10,451 10,489,728

DDTEE - TUG LAUNCH SITE ACTIVATION732-ROOCOST BY WBS BY PROJECT FUNCTION BY MONTH (WBS LEVEL 5)
NO: 2A.1C.01.02NAME: PROJECT MANAGEMENT
MAN MAN LABOR OVERHEAD MATL/S/C OTHER DIR TOTAL CUMULATIVE
MO/YR MONTHS HOURS COST COST COST CHARGES GFE M & A AMOUNT AMOUNT
01/8302/8303/8304/8305/8306/8307/83 2.0 328 2,647 3,278 56 332 69313 69313
08/83 2.0 328 2,647 3,278 56 332 6,313 12,626
09/83 2.0 328 2,647 3,278 56 332 69313 18,939
10/83 2.0 328 2,647 3,278 56 332 6,313 25,252
11/83 2.0 328 2,647 3,278 56 332 6,313 31,565
12/83 2.0 328 2,647 3,278 56 332 6,313 37,878
TOTAL 12.0 1,968 15,882 19,668 336 1,992 379878
NO: 2A.1C.01.03NAME: INFORMATION MANAGEMENT
01/8302/8303/8304/8305/8306/8307/83 2.0 328 2,647 3,278 56 332 69313 69313
08/83 2.0 328 2,647 3,278 56 332 6,313 12,626
09/83 2.0 328 2,647 39278 56 332 6,313 18,939
10/83 2.0 328 2,647 3,278 56 332 6,313 25,252
11/83 2.0 328 2,647 3,278 56 332 6,313 319565
12/83 2.0 328 2,647 3,278 56 332 6,313 37,878
TOTAL 12.0 1,968 15,882 19,668 336 1,992 37,878

DDT&E - TUG LAUNCH SITE ACTIVATION732-R00COST BY WBS BY PROJECT FUNCTION BY MONTH (WBS LEVEL 5)
NO: 2A.1C.06.05NAME: WTR MAINTENANCE E REFURBISHMENT
MAN MAN LABOR OVERHEAD MAT/S/C OTHER DIR TOTAL CUMULATIVEMO/YR MONTHS HOURS COST COST COST CHARGES GFE M & A AMOUNT AMOUNT
01/81 500,000 500,000 500,00002/81 500,00003/81 500t00004/81 500,00005/81 500,00006/81 500,00007/81 500,00008/81 500,00009/81 500,00010/81 500,00011/81 500,00012/81 500,000
TOTAL 500,000 500,000
01/82 761,000 761,000 1,261,00002/82 1,261,00003/82 1,261900004/82 lt261,00005/82 1,261,00006/82 19261,00007/82 1,261,00008/82 1,261,00009/82 1,261,00010/82 1,261,00011/82 1,261900012/82 1,261,000
TOTAL 761,000 761,000
01/83 1.0 164 1,323 1,637 730,028 166 733,154 1,994915402/83 1.0 164 1,323 1,637 28 166 3,154 1,997,30803/83 1.0 164 1,323 1t637 28 166 3,154 2,000,46204/83 1.0 164 1,323 1,637 28 166 3,154 2,003,61605/83 1.0 164 1,323 1,637 28 166 3,154 2,006,77006/83 1.0 164 1'9323 1,637 28 166 3,154 2,009,92407/83 1.0 164 1,323 1,637 28 166 3,154 2,013,07808/83 35.0 5,740 46,322 118,379 976 61,295 226,972 2,240,05009/83 35.0 5,740 46,322 91,002 976 36,407 16,751 191,458 2,431t50810/83 35.0 5,740 46,322 91,002 976 36,407 174,707 2,606921511/83 35.0 5,740 46,322 91,002 976 36,407 174,707 2,780,92212/83 35.0 5,740 46,322 91,002 976 36,407 16,751 191,458 2,972,380
TOTAL 182.0 29,848 240,871 493,846 735,076 208,085 33,502 1,711,380

DDTEE - TUG LAUNCH SITE ACTIVATION732-R00OCOST BY WBS BY PROJECT FUNCTION BY MONTH (WBS LEVEL 5)
NO: 2A.1C.06.08NAME: FACILITY OPERATIONS SUPPORT
MAN MAN LABOR OVERHEAD MATL/S/C OTHER DIR TOTAL CUMULATIVE
MO/YR MONTHS HOURS COST COST COST CHARGES GFE M & A AMOUNT AMOUNT
01/8302/8303/8304/8305/8306/8307/83 1.0 164 1,323 1,637 28 166 39154 3,154
08/83 1.0 164 19323 1,637 28 166 39154 69308
09/83 1.0 164 1,323 1,637 28 166 3,154 9,462
10/83 1.0 164 19323 19637 28 166 3,154 12,616
11/83 1.0 164 1,323 1,637 28 166 3,154 15,770
12/83 1.0 164 19323 19637 28 166 3,154 18,924
TOTAL 6.0 984 79938 9,822 168 996 18,924
NO: 2A.1C.07.03NAME: WESTERN TEST RANGE GSE
01/82 1,619,000 196199000 19619,000
02/82 19619,000
03/82 19619,000
04/82 1,619,000
05/82 1,619,000
06/82 1,6199000
07/82 24,000 24,000 1l643,000
08/82 24,000 24,000 1,667,000
09/82 24,000 24,000 1,6919000
10/82 24,000 249000 1,7159000
11/82 24,000 24,000 1,739,000
12/82 24,000 24,000 197639000
TOTAL 1,763,000 197639000

DDT&E - TUG LAUNCH SITE ACTIVATION732-R00COST BY WBS BY PROJECT FUNCTION BY MONTH (WBS LEVEL 5)
NO: 2A.1C.07.03NAME: WESTERN TEST RANGE GSE
MAN MAN LABOR OVERHEAD MATL/S/C OTHER DIR TOTAL CUMULATIVEMO/YR MONTHS HOURS COST COST COST CHARGES GFE M & A AMOUNT AMOUNT
01/83 24,000 24,000 1,787,00002/83 24,000 24,000 1,811,00003/83 24,000 24,000 1,835,00004/83 24,000 24,000 1,859,00005/83 24,000 24,000 1,883,00006/83 24,000 24,000 1,907,00007/83 1.0 164 1,323 1,637 28 166 3,154 1,910,15408/83 1.0 164 1,323 1,637 28 166 3,154 1,913,30809/83 1.0 164 1,323 1,637 28 166 3,154 1,916,46210/83 1.0 164 1,323 1,637 28 166 3,154 1,919,61611/83 1.0 164 1,323 1,637 28 166 3,154 1,922,77012/83 1.0 164 1,323 1,637 28 166 3,154 1,925,924
TOTAL 6.0 984 79936 9,822 144,168 996 162,924
PROP.TOTAL 4,120.8 675,792 6,033,054 7,348,545 20,786,435 2,120,764 33,502 219,476 36,541,776

DDT&E - Summary of Other Direct Charges By Type By Month
Cag s ByTp BS ot

DDTCE - TUG LAUNCH SITE ACTIVATION732-R00SUMMARY OF OTHER DIRECT CHARGES BY TYPE BY MONTH
FRINGE OTHER DIR WTR LAUNCH TCY-RELOC 747 MISC. ,TOTAL
MG/YF FENEFITS CHARGES TRAVEL EFER DIEN FERRY CDC 6000 16E 370 KEYPUNCH ODC ODC
01/EO 331 2,072 9,390 1,170 12,963
02/F0 331 2,072 2,403
03/80 331 2,072 2,403
04/80 364 2,205 2,569
05/80 364 2,205 2,569
06/80 364 2,205 2,569
07/80 695 3,534 4,229
Oe/EO 695 3,534 4,229
09/80 695 3,534 4,229
I0/80 695 3,534 4,229
11/60 695 3,534 4,229
12/80 E60 4,198 5,058
YEAR lOTAL 6,420 34,699 0,390 1,170 51,679
01/E1 Eo0 4,929 9,390 1,170 16,349
02/81 660 4,929 5,789
03/E. 1 60 4,929 5,789
04/81 860 4,929 5,789
0C5/1 E60 4,929 5,769
06/81 E60 4,929 5,789
07/1 1,15E 6,125 7,263
OE/81 1,158 6,125 7,2683
09/E1 1,156 6,125 7,283
10/81 1,224 6,391 7,615
11/81 M 1,224 6,391 7,615
12/S1 1,290 6,656 7,946
YEAR. 0TAL 12,972 67,387 9,390 1,170 90,319
01/82 1,7E6 13,431 9,390 1,170 25,777
02/82 1,6Et 13,431 15,217
03/82 1,786 13,431 15,217
04/82 2,217 15,15E 17,375
05/F2 2,217 15,158 17,375
06/62 2,217 15,158 17,375
07/82 2,217 15,156 17,375
08/82 2,284 15,424 17,70E
09/82 2,264 15,424 17,708
10/82 2,284 15,424 17,708
11/82 2,264 15,424 17,708
12/82 2284 15,424 17,706
YEAR TOTAL 25,t4 178,045 c,390 1,170 214,251

DDT9E - TUG LAUNCH SITE ACTIVATION732-R00SUMMARY OF OTHER DIRECT CHARGES BY TYPE BY MONTH
FRINGE OTHER DIR WTR LAUNCH TDY-RELCC 747 MISC. TOTALMO/YR BENEFITS CHARGES TRAVEL EPER DIEN FERRY CDC 6000 IBM 370 KEYPUNCH ODC ODC
01/83 2,283 19,142 9,390 318,000 1,170 349,98502/83 2,680 20,736 23,41603/83 2,680 20,736 23,41604/83 2,680 20,736 318,000 341,41605/83 2,680 20,736 23,41606/83 2,680 20,736 23,41607/83 2,878 21,534 318,000 342,41208/83 3,640 80,078 83,71809/83 3,640 55,190 58,83010/83 3,640 55,190 318,000 376,83011/83 3,640 55,190 58,83012/83 3,640 55,190 58,830
YEAR TOTAL 36,761 445,194 9,390 1,272,000 1,170 1,764,515
PROP TOTAL 81,199 725,325 37,560 1,272,000 4,680 2,120,764

DDT&E - Total Manpower Summary By Project Function Site
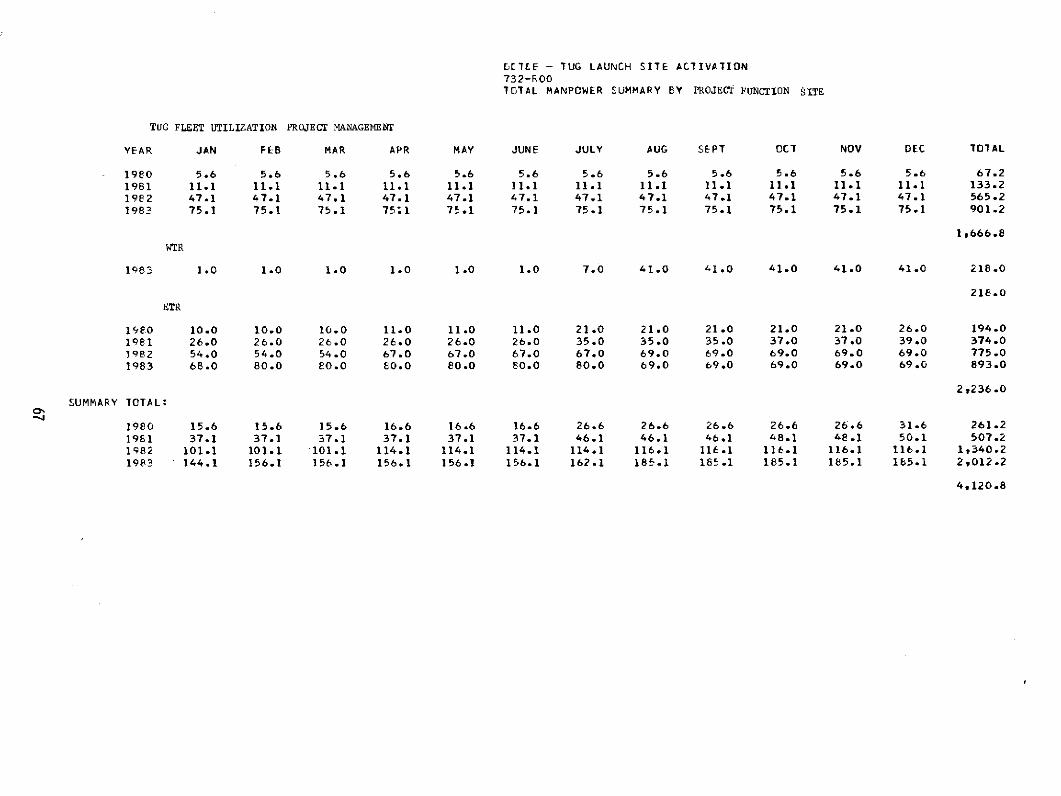
E[TEE - TUG LAUNCH SITE ACTIVATION732-R00TOTAL MANPOWER SUMMARY BY PROJECT FUNCTION SITE
TUG FLEET UTILIZATION PROJECT MANAGEMENT
YEAR JAN FEB MAR APR MAY JUNE JULY AUG SEPT OCT NOV DEC TOTAL
1980 5.6 5.6 5.6 5.6 5.6 5.6 5.6 5.6 5.6 5.6 5.6 5.6 67.2
1981 11.1 11.1 11.1 11.1 11.1 11.1 11.1 11.1 11.1 11.1 11.1 11.1 133.2
1982 47.1 47.1 47.1 47.1 47.1 47.1 47.1 47.1 47.1 47.1 47.1 47.1 565.2
1983 75.1 75.1 75.1 75;1 75.1 75.1 75.1 75.1 75.1 75.1 75.1 75.1 901.2
1,666.8
WTR
1983 1.0 1.0 1.0 1.0 1.0 1.0 7.0 41.0 41.0 41.0 41.0 41.0 218.0
216.0
ETR
1980 10.0 10.0 10.0 11.0 11.0 11.0 21.0 21.0 21.0 21.0 21.0 26.0 194.0
1981 26.0 26.0 26.0 26.0 26.0 26.0 35.0 35.0 35.0 37.0 37.0 39.0 374.0
1982 54.0 54.0 54.0 67.0 67.0 67.0 67.0 69.0 69.0 69.0 69.0 69.0 775.0
1983 68.0 80.0 80.0 80.0 80.0 80.0 80.0 69.0 69.0 69.0 69.0 69.0 893.0
2,236.0
SUMMARY TOTAL:-J
1980 15.6 15.6 15.6 16.6 16.6 16.6 26.6 26.6 26.6 26.6 26.6 31.6 261.2
1961 37.1 37.1 37.1 37.1 37.1 37.1 46.1 46.1 46.1 48.1 48.1 50.1 507.2
1982 101.1 101.1 101.1 114.1 114.1 114.1 114.1 116.1 116.1 116.1 116.1 116.1 1,340.2
1983 144.1 156.1 156.1 156.1 156.1 156.1 162.1 185.1 185.1 185.1 185.1 165.1 2,012.2
4,120.8

DDT&E - Total Manpower Summary By Project Function Elements (WBS Level 5)
TS l M S B
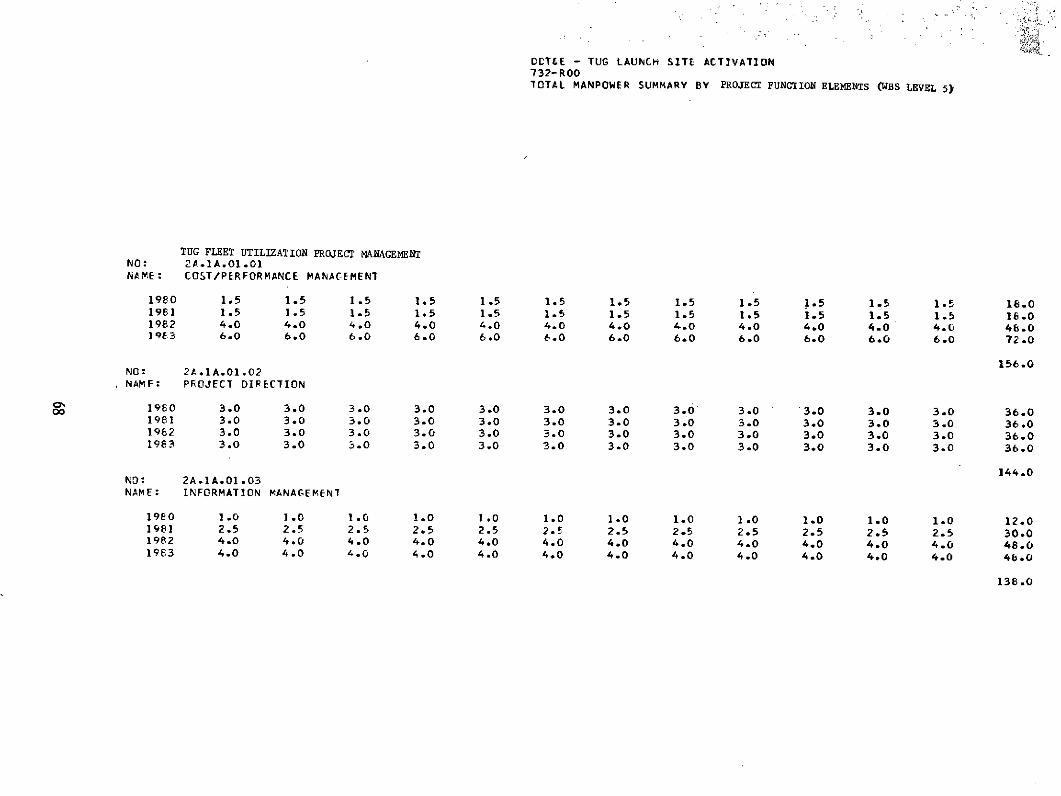
DCTEE - TUG LAUNCH SITE ACTIVATION732-ROOTOTAL MANPOWER SUMMARY BY PROJECT FUNCTION ELEMENTS (WBS LEVEL 5)
TUG FLEET UTILIZATION PROJECT MANAGEMENTNO: 2A.1A.01.01NAME: COST/PERFORMANCE MANACEMENT
1980 1.5 1.5 1.5 1.5 1.5 1.5 1.5 1.5 1.5 1.5 1.5 1.5 18.01961 1.5 1.5 1.5 1.5 1.5 1.5 1.5 1.5 1.5 1.5 1.5 1.5 16.01982 4.0 4.0 4.0 4.0 4.0 4.0 4.0 4.0 4.0 4.0 4.0 4.0 48.019Q3 6.0 6.0 6.0 6.0 6.0 6.0 6.0 6.0 6.0 6.0 6.0 6.0 72.0
156.0NO: 2A.1A.01.02NAMF: PROJECT DIRECTION
1980 3.0 3.0 3.0 3.0 3.0 3.0 3.0 3.0 3.0 3.0 3.0 3.0 36.01981 3.0 3.0 3.0 3.0 3.0 3.0 3.0 3.0 3.0 3.0 3.0 3.0 36.01982 3.0 3.0 3.0 3.0 3.0 3.0 3.0 3.0 3.0 3.0 3.0 3.0 36.01983 3.0 3.0 3.0 3.0 3.0 3.0 3.0 3.0 3.0 3.0 3.0 3.0 36.0
144.0NO: 2A.IA.01.03NAME: INFORMATION MANAGEMENT
1980 1.0 1.0 1.0 1.0 1.0 1.0 1.0 1.0 1.0 1.0 1.0 1.0 12.01981 2.5 2.5 2.5 2.5 2.5 2.5 2.5 2.5 2.5 2.5 2.5 2.5 30.01982 4.0 4.0 4.0 4.0 4.0 4.0 4.0 4.0 4.0 4.0 4.0 4.0 48.01963 4.0 4.0 4.0 4.0 4.0 4.0 4.0 4.0 4.0 4.0 4.0 4.0 48.0
138.0

5DTLE - TUG LAUNCH SITE ACTIVATION732-R00TOTAL MANPOWER SUMMARY BY PROJECT FUNCTION ELEMENTS (WBS LEVEL 5)
TUG FLEET UTILIZATION PROJECT MANAGEMENT
NO: 2A.1A.01.04NAME: FLEET UTILIZATION
YEAR JAN FEB MAR APR MAY JUNE JULY AUG SEPT OCT NOV DEC TOTAL
1981 2.0 2.0 2.0 2.0 2.0 2.0 2.0 2.0 2.0 2.0 2.0 2.0 24.01982 6.0 6.0 6.0 6.0 6.0 6.0 6.0 6.0 6.0 6.0 6.0 6.0 72.019E3 11.0 11.0 11.0 11.0 11.0 11.0 11.0 11.0 11.0 11.0 11.0 11.0 132.0
228.0NC: 2A.IA.02.01NAME: TUG SYSTEMS ENGINEEFING
1982 2.0 2.0 2.0 2.0 2.0 2.0 2.0 2.0 2.0 2.0 2.0 2.0 24.01983 9.0 9.0 Q.0 9.0 9.0 9.0 9.0 9.0 9.0 9.0 9.0 9.0 108.0
132.0NO: 2A.IA.02.04NAME: SUSTAINING ENGINEERING
1981 2.0 2.0 2.0 2.0 2.0 2.0 2.0 2.0 2.0 2.0 2.0 2.0 24.01982 20.0 20.0 20.0 20.0 20.0 20.0 20.0 20.0 20.0 20.0 20.0 20.0 240.01]83 24.0 24.0 24.0 24.0 24.0 24.0 24.0 24.0 24.0 24.0 24.0 24.0 288.0
552.0NO: 2A.1A.05.02NAME: TRAINING
1982 8.0 e.0 8.0 8.0 8.0 8.0 8.0 8.0 8.0 8.0 8.0 8.0 96.01983 8.0 8.0 8.0 6.0 8.0 8.0 8.0 8.0 8.0 8.0 8.0 8.0 96.0
192.0NO: 2A.1A.05.03NAME: INVENTORY CONTROL E WAREHOUSING
1983 6.0 6.0 6.0 6.0 6.0 6.0 6.0 6.0 6.0 6.0 6.0 6.0 72.0
72.0

DDTEE - TUG LAUNCH SITE ACTIVATION732-R00TOTAL MANPOWER SUMMARY BY PROJECT FUNCTION ELEMITS (WBS LEVEL 5)
I TUG FLEET UTILIZATION PROJECT MANAGEMENTNO: 2A.IA.05.04NAME: DEPOT MAINTENANCE
YEAR JAN FEB MAR APR MAY JUNE JULY AUG SEPT OCT NOV DEC TOTAL
1983 1.0 1.0 1.0 1.0 1.0 1.0 1.0 1.0 1.0 1.0 1.0 1.0 12.0
12.0
NO: 2A.1A.15.03NAME: GSE SOFTWARE
1980 .1 .1 .1 .1 .1 .1 .1 .1 .1 .1 .1 .1 1.2
1981 .1 .1 .1 .1 .1 .1 .1 .1 .1 .1 .1 .1 1.2
1982 .1 .1 .1 .1 .1 .1 .1 .1 .1 .1 .1 .1 1.2
1983 3.1 3.1 3.1 3.1 3.1 3.1 3.1 3.1 3.1 3.1 3.1 3.1 37.2
40.8
DEPARTMENT TOTAL:
1980 5.6 5.6 5.6 5.6 5.6 5.6 5.6 5.6 5.6 5.6 5.6 5.6 67.2
1981 11.1 11.1 11.1 11.1 11.1 11.1 11.1 11.1 11.1 11.1 11.1 11.1 133.2
1982 47.1 47.1 47.1 47.1 47.1 47.1 47.1 47.1 47.1 47.1 47.1 47.1 565.2
1983 75.1 75.1 75.1 75.1 75.1 75.1 75.1 75.1 75.1 75.1 75.1 75.1 901.2
1,666.8

DDLEF - TUG LAUNCW SITE ACTIVATION
732-R00TOTAL MANPOWER SUMMARY B6Y PROJECT FUNCTION ELEMENTS (WBS LEVEL 5)
NC: 2A.1.01.02NAfME: PROJECT MANAGEMENT
YEAP JAN FEB MAR APR ,AY JUNE JULY AUC !EPT OCT NOV DEC TOTAL
19P0 6.0 6.0 6.0 6.0 6.0 6.0 7.0 7.0 7.0 7.0 7.0 7.0 7E.0
1961 7.0 7.0 7.0 7.0 7.0 7.0 7.0 7.0 7.0 7.0 7.0 7.0 64.0
19E2 9.0 9.0 9.0 9.0 9.0 9.C 9.0 9.0 9.0 9.0 9.0 9.0 108.0
1983 8.0 8.0 8.0 E.0 8.0 8.0 8.0 e.C 8.0 8.0 8.0 8.0 96.0
366.0
NC: 2A.1E.01.03NAME: INFCRMATION 'ANAGEMENT
1980 1.0 1.0
191E 1.0 1.0 1.0 1.0 1.0 1.0 1.0 1.0 1.0 1.0 1.0 1.0 12.0
1962 1.0 1.0 1.0 1.0 1.0 1.0 1.0 1.0 1.0 1.0 1.0 1.0 12.0
191. 1.0 . 1.0 1.0 1.0 1.0 1.0 1. 1.0 1.0 1.0 1.0 12.0
37.0
NC.: 2A.1E.06.03NAME: EIF MAINIFNANCE FEFUFREISHMENT
1S9 4.0 4.0 L.0 5.0 5.0 5.0 14.0 14.0 14.0 14.0 14.0 16.0 113.0ic1 16.0 16.0 16.0 16.0 16.0 16.0 25.0 25.0 25.0 27.0 27.0 27.0 252.0
19F2 40.0 40.0 L.0 53.0 53.0 53.0 53.0 53.0 53.0 53.0 53.0 53.0 597.019l3 55.0 67.0 67.0 67.0 67.0 67.0 67.0 53.0 53.0 53.0 53.0 53.0 722.0
1,684.0
I,4: 2A.1B.07.02
00 NtIvE: EASTERN TEST FANGE C.SE
1980 2.0 2.0
1981 2.0 2.0 2.0 2.0 2.0 2.0 2.0 2.0 2.0 2.0 2.0 4.0 26.0
19E2 4.0 4.0 4.0 4.0 4.0 4.0 4.0 6.0 6.0 6.0 6.0 6.0 56.01982 4.0 4.0 4.0 4.0 4.0 4.0 4.0 7.0 7.0 7.0 7.0 7.0 63.0
JD149.0
.tFPARTF:NT Tf;T-L:
YEAP JAN FEB MAR APR MAY JUNE JULY AUG SFPT OCT NOV DEC TOTAL
198C 10.0 10.0 10.0 11.0 11.0 11.0 21.0 21.0 21.0 21.0 21.0 26.0 194.0
lCI 26.0 26.0 26.0 26.0 26.0 26.0 35.0 35.0 35.0 37.0 37.0 39.0 374.01982 54.0 54.0 E',.0 67.0 67.0 67.0 67.0 69.0 69.0 69.0 69.0 69.0 775.0
1963 68.0 8.0 0.0 80.0 0.0 0.0 80.0 6.0 6.0 G.0 69.0 69.0 69.0 693.0
2,23b .0

DDTEE - TUG LAUNCH SITE ACTIVATION732-R00TOTAL MANPOWER SUMMARY BY PROJECT FUNCTION ELEMENT (WBS LEVE 5)
WTRNO: 2A.1C.01.02NAME: PROJECT MANAGEMENT
YEAR JAN FEB MAR APR MAY JUNE JULY AUG SEPT OCT NOV DEC TOTAL
1983 2.0 2.0 2.0 2.0 2.0 2.0 12.0
2A.1C.01.03 12.0INFORMATION MANAGEMENT
1983 2.0 2.0 2.0 2.0 2.0 2.0 12.0
NO: 2A.1C.06.05 12.0NAME: WTR MAINTENANCE t REFURBISHMENT
1983 1.0 1.0 1.0 1.0 1.0 1.0 1.0 35.0 35.0 35.0 35.0 35.0 182.0
NO: 2A.1C.06.08 182.0NAME: FACILITY OPERATIONS SUPPORT
1983 1.0 1.0 1.0 1.0 1.0 1.0 6.0
NO: 2A.1C.07.03 6.0NAME: WESTERN TEST RANGE GSE
1983 1.0 1.0 1.0 1.0 1.0 1.0 6.0
DEPARTMENT TOTAL: 6.0
1983 1.0 1.0 1.0 1.0 1.0 1.0 7.0 41.0 41.0 41.0 41.0 41.0 218.0
218.0
I. OPERATIONS - TUG LAUNCH SITE SUPPORT -TIMELINE FUNDING

III. OPERATIONS - TUG LAUNCH SITE SUPPORT TIMELINE FUNDING
Operations phase funding from January 1984 through December 1991
is shown in the following tabulated data. These costs are based
on fiscal year 1974 dollars throughout.
Fleet Utilization Project Management costs represent the cost of
project level cost/performance management depot maintenance, longrange scheduling of the Tug fleet, and sustaining engineering.
Ground and Launch Operations at WTR indicate the cost of the launch/
recovery support crews, propellants, spares, and facility maintenance.
Ground and Launch Operations at .ETR indicate the cost of the operational
crews supporting refurbishment at the central processing facilities and
checkout crews, facility maintenance costs, propellants, spares and
central warehousing.
The overall Tug ETR launch site crew size and makeup was determined
through an analysis of the stick and ball chart contained in subplan A.
The organization shown in Figure 18 would be typical for the refurbish-
ment/checkout of a single Tug at ETR on a two-shift-per-day basis.Analysis of the traffic model has shown that this "single cycle"
operations crew is large enough to fulfill the ETR requirements.
WTR operations impose additional requirements and the total ETR/WTR
operations crew requirement is shown in Figure 19. This figurerepresents a crew of 107 people stationed permanently at ETR withseven additional people stationed at WTR. An operations crew,from ETR personnel, would follow the Tug to WTR and return to ETR
following launch. In addition to the operations crew, fleet manage-
ment requires a typical organization of 85 people (Figure 20) duringthe operational phase of the Tug program. Functional details of themanagement organization are found in Subplan B.
Tug timeline funding for the Tug program ground operations phasereflect the cost of processing the Tug in a factory clean environmentin the VAB. The funding diagrams represent an estimated program costeach year based on 1974 dollar labor rates currently used by theMartin Marietta Corporation and a constant direct labor overhead rateof 110%, which was a NASA-directed rate applied to this study. Dueto different accounting practices, management and administrative rates,overhead and computer unit costs are estimated as if the work wereperformed at Martin Marietta's Denver Data Center for all computercosts shown in the software WBS item. All major material procurementsuch as spares, propellants, and gases were treated as GFE with norates applied. Refer to the Basis for Estimate (Section IVD) fordetails.
Table 1 displays the estimated activation cost differences betweenthe various processing options considered in this study. The costof Option 6 was spread through the DDT&E phase, from 1980 through1983, along with the projected manpower buildup as shown by Tables4 and 5.
73

Deputy Managerj Secretary
S (17) (10) 1 (9) 1 (38)Chief Chief Chief C hiefFacility Test Quality TestSupport Engineering Control Operations
Facility Supervisor - Typist Quality Engr (2) -Test Conductor (2) Safety Engr (2)
-GSE Engineer (2) -Avionics Engineer (2) L Inspectors (6) -PayloadlConfiguration Engr,Bonded Storage Tech (2) -Propulsion Engineer -Avionics Engineer (4)
-Shipping Tech (2) -Struct/Mech/Therm Engr -Propulsion Engr (4)
GSE Techs (2) -Configuration Control Engr -Struct/Mech/Therm Engr (2)Crane Operators (2) - Logistics Engr Avionics Tech (8)
Paint Shop Tech -Programmer/Software Engr Propulsion Tech (8)
Safety Suit Techs (2) .Administrator/Scheduler -Struct/Mech/Therm Tech (8)Tool Crib Attendants (2)
Figure 18 ETR Launch Site Operations Crew Size
(107)*
VerificationManager
Deputy Manager Secretary
(20) (17) (11) (52) (4)Chief Chief Chief ChiefFacility Test Quality Test ChiefSupport Engineering Control Operations Safety
Facility Supervisor -Typist Quality Engineer (2) -Test Conductor (3) SafetySE Engineer (3) -Avionics Engineer (3) Inspectors (8) Avionics Engineer (6) Engineer (3)Bonded Storage Technician (2) Propulsion Engineer (2) Propulsion Engineer (6)Shipping Technician (2) -Structural/Mechanical/ -Structural/Mechanical/GSE Technicians (4) Thermal Engineer (2) Thermal Engineer (3)Crane Operators (2) -Configuration Control -Avionics Technician (10)Paint Shop Technician Engineer (2) Propulsion Technician (13)Safety Technicians (2) Logistics Engineer(2) Structural/Mechanical/Tool Crib Attendant (2) Payload Configuration Thermal Technician (10)
EngineerProgrammer/SoftwareEngineer (2)
Administrator/Scheduler
*Includes WTR Support Personnel
Figure 19 ETR Crew Organization (With WTR Launch CapabiZity)
74 ORIGINAL PAGE IbOF POOR QUALITY

Fleet UtilizationProject Manager
Deputy Manager Secretary
(34) -- - - - ----
ProjectChief- (34) (11) L ( 3)
Manager Engineering/ Logistics Software
Integration Manager Manager
Cost/ I Chief- Transportation/Handling (2) System AalystPerformance - stems Schedular System ProgrammerManaser Typist
Typist
Planner (2) I Systems Design Engineer
Budget Controller (2) Reliabhilitv Engineer Training (4)Timekeeper (2) -Maintainability Ennineer
Report Writer(2) Safety Engineer Instructor (4)Quality EngineerDraftsman Warehouse/Inventory Control (4)
S Secretar (7) Inventory Controller(3) I -Spares Controller
SChief - SchedulerSProject Director - Avionics Typist
Assistan & N Engineer Depot 'laintenanceAssistant Director -Communications EngineerSecretary Electronics Engineer
(9) -Electrical Engineer-Draftsman
Information -Secretarylanager (12) Note: Dotted line is for configuration control.
Chief -Planner - lechanical/Document/Data Controller (3) StructuresPublic Relations
Contractor Data Controller Structures Designer
Typist/Clerk (2) Stress/Dynamics Analyst (2)'laterials/Mass Properties Enpineer (2)
Fleet (1.2) -Thermal Engineer
Utilization Propulsion Engineer (2)Utilization Draftsman (2)Planning Secretary (6)MIanager (6)
-Planner (2) . AdministratorOnsite Liaison (2)System Analyst Procedures/Standards Engineer ORIGINAL PAGESystem Programmer Clerk/Typist (4) G'J-1:JInput Operator OF POOR QPeripheral Equipment Operator
Typist/Clerk (3)
Figure 20 Fleet Utilization Management Organization
75

Table 7 Operations Phase Timeline Funding
Calendar Year
ProjectFunction 1984 1985 1986 1987 1988 1989 1990 1991 Total
Fleet Utiliza- 7.22 7.46 7.64 6.97 6.97 6.75 7.86 i 7.39 58.26tion ProjectManagement
Ground and 5.78 6.21 6.21 5.87 5.87 5.70 6.38 6.21 48.24Launch Opera-tions, ETR
Ground and 0.84 0.60 0.84 0.60 0.60 0.60 0.84 0.60 5.521Launch Opera-tions, WTR
Ground Opera- 13.85 14.2; 14.70 13.44 13.44 13.06 15.08 14.21 112.05tions Total
The total ground operations task yearly funding is shown in Figure 21.The cost fluctuations could be smoothed during the DDT&E phase byrescheduling the construction costs. The minor perturbations in theoperational phase are due to variations in annual launch rates.
30 -
20 --
10
I 1 1 L L 1 I I I I1980 1981 1982 1983 1984 1985 1986 1987 1988 1989 1990 1991
Year
Figure 21 Tug Ground Operations Yearly Funding
76

These data summarize the detailed estimate of all the personnel,material, facilities, GSE, maintenance and travel costs.
Evaluation of site modification costs and maintenance at ETR
and WTR was performed by personnel familiar with the requirements
of these particular sites. Evaluation of the personnel require-
ments at each of the three project functions were made by
engineering personnel familiar with the task requirements peculiar
to the site function. Materials were priced using current known
costs, spares costs were forecast from results of an earlier study.All items were compiled using a computerized cost proposal model
with appropriate overhead rates and factors applied. Refer to the
following compiled data for more detailed information.
The costs relating to the operations phase, defined as the launch of
the first vehicle, are total program costs from January 1984 through
Dbcember 1991. Those costs are shown on Figure 22. The listed WBS
element contains the total cost of each of the WBS elements.
Project Function
Tug Fleet Utilization Project $58.26
Project Management $11.54
System Engineering and Integration 11.89 pLogistics 21.78
Software 13.05
Ground and Launch Operations, ETR 48.24
Site Management 1.83
Facilities 9.13
GSE 2.14
Launch Operations 12.95
Refurbishment and Integration 22.19
Ground and Launch Operations, WTR 5.55Site Management .91Facilities 1.25GSE .46Launch Operations 1.88Refurbishment and Integration 1.05
Total $112.05
Average Cost Flight $ 0.68
Figure 22 Operations Phase Costs 1984-1991
77

The.average cost/flight is derived from the total operations phase costs
and the total number of flights. Comparisons on other basis such as
cost/flight/year will vary the average because the launch rate is not
constant whereas the manpower is constant.
Although the total flights decreased from about 254 last year to 165
this year the cost per flight for ground operations increased onlyslightly. This is because of some significant cost savings that are
realized as a result of improved concepts. For example:
1) Factory clean environment processing costs less than the 100Kclean processing because of elimination of special airlocks onbuildings and continuous maintenance costs of the facilityfiltering system and additional maintenance personnel.Additional maintenance costs alone could run $100,000 peryear.
2) Crew sharing between ETR and WTR to support launches insteadof a full-time crew reduced costs at WTR by almost $5M overthe eight years of operations.
3) Central Tug Processing Facility at ETR reduces the duplicationof .facilities and GSE requirements. Total duplication of thefacility would add nearly $16M to the DDT&E phase costs atWTR.
4) The fleet management approach results in cost savings byproviding continuous monitoring of Tug usage requirement andprojected usage, thus providing advanced planning on sparesprocurement, major modifications to the Tug, and advancedassignment of Tugs to spacecraft with the capability of real-time assignment changes due to vehicle capability analyses.
78
Operation - Total Cost Summary By WBS Element

OPERATIONS - TUG LAUNCH SITE SUPPORT733-R00TOTAL COST SUMMARY BY WBS ELEMENT
WBS ELEMENT DESCRIPTION TOTAL
2C OPERATIONS (GROUND) $ 112,054,292
2C.1A TUG FLEET UTILIZATION/PROJECT MGMT 58,264,035
2C.1A.01 PROJECT MANAGEMENT 11,538,528
2C.1A.01.01 COST/PERFORMANCE MANAGEMENT 3,146,880
2C.1A01.0 2 PROJECT DIRECTION 1,04E,896
'-2C.IA.01.03 INFORMATION MANAGEMENT 3,14b,8b 0
2C.1A.01.04 FLEET UTILIZATION 4,1959872
2C.1A.02 SYSTEMS ENGINEERING E INTEGRATION 11,888,352
2C.IA.02.04 SUSTAINING ENGINEERING 11,888,352
2C.1A.05 LOGISTICS 21,780,203
2C.1A.05.01 TRANSPORTATION C HANDLING 1,139,264
2C.1A.05.02 TRAINING 19398,720
2C.1A.05.03 INVENTORY CONTROL & WAREHOUSING 1,529,832
2C.1A.05.04 DEPOT MAINTENANCE 17,712,387
2C.1A.15 SOFTWARE 13,056,952
2C.1A.15.03 GSE SOFTWARE 13,056,952
2C.1B GROUND E LAUNCH OPERATIONS - ETR 48,240,673
2C.1B.01 SITE MANAGEMENT (ETR) 1,835,424
2C.1B.01.02 PROJECT MANAGEMENT 1,223t424
2C.1B.01.03 INFORMATION MANAGEMENT 612,000
2C.1B.06 FACILITIES - ETR 9t128,832
'U

OPERATIONS - TUG LAUNCH SITE SUPPORT733-RO0TOTAL COST SUMMARY BY WBS E ElNTi .
WBS.ELEME T l DESCRIPTION TOTAL
2C.18.06.03 ETR MAINTENANCE & REFURBISHMENT s 5t152,416
2C*18.06.07 FACILITY OPERATIONS SUPPORT 39976,416
2C.1B.07 GROUND SUPPORT EQUIPMENT - ETR 29141,184
2C.1B.07.02 EASTERN TEST RANGE - GSE 2,1419184
2C.18.10 LAUNCH OPERATIONS - ETR 12,950,108
2C.18.10.01 LAUNCH SITE SERVICES/SUPPORT 1,223,424
2C.1B.10.02 TUG SHUTTLE MATING E CHECKOUT 4,397,472
2C.1B.10.03 PRELAUNCH CHECKOUT & COUNTDOWN 1,450,813
2C.1B.10.04 PROPELLANTS & GASES 2,579,654
o 2C.1B.10.05 POSTFLIGHT SAFING 3,298,745
2C.18.14 REFURBISHMENT C INTEGRATION - ETR 22,185,125
2C.1B.14.01 SCHEDULED MAINTENANCE C REFURBISH 15,327,750
2C.18.14.02 UNSCHEDULED MAINTENANCE C REFURBISH 19070784
2C.1B.14.03 POST MAINTENANCE CHECKOUT 3,170,109
2C.B.1 4.04 TUG/SPACECRAFT MATING C CHECKOUT 2,124,072
2C.IB.14.05 REFURBISHMENT REQUIREMENTS PLANNING 492,410
2C.1C GROUND & LAUNCH OPERATIONS - WTR 5,549,584
2C.1C.01 SITE MANAGEMENT (WTR) 908,832
2C.1C.O01.02 PROJECT MANAGEMENT 606,048
2C.1C.01.03 INFORMATION MANAGEMENT 302,784
2C.1C.06 FACILITIES - WTR 1,245,568

OPERATIONS - TUG LAUNCH SITE SUPPORT733-ROOTOTAL COST SUMMARY BY WBS ELEMENT
WBS ELEMENT DESCRIPTION TOTAL
2C.1C.06.05 WTR MAINTENANCE C REFURBISHMENT $ 942,784
2C.1C.06.08 FACILITY OPERATIONS SUPPORT 302,784
2C.1C.07 GROUND SUPPORT EQUIPMENT -WTR 462,784
2C.1C.07.03 WESTERN TEST RANGE - GSE 462,784
2C.1C.09 LAUNCH OPERATIONS - .WTR t1879,909
2C.1C.09.01 LAUNCH SITE SERVICES/SUPPORT 302,784
2C.1C.09.02 TUG SHUTTLE MATING & CHECKOUT 1,007,666
2C.1C.09.03 PRELAUNCH CHECKOUT & COUNTDOWN 138,831
2C.1C.09.04 PROPELLANTS & GASES 184,261
00 2C.1C.09.05 POSTFLIGHT SAFING 246t367
2C.1C.13 REFURBISHMENT E INTEGRATION - WTR 1,052,491
2C.1C.13.01 SCHEDULED MAINTENANCE E REFURBISH 754,039
2C.1C.13.03 POST MAINTENANCE CHECKOUT 131,901
2C.1C0.13.04 TUG/SPACECRAFT MATING E CHECKOUT 138,831
2C.1C.13.05 REFURBISHMENT REQUIREMENTS PLANNING 27,720
PROPOSAL TOTAL $ 112,054,292

Operation - Operations Total Cost By Year
Opraio Operationsa
Toa Cst ByYa

OPERATIONS - TUG LAUNCH SITE SUPPORT733-ROOOPERATIONS TOTAL COST BY YEAR
MAN MAN LABOR OVERHEAD MATL/S/C OTHER DIR TOTAL CUMULATIVEMO/YR MONTHS HOURS COST COST COST CHARGES GFE M & A AMOUNT AMOUNT
1984 2,449.2 401,664 3,588,070 4,401,346 3,527,358 1,801,580 318,269 214,187 13,850,810 13,850,8101985 2,437.2 399,696 3,568,019 4,344,033 4,051,073 1,727,182 368,522 214,187 14,273,016 28,123,8261986 2,419.2 396,744 3,537,946 4,346,218 4,400,318 1,797,584 402,024 214,187 14,698,277 42,822,1031987 2,419.2 396,744 3,537,947 4,310,961 3,352,785 1,724,782 301,518 214,187 13,442,180 56,264,2831988 2,419.2 396,744 3,537,947 4,310,961 3,352,785 1,724,782 301,518 214,187 13,442,180 69,706,4631989 2,419.2 396,744 3,537,947 4,310,961 3,003,641 1,724,782 268,016 214,187 13,059,534 82,765,9971990 2,419.2 396,744 3,537,946 4,346,218 4,749,362 1,797,584 435,526 214,187 15,080,823 97,846,8201991 2,419.2 396,744 3,537,947 4,310,961 4,051,073 1,724,782 368,522 214,w87 14,207,472 112,054,292PROP.TOTAL 19,401.6 3,181,824 28,383,769 34,681,659 30,488,395 14,023,058 2,763,915 1,713,496 112,054,292
00

Operation - Cost By Project Function By Year (WBS Level PF)
Opraio CotB Proec
Fucto ByYa 5 -ee F

OPERATIONS - TUG LAUNCH SITE SUPPORT733-ROOCOST BY PROJECT FUNCTION BY YEAR 1(BS LEVEL PF)
NO: 2C.1ANAME: TUG FLEET UTILIZATION/PROJECT MGMT
MAN MAN LABOR OVERHEAD MATL/S/C OTHER DIR TOTAL CUMULATIVEMO/YR MONTHS HOURS COST COST COST CHARGES GFE M & A AMOUNT AMOUNT
1984 997.2 163,536 1,666,404 1,833,036 2,014,437 1,495,052 214,187 7,223,116 7t223,1161985 985.2 161,568 1,646,352 1,810,980 2,332,506 1,453,456 214,187 7.457,481 14,680,5971986 967.2 158,616 1,616,280 1,777,908 2,544,552 t1491,056 214.187 7,643,983 22,324,5801987 967.2 158,616 1,616,280 1,777,908 1,908,414 1,451,056 214,187 6,967,845 29,292,4251988 967.2 158,616 1,616,280 1,777,908 1,908,414 1,451,056 214,187 6,967,845 36,260,2701989 967.2 158,616 1,616,280 1,777,908 1,696,368 1,451,056 214,187 6,755,799 43,016,0691990 967.2 158,616 1,616,280 1,777,908 2,756,598 1,491,056 214,187 7,856,029 50,872,0981991 967.2 158,616 1,616,280 1,777,908 2,332,506 1,451,056 214,187 7,391,937 58,264,035
NO: 2C.lBNAME: GROUND E LAUNCH OPERATIONS - ETR
1984 1,314.2 215,530 1,739,328 2,270,462 1,271,969 218,060 284,767 5,784,586 5,784,5861985 1,341.1 219,941 1,774,926 2,315,351 1,546,915 222,520 351,771 6,211,483 11,996,0691986 1,314.2 215,530 1,739,328 2,270,462 1,614,814 218,060 368,522 6,211t186 18,20792551987 1,341.1 219,941 1,774,926 2,315,351 1,272,719 222,520 284,767 5,870,283 24,077,538
oo 1988 1,341.1 219,941 1,774,926 2,315,351 1,272,719 222,520 284,767 5,870,283 29,947t821'a 1989 1,341.1 219,941 1,774,926 2,315,351 1,135,621 222,520 251,265 5,699,683 35,647,504
1990 1,314.2 215,530 1,739,328 2,270,462 1,751,812 218,060 402,024 6,381,686 42,029,1901991 1,341.1 219,941 1,774,926 2,315,351 1,546,915 222,520 351,771 6,211,483 48,240,673
NO: 2C.1CNAME: GROUND C LAUNCH OPERATIONS - WTR
1984 137.8 22,598 182,338 297,848 240,952 88,468 33,502 843t108 843,1081985 110.9 18,187 146,741 217,702 171,652 51,206 16,751 604,052 1,447,1601986 137.8 22,598 182,338 297,848 240,952 88,468 33,502 843,10 2,290,2681987 110.9 18,187 146,741 217,702 171,652 51,206 16,751 604,052 2,894,3201988 110.9 18,187 146,741 217,702 171,652 51,206 16,751 604,052 3,498,3721989 110.9 18,187 146,741 217,702 171,652" 51,206 16,751 604,052 4,102,4241990 137.8 22,598 182,338 297,848 240,952 88,468 33,502 843,108 4,945,5321991 110.9 18,187 146,741 217,702 171,652 51,206 169751 604,052 5,549,584PROP.TOTAL 19,401.6 3,181,824 28,383,769 34,681,659 30,488,395 14,023,058 2,763,915 1,713,496 112,054,292

Operation - Cost By Level 4 WBS By Project Function By Year
-- MI

OPERATIONS - TUG LAUNCH SITE SUPPORT733-R00COST BY LEVEL 4 WBS BY PROJECT FUNCTION BY YEAR
NO: 2C.1A.01NAME: PROJECT MANAGEMENT
MAN MAN LABOR OVERHEAD MATL/SIC OTHER DIR TOTAL CUMULATIVE
MO/YR MONTHS HOURS COST COST COST CHARGES GFE M & A AMOUNT AMOUNT
1984 396.0 64,944 661,764 727,932 52,620 1,442,316 1,442,316
1985 396.0 64,944 661,764 727,932 52,620 1,442,316 2,884,632
1986 396.0 64,944 661,764 727,932 52,620 1,442,316 4,326,948
1987 396.0 64,944 661,764 727,932 52,620 1,442,316 5,769,264
1988 396.0 64,944 661,764 727,932 52,620 1,442,316 7,211,580
1989 396.0 64,944 661,764 727,932 52,620 1,442,316 8,653,896
1990 396.0 649944 661,764 727,932 52,620 1,442,316 10,096,212
1991 396.0 64,944 661,764 727,932 52,620 1,442,316 11,538,528
NO: 2C.1A.02NAME: SYSTEMS ENGINEERING E INTEGRATION
1984 408.0 66,912 681,828 750,012 54,204 1,486,044 1,486,044
1985 408.0 66,912 681,828 750,012 54,204 1,486,044 2,972,088
1986 408.0 66,912 681,828 750,012 54,204 1,486,044 4,458,132
1987 408.0 66,912 681,828 750,012 54,204 1,486,044 5,944,176
1988 408.0 66,912 681,828 750,012 54,204 1,486,044 7,430,220
1989 408.0 66,912 681,828 750,012 54,204 1,486,044 8,916,264
1990 408.0 66,912 681,828 750,012 54,204 1,486,044 10,402,308
1991 408.0 66,912 681,828 750,012 54,204 1,486,044 119888,352
NO: 2C.1A.05NAME: LOGISTICS
1984 156.0 25,584 260,700 286,776 2,014,437 1009724 2,662,637 2,662,637
1985 144.0 23,616 240,648 264,720 2,332,506 59,128 2,897,002 5,559,639
1986 126.0 20,664 210,576 231,648 2,544,552 96,728 3,083,504 8,643,143
1987 126.0 20,664 210,576 231,648 1,908,414 56,728 2,4079366 11,050,509
1988 126.0 20,664 210,576 231,648 1,908,414 56,728 2,407,366 13,457,875
1989 126.0 20,664 210,576 231,648 1,696,368 56,728 2,195,320 15,653,195
1990 126.0 20,664 210,576 231,648 2,756,598 96,728 3,295,550 18,948,745
1991 126.0 20,664 210,576 231648 2,332,506 56,728 2,831,458 21t780,203

OPERATIONS -.,TUG LAUNCH SITE SUPPORT733-R00COST BY LEVEL 4 WBS BY PROJECT FUNCTION BY YEAR
NO: 2C.IA.15NAME: SOFTWARE
MAN MAN LABOR OVERHEAD MATL/S/C OTHER DIR TOTAL CUMULATIVE
MO/YR MONTHS HOURS COST COST COST CHARGES GFE M & A AMOUNT AMOUNT
1984 37.2 6,096 62,112 68,316 1,287,504 214,187 1,632,119 1,632,1191985 37.2 6,096 62,112 68,316 1,287,504 214,187 1,632,119 3,264,238
1986 37.2 6,096 62,112 68,316 1,287,504 214,187 1,632,119 4,896,3571987 37.2 6,096 62,112 68,316 1,287,504 214,187 1,632t119 6,528t4761988 37.2 6,096 62,112 68,316 1,287,504 214,187 1,632t119 8,160,595
1989 37.2 6,096 62,112 68,316 1,287,504 214,187 1,632,119 9,792,7141990 37.2 6,096 62,112 68,316 1,287,504 214,187 ,1,632,119 11,424,833
1991 37.2 6,096 62,112 68,316 1,287,504 214,187 1t632,119 13,056t952NO: 2C.1B.01NAME: SITE MANAGEMENT (EIR)
1984 72.0 11,808 95,292 120,180 2,016 11,940 229,428 229,4281985 72.0 11,808 95,292 120,180 2,016 11,940 229,428 458,856
1986 72.0 11,808 95,292 120,180 2,016 11,940 229,428 688,2841987 72.0 11,808 95,292 120,180 2,016 11,940 229,428 917,712
0o 1988 72.0 11,808 95,292 120,180 2,016 11,940 229,428 19147,140v' 1989 72.0 11,808 95,292 120,180 2,016 11,940 229,428 1,376,568
1990 72.0 11,808 95,292 120,180 2,016 11,940 229,428 1,605,996
1991 72.0 11,808 95,292 120,180 2,016 11,940 229,428 1,835,424NO: 2C.18.06NAME: FACILITIES - ETR
1984 312.0 51,168 412,920 597,728 78,688 51,768 1,141,104 1,141,104
1985 312.0 51,168 412,920 597,728 78,688 51,768 1,141,104 2,282,2081986 312.0 51,168 412,920 597,728 78,688 51,768 1,141,104 3,423,3121987 312.0 51,168 412,920 597,726 78,688 51,768 1,141,104 4,564,4161988 312.0 51,168 412,920 597,728 78,688 51,768 1,141,104 5,705,5201989 312.0 51,168 412,920 597,728 78,688 51,768 1,141,104 6,846,6241990 312.0 51,168 412,920 597,728 78,688 51,768 1,141,104 7,987,7281991 312.0 51,168 412,920 597,726 78,688 51,768 1,141,104 9,128,832

OPERATIONS - TUG LAUNCH SITE SUPPORT733-ROOCOST BY LEVEL 4 WBS BY PROJECT FUNCTION BY YEAR
NO. 2C.1B.07MAME. GROUND SUPPORT EQUIPMENT - ETR
MAN MAN LABOR OVERHEAD MATL/S/C OTHER DIR TOTAL CUMULATIVEMO/YR MONTHS HOURS COST COST COST CHARGES GFE M & A AMOUNT AMOUNT
1984 84.0 13,776 111,168 140,196 2,340 13,9441985 84.0 13,776 111,168 140,196 2340 13,944 267,648 535,2961987 84.0 13,776 111,168 140,196 2,340 13,944 267,648 802,9441988 84.0 13,776 111,168 140,196 2,340 13,944 267,648 1,070,5921989 84.0 13,776 111,168 140,196 2,340 13,944
267,648 1,338,2401990 84.0 13,776 111,168 140,196 2,340 13,944 267,648 1,6058881990 84.0 13,776 111,168 140,196 2,340 13,944 267,648 1,873,536NO: 2C1B10 2679648 2141,184NAME: LAUNCH OPERATIONS - ETR
1984 395.4 64,846 523,316 659,920 11,026 65,606 284,767 1,544,635 1,544,6351985 413.7 67,847 547,534 690,458 11,537 68,641 351,771 1.6699941 3,214,5761986 395.4 64,846 523,316 659,920 11,026 65,606 368,522 1,628,390 4,842,9661987 413.7 67,847 547,534 690,458 11,537 68,641 284,767 1,602,937 6,445,903
S1988 413.7 67,847 547,534 690,458 11,537 68,641 284,767 1,602,937 8,048,8401989 413.7 67,847 547,534 690,458 11,537 68,641 251,265 1,569,435 9,6182751990 395.4 64,846 523,316 659,920 11,026 65,606 402,024 1,661,892 11,280,1671991 413.7 67,847 547,534 690,458 11,537 68,641 351771 1,669941 12950,108NO: 2C.B.14
NAME: REFURBISHMENT C INTEGRATION - ETR
1984 450.8 73,932 596632- 752,438 1,177,899 74,802 2,601,771 2,601,7711985 4594. 75,342 608,012 766,789 1,452,334 76,227 2,903.362 5,505,1331986 450.8 73,932 596,632 752,438 1,520,744 74,802 2,9034362 585051331987 459.4 75,342 608,012 766,789 1,178,138 76,227 2,629,16 841107849151988 459.4 75,342 608,012 766,789 191789138 76,227 2,629,166 13,708,0811989 459.4 75,342 608,012 766,789 1,041,040 76,227 2,4929068 16,2001491990 450.8 73,932 596,632 752,438 1,657,742 74,802 392081614 19,28007631991 459.4 75,342 608,012 766,789 1,452,334 76,227 39033621 192818512632r903,362 22.185125

OPERATIONS - TUG LAUNCH SITE SUPPORT733-R00COST BY LEVEL 4 WBS BY PROJECT FUNCTION BY YEAR
NO: 2C.1C.01NAME: SITE MANAGEMENT (WTR)
MAN MAN LABOR OVERHEAD MATL/S/C OTHER DIR TOTAL CUMULATIVE
.MO/YR MONTHS HOURS COST COST COST CHARGES GFE M & A AMOUNT AMOUNT
1984 36.0 5,904 47,640 58,980 1,008 5,976 113,604 113,604
1985 36.0 5,904 47,640 58,980 1,006 5,976 113,604 227,208
1986 36.0 5,904 47,640 58,980 1,00E 5,976 113,604 340,812
1987 36.0 5,904 47,640 58,980 1,008 5,976 113,604 454,416
1988 36.0 5,904 47,640 58,980 1,008 5,976 113,604 568,020
1989 36.0 5,904 47,640 5E,960 1,008 5,976 113,604 681,624
1990 36.0 5,904 47,640 58,980 1,00 5,976 113,604 795,228
1991 36.0 5t,904 47,640 58,980 1,00 5,976 113,604 908,832
NO: 2C.IC.06NAME: FACILITIES - WTR
1984 24.0 3,936 31,752 39,288 80,672 3,984 155,696 155,696
1985 24.0 3,936 31,752 39,288 80,672 3,984 155,696 311,392
1986 24.0 3,936 31,752 39,288 80,672 3,984 155,696 467,088
1987 24.0 3,936 31,752 39,288 80,672 3,984 155,696 622,784
00 1988 24.0 3,936 31,752 39,288 80,672 3,984 155,696 778,480
1989 24.0 3,936 31,752 39,288 80,672 3,984 155,696 934t176
1990 24.0 3,936 31,752 39,288 80,672 3,984 155,696 1,089,872
1991 24.0 3,936 31,752 39,288 80,672 3,984 155,696 1,245,568
NO: 2C.1C.07NAME: GROUND SUPPORT EQUIPMENT -WTR
1984 12.0 1,968 15,876 19,644 20,336 1,992 57v848 579848
1985 12.0 1,968 15,876 19,644 20,336 1,992 57,848 115,696
1986 12.0 1,968 15,876 19,644 20,336 1,992 57,848 173,544
1987 12.0 1,968 15,876 19,644 20,336 1,992 57,848 231,392
1988 12.0 1,968 15,876 19,644 20,336 1,992 57,848 289,240
1989 12.0 1,968 15,876 19,644 20,336 1,992 57,848 347,088
1990 12.0 1,968 15,876 19,644 20,336 1,992 57,848 404,936
1991 12.0 1,968 15,876 19,644 20,336 1.992 57,848 462,784

OPERATIONS - TUG LAUNCH SITE SUPPORT733-R00COST BY LEVEL 4 WBS BY PROJECT FUNCTION BY YEAR
NO: 2C.1C.09NAME: LAUNCH OPERATIONS - WTR
MAN MAN LABOR OVERHEAD MATL/S/C OTHER DIRMO/YR MONTHS HOURS COST COST COST CHARGES GFE T M& AMOUNT AMOUNT
1984 48.6 7,970 64312 151762 19358 739664 339502 324598 3245981985 30.3 49969 40,094 85,703 847 37,828 16,751 181,223 5058211986 48.6 7,970 64,312 151,762 1,358 73,664 33,502 324t598 83014191987 30.3 4,969 40,094 85,703 847 37,828 16,751 181t223 1,011,6421988 30.3 4,969 40,094 85,703 847 37,828 16,751 181223 1,1928651989 30.3 4,969 40,094 85,703 847 37,828 16,751 181,223 1,374,0881990 48.6 7,970 64,312 151,762 1,358 73,664 33,502 324,598 1,698,6861991 30.3 4,969 40,094 85,703 847 37,828 16,751 81223 8 0NO: 2C.C.13 181223 1,87909
NAME: REFURBISHMENT E INTEGRATION - WTR
1984 17.2 2,820 22,758 28,174 137,578 2,852 191,362 191,3621985 8.6 1,410 11,379 14,087 68,789 1,426 95,681 28790431986 17.2 2,820 22,758 28,174 137,578 2,852 191,362 4781,051987 8.6 1,410 11,379 14,087 68,789 1,426 95681 57405
0 1988 8.6 1,410 11,379 14,087 68,789 1,426 95,681 669,7671989 8.6 1,410 11,379 14,087 68,789 1,426 95,681 765,4481990 17.2 2,820 22,758 28,174 137,578 2,852 95681 79564481991 8.6 1,410 11,379 14,087 68,789 1,426 191362 956,810PROP.95,681 105291TOTAL 19,401.6 3,181,824 28,383,769 34,681,659 30,488,395 14,023,058 2,763,915 197139496 112,054,292

Operation - Cost By WBS By Project Function By Year (WBS Level 5)
i s S BS. o-c ruciu - Yer S- L T5

OPERATIONS - TUG LAUNCH SITE SUPPORT733-ROOCOST BY WBS BY PROJECT FUNCTION BY YEAR (WBS LEVEL 5)
NC: 2C.1A.01.01NAME: COST/PERFORMANCE MANAGEMENT
MAN MAN LABOR OVERHEAD MATL/S/C OTHER DIR TOTAL CUMULATIVE
MO/YR MONTHS HOURS COST COST CCST CHARCES GFE M&A AMOUNT AMOUNT
1984 108.0 17,712 180,480 198,528 14,352 3939360 393,360
1985 108.0 17,712 180,480 198,528 14,352 393,360 786,720
1986 I08.0 17,712 180,480 198,528 14,352 393,360 1,180,080
1987 108.0 17,712 180,460 198,528 14,352 393,360 1,573440
1988 108.0 17,712 180,480 198,528 14,352 393,360 1,966,800
1989 108.0 17,712 180,480 198,528 14,352 393,360 2,360,160
1990 108.0 17,712 180,480 198,528 14,B52 393,360 2,753,520
1991 108.0 17,712 180,480 198,528 14,352 393,360 3,146,880
NO: 2C.IA.01.02NAME: PROJECT DIRECTION
1984 36.0 5,904 60,156 66,168 4,788 131t112 131,112
1985 36.0 5,904 60,156 66,166 4,78k 131,112 262,224
1986 36.0 5,904 60,156 66,168 4,788 131,112 393,336
1987 36.0 5,904 60,156 66,168 49788 131,112 524,448
1988 36.0 5,904 60,156 66,168 4,788 131,112 655,560
00 1989 36.0 5,904 60,156 66,168 4,788 131,112 786,672
1990 36.0 5,904 60,156 66,168 4,788 131,112 917,784
1991 36.0 5,904 60,156 66,168 4,788 131,112 1,048,896
NO: 2C.1A.01.03NAME: INFORMATION MANAGEMENT
1984 108.0 17,712 180,480 198,528 14,352 393,360 393,360
1985 108.0 17,712 1E0,480 198,528 14,352 393,360 786,720
1986 108.0 17,712 180,480 198,528 14,352 393,360 1,180,080
1987 108.0 17,712 180,480 198,528 14,352 393,360 1,573,440
1988 108.0 17,712 180,480 198,528 14,352 393,360 1,966,800
1989 108.0 17,712 180,480 198,528 14,352 393,360 2,360,160
1990 108.0 17,712 180,480 198,528 14,352 393,360 2,753,520
1991 108.0 17,712 180,480 198,528 14,352 393,360 3,146,880

OPERATIONS - TUG LAUNCH SITE SUPPORT733-ROOCOST BY WBS BY PROJECT FUNCTION BY YEAR (WBS LEVEL 5)
NO: 2C.1A.01.04NAME: FLEET UTILIZATION
MAN MAN LABOR OVERHEAD MATL/S/C OTHER DIR TOTAL CUMULATIVEMO/YR MONTHS HOURS COST COST COST CHARGES GFE M&A AMOUNT AMOUNT
1984 144.0 23,616 240,648 264,708 19,128 524,484 524,4841985 144.0 23,616 240,648 264,708 19,128 524,484 1,048,9681986 144.0 23,616 240,648 264,708 19,128 524,484 1,573,4521987 144.0 23,616 240,648 264,708 19,128 524,484 2,097,9361988 144.0 23,616 240,648 264,708 19,128 524,484 2,622,4201989 144.0 23,616 240,648 264,708 19,128 524,484 3,146,9041990 144.0 23,616 240,648 264,708 19,128 524,484 3,671,3881991 144.0 23,616 240,648 264,708 19,128 524,484 4,195,872
NO: 2C.1A.02.04NAME: SUSTAINING ENGINEERING
1984 408.0 66,912 681,828 750,012 54,204 1,486,044 1,486,0441985 408.0 66,912 681,828 750,012 54,204 1,486,044 2,972,0881986 408.0 66,912 681,828 750,012 54,204 1,486,044 4,458,1321987 408.0 66,912 661,828 750,012 54,204 1,486,044 5,944,1761988 408.0 66,912 681,828 750,012 54,204 1,486,044 7,430,220
C 1989 408.0 66,912 681,828 750,012 54,204 1,486,044 8,916,2641990 408.0 66,912 681,828 750,012 54,204 1,486,044 10,402,3081991 408.0 66,912 681,828 750,012 54,204 1,486,044 11,888,352
NO: 2C.1A.05.01NAME: TRANSPORTATION E HANDLING
1984 24.0 3,936 40,104- 44,112 83,192 167,408 167,4081985 24.0 3,936 40,104 44,112 43,192 127,408 294,8161986 24.0 3,936 40,104 44,112 83,192 167,408 462,2241987 24.0 3,936 40,104 44,112 43,192 127,408 589,6321988 24.0 3,936 40,104 44,112 43,192 127,408 717,0401989 24.0 3,936 40,104 44,112 43,192 127,408 844,4481990 24.0 3,936 40,104 44,112 83,192 167,408 1,011,8561991 24.0 3,936 40,104 44,112 43,192 127,408 1,139,264

OPERATIONS - TUG LAUNCH SITE SUPPORT733-ROOCOST BY WES .BY PROJECT FUNCTION BY YEAR (WBS LEVEL 5)
NO: 2C.1A.05.02NAME: TRAINING
MAN MAN LABOR OVERHEAD MATL/S/C OTHER DIR TOTAL CUMULATIVE
MO/YR MONTHS HOURS COST COST COST CHARGES GFE M&A AMOUNT AMOUNT
1984 4e.0 7,872 809220 88,248 6,372 174,840 174,840
1985 48.0 7,872 80,220 88,248 6,372 174,840 349,680
1986 48.0 7,872 80,220 88,248 6,372 174,840 524,520
1987 48.0 7,872 80,220 88,248 6,372 174,840 699,360
1988 48.0 7,872 80,220 88,248 6,372 174,840 874,200
1989 48.0 7,872 80,220 88,248 6,372 174,840 1,049,040
1990 48.0 7,872 80,220 88,248 6,372 174,840 19223,880
1991 48.0 7,872 80,220 88,248 6,372 174,840 1,398,720
NO: 2C.1A.05.03NAME: INVENTORY CONTROL C WAREHOUSING
1984 72.0 11,808 120,324 132,360 9,564 262,248 262,248
1985 60.0 9,840 100,272 110,304 7,968 218,544 480,792
1986 48.0 7,872 80,220 88,248 6,372 174,840 655t632
1987 48.0 7,872 80,220 88,248 6,372 174,840 830,472
1988 48.0 7,872 0,220 88,248 6,372 174,840 1,005,312
1989 48.0 7,872 80,220 88,248 6,372 174,840 1,180,152
1990 48.0 7,872 80,220 88,2468 6,372 174,840 1,354,992
1991 48.0 7,872 80,220 88,248 6,372 174,840 1,529,832
NO: 2C.1A.05.04NAME: DEPOT MAINTENANCE
1984 12.0 1,968 20,052 22,056 2,014,437 1,596 2,058,141 2,058,141
1985 12.0 1,968 20,052 22,056 2,332,506 1,596 2,376,210 4,434,351
1986 6.0 984 10,032 11,040 2,544,552 792 2,566,416 7,000,767
1987 6.0 984 10,032 11,040 1,908,414 792 1,930,278 8,931,045
1988 6.0 984 10,032 11,040 1,908,414 792 1,930,278 10,861,323
1989 6.0 984 10,032 11,040 1,696,368 792 1,718,232 12,579,555
1990 6.0 984 10,032 11,040 2,756,598 792 2,778,462 15,358,017
1991 6.0 984 10,032 11,040 2,332,506 792 2,354,370 17,712,387

OPERATIONS - TUG LAUNCH SITE SUPPORT733-RO00COST BY WBS BY PROJECT FUNCTION BY YEAR (wBS LEVEL 5)
NO: 2C.1A.15.03NAME: GSE SOFTWARE
MAN MAN LABOR OVERHEAD MATL/S/C OTHER DIR TOTAL CUMULATIVEMO/YR MONTHS HOURS COST COST COST CHARGES GFE M&A AMOUNT AMOUNT
1984 37.2 6,096 62,112 68,316 1,2e7,504 214,187 1,632,119 1,632,1191985 37.2 6,096 62,112 68,316 1,287,504 214,187 1,632,119 3,26492381986 37.2 6,096 62,112 68,316 1,287,504 214,187 1,632,119 4,896,3571987 37.2 6,096 62,112 68,316 1,287,504 214,187 1,632,119 6,528,4761988 37.2 6,096 62,112 68,316 1,287,504 214,187 1,632t119 6,160,5951989 37.2 6,096 62,112 68,316 1,287,504 214,187 1,632,119 9,792,7141990 37.2 6,096 62,112 68,316 1,287,504 214,187 1,632,119 11,424,8331991 37.2 6,096 62,112 68,316 1,287,504 214,187 1,632,119 13,056,952
NO: 2C.1B.01.02NAME: PROJECT MANAGEMENT
1984 48.0 7,872 63,528 80,100 1,344 7,956 152,928 152,9281985 48.0 7,872 63,528 .80,100 1,344 7,956 152,928 305,8561986 48.0 7,872 63,526 80,100 1,344 7,956 152,928 458,7841987 48.0 7,872 63,528 80,100 1,344 7,956 152,928 611,712
S1988 48.0 7,872 63,528 80,100 1,344 7,956 152,928 764,6401989 48.0 7,872 63,528 80,100 1,344 7,956 152,928 917,5681990 48.0 7,872 63,528 80,100 1,344 7,956 152,928 1,070,4961991 48.0 7,872 63,528 80,100 1,344 7,956 152,928 1,2239424
NO: 2C.1B.01.03NAME: INFORMATION MANAGEMENT
1984 24.0 3,936 31,764 40,080 672 3,984 76,500 76,5001985 24.0 3,936 319764 40,080 672 3,984 76,500 153,0001986 24.0 3,936 31,764 40,080 672 3,984 76,500 229,5001987 24.0 3,936 31,764 40,080 672 3,984 76,500 30690001988 24.0 3,936 31,764 40,080 672 3,984 76,500 382,5001989 24.0 3,936 31,764 40,080 672 3,984 76,500 459,0001990 24.0 3,936 31,764 40,080 672 3,984 76,500 535,5001991 24.0 3,936 31,764 40,080 672 3,984 76,500 612,000

OPERATIONS - TUG LAUNCH SITE SUPPORT733-R00COST BY WBS BY PROJECT FUNCTION BY YEAR (WBS LEVEL 5)
NO: 2C.1B.06.03NAME: ETR MAINTENANCE & REFURBISHMENT
MAN MAN LABOR OVERHEAD MATL/S/C OTHER DIR TOTAL CUMULATIVEMO/YR MONTHS HOURS COST COST COST CHARGES GFE M&A AMOUNT AMOUNT
1984 156.0 25,584 206,460 337,364 74,344 25,884 644,052 644,0521985 156.0 25,584 206,460 337,364 74,344 25,884 6449052 1,288,1041986 156.0 25,584 206,460 337,364 74,344 25,884 644,052 1,932,1561967 156.0 25,584 206,460 337,364 74,344 25,884 644,052 2v576,2081988 156.0 25,584 206,460 337,364 74,344 25,884 644,052 3,220,2601989 156.0 25.584 206,460 337,364 74,344 25,884 644,052 3,864,3121990 156.0 25,584 206,460 337,364 74,344 25,884 644,052 4,508,3641991 156.0 25,584 206,460 337,364 74,344 25,884 644,052 5,152,416
NO: 2C.16.06.07NAME: FACILITY OPERATIONS SUPPORT
1984 156.0 25,584 206,460 260,364 4,344 25,884 497,052 497,0521985 156.0 25,584 206,460 260,364 4,344 25,884 497,052 99491041986 156.0 25,584 206,460 260,364 4,344 25,884 497,052 1,49191561987 156.0 25,584 206,460 260,364 4,344 25,884 497,052 1,988t2081988 156.0 25,584 206,460 260,364 4,344 25,884 497,052 2,485,2601989 156.0 25,584 206,460 260,364 4,344 25,884 497,052 2,982,3121990 156.0 25,584 206,460 260,364 4,344 25,884 4979052 3,479,3641991 156.0 25,584 206,460 260,364 4,344 25,884 497,052 3,976,416
NO: 2C.1B.07.02NAME: EASTERN TEST RANGE - GSE
1984 84.0 13,776 111,168 140,196 2,340 13,944 267,648 267,6481985 84.0 13,776 111,168 140,196 2,340 13,944 267,648 535,2961986 84.0 13,776 111,168 140,196 2,340 13t944 267,648 802,9441987 84.0 13,776 111,168 140,196 2,340 13,944 267,648 1,070,5921988 84.0 13,776 111,168 140,196 2,340 13,944 267,648 1,338,2401989 84.0 13,776 111,168 140,196 2,340 13,944 267,648 1,605,8881990 84.0 13,776 111,168 140,196 2,340 13,944 267,648 1,873,5361991 84.0 13,776 111,168 140,196 2,340 13,944 267,648 2,141,184

OPERATIONS - TUG LAUNCH SITE SUPPORT733-R00COST BY WBS BY PROJECT FUNCTION BY YEAR (WBS LEVEL 5)
NO: 2C.1B.10.01NAME: LAUNCH SITE SERVICES/SUPPORT
MAN MAN LABOR OVERHEAD MATL/S/C OTHER DIR TOTAL CUMULATIVE
MO/VR MONTHS HOURS COST COST COST CHARGES GFE M&A AMOUNT AMOUNT
1984 48.0 7,872 63,528 80,100 1,344 7,956 152,928 152,928
1985 48.0 7,872 63,528 80,100 1,344 7,956 152,928 305,856
1986 48.0 7,872 63,528 80,100 1,344 7,956 152,928 458,784
1987 48.0 7,872 63,528 80,100 1,344 7,956 152,928 611,712
1988 48.0 7,872 63,528 80,100 1,344 7,956 152,928 764,640
1989 48.0 7,872 63,528 80,100 1,344 7,956 152,928 917,568
1990 48.0 7,872 63,528 80,100 1,344 7,956 152,928 1,070,496
1991 48.0 7,872 63,528 80,100 1,344 7,956 152,928 1,223,424NO: 2C.1B.10.02NAME: TUG SHUTTLE MATING C CHECKOUT
1984 168.0 27,554 222,366 280,416 4,686 27,876 535,344 535,344
1985 175.2 28,735 231,897 292,434 4,887 29,070 558,288 1,093,6321986 168.0 27,554 222,366 280,416 4,686 27,876 535,344 1,628,976
1987 175.2 28,735 231,897 292,434 4,887 29,070 558,288 2,187,264
1988 175.2 28,735 231,897 292,434 4,887 29,070 5589288 2,745,552
1989 175.2 28,735 231,897 292,434 4,887 29,070 558,288 3,303,840
1990 168.0 27,554 222,366 280,416 4,686 27,876 535,344 3,839,184
1991 175.2 28,735 231,897 292,434 4,887 29,070 558,288 4,397,472NO: 2C.1B.10.03NAME: PRELAUNCH CHECKOUT t COUNTDOWN
1984 54.4 8,924 72,020' 90,820 1,516 9,030 173,386 173,386
1985 58.4 9,580 77,314 97,496 1,628 9,693 186,131 359,517
1986 54.4 8,924 72,020 90,820 1,516 9,030 173,386 532,903
1987 58.4 9,580 77,314 97,496 1,628 9,693 186,131 719,034
1988 58.4 9,580 77,314 97,496 1,628 9,693 186,131 905,165
1989 58.4 9,580 77,314 97,496 1,628 9,693 186,131 1,091,296
1990 54.4 8,924 72,020 90,820 1,516 9,030 173,386 1,264,6821991 58.4 " 9,580 77,314 97,496 1,628 9,693 186,131 1,450,813

OPERATIONS - TUG LAUNCH SITE SUPPORT733-ROOCOST BY WBS BY PROJECT FUNCTION BY YEAR (WBS LEVEL 5)
NO: 2C.16.10.04NAME: PROPELLANTS E GASES
MAN MAN LABOR OVERHEAD MATL/S/C OTHER DIR TOTAL CUMULATIVE
MO/YR MONTHS HOURS COST COST COST CHARGES GFE M&A AMOUNT AMOUNT
1984 284,767 284,767 284,767
1985 351,771 351,771 636,538
1986 368,522 368,522 1,005,060
1987 284,767 284,767 1,289,827
1988 284,767 284,767 1,574,594
1989 251v265 251,265 1,825,859
1990 402,024 402,024 2,227,883
1991 351,771 351,771 2t579,654NO: 2C.1B.10.05NAME: POSTFLIGHT SAFING
1984 125.0 20,496 165,402 208,5E4 3,480 20,744 398,210 398,210
1985 132.1 21,660 174,795 220,428 3,678 21,922 420,823 819,033
1986 125.0 20,496 165,402 208,584 3,480 20,744 398,210 1,217,243
1987 132.1 21,660 1749795 220,428 3,678 21,922 420,823 1,638,066
O 1988 132.1 21,660 174,795 220,428 3,67E 21,922 420,823 2,058,889
1989 132.1 21,660 174,795 220,428 3,678 21,922 420,823 2,479,712
1990 125.0 20,496 165,402 208,584 3,480 20,744 398,210 2,877,922
1991 132.1 21,660 174,795 220,428 3,678 21,922 420,823 3,298,745NO: 2C.18.14.01NAME: SCHEDULED MAINTENANCE E REFURBISH
1984 187.2 30,696 247,716 312,396 1,170,553 31,056 1,761,721 1,761,721
1985 187.2 30,696 247,716 312,396 1,444,749 31,056 2,035,917 3,797,638
1986 187.2 30,696 247,716 312,396 1,513,398 31,056 2,104,566 5,902,204
1987 187.2 30,696 247,716 312,396 1,170,553 31,056 1,761,721 7,663,925
1988 187.2 30,696 247,716 312,396 1,170,553 31,056 1,761,721 9,425,646
1989 187.2 30,696 247,716 3129396 1,033,455 31,056 19624,623 11,050,269
1990 187.2 30,696 247,716 312,396 1,650,396 31,056 2,241,564 13,291,833
1991 187.2 30,696 247,716 312,396 1,444,749 31,056 2,035,917 15,327,750

uPEKAll u-Z - lU LAL 'LH -IIE 4L uRI733-RO0COST BY WBS BY PROJECT FUNCTION BY YEAR (WBS LEVEL 5)
NO: 2C.1B.14.02NAME: UNSCHEDULED MAINTENANCE t REFURBISH
MAN MAN LABOR OVERHEAD MATL/S/C OTHER DIR TOTAL CUMULATIVEMO/YR MONTHS HOURS COST COST COST CHARGES GFE M&A AMOUNT AMOUNT
1984 42.0 6,888 55,584 70,116 1,176 69972 133,848 133,8481985 42.0 6,888 55,584 70,116 1,176 6,972 133,848 267,6961986 42.0 6,888 55,584 70,116 1,176 6,972 133,848 401,5441987 42.0 6,888 55,584 70,116 1,176 6,972 133,848 535,3921988 42.0 6,888 55,584 70,116 1,176 6,972 133,848 669,2401989 42.0 6,888 55,584 70,116 1,176 6,972 133,848 803,0881990 42.0 6,888 55,584 70,116 1,176 6,972 133,848 936,9361991 42.0 6,888 55,584 70,116 1,176 6,972 133,848 1,070,784
NO: 2C.1B.14.03NAME: POST MAINTENANCE CHECKOUT
1984 122.0 20,006 161,448 203,606 3,400 20,244 388,698 388,6981985 125.8 20,629 166,476 209,947 3,506 20,874 400,803 789,5011986 122.0 20,006 161,448 203,606 3,400 20,244 388,698 1,178,1991987 125.8 20,629 166,476 2099947 3,506 20,874 400,803 1,579,0021988 125.8 20,629 166,476 209,947 3,506 20,874 400,803 1,979,8051989 125.8 20,629 166,476 209,947 3,506 20,874 400,803 2,380,6081990 122.0 20,006 161,448 203,606 3,400 20,244 388,698 2,769,3061991 125.8 20,629 166,476 2099947 3,506 20,874 400,803 3,170,109
NO: 2C.1B.14.04NAME: TUG/SPACECRAFT MATING E CHECKOUT
1984 80.8 13,256 106,976 134,908 2,250 13,410 257,544 257,5441985 84.8 13,912 112,270 141,584 2,361 14,073 270,288 527,8321986 80.8 13,256 106,976 134,908 2,250 13,410 257,544 785,3761987 84.8 13,912 112,270 141,584 2,361 14,073 270,288 1,055,6641988 84.8 13,912 112,270 141,584 2,361 14,073 270,288 1,325,9521989 84.8 13,912 112,270 141,584 2,361 14,073 270,288 1,596,2401990 80.8 13,256 106,976 134,908 2,250 13,410 257,544 1,853,7841991 84.8 13,912 112,270 141,584 2,361 14,073 270,288 2,124,072

OPERATIONS - TUG LAUNCH SITE SUPPORT733-R00COST BY WBS BY PROJECT FUNCTION BY YEAR (WBS LEVEL 5)
NO: 2C.18.14.05NAME: REFURBISHMENT REQUIREMENTS PLANNING
MAN MAN LABOR OVERHEAD MATL/S/c OTHER DIR TOTAL CUMULATIVEMO/YR MONTHS HOURS COST COST COST CHARGES GFE M&A AMOUNT AMOUNT
1984 18.8 3,086 24,908 31,412 520 3,120 59,960 59,9601985 19.6 3,217 25,966 32,746 542 3,252 62,506 122,4661986 18.8 3,086 24,908 31,412 520 3,120 59e960 182,4261987 19.6 3,217 25,966 32,746 542 3,252 62,506 244,9321988 19.6 3,217 25,966 32,746 542 3,252 629506 307,4381989 19.6 3,217 25,966 32,746 542 3,252 62,506 369,9441990 18.8 3,086 24,908 31,412 520 3,120 59,960 429,9041991 19.6 3,217 25,966 32,746 542 3,252 62,506 492,410
NO: 2C.1C.01.02NAME: PROJECT MANAGEMENT
1984 24.0 3,936 31,764 39,336 672 3,984 75,756 75,7561985 24.0 3,936 31,764 39,336 672 3,984 75,756 151,5121986 24.0 3,936 31,764 39,336 672 3,984 75,756 227,2681987 24.0 39936 31,764 39,336 672 3,984 75,756 303,0241988 24.0 3,936 31,764 39,336 672 3,984 75,756 378,7801989 24.0 3,936 31,764 39,336 672 3,984 75,756 454,5361990 24.0 3,936 31,764 39,336 672 3,984 75,756 530,2921991 24.0 3,936 31,764 39,336 672 3,984 75,756 606,048
NO: 2C.1C.01.03NAME: INFORMATION MANAGEMENT
1984 12.0 1,968 15,876 19,644 336 1,992 37,848 37,8481985 12.0 1,968 15,876 19,644 336 1,992 37,848 75,6961986 12.0 1,968 15,876 19,644 336 1,992 37,848 113,5441987 12.0 1,968 15,876 19,644 336 1,992 37,848 151,3921988 12.0 1,968 15,876 19,644 336 1,992 37,848 18992401989 12.0 1,968 1l,876 19,644 336 1,992 37,848 227,0881990 12.0 1,968 15,876 19,644 336 19992 37,848 264,9361991 12.0 1,968 15,876 19,644 336 1,992 37,848 302,784

OPERATIONS - TUG LAUNCH SITE SUPPORT733-R00COST BY WBS BY PROJECT FUNCTION BY YEAR (WBS LEVEL 5)
NO: 2C.1C.06.05NANE: WTR MAINTENANCE E REFURBISHMENT
MAN MAN LABOR OVERHEAD MATL/S/C- OTHER DIR TOTAL CUMULATIVE
4O/YR MONTHS HOURS COST COST COST CHARGES GFE M&A AMOUNT AMOUNT
1984 12.0 1,968 15,876 19,644 80,336 1,992 117,848 117,8481985 12.0 1,968 15,876 19,644 80,336 1,992 117,848 235,6961986 12.0 1,968 15,876 19,644 80,336 1,992 117,848 353,5441987 12.0 1,968 15,876 19,644 80,336 1,992 117,848 471,3921988" 12.0 1,968 15,876 19,644 80,336 1,992 117,848 589,240
1989 12.0 1,968 15,876 19,644 80,336 1,992 117,848 707.0881990 12.0 1,968 15,876 19,644 80,336 1,992 117,848 824,9361991 12.0 1,968 15,876 19,644 80,336 1,992 117,848 942,784
NO: 2C.1C.06.08NAME: FACILITY OPERATIONS SUPPORT
1984 12.0 1,968 15,876 19,644 336 1,992 37,848 37,8481985 12.0 1,968 '15,876 19,644 336 1,992 37,848 75,6961986 12.0 1,968 15,876 19,644 336 19992 37,848 11395441987 12.0 1,968 15,876 19,644 336 1,992 37,848 151,392
'0 1988 12.0 1,968 15,876 19,644 336 1,992 37,848 189,240
oo 1989 12.0 1,968 15,876 19,644 336 1,992 37,848 22790881990 12.0 1,968 15,876 19,644 336 1,992 37,848 264,9361991 12.0 1,968 15,876 19,644 336 1,992 379848 302,784
NO: 2C.1C.07.03NAME: WESTERN TEST RANGE - GSE
1984 12.0 1,968 15.,876 19,644 20,336 1,992 57,848 57,848
1985 12.0 1,968 15,876 19,644 20,336 1,992 57,848 115,696
1986 12.0 1,968 15,876 19,644 20,336 1,992 57,848 17395441987 12.0 1,968 15,876 19,644 20,336 1,992 57,848 231,392
1988 12.0 1,968 15,876 19,644 20,336 • 1,992 57.848 289.2401989 12.0 1,968 15,876 19,644 20,336 1,992 57,848 347,088
1990 12.0 1,968 15,876 19,644 20,336 1,992 57,848 404,9361991 12.0 1,968 15,876 19,644 20,336 1,992 57,848 462.784

OPERATIONS - TUG. LAUNCH SITE SUPPORT733-ROOCOST BY WES EY PROJECT FUNCTION BY YEAR (WBS LEVEL 5)
NO: 2C.1C.09.01NAME: LAUNCH SITE SERVICES/SUPPORT
MAN MAN LABOR OVERHEAD M1TL/S/C OTHER DIR TOTAL CUMULATIVEMO/YR MONTHS HOURS COST COST COST CHARGES GFE M&A AMOUNT AMOUNT
1984 12.0 19968 15,876 19,644 336 1,992 37,848 37,8481985 12.0 19968 15,876 19,644 336 1,992 37,848 75,6961986 12.0 19968 15,876 19,644 336 19992 37,848 113,5441987 12.0 1,968 15,876 19,644 336 1,992 37,848 151,3921988 12.0 1,968 15,876 19,644 336 1,992 37,848 189,2401989 12.0 1,968 15,876 19,644 336 1,992 37,848 227,0881990 12.0 19968 15,876 19,644 336 1,992 37,848 264,9361991 12.0 1,968 15,876 19,644 336 19992 37,848 302,784
NO: 2C.1C.09.02NAME: TUG SHUTTLE MATING E CHECKOUT
1984 14.4 2,362 199062 95,758 402 67,990 183,212 183,2121985 7.2 1,181 9,531 47,879 201 33,995 91,606 274,8181986 14.4 2,362 19,062 95,758 402 67,990 183,212 458,0301987 7.2 1,181 9,531 47,879 201 33,995 91,606 549,636
o 1988 7.2 1,181 9,531 47,879 201 33,995 91,606 641,2421989 7.2 1,181 9,531 47,879 201 33,995 91,606 732,8481990 14.4 2,362 19,062 95,758 402 67,990 183,212 916,0601991 7.2 1,181 9,531 47,879 201 33,995 91,606 1,007,666
NO: 2C.1C.09.03NAME: PRELAUNCH CHECKCUT & COUNTDOWN
1984 8.0 1,312 10,588 13,104 224 1,326 25,242 25,2421985 4.0 656 5,294 6,552 112 663 12,621 37,8631986 8.0 1,312 10,588 13,104 224 1,326 25,242 63,1051987 4.0 656 5,294 6,552 112 663 12,621 75,7261988 4.0 656 5,294 6,552 112 663 12,621 8893471989 4.0 656 5,294 6,552 112 663 12,621 100,9681990 8.0 a 1,312 10,588 13,104 224 1,326 25,242 1262101991 4.0 656 5,294 6,552 112 663 12,621 138,831

OPERATIONS - TUG LAUNCH SITE SUPPORT733-R00COST BY WBS BY PROJECT FUNCTION BY YEAR (WBS LEVEL 5)
!NO: 2C010C09.04NAME: PROPELLANTS C GASES
MAN MAN LABOR OVERHEAD MATL/S/C OTHER DIR TOTAL CUMULATIVEMO/YR MONTHS HOURS COST COST COST CHARGES GFE M&A AMOUNT AMOUNT
1984 33,502 339502 335021985 16,751 16,751 50,2531986 33,502 33,502 83,7551987 16,751 16,751 100.5061988 16,751 16,751 117,2571989 16,751 16,751 134,0081990 33,502 33,502 167,5101991 16,751 16,751 184,261
NO: 2C.1C.09.05NAME: POSTFLIGHT SAFING
1984 14.2 2,328 18,786 23,256 396 2,356 44,794 44,7941985 7.1 1,164 99393 11,628 198 19178 22,397 6791911986 14.2 2,328 18,786 23,256 396 2,356 44,794 111,9851987 7.1 1,164 9,393 11,628 198 1,178 22,397 134,3821988 7.1 1,164 9,393 11,628 198 1,178 22,397 156t7791989 7.1 1,164 99393 11,628 198 1,178 22,397 1791761990 14.2 2,328 18,786 23,256 396 2,356 44,794 223,9701991 7.1 1,164 9,393 11,628 198 1,178 229397 246,367
NO: 2C.1C.13.01NAME: SCHEDULED MAINTENAOCE E REFURBISH
1984 137,098 137,098 137,0981985 68,549 68,549 205,6471986 137,098 137,098 342.7451987 68,549 68,549 411,2941988 68,549 68,549 479w8431989 68,549 68,549 548,3921990 137,098 137,098 685,4901991 68,549 68,549 754,039

OPERATIONS - TUG LAUNCH SITE SUPPORT733-R00COST BY WBS BY PROJECT FUNCTION BY YEAR (WBS LEVEL 5)
NO: 2C.1C0.13.03NAME: POST MAINTENANCE CHECKOUT
MAN MAN LABOR OVERHEAD MATL/S/C OTHER DIR TOTAL CUMULATIVE
MO/YR MONTHS HOURS COST COST COST CHARGES GFE M&A AMOUNT AMOUNT
1984 7.6 1,246 10,056 12,452 212 1,262 23,982 23,982
1985 3.8 623 5,028 6,226 106 631 11,991 35,973
1986 7.6 1,246 10,056 12,452 212 1,262 23,982 59,955
1987 3.8 623 5,028 6,226 106 631 11,991 71,9461988 3.8 623 5,028 6,226 106 631 11,991 83,937
1989 3.8 623 5,028 6,226 106 631 11,991 95,928
1990 7.6 1,246 10,056 12,452 212 1,262 23,982 119,9101991 \ 3.8 623 5,028 6,226 106 631 11,991 131,901
NO: 2C.1C.13".04NAME: TUG/SPACECRAFT MATING & CHECKOUT
1984 8.0 1,312 10,588 13,104 224 1,326 25,242 25,242
1985 4.0 656 5,294 6,552 112 663 12,621 37,863
1986 8.0 1,312 10,588 13,104 224 1,326 25,242 63,105
1987 4.0 656 5,294 6,552 112 663 12,621 75,726
1988 4.0 656 5,294 6,552 112 663 12t621 88,347
1989 4.0 656 5,294 6,552 112 663 12,621 100,968
1990 8.0 1,312 10,588 13,104 224 1,326 25,242 126,210
1991 4.0 656 5,294 6,552 112 663 12,621 138,831
NO: 2C.1C.13.05NAME: REFURBISHMENT REQUIREMENTS PLANNING
1984 1.6 262 2,114 2,618 44 264 5,040 5,040
1985 .8 131 1,057 1,309 22 132 2,520 7,560
1986 1.6 262 2,114 2,618 44 264 5,040 12,600
1987 .8 131 1,057 1,309 22 132 2,520 15,120
1988 .8 131 1,057 1,309 22 132 2,520 17,640
1989 .8 131 1,057 1,309 22 132 2,520 20,160
1990 1.6 262 2,114 2,618 44 264 5,040 25,200
1991 .8 131 1,057 1,309 22 132 2,520 27,720PROP.TOTAL 19t401.6 3,181,824 28,383,769 34,681,659 30,488,395 14,023,058 2,763,915 1,713,496 112,054,292

Operation - Summary of Other Direct Charges By Type By Month
Direct Cags ByTp B ot

OPERATIONS - TUG LAUNCH SITE SUPPORT733-ROOSUMMARY OF OTHER DIRECT CHARGES BY TYPE BY MONTH
OTHER DIR WTR LAUNCH TDY-RELOC 747 MISC. TOTALMO/YR CHARGES TRAVEL EPER DIEM FERRY CDC 6000 IBM 370 KEYPUNCH ODC ODC
01/84 4,003 32,800 27,117 40,000 9,390 636,000 1,170 750,48002/84 4,002 27,116 31,11803/84 4,002 27,116 31,11804/84 4,002 27,116 31,11805/84 4,002 27,116 31,11806/84 4,002 27,116 31,11807/84 4,003 32,800 27,117 40,000 636,000 739,92008/84 4,002 27,116 31,11809/84 4,002 27,116 31,118
11/84 4,002 27,116 31,11812/84 4,002 27,116 31,118
YEAR TOTAL 48,026 65,600 325,394 80,000 9,390 1,272,000 1,170 1,801,580
01/85 4,003 32,800 26 984 40,000 9,390 636,000 1,170 750,34702/85 4,002 26,983 30,98503/85 4,002 26,983 30,98504/85 4,002 26,983 30,98505/85 4,002 26,983 30,98506/85 4,002 26,983 30,98507/85 4,002 26,983 636,000 666,98508/85 4,002 26,983 30,98509/85 4,002 26,983 30,98510/85 4,002 26,983 30,98511/85 4,002 26,983 30,98512/85 4,002 26,983 30,985
YEAR TOTAL 48,025 32,800 323,797 40,000 9,390 1,272,000 1,170 1,727,182
01/86 4,003 32,800 26,784 40,000 9,390 636,000 1,170 750,14702/86 4,002 26,783 30,78503/86 4,002 26,783 30,78504/86 4,002 269,783 30,78505/86 4,002 26,783 30,78506/86 4,002 26,783 30,78507/86 4,003 32,800 26,784 40,000 636,000 739,58708/86 4,002 26,783 30,78509/86 4,002 26,783 30,78510/86 4,002 26,783 30,78511/86 4,002 26,783 30,78512/86 4,002 26,783 30,785
YEAR TOTAL 48,026 65,600 321,398 80,000 9,390 1,272,000 1,170 1,797.584
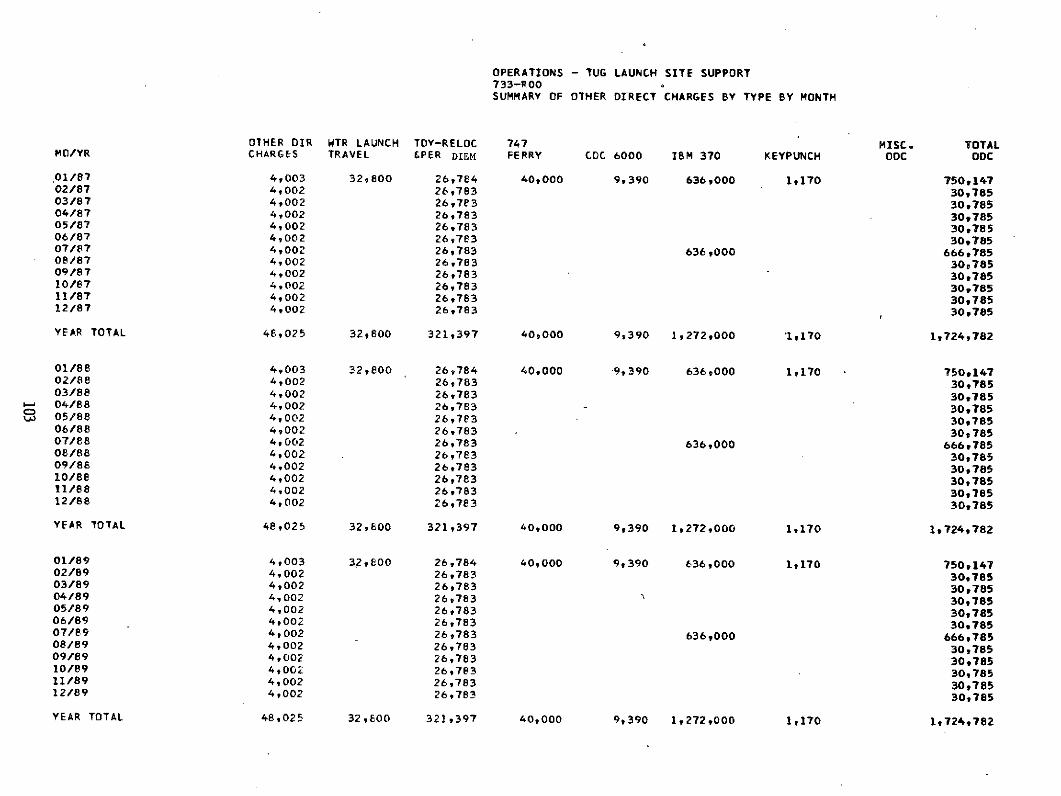
OPERATIONS - TUG LAUNCH SITE SUPPORT733-RO0SUMMARY OF OTHER DIRECT CHARGES BY TYPE BY MONTH
0THER DIR WTR LAUNCH TDY-RELOC 747 MISC. TOTALMO/YR CHARGES TRAVEL &PER DIEM FERRY CDC 6000 IBM 370 KEYPUNCH ODC ODC
01/87 4,003 32,800 26,784 40,000 9,390 636,000 1.170 750,14702/87 4,002 26,783 30,78503/87 4,002 26,783 30,78504/87 4,002 26,783 30,78505/87 4,002 26,783 30,78506/87 4,002 26,783 30,78507/87 4,002 26,783 636 000 666,78508/87 4,002 26,783 30,78509/87 4,002 26,783 30,78510/87 4,002 26,783 30,78511/87 4,002 26,783 30,78512/87 4,002 26,783 30,785
YEAR TOTAL 48,025 32,800 321,397 40,000 9,390 1,272,00 '1,170 1,724,782
01/88 4,003 32,800 26,784 40,000 "9,390 6369000 1,170 750,14702/88 4,002 26,783 30,78503/88 4,002 26,783 30,78504/88 4,002 26,783 30,78505/88 4,002 26,783 30,78506/88 4,002 26,783 30,78507/88 4,002 26,783 636,000 666,78508/88 4,002 26,783 30,78509/88 4,002 26,783 30,78510/88 4,002 26,783 30,78511/88 4,002 26,783 30,78512/88 4,002 26,783 30,785
YEAR TOTAL 48,025 32,800 321,397 40,000 9,390 1,272,000 1,170 1,724,782
01/89 4,003 3,2,800 26,784 40,000 9,390 636,000 1,170 750,14702/89 4,002 26,783 30978503/89 4,002 26,783 30,78504/89 4,002 269783 30,78505/89 4,002 26,783 30,78506/89 4,002 26,783 30,78507/89 4,002 26,783 636,000 666,78508/89 4,002 26,783 30,78509/89 4,002 26,783 30,78510/89 4,002 26,783 30,78511/89 4,002 26,783 30,78512/89 4,002 26,783 30,785
YEAR TOTAL 48,025 32,800 321,397 40,000 9,390 1,272,000 1,170 1,724,782

OPERATIONS - TUG LAUNCH SITE SUPPORT733-R00SUMMARY OF OTHER DIRECT CHARGES BY TYPE BY MONTH
OTHER DIR WTR LAUNCH TDY-RELOC 747 MISC. TOTALMO/YR CHARGES TRAVEL LPER DIEM FERRY CDC 6000 IBM 370 - KEYPUNCH ODC ODC
01/90 4,003 32,600 26,784 40,000 9,390 636,000 1,170 750,14702/90 4,002 26,783 30,78503/90 4,002 26,783 30,78504/90 4,002 26,783 30,78505/90 4,002 26,783 30,78506/90 4,002 26,783 30,78507/90 4,003 32,800 26,784 40,000 636,000 739,58708/90 4,002 26,783 30,78509/90 4,002 26,783 30,78510/90 4,002 26,783 30,78511/90 4,002 26,783 30,78512/90 4,002 26,783 30,785
YEAR TOTAL 48,026 65,600 321,398 80,000 9,390 1,272,000 1,170 1,797,584
01/91 4,003 32,800 26,784 40,000 9,390 636,000 1,170 750,14702/91 4,002 26,783 30,78503/91 4,002 26,783 30,78504/91 4,002 26,783 30,78505/91 4,002 26,783 30,78506/91 4,002 26,783 30,78507/91 4,002 26,783 636,000 666,78508/91 4,002 26,783 30,78509/91 4,002 26,783 30,78510/91 4,002 26,783 30,78511/91 4,002 26,783 30,78512/91 4,002 26,783 30,785
YEAR TOTAL 48,025 32,800 321,397 40,000 99390 1,272,000 1,170 1,724,782
PROP TOTAL 384,203 360,800 2,577,575 440,000 75,120 10,176,000 9,360 14,023,058
Operation - Total Manpower Summary By Project Function (WBS Level PF)
Operat'on Tootal Summa -A

OPERATIONS - TUG LAUNCH SITE SUPPORT733-ROOTOTAL MANPOWER SUMMARY BY PROJECT FUNCTION (WBS LEVEL PF)
TUG FLEET UTILIZATION PROJECT MANAGEMENT
YEAR JAN FEB MAR APR MAY JUNE JULY AUG SEPT OCT NOV DEC TOTAL
1984 83.1 83.1 83.1 83.1 83.1 83.1 83.1 83.1 83.1 83.1 83.1 83.1 997.21985 82.1 82.1 82.1 e2.1 82.1 82.1 82.1 82.1 82.1 82.1 82.1 82.1 985.21986 80.6 80.6 80.6 80.6 80.6 80.6 80.6 80.6 80.6 80.6 80.6 80.6 967.21987 80.6 80.6 80.6 80.6 80.6 80.6 80.6 80.6 80.6 80.6 80.6 80.6 967.21988 80.6 80.6 80.6 80.6 80.6 O0.6 80.6 80.6 80.6 80.6 80.6 80.6 967.21989 80.6 80.6 80.6 80.6 80.6 80.6 80.6 80.6 80.6 80.6 80.6 80.6 967.21990 80.6 80.6 80.6 80.6 80.6 80.6 80.6 80.6 80.6 80.6 80.6 60.6 967.21991 80.6 80.6 60.6 80.6 80.6 80.6 80.6 80.6 80.6 80.6 80.6 80.6 967.2
7,785.6WTR
1984 33.9 7.0 7.0 7.0 7.0 7.0 33.9 7.0 7.0 7.0 7.0 7.0 137.819865 33.9 7.0 7.0 7.0 7.0 7.0 7.0 7.0 7.0 7.0 7.0 7.0 11037.891986 33.9 7.0 7.0 7.0 7.0 7.0 33.9 7.0 7.0 7.0 7.0 7.0 13710.981987 33.9 7.0 7.0 7.0 7.0 7.0 7.0 7.0 7.0 7.0 7.0 7.0 110.91988 33.9 7.0 7.0 7.0 7.0 7.0 7.0 7.0 7.0 7.0 7.0 7.0 110.91989 33.9 7.0 7.0 7.0 7.0 7.0 7.0 7.0 7.0 7.0 7.0 7.0 110.91990 33.9 7.0 7.0 7.0 7.0 7.0 33.9 7.0 7.0 7.0 7.0 7.0 137.8
c)1991 33.9 7.0 7.0 7.0 7.0 7.0 7.0 7.0 7.0 7.0 7.0 7.0 110.9
967.9ETR
1984 87.1 114.0 114.0 114.0 114.0 114.0 87.1 114.0 114.0 114.0 114.0 114.0 1,314.21985 87.1 114.0 114.0 114.0 114.0 114.0 114.0 114.0 114.0 114.0 114.0 114.0 1,341.11986 87.1 114.0 114.0 114.0 114.0 114.0 87.1 114.0 114.0 114.0 114.0 114.0 1,314.21987 87.1 114.0 114.0 114.0 114.0 114.0 114.0 114.0 114.0 114.0 114.0 114.0 1,341.11988 87.1 114.0 114.0 114.0 114.0 114.0 114.0 114.0 114.0 114.0 114.0 114.0 1,341.11989 87.1 114.0 114.0 114.0 114.0 114.0 114.0 114.0 114.0 114.0 114.0 114.0 1,341.11990 87.1 114.0 114.0 114.0 114.0 114.0 87.1 114.0 114.0 114.0 114.0 114.0 1314.21991 87.1 114.0 114.0 114.0 114.0 114.0 114.0 114.0 114.0 114.0 114.0 114.0 1,341.1
10,648.1SUMMARY TOTAL: ALL FUNCTIONS OF COST
1984 204.1 204.1 204.1 204.1 204.1 204.1 204.1 204.1 204.1 204.1 204.1 204.1 2,449.21985 203.1 203.1 203.1 203.1 203.1 203.1 203.1 203.1 203.1 203.1 203.1 203.1 2,437.21986 201.6 201.6 201.6 201.6 201.6 201.6 201.6 201.6 201.6 201.6 201.6 201.6 2,419.21987 201.6 201.6 201.6 201.6 201.6 201.6 201.6 201.6 201.6 201.6 201.6 201.6 2,419.21988 201.6 201.6 201.6 201.6 201.6 201.6 201.6 201.6 201.6 201.6 201.6 201.6 2,419.21989 201.6 201.6 201.6 201.6 201.6 201.6 201.6 201.6 201.6 201.6 201.6 201.6 2,419.21990 201.6 201.6 201.6 201.6 201.6 201.6 201.6 201.6 201.6 201.6 201.6 201.6 2,419.21991 201.6 201.6 201.6 201.6 201.6 201.6 201.6 201.6 201.6 201.6 201.6 201.6 2,419.2
19,401.6

Operation - Total Manpower Summary By Project Function & WBS Elements(WBS Level 5)
S* -S

OPERATIONS - TUG LAUNCH SITE SUPPORT733-ROOTOTAL MANPOWER SUMMARY BY PROJECT FUNCTION & WBS ELEMENTS (WBS LEVEL 5)
NO: 2C.1A.01.01NAME: COST/PERFORMANCE MANAGEMENT
1984 9.0 9.0 9.0 9.0 9.0 9.0 9.0 9.0 9.0 9.0 9.0 9.0 108.01985 9.0 9.0 9.0 9.0 9.0 9.0 9.0 9.0 9.0 9.0 9.0 9.0 108.01986 9.0 9.0 9.0 9.0 9.0 9.0 9.0 9.0 9.0 9.0 9.0 9.0 108.01987 9.0 9.0 9.0 9.0 9.0 9.0 9.0 9.0 9.0 9.0 9.0 9.0 108.01988 9.0 9.0 9.0 9.0 9.0 9.0 9.0 9.0 9.0 9.0 9.0 9.0 108.01989 9.0 9.0 9.0 9.0 9.0 9.0 9.0 9.0 9.0 9.0 9.0 9.0 108.01990 9.0 9.0 9.0 9.0 9.0 9.0 9.0 9.0 9.0 9.0 9.0 9.0 108.01991 9.0 9.0 9.0 9.0 9.0 9.0 9.0 9.0 9.0 9.0 9.0 9.0 108.0
NO: 2C.1A.01.02 864.0
NAME: PROJECT DIRECTION
1984 3.0 3.0 3.0 3.0 3.0 3.0 3.0 3.0 3.0 3.0 3.0 3.0 36.01985 3.0 3.0 3.0 3.0 3.0 3.0 3.0 3.0 3.0 3.0 3.0 3.0 36.01986 3.0 3.0 3.0 3.0 3.0 3.0 3.0 3.0 3.0 3.0 3.0 3.0 36.01987 3.0 3.0 3.0 3.0 3.0 3.0 3.0 3.0 3.0 3.0 3.0 3.0 36.0Co 1988 3.0 3.0 3.0 3.0 3.0 3.0 3.0 3.0 3.0 3.0 3.0 3.0 36.01989 3.0 3.0 3.0 3.0 3.0 3.0 3.0 3.0 3.0 3.0 3.0 3.0 36.01990 3.0 3.0 3.0 3.0 3.0 3.0 3.0 3.0 3.0 3.0 3.0 3.0 36.01991 3.0 3.0 3.0 3.0 3.0 3.0 3.0 3.0 3.0 3.0 3.0 3.0 36.0
288.0

OPERATIONS - TUG LAUNCH SITE SUPPORT733-ROOTOTAL MANPOWER SUMMARY BY PROJECT FUNCTION & WBS ELEMENTS(WBS LEVEL 5)
NO: 2C.1A.01.03NAME: INFORMATION MANAGEMENT
YEAR JAN FEB MAR APR MAY JUNE JULY AUG SEPT OCT NOV DEC TOTAL
1984 9.0 9.0 9.0 9.0 9.0 9.0 9.0 9.0 9.0 9.0 9.0 9.0 108.01985 9.0 9.0 9.0 9.0 9.0 9.0 9.0 9.0 9.0 9.0 9.0 9.0 108.01986 9.0 9.0 9.0 9.0 9.0 9.0 9.0 9.0 9.0 9.0 9.0 9.0 108.01987 9.0 9.0 9.0 9.0 9.0 9.0 9.0 9.0 9.0 9.0 9.0 9.0 108.01988 9.0 9.0 9.0 9.0 9.0 9.0 9.0 9.0 9.0 9.0 9.0 9.0 108.01989 9.0 9.0 9.0 9.0 9.0 9.0 9.0 9.0 9.0 9.0 9.0 9.0 108.01990 9.0 9.0 9.0 9.0 9.0 9.0 9.0 9.0 9.0 9.0 9.0 9.0 108.01991 9.0 9.0 9.0 9.0 9.0 9.0 9.0 9.0 9.0 9.0 9.0 9.0 108.0
864.0NO:. 2C.1A.01.04NAME: FLEET UTILIZATION
1984 12.0 12.0 12.0 12.0 12.0 12.0 12.0 12.0 12.0 12.0 12.0 12.0 144.01985 12.0 12.0 12.0 12.0 12.0 12.0 12.0 12.0 12.0 12.0 12.0 12.0 144.01986 12.0 12.0 12.0 12.0 12.0 12.0 12.0 12.0 12.0 12.0 12.0 12.0 144.01987 12.0 12.0 12.0 12.0 12.0 12.0 12.0 12.0 12.0 12.0 12.0 12.0 144.01988 12.0 12.0 12.0 12.0 12.0 12.0 12.0 12.0 12.0 12.0 12.0 12.0 144.01989 12.b 12.0 12.0 12.0 12.0 12.0 12.0 12.0 12.0 12.0 12.0 12.0 144.01990 12.0 12.0 12.0 12.0 12.0 12.0 12.0 12.0 12.0 12.0 12.0 12.0 144.01991 12.0 12.0 12.0 12.0 12.0 12.0 12.0 12.0 12.0 12.0 12.0 12.0 144.0
1,152.0NO: 2C.1A.02.04NAME: SUSTAINING ENGINEERING
1984 34.0 34.0 34.0 34.0 34.0 34.0 34.0 34.0 34.0 34.0 34.0 34.0 408.01985 34.0 34.0 34.0 34.0 34.0 34.0 34.0 34.0 34.0 34.0 34.0 34.0 408.01986 34.0 34.0 34.0 34.0 34.0 34.0 34.0 34.0 34.0 34.0 34.0 34.0 408.01987 34.0 34.0 34.0 34.0 34.0 34.0 34.0 34.0 34.0 34.0 34.0 34.0 408.01988 34.0 34.0 34.0 34.0 34.0 34.0 34.0 34.0 34.0 34.0 34.0 34.0 406.01989 34.0 34.0 34.0 34.0 34.0 34.0 34.0 34.0 34.0 34.0 34.0 34.0 408.01990 34.0 34.0 34.0 34.0 34.0 34.0 34.0 34.0 34.0 34.0 34.0 34.0 408.01991 34.0 34.0 34.0 34.0 34.0 34.0 34.0 34.0 34.0 34.0 34.0 34.0 408.0
39264.0

OPERATIONS - TUG LAUNCH SITE SUPPORT733-R00TOTAL MANPOWER SUMMARY BY PROJECT FUNCTION & WBS ELEMENTS (WBS LEVEL 5)
NO: 2C.1A.05.01.NAME: TRANSPORTATION E HANDLING
YEAR JAN FEB MAR APR MAY JUNE JULY AUG SEPT OCT NOV DEC TOTAL
1984 2.0 2.0 2.0 2.0 2.0 2.0 2.0 2.0 2.0 2.0 2.0 2.0 24.01985 2.0 2.0 2.0 2.0 2.0 2.0 2.0 2.0 2.0 2.0 2.0 2.0 24.01986 2.0 2.0 2.0 2.0 2.0 2.0 2.0 2.0 2.0 2.0 2.0 2.0 24.01987 2.0 2.0 2.0 2.0 2.0 2.0 2.0 2.0 2.0 2.0 2.0 2.0 24.01988 2.0 2.0 2.0 2.0 2.0 2.0 2.0 2.0 2.0 2.0 2.0 2.0 24.01989 2.0 2.0 2.0 2.0 2.0 2.0 2.0 2.0 2.0 2.0 2.0 2.0 24.01990 2.0 2.0 2.0 2.0 2.0 2.0 2.0 2.0 2.0 2.0 2.0 2.0 24.01991 2.0 2.0 2.0 2.0 2.0 2.0 2.0 2.0 2.0 2.0 2.0 2.0 24.0
NO: 2C.1A.05.02 192.0
NAME: TRAINING
1984 4.0 4.0 4.0 4.0 4.0 4.0 4.0 4.0 4.0 4.0 4.0 4.0 48.01985 4.0 4.0 4.0 4.0 4.0 4.0 4.0 4.0 4.0 4.0 4.0 4.0 48.01986 4.0 4.0 4.0 4.0 4.0 4.0 4.0 4.0 4.0 4.0 4.0 4.0 48.01987 4.0 4.0 4.0 4.0 4.0 4.0 4.0 4.0 4.0 4.0 4.0 4.0 48.01988 4.0 4.0 4.0 4.0 4.0 4.0 4.0 4.0 4.0 4.0 4.0 4.0 48.01989 4.0 4.0 4.0 4.0 4.0 4.0 4.0 4.0 4.0 4.0 4.0 4.0 48.01990 4.0 4.0 4.0 4.0 4.0 4.0 4.0 4.0 4.0 4.0 4.0 4.0 48.01991 4.0 4.0 4.0 4.0 4.0 4.0 4.0 4.0 4.0 4.0 4.0 4.0 48.0
NO: 2C.1A.05.03 384.0
NAME: INVENTORY CONTROL t WAREHOUSING
1984 6.0 6.0 6.0 6.0 6.0 6.0 6.0 6.0 6.0 6.0 6.0 6.0 72.01985 5.0 5.0 5.0 5.0 5.0 5.0 5.0 5.0 5.0 5.0 5.0 5.0 60.01986 4.0 4.0 4.0 4.0 4.0 4.0 4.0 4.0 4.0 4.0 4.0 4.0 48.01987 4.0 4.0 4.0 4.0 4.0 4.0 4.0 4.0 4.0 4.0 4.0 4.0 48.01988 4.0 4.0 4.0 4.0 4.0 4.0 4.0 4.0 4.0 4.0 4.0 4.0 48.01989 4.0 4.0 4.0 4.0 4.0 4.0 4.0 4.0 4.0 4.0 4.0 4.0 48.01990 4.0 4.0 4.0 4.0 4.0 4.0 4.0 4.0 4.0 4.0 4.0 4.0 48.01991 4.0 4.0 4.0 4.0 4.0 4.0 4.0 4.0 4.0 4.0 4.0 4.0 48.0
420.0

OPERATIONS - TUG LAUNCH SITE SUPPORT733-ROOTOTAL MANPOWER SUMMARY PROJECT FUNCTION & WBS ELEMENTS (WBS LEVEL 5)
NO: 2C.1A.05.04NAME: DEPOT MAINTENANCE
YEAR JAN FEB MAR APR MAY JUNE JULY AUG SEPT OCT NOV DEC TOTAL
1984 1.0 1.0 1.0 1.0 1.0 1.0 1.0 1.0 1.0 1.0 1.0 1.0 12.01985 1.0 1.0 1.0 1.0 1.0 1.0 1.0 1.0 1.0 1.0 1.0 1.0 12.01986 .5 .5 .5 .5 .5 .5 .5 .5 .5 .5 .5 .5 6.01987 .5 .5 .5 .5 .5 .5 .5 .5 .5 .5 .5 .5 6.01988 .5 ..5 .5 . .5 .5 .5 .5 -.5 .5 .5 6.01989 .5 .5 .5 .5 .5 .5 .5 .5 .5 .5 .5 .5 6.01990 .5 .5 .5 .5 .5 .5 .5 .5 .5 .5 .5 .5 6.01991 .5 .5 .5 .5 .5 .5 .5 .5 .5 .5 .5 .5 6.0
60.0NO: 2C.1A.15.03NAME: GSE SOFTWARE
1984 3.1 3.1 3.1 3.1 3.1 3.1 3.1 3.1 3.1 3.'1 3.1 3.1 37.21985 3.1 3.1 3.1 3.1 3.1 3.1 3.1 3.1 3.1 3.1 3.1 3.1 37.21986 3.1 3.1 3.1 3.1 3.1 3.1 3.1 3.1 3.1 3.1 3.1 3.1 37.21987 3.1 3.1 3.1 3.1 3.1 3.1 3.1 3.1 3.1 3.1 3.1 3.1 37.21988 3.1 3.1 3.1 3.1 3.1 3.1 3.1 3.1 3.1 3.1 3.1 3.1 37.21989 3.1 3.1 3.1 3.1 3.1 3.1 3.1 3.1 3.1 3.1 3.1 3.1 37.21990 3.1 3.1 3.1 3.1 3.1 3.1 3.1 3.1 3.1 3.1 3.1 3.1 37.21991 3.1 3.1 3.1 3.1 3.1 3.1 3.1 3.1 3.1 3.1 3.1 3.1 37.2
297.6DEPARTMENT TOTAL:
1984 83.1 83.1 83.1 83.1 83.1 83.1 83.1 83.1 83.1 83.1 83.1 83.1 997.21985 82.1 P2.1 82.1 82.1 82.1 82.1 82.1 82.1 82.1 82.1 82.1 82.1 985.21986 80.6 80.6 80.6 80.6 80.6 80.6 80.6 80.6 80.6 80.6 80.6 80.6 967.21987 80.6 80.6 80.6 80.6 80.6 80.6 80.6 80.6 80.6 80.6 80.6 80.6 967.21988 80.6 80.6 80.6 80.6 80.6 80.6 80.6 80.6 80.6 80.6 80.6 80.6 967.21989 80.6 80.6 80.6 80.6 80.6 80.6 80.6 80.6 80.6 80.6 80.6 80.6 967.21990 80;6 80.6 80.6 80.6 80.6 80.6 80.6 80.6 80.6 80.6 80.6 80.6 967.21991 80.6 80.6 80.6 80.6 60.6 80.6 80.6 80.6 80.6 80.6 80.6 80.6 967.2
7,785.6

OPERATIONS - TUG LAUNCH SITE SUPPORT733-RCOTOTAL MANPOWER SUMMARY BY PROJECT FUNCTION & WBS ELEMENTS (WBS LEVEL 5)
NO: 2C.1B.01.02NAME: PROJECT MANAGEMENT
1984 4.0 4.0 4.0 4.0 4.0 4.0 4.0 4.0 4.0 4.0 4.0 4.0 48.0
1985 4.0 4.0 4.0 4.0 4.0 4.0 4.0 4.0 4.0 4.0 4.0 4.0 48.0
1986 4.0 4.0 4.0 4.0 4.0 4.0 .4.0 4.0 4.0 4.0 4.0 4.0 48.0
1987 4.0 4.0 4.0 4.0 4.0 4.0 4.0 4.0 4.0 4.0 4.0 4.0 48.0
1988 4.0 4.0 4.0 4.0 4.0 4.0 4.0 4.0 4.0 4.0 4.0 4.0 48.0
1989 4.0 4.0 4.0 4.0 4.0 4.0 4.0 4.0 4.0 4.0 4.0 4.0 48.0
1990 4.0 4.0 4.0 4.0 4.0 4.0 4.0 4.0 4.0 4.0 4.0 4.0 48.0
1991 4.0 4.0 4.0 4.0 4.0 4.0 4.0 4.0 4.0 4.0 4.0 4.0 48.0
384.0
NO: 2C.18.01.03NAME: INFORMATION MANAGEMENT
1984 2.0 2.0 2.0 2.0 2.0 2.0 2.0 2.0 2.0 2.0 2.0 2.0 24.0
1985 2.0 2.0 2.0 2.0 2.0 2.0 2.0 2.0 2.0 2.0 2.0 2.0 24.0
1986 2.0 2.0 2.0 2.0 2.0 2.0 2.0 2.0 2.0 2.0 2.0 2.0 24.0
1987 2.0 2.0 2.0 2.0 2.0 2.0 2.0 2.0 2.0 2.0 2.0 2.0 24.0
1988 2.0 2.0 2.0 2.0 2.0 2.0 2.0 2.0 2.0 2.0 2.0 2.0 24.0
1989 2.0 2.0 2.0 2.0 2.0 2.0 2.0 2.0 2.0 2.0 2.0 2.0 24.0
1990 2.0 2.0 2.0 2.0 2.0 2.0 2.0 2.0 2.0 2.0 2.0 2.0 24.0
1991 2.0 2.0 2.0 2.0 2.0 2.0 2.0 2.0 2.0 2.0 2.0 2.0 24.0
192.0

OPERATIONS - TUG LAUNCH SITE SUPPORT733-R00TOTAL MANPOWER SUMMARY BY PROJECT FUNCTION& WBS ELEMENTS (WBS LEVEL 5)
NO: 2C.18.06.03NAME: ETR MAINTENANCE & REFURBISHMENT
YEAR JAN FEB MAR APR MAY JUNE JULY AUG SEPT OCT NOV DEC TOTAL
1984 13.0 13.0 13.0 13.0 13.0 13.0 13.0 13.0 13.0 13.0 13.0 13.0 156.01985 13.0 13.0 13.0 13.0 13.0 13.0 13.0 13.0 13.0 13.0 13.0 13.0 156.01986 13.0 13.0 13.0 13.0 13.0 13.0 13.0 13.0 13.0 13.0 13.0 13.0 156.01987 13.0 13.0 13.0 13.0 13.0 13.0 13.0 13.0 13.0 13.0 13.0 13.0 156.01988 13.0 13.0 13.0 13.0 13.0 13.0 13.0 13.0 13.0 13.0 13.0 13.0 156.01989 13.0 13.0 13.0 13.0 13.0 13.0 13.0 13.0 13.0 13.0 13.0 13.0 156.01990 13.0 13.0 13.0 13.0 13.0 13.0 13.0 13.0 13.0 13.0 13.0 13.0 156.01991 13.0 13.0 13.0 13.0 13.0 13.0 13.0 13.0 13.0 13.0 13.0 13.0 156.0
1,248.0NO: 2C.1B.06.07NAME: FACILITY OPERATIONS SUPPORT
1984 13.0 13.0 13.0 13.0 13.0 13.0 13.0 13.0 13.0 13.0 13.0 13.0 156.01985 13.0 13.0 13.0 13.0 13.0 13.0 13.0 13.0 13.0 13.0 13.0 13.0 156.01986 13.0 13.0 13.0 13.0 13.0 13.0 13.0 13.0 13.0 13.0 13.0 13.0 156.019E7 13.0 13.0 13.0 13.0 13.0 13.0 13.0 13.0 13.0 13.0 13.0 13.0 156.01988 13.0 13.0 13.0 13.0 13.0 13.0 13.0 13.0 13.0 13.0 13.0 13.0 156.01989 13.0 13.0 13.0 13.0 13.0 13.0 13.0 13.0 13.0 13.0 13.0 13.0 156.01990 13.0 13.0 13.0 13.0 13.0 13.0 13.0 13.0 13.0 13.0 13.0 13.0 156.01991 13.0 13.0 13.0 13.0 13.0 13.0 13.0 13.0 13.0 13.0 13.0 13.0 156.0
1,248.0NO: 2C.18B.07.02NAME: EASTERN TEST RANGE - GSE
1984 7.0 7.0 7.0 7.0 7.0 7.0 7.0 7.0 7.0 7.0 7.0 7.0 84.01985 7.0 7.0 7.0 7.0 7.0 7.0 7.0 7.0 7.0 7.0 7.0 7.0 84.01986 7.0 7.0 7.0 7.0 7.0 7.0 7.0 7.0 7.0 7.0 7.0 7.0 84.01987 7.0 7.0 7.0 7.0 7.0 7.0 7.0 7.0 7.0 7.0 7.0 7.0 84.01988 7.0 7.0 7.0 7.0 7.0 7.0 7.0 7.0 7.0 7.0 7.0 7.0 84.01989 7.0 7.0 7.0 7.0 7.0 7.0 7.0 7.0 7.0 7.0 7.0 7.0 84.01990 7.0 7.0 7.0 7.0 7.0 7.0 7.0 7.0 7.0 7.0 7.0 7.0 84.01991 7.0 7.0 7.0 7.0 7.0 7.0 7.0 7.0 7.0 7.0 7.0 7.0 84.0
672.0

OPERATIONS - TUG LAUNCH SITE SUPPORT733-ROOTOTAL MANPOWER SUMMARY BY PROJECT FUNCIION & WBS ELEMENTS (WBS LEVEL 5)
NO: 2C.18.10.01NAME: LAUNCH SITE SERVICES/SUPPORT
YEAR JAN FEB MAR APR MAY JUNE JULY AUG SEPT OCT NOV DEC TOTAL
1984 4.0 4.0 4.0 4.0 4.0 4.0 4.0 4.0 4.0 4.0 4.0 4.0 48.01985 4.0 4.0 4.0 4.0 4.0 4.0 4.0 4.0 4.0 4.0 4.0 4.0 48.01986 4.0 4.0 4.0 4.0 4.0 4.0 4.0 4.0 4.0 4.0 4.0 4.0 48.01987 4.0 4.0 4.0 4.0 4.0 4.0 4.0 4.0 4.0 4.0 4.0 4.0 48.01988 4.0 4.0 4.0 4.0 4.0 4.0 4.0 4.0 4.0 4.0 4.0 4.0 48.01989 4.0 4.0 4.0, 4.0 4.0 4.0 4.0 4.0 4.0 4.0 4.0 4.0 48.01990 4.0 4.0 4.0 4.0 4.0 4.0 4.0 4.0 4.0 4.0 4.0 4.0 48.01991 4.0 4.0 4.0 4.0 4.0 4.0 4.0 4.0 4.0 4.0 4.0 4.0 48.0
384.0NO: 2C.1B.10.02NAME: TUG SHUTTLE MATING E CHECKOUT
1984 8.0 15.2 15.2 15.2 15.2 15.2 8.0 15.2 15.2 15.2 15.2 15.2 168.01985 8.0 15.2 15.2 15.2 15.2 15.2 15.2 15.2 15.2 15.2 15.2 15.2 175.21986 8.0 15.2 15.2 15.2 15.2 15.2 8.0 15.2 15.2 15.2 15.2 15.2 168.01987 e.0 15.2 15.2 15.2 15.2 15.2 15.2 15.2 15.2 15.2 15.2 15.2 175.21988 8.0 15.2 15.2 15.2 15.2 15.2 15.2 15.2 15.2 15.2 15.2 15.2 175.21989 8.0 15.2 15.2 15.2 15.2 15.2 15.2 15.2 15.2 15.2 15.2 15.2 175.21990 8.0 15.2 15.2 15.2 15.2 15.2 8.0 15.2 15.2 15.2 15.2 15.2 168.01991 8.0 15.2 15.2 15.2 15.2 15.2 15.2 15.2 15.2 15.2 15.2 15.2 175.2
1,380.0NO: 2C.1B.10.03NAME: PRELAUNCH CHECKOUT C COUNTDOWN
1984 1.2 5.2 5.2 5.2 5.2 5.2 1.2 5.2 5.2 5.2 5.2 5.2 54.41985 1.2 5.2 5.2 5.2 5.2 5.2 5.2 5.2 5.2 5.2 5.2 5.2 58.41986 1.2 5.2 5.2 5.2 5.2 5.2 1.2 5.2 5.2 5.2 5.2 5.2 54.41987 1.2 5.2 5.2 5.2 5.2 5.2 5.2 5.2 5.2 5.2 5.2 5.2 58.41988 1.2 5.2 5.2 5.2 5.2 5.2 5.2 5.2 5.2 5.2 5.2 5.2 58.41989 1.2 5.2 5.2 5.2 5.2 5.2 5.2 5.2 5.2 5.2 5.2 5.2 58.41990 1.2 5.2 5.2 5.2 5.2 5.2 1.2 5.2 5.2 5.2 5.2 5.2 54.41991 1.2 5.2 5.2 5.2 5.2 5.2 5.2 5.2 5.2 5.2 5.2 5.2 58.4
455.2

OPERATIONS - TUG LAUNCH SITE SUPPORT733-R00TOTAL MANPOWER SUMMARY BY PROJECT FUNCTION & WBS ELEMENTS (WBS LEVEL 5)
NO: 2C.1B.10.05NAME: POSTFLIGHT SAFING
YEAR JAN FEB MAR APR MAY JUNE JULY AUG SEPT OCT NOV DEC TOTAL
1984 4.5 11.6 11.6 11.6 11.6 11.6 4.5 11.6 11.6 11.6 11.6 11.6 125.01985 4.5 11.6 11.6 11.6 11.6 11.6 11.6 11.6 11.6 11.6 11.6 11.6 132.11986 4.5 11.6 11.6 11.6 11.6 11.6 4.5 11.6 11.6 11.6 11.6 11.6 125.01987 4.5 11.6 11.6 11.6 11.6 11.6 11.6 11.6 11.6 11.6 11.6 11.6 132.11988 4.5 11.6 11.6 11.6 11.6 11.6 11.6 11.6 11.6 11f.6 11.6 11.6 132.11989 4.5 11.6 11.6 11.6 11.6 11.6 11.6 11.6 11.6 11.6 11.6 11.6 132.11990 4.5 11.6 11.6 11.6 11.6 11.6 4.5 11.6 11.6 11.6 11.6 11.6 125.01991 4.5 11.6 11.6 11.6 11.6 11.6 11.6 11.6 11.6 11.6 11.6 11.6 132.1
1,035.5NO: 2C.1B.14.01NAME: SCHEDULED MAINTENANCE t REFURBISH
1984 15.6 15.6 15.6 15.6 15.6 15.6 15.6 15.6 15.6 15.6 15.6 15.6 187.21985 15.6 15.6 15.6 15.6 15.6 15.6 15.6 15.6 15.6 15.6 15.6 15.6 187.21986 15.6 15.6 15.6 15.6 15.6 15.6 15.6 15.6 15.6 15.6 15.6 15.6 187.21987 15.6 15.6 15.6 15.6 15.6 15.6 15.6 15.6 15.6 15.6 15.6 15.6 187.21988 15.6 15.6 15.6 15.6 15.6 15.6 15.6 15.6 15.6 15.6 15.6 15.6 187.21989 15.6 15.6 156 15.6 15.6 15.6 15.6 15.6 15.6 15.6 15.6 187.21990 15.6 15.6 15.6 15.6 15.6 15.6 15.6 15.6 15.6 15.6 15.6 15.6 187.21991 15.6 15.6 15.6 15.6 15.6 15.6 15.6 15.6 15.6 15.6 15.6 15.6 187.2
1,497.6NO: 2C.1B.14.02NAME: UNSCHEDULED MAINTENANCE C REFURBISH
1984 3.5 3.5 3.5 3.5 3.5 3.5 3.5 3.5. 3.5 3.5 3.5 3.5 42.01985 3.5 3.5 3.5 3.5 3.5 3.5 3.5 3.5 3.5 3.5 3.5 3.5 42.01986 3.5 3.5 3.5 3.5 3.5 3.5 3.5 3.5 3.5 3.5 3.5 3.5 42.01987 3.5 3.5 3.5 3.5 3.5 3.5 3.5 3.5 3.5 3.5 3.5 3.5 42.01988 3.5 3.5 3.5 3.5 3.5 3.5 3.5 3.5 3.5 3.5 3.5 3.5 - 42.01989 3.5 3.5 3.5 3.5 3.5 3.5 3.5 3.5 3.5 3.5 3.5 3.5 42.01990 3.5 3.5 3.5 3.5 3.5 3.5 3.5 3.5 3.5 3.5 3.5 3.5 42.01991 3.5 3.5 3.5 3.5 3.5 3.5 3.5 3.5 3.5 3.5 3.5 3.5 42.0
336.0

OPERATIONS - TUG LAUNCH SITE SUPPORT733-ROOTOTAL MANPOWER SUMMARY BY PROJECT FUNCTION & WBS ELEMEVTS (WBS LEVEL 5)
NO: 2C.18.14.03NAME: POST MAINTENANCE CHECKOUT
YEAR JAN FEB MAR APR MAY JUNE JULY AUG SEPT OCT NOV DEC TOTAL
1984 7.0 10.8 10.8 10.8 10.8 10.8 7.0 10.8 10.8 10.8 10.8 10.8 122.01985 7.0 10.8 10.8 10.8 10.8 10.8 10.8 10.8 10.8 10.8 10.8 10.8 125.81986 7.0 10.8 10.8 10.8 10.8 10.8 7.0 10.e 10.8 10.8 10.8 10.8 122.01987 7.0 10.8 10.8 10.8 10.8 10.8 10.8 10.8 10.8 10.8 10.8 10.8 125.81988 7.0 10.8 10.8 10.8 10.8 10.8 10.8 10.8 10.8 10.8 10.8 10.8 125.81989 7.0 10.8 10.8 10.8 10.8 10.8 10.8 10.8 10.8 10.8 10.8 10.8 125.81990 7.0 10.8 10.8 10.8 10.8 10.8 7.0 10.8 10.8 10.8 10.8 10.8 122.01991 7.0 10.8 10.8 10.8 10.8 10.8 10.8 10.8 10.8 10.8 10.8 10.8 125.8
995.0NO: 2C.1B.14.04NAME: TUG/SPACECRAFT MATING E CHECKOUT
1984 3.4 7.4 7.4 7.4 7.4 7.4 3.4 7.4 7.4 7.4 7.4 7.4 80.81985 3.4 7.4 7.4 7.4 7.4 7.4 7.4 7.4 7.4 7.4 7.4 7.4 84.81986 3.4 7.4 7.4 7.4 7.4 7.4 3.4 7.4 7.4 7.4 7.4 7.4 80.81987 3.4 7.4 7.4 7.4 7.4 7.4 7.4 7.4 7.4 7.4 7.4 7.4 84.81988 3.4 7.4 7.4 7.4 7.4 7.4 7.4 7.4 7.4 7.4 7.4 7.4 84.81989 3.4 7.4 7.4 7.4 7.4 7.4 7.4 7.4 7.4 7.4 7.4 7.4 84.81990 3.4 7.4 7.4 7.4 7.4 7.4 3.4 7.4 7.4 7.4 7.4 7.4 80.81991 3.4 7.4 7.4 7.4 7.4 7.4 7.4 7.4 7.4 7.4 7.4 7.4 84.8
666.4NO: 2C.18.14.05NAME: REFURBISHMENT REQUIREMENTS PLANNING
1984 .9 1.7 1.7 1.7 1.7 1.7 .9 1.7 1.7 1.7 1.7 1.7 18.81985 .9 1.7 1.7 1.7 1.7 1.7 1.7 1.7 1.7 1.7 1.7 1.7 19.61986 .9 1.7 1.7 1.7 1.7 1.7 .9 1.7 1.7 1.7 1.7 1.7 18.81987 .9 1.7 1.7 1.7 1.7 1.7 1.7 1.7 1.7 1.7 1.7 1.7 19.61988 .9 1.7 1.7 1.7 1.7 1.7 1.7 1.7 1.7 1.7 1.7 1.7 19.61989 .9 1.7 1.7 1.7 1.7 1.7 1.7 1.7 1.7 1.7 1.7 1.7 19.61990 .9 1.7 1.7 1.7 1.7 1.7 .9 1.7 1.7 1.7 1.7 1.7 18.81991 .9 1.7 1.7 1.7 1.7 1.7 1.7 1.7 1.7 1.7 1.7 1.7 19.6
DEPARTMENT TOTAL: 154.4
YEAR JAN FEB MAR APR MAY JUNE JULY AUG SEPT OCT NOV DEC TOTAL
1984 87.1 114.0 114.0 114.0 114.0 114.0 87.1 114.0 114.0 114.0 114.0 114.0 1,314.21985 87.1 114.0 114.0 114.0 114.0 .114.0 114.0 114.0 114.0 114.0 114.0 114.0 1,341.11986 87.1 114.0 114.0 114.0 114.0 114.0 87.1 114.0 114.0 114.0 114.0 114.0 1,314.21987 87.1 114.0 114.0 114.0 114.0 114.0 114.0 114.0 114.0 114.0 114.0 114.0 1,341.11988 87.1 114.0 114.0 114.0 114.0 114.0 114.0 114.0 114.0 114.0 114.0 114.0 1,341.11989 87.1 114.0 114.0 114.0 114.0 114.0 114.0 114.0 114.0 114.0 114.0 114.0 1,341.11990 87.1 114.0 114.0 114.0 114.0 114.0 87.1 114.0 114.0 114.0 114.0 114.0 1,314.21991 87.1 114.0 114.0 114.0 114.0 114.0 114.0 114.0 114.0 114.0 114.0 114.0 1,341.1
10,648.1

OPERATIONS - TUG LAUNCH SITE SUPPORT733-R00TOTAL MANPOWER SUMMARY BY PROJECT FUNCTION & WBS ELEMENTS (WBS LEVEL 5)
NO: 2C.1C.01.02NAME: PROJECT MANAGEMENT
YEAR JAN FEB MAR APR MAY JUNE JULY AUG SEPT OCT NOV DEC TOTAL
1984 2.0 2.0 2.0 2.0 2.0 2.0 2.0 2.0 2.0 2.0 2.0 2.0 24.01985 2.0 2.0 2.0 2.0 2.0 2.0 2.0 2.0 2.0 2.0 2.0 2.0 24.01986 2.0 2.0 2.0 2.0 2.0 2.0 2.0 2.0 2.0 2.0 2.0 2.0 24.01987 2.0 2.0 2.0 2.0 2.0 2.0 2.0 2.0 2.0 2.0 2.0 2.0 24.01988 2.0 2.0 2.0 2.0 2.0 2.0 2.0 2.0 2.0 2.0 2.0 2.0 24.01989 2.0 2.Q 2.0 2.0 2.0 2.0 2.0 2.0 2.0 2.0 2.0 2.0 24.01990 2.0 2.0 2.0 2.0 2.0 2.0 2.0 2.0 2.0 2.0 2.0 2.0 24.01991 2.0 2.0 2.0 2.0 2.0 2.0 2.0 2.0 2.0 2.0 2.0 2.0 24.0
NO: 2C.1C.01.03 192.0
NAME: INFORMATION MANAGEMENT
1984 1.0 1.0 1.0 1.0 1.0 1.0 1.0 1.0 1.0 1.0 1.0 1.0 12.01985 1.0 1.0 1.0 1.0 1.0 1.0 1.0 1.0 1.0 1.0 1.0 1.0 12.01986 1.0 1.0 1.0 1.0 1.0 1.0 1.0 1.0 1.0 1.0 1.0 1.0 12.01987 1.0 1.0 1.0 1.0 1.0 1.0 1.0 1.0 1.0 1.0 1.0 1.0 12.01988 1.0 1.0 1.0 1.0 1.0 1.0 1.0 1.0 1.0 1.0 1.0 1.0 12.01989 1.0 1.0 1.0 1.0 1.0 1.0 1.0 1.0 1.0 1.0 1.0 1.0 12.01990 1.0 1.0 1.0 1.0 1.0 1.0 1.0 1.0 1.0 1.0 1.0 1.0 12.01991 1.0 1.0 1.0 1.0 1.0 1.0 1.0 1.0 1.0 1.0 1.0 1.0 12.0
NOt 2C.1C.06.05 96.0NAME: WTR MAINTENANCE C REFURBISHMENT
1984 1.0 1.0 1.0 1.0 1.0 1.0 1.0 1.0 1.0 1.0 1.0 1.0 12.01985 1.0 1.0 1.0 1.0 1.0 1.0 1.0 1.0 1.0 1.0 1.0 1.0 12.01986 1.0 1.0 1.0 1.0 1.0 1.0 1.0 1.0 1.0 1.0 1.0 1.0 12.01987 1.0 1.0 1.0 1.0 1.0 1.0 1.0 1.0 1.0 1.0 1.0 1.0 12.01988 1.0 1.0 1.0 1.0 1.0 1.0 1.0 1.0 1.0 1.0 1.0 1.0 12.01989 1.0 1.0 1.0 1.0 1.0 1.0 1.0 1.0 1.0 1.0 1.0 1.0 12.01990 1.0 1.0 1.0 1.0 1.0 1.0 1.0 1.0 1.0 1.0 1.0 1.0 12.01991 1.0 1.0 1.0 1.0 1.0 1.0 1.0 1.0 1.0 1.0 1.0 1.0 12.0
96.0

OPERATIONS - TUG LAUNCH SITE SUPPORT733-R00TOTAL MANPOWER SUMMARY BY PROJECT FUNCTION & WBS ELEMENTS (WBS LEVEL 5)
NO: 2C.1C.06.08NAME: FACILITY OPERATIONS SUPPORT
YEAR JAN FEB MAR APR MAY JUNE JULY AUG SEPT OCT NOV DEC TOTAL
1984 1.0 1.0 1.0 1.0 1.0 1.0 1.0 1.0 1.0 1.0 1.0 1.0 12.01985 1.0 1.0 1.0 1.0 1.0 1.0 1.0 1.0 1.0 1.0 1.0 1.0 12.01986 1.0 1.0 1.0 1.0 1.0 1.0 1.0 1.0 1.0 1.0 1.0 1.0 12.01987 1.0 1.0 1.0 1.0 1.0 1.0 1.0 1.0 1.0 1.0 1.0 1.0 12.01988 1.0 1.0 1.0 1.0 1.0 1.0 1.0 1.0 1.0 1.0 1.0 1.0 12.01989 1.0 1.0 1.0 1.0 1.0 1.0 1.0 1.0 1.0 1.0 1.0 1.0 12.01990 1.0 1.0 1.0 1.0 1.0 1.0 1.0 1.0 1.0 1.0 1.0 1.0 12.01991 1.0 1.0 1.0 1.0 1.0 1.0 1.0 1.0 1.0 1.0 1.0 1.0 12.0
96.0NO: 2C.1C.07.03NAME: WESTERN TEST RANGE - GSE
1984 1.0 1.0 1.0 1.0 1.0 1.0 1.0 1.0 1.0 1.0 1.0 1.0 12.01985 1.0 1.0 1.0 1.0 1.0 1.0 1.0 1.0 1.0 1.0 1.0 1.0 12.01986 1.0 1.0 1.0 1.0 1.0 1.0 1.0 1.0 1.0 1.0 1.0 1.0 12.01987 1.0 1.0 1.0 1.0 1.0 1.0 1.0 1.0 1.0 1.0 1.0 1.0 12.01988 1.0 1.0 1.0 1.0 1.0 1.0 1.0 1.0 1.0 1.0 1.0 1.0 12.01989 1.0 1.0 1.0 1.0 1.0 1.0 1.0 1.0 1.0 1.0 1.0 1.0 12.01990 1.0 1.0 1.0 1.0 1.0 1.0 1.0 1.0 1.0 1.0 1.0 1.0 12.01991 1.0 1.0 1.0 1.0 1.0 1.0 1.0 1.0 1.0 1.0 1.0 1.0 12.0
96.0NO: 2C.1C.09.01NAME: LAUNCH SITE SERVICES/SUPPORT
1984 1.0 1.0 1.0 1.0 1.0 1.0 1.0 1.0 1.0 1.0 1.0 1.0 12.01985 1.0 1.0 1.0 1.0 1.0 1.0 1.0 1.0 1.0 1.0 1.0 1.0 12.01986 1.0 1.0 1.0 1.0 1.0 1.0 1.0 1.0 1.0 1.0 1.0 1.0 12.01987 1.0 1.0 1.0 1.0 1.0 1.0 1.0 1.0 1.0 1.0 1.0 1.0 12.01988 1.0 1.0 1.0 1.0 1.0 1.0 1.0 1.0 1.0 1.0 1.0 1.0 12.01989 1.0 1.0 1.0 1.0 1.0 1.0 1.0 1.0 1.0 1.0 1.0 1.0 12.01990 1.0 1.0 1.0 1.0 1.0 1.0 1.0 1.0 1.0 1.0 1.0 1.0 12.01991 1.0 1.0 1.0 1.0 1.0 1.0 1.0 1.0 1.0 1.0 1.0 1.0 12.0
96.0

OPERATIONS - TUG LAUNCH SITE SUPPORT733-R00TOTAL MANPOWER SUMMARY BY PROJECT FUNCTION & WBS ELEMENIS(WBS LEVEL 5)
NO: 2C.1C.09.02NAME: TUG SHUTTLE MATING & CHECKOUT
YEAR JAN FEB MAR APR MAY JUNE JULY AUG SEPT OCT NOV DEC TOTAL
1984 7.2 7.2 14.4
1985 7.2 14.4
1986 7.2 7.2 7.21987 7.2 7.2
1988 7.2 7.2
1989 7.2 14.4
1990 7.2 7.2 7.2
1991 7.2
79.2
NO: 2C.1C.09.03NAME: PRELAUNCH CHECKOUT & COUNTDOWN
1984 4.0 4.0 8.0
8.01985 4.0 8.01986 4.0 4.0 4.0
1987 4.0 4.0
1988 4.0 4.0
1989 4.0 8.0
1990 4.0 4.0 4.0
1991 4.0
44.0
NO: 2C.1C.09.05NAME: POSTFLIGHT SAFING
1984 7.1 7.1 14.2
1985 7.1 7.1
1985 7.1 7.1 14.2
1986 7.1 7.1
1987 7.1 7.1
1988 7.1 7.1
1989 7.1 7.1 14.2
1990 7.1 7.11991 7.1
78.1

OPERATIONS - TUG LAUNCH SITE SUPPORT733-R00TOTAL MANPOWER SUMMARY BY PROJECT FUNCTION & WBS ELEMENTS(WBS LEVEL 5)
NO: 2C.1C.13.03NAME: POST MAINTFNANCE CHECKOUT
YEAR JAN FEB MAR APR MAY JUNE JULY AUG SEPT OCT NOV DEC TOTAL
1984 3.8 3.8 7.61985 3.8 3.81986 3.8 3.8 7.61987 3.8 3.81988 3.8 3.81989 3.8 .3.81990 3.8 3.18 7.61991 3.8 3.8
41.8NO: 2C.1C.13.04NAME: TUG/SPACECRAFT MATING & CHECKOUT
1984 4.0 4.0 8.01985 4.0 4.01986 4.0 4.0 8.01987 4.0 4.0
00 1988 4.0 4.01989 4.0 4.01990 4.0 4.0 8.01991 4.0 4.0
44.0NO: 2C.1C.13.05NAME: REFURBISHMENT REQUIREMENTS PLANNING
1984 .8 .8 1.61985 .8 .81986 .8 .8 1.61987 .8 .81988 .8 .81989 .8 .81990 .8 .8 1.61991 .8 .8
DEPARTMENT TOTAL: 8.8
YEAR JAN FEB MAR APR MAY JUNE JULY AUG SEPT OCT NOV DEC TOTAL
1984 33.9 7.0 7.0 7.0 7.0 7.0 33.9 7.0 7.0 7.0 7.0 7.0 137.81985 33.9 7.0 7.0 7.0 7.0 7.0 7.0 7.0 7.0 7.0 7.0 7.0 110.91986 33.9 7.0 7.0 7.0 7.0 7.0 33.9 7..0.0 7.0 7.0 7.0 137.81987 33.9 7.0 7.0 7.0 7.0 7.0 7.0 7.0 7.0 7.0 7.0 7.0 110.91988 33.9 7.0 7.0 7.0 7.0 7.0 7.0 7.0 7.0 7.0 7.0 7.0 110.91989 33.9 7.0 7.0 7.0 7.0 7.0 7.0 7.0 7.0 7.0 7.0 7.0 110.91990 33.9 7.0 7.0 7.0 7.0 7.0 33.9 7.0 7.0 7.0 7.0 7.0 137.81991 33.9 7.0 7.0 7.0 7.0 7.0 7.0 7.0 7.0 7.0. 7.0 7.0 110.9
967.9

IV. GENERAL INFORMATION

IV. GENERAL INFORMATION- - - - - - - - - - - - - - - - - - ------------------------------"'-"
This section contains the definition of types of labor elements,
and WBS dictionary definition of each WBS element used in this
study. General pricing factors are also included which were used
in establishing the program cost.
A. SUBDIVISIONS OF WORK
The following definitions apply to the six Subdivisions of Work.
Additional subdivisions should be avoided.
1) Engineering is the design, development, analysis, evaluation,
and redesign of Tug hardware, GSE, and associated planning and
analysis activities. It includes such activities as configuration
management, the preparation of specifications, drawings, parts
lists, wiring diagrams, technical coordination between engineer-
ing and other activities, facilities engineering, vendor
coordination, test planning and scheduling, analysis of test
results, safety analysis, data reduction and engineering report
preparation. It includes the engineering activities required
to support the Operation phase. Materials and subcontracts
associated with the above activities are included.
2) Manufacturing includes' product and materials receiving, ware-
housing, fabrication, processing, assembly installati on, re-
working, modifications, experimental production, shop. support
to engineering checkout, preparation of hardware for shipping
and preparation of necessary manufacturing associated paper
work. Includes quality control and inspection activities.
This subdivision also includes technicians who support various
test operations as well as launch operations and refurbishment
activities. Materials and subcontracts associated with the
above activities are included.
3) Toolingqand STE includes planning, design, fabrication, quality
control and inspection, modification, maintenance, and rework
of all tools, dies, jigs, fixtures, gauges, handling equipment,
work platforms, and test equipment and Special West Equipment
(STE) in support of the manufacturing process. It also includes
writing and planning tool orders, certification of welding
operations, maintaining tool and STE records, preparation of
templates, scheduling and controlling all tool and STE orders,
programming and preparation of tapes for all numerically controlled
machine parts, and calibration and periodic maintenance of
production and test tooling. It also includes the necessary
tooling maintenance for the Production and Operational phases.
Materials and subcontracts associated with the above activities
are included.
119

4) Quality and Reliability Assurance (Q&RA) includes theestablishment of Q&RA policies, procedures and requirements;Q&RA review of procurement requests and plans; test plansfrom a Q&RA standpoint and Q&RA report preparation. DevelopsQ&RA training plans and certification of quality controlpersonnel. Also includes failure review, analysis and report-ing. Materials and subcontracts associated with the aboveactivities are included.
5) Testing involves the investigations on all components, assemblies,subsystems, and systems to determine operational characteristics,verify the suitability in meeting the required criteria, andassure compatibility with the overall system and its intendedoperational/nonoperational environment. Such tests includedesign feasibility tests, qualification tests, designverification tests, reliability tests, and bench functionaland environmental tests. Monitoring tests, data reduction,and report preparation are also included. Materials andsubcontracts associated with the above activities are included.
6) Management/other includes all management and administrativeeffort for planning, organizing, coordinating, directing,controlling, and approving that is required to accomplish theprogram objectives. Other items not included in the precedingsubdivision should be included in this item where possible..Materials and subcontracts associated with the above activitiesare included.
B. WORK BREAKDOWN - STRUCTURE DICTIONARY
1.0 WBS Identification Numbers
The Space Tug Ground Operations Study Work Breakdown Structure (WBS)is derived from a WBS used for the Space Tug Systems Study. Itprovides the framework for structuring the various technical plans,operational schedules, cost and manpower estimates for the DDT&Eand operations phases.
Table 24 displays the Tug WBS identification number sequence. Thisnumbering sequence is consistent with the established Tug ProgramWBS levels throughout; however, between Level 3 and Level 4 aProject Function (PF) designator is added to present the cost forground operations at the individual locations of Tug Fleet UtilizationProject Management and Ground and Launch Operations at ETR and WTR.This change in structure from the original study WBS presents thedata under the same WBS numbers but precludes the data from beingdirectly correlated to the earlier study results.
Definitions for each element displayed in the WBS are found in thedictionary.
120

Table 8 Tug WBS Identification Number Sequence
IDENTIFICATION NUMBERXXX PF XX XX
320 SPACE TUG PROJECT
1A 01 Project Management01 Cost/Performance Management02 Project Direction03 Information Management04 Fleet Utilization
IA 02 Systems Engineering & Integration01 Tug Systems Engineering04 Sustaining Engineering
1A 05 Logistics01 Transportation & Handling02 Training03 Inventory Control and Warehousing04 Depot Maintenance
1B 01 ETR Site Management
lB 06 Facilities, ETR03 r ETR Maintenance/Refurbishment04 ETR Launch
IC 01 WTR Site Management06 Facilities, WTR06 05 WTR Maintenance/Refurbishment
06 WTR Launch
1B&C 07 Ground Support Equipment
IB 07 02 Eastern Test Range GSE
IC 07 03 Western Test Range
121

Table 8 Tug WBS Identification Number Sequence (Continued)
IDENTIFICATION NUMBER
XXX PF XX XX
320 IC 09 Launch Operations, Western Test Range01 Launch Site Services/Support02 Tug/Shuttle Mating & Checkout03 Prelaunch Checkout & Countdown04 Propellants & Gases05 Post Flight Safing
IB 10 Launch Operations, Eastern Test Range01 Launch Site Services/Support02 Tug/Shuttle Mating & Checkout03 Prelaunch Checkout & Countdown04 Propellants & Gases05 Post Flight Safing
IC 13 Refurbishment & Integration WTR01 Scheduled Maintenance & Refurbishment02 Unscheduled Maintenance & Reburbishment03 Post Maintenance Checkout04 Tug/Payload Mating & Checkout05 Refurbishment Requirements Planning
IB 14 Refurbishment & Integration ETR01 Scheduled Maintenance & Refurbishment02 Unscheduled Maintenance & Refurbishment03 Post Maintenance Checkout04 Tug/Payload Mating & Checkout05 Refurbishment Requirements Planning
IA 15 Software03 GSE
REPEAT THE ABOVE NUMBERING SYSTEM FOR EACH PHASE, CHANGE 320 TODDT&E -32A and OPERATIONS -32C.
122

Figures 2 and 3 display the WBS charts. Some of the WBS elements
were not used during the DDT&E phase but only during the operations
phase due to the insignificant cost associated with those items.
C. WBS DEFINITIONS
320 SPACE TUG PROJECT - GROUND OPERATIONS
This element summarizes the direct and indirect (G&A and burden)
effort to provide hardware, software, services, and facilities that
are required to develop, operate, and maintain the Space Tug Project
Ground Operations Task. It provides summary information on crew
sizing, task manloading and funding for the Space Tug Ground
Operations Task.
320-1A Tug Fleet Utilization Project Management
This element summarizes the Fleet Utilization Management portion of
the ground operation task which is associated with a central project
management function of controlling budgets, fleet usage and trans-
portation and handling, providing sustaining engineering, training
of crews, and contracting of depot maintenance and vehicle spares.
320-1A-01 Proiect Ground Operations Management
This element summarizes the ground operations management activities
of"planning, organizing, directing, coordinating, controlling and
approval actions required to accomplish overall Space Tug oProject
objectives which are not associated with specific hardware elements.
320-lA-01-01 Cost/Performancd Management
This element includes those activities which assure the integrated
planning, scheduling, budgeting, work authorization and cost
accumulation of all ground operations tasks performed during the
Space Tug Program. Also included are project performance planning,preparation, and maintenance of the Project Management Plan,project schedules, resource status reports, change controls, data
summary analysis, procurement management, and safety management.
320-IA-01-02 Project Direction
This element pertains to the continuous monitoring of all functional
management disciplines to provide central direction and control of
the overall ground operations project. Included are the decision
making for management, timely resolution of problem areas to meet
established schedules, and overall surveillance of project progress
and goals.
123

320-lA-01-03 Information Management
This element refers to the overall management process and activitiesrequired to ensure proper information and documentation flow andcontrol. Included are information coordination; identification,control and monitor of the preparation and maintenance of documentation;establishment implementation and maintenance of the Data ManagementPlan and Procedures; acquisition of data from subcontractors, vendorsand others; preparation, maintenance submittal of the data, dataschedules and accession list; establishment, operation, and maintenanceof a project level information file and a management informationcenter; and public relations.
320-1A-01-04 Fleet Utilization
This element is comprised of the planning and updating of the groundoperations (launch operations and refurbishment and integration)part of the ground and flight operations fleet utilization plan forall Tug missions in the detail required for project management.This element covers the preparation and updating of the fleetutilization plan for ground operations using the mechanized fleetutilization planning system. It includes: 1) preparation of theTug fleet utilization ground operations plan based on missionplanning data, Tug turnaround timelines, desired launch datesand mission priorities; 2) conducting schedule studies andcontingency analysis to establish schedule alternatives for bothadvanced planning and as contingencies occur, and for allocationof Tugs and payloads to near term missions that can meet the turn-around timelines as maintenance requirements for each Tug onavailability of each payload are progressively defined and scheduledthrough the LPS; and 3) updating the Tug fleet utilization plan asdirected by project management. All hardware and software requiredto provide the ground operations part of a mechanized Tug fleetutilization planning system is covered under WBS 320-lA-15.
320-1A-02 Systems Engineering and Integration
This element summarizes the Tug systems engineering task of directingand controlling a ground operations integrated engineering effort,including requirements analysis and integration, system definition,system test definition, interfaces, safety, reliability, maintain-ability, configuration management, quality engineering, and technologyutilization. Excluded are those activities that pertain to majorhardware modifications required to meet new performance specifications.
320-1A-02-01 Tug Systems Engineering
This element pertains to the project management systems engineeringand integration effort required to verify compatibility of designswith requirements of the facility equipment and hardware not signifi-cant enough to maintain manufacturer's representative to meet trafficmodel requirements; to control and direct the engineering activities;to assure proper Space Tug systems integration with both the Shuttleand spacecraft; and to make cost/performance tradeoffs. Alsoincluded are engineering planning, studies, technology utilization,technical risk assessment, reliability engineering, safety engineering,
124
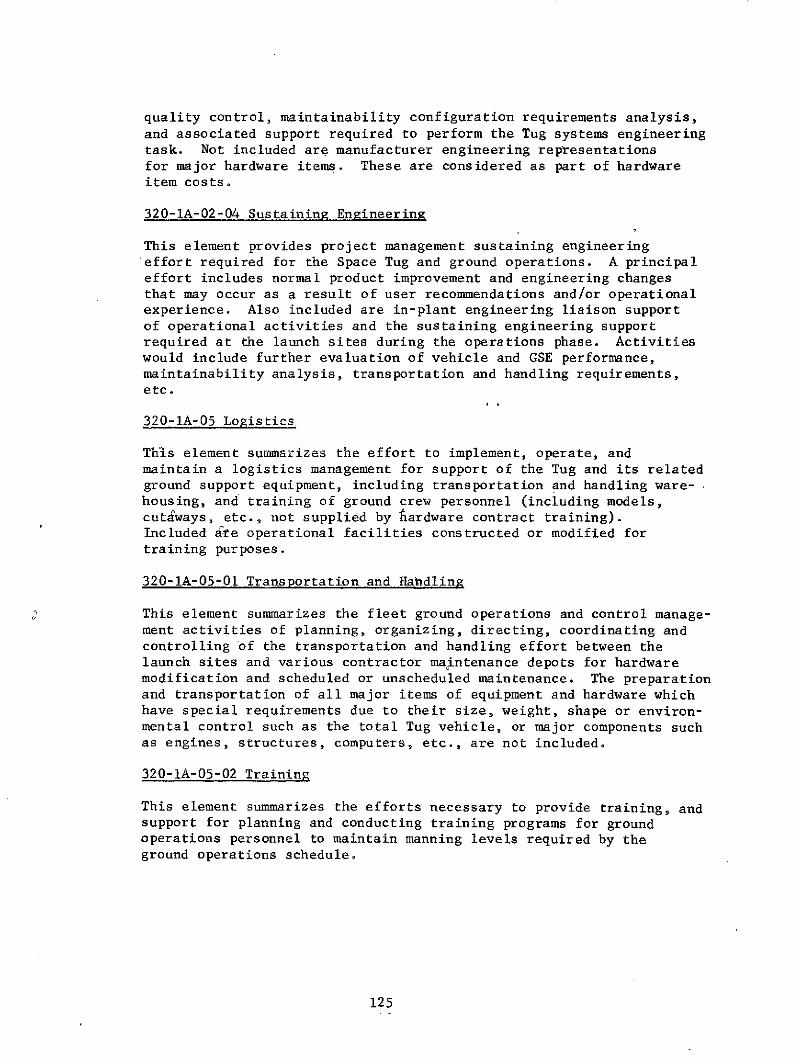
quality control, maintainability configuration requirements analysis,and associated support required to perform the Tug systems engineeringtask. Not included are manufacturer engineering representationsfor major hardware items. These are considered as part of hardwareitem costs.
320-lA-02-04 Sustaining Engineering
This element provides project management sustaining engineeringeffort required for the Space Tug and ground operations. A principaleffort includes normal product improvement and engineering changesthat may occur as a result of user recommendations and/or operationalexperience. Also included are in-plant engineering liaison supportof operational activities and the sustaining engineering supportrequired at the launch sites during the operations phase. Activitieswould include further evaluation of vehicle and GSE performance,maintainability analysis, transportation and handling requirements,etc.
320-lA-05 Logistics
This element summarizes the effort to implement, operate, andmaintain a logistics management for support of the Tug and its relatedground support equipment, including transportation and handling ware-housing, and training of ground crew personnel (including models,cut4ways, etc., not supplied by iardware contract training).Included ate operational facilities constructed or modified fortraining purposes.
320-1A-05-01 Transportation and Handling
This element summarizes the fleet ground operations and control manage-ment activities of planning, organizing, directing, coordinating andcontrolling of the transportation and handling effort between thelaunch sites and various contractor maintenance depots for hardwaremodification and scheduled or unscheduled maintenance. The preparationand transportation of all major items of equipment and hardware whichhave special requirements due to their size, weight, shape or environ-mental control such as the total Tug vehicle, or major components suchas engines, structures, computers, etc., are not included.
320-1A-05-02 Training
This element summarizes the efforts necessary to provide training, andsupport for planning and conducting training programs for groundoperations personnel to maintain manning levels required by theground operations schedule.
125

320-lA-05-03 Inventory Control and Warehousing
This element refers to warehousing and inventory control of materials,
parts, supplies, tooling, equipment, and spares provisioning in
support of development, production, test, and operations of the Tug
system. This element provides a centralized control for warehousing
and inventories for locations including launch, maintenance, and
refurbishment. Costs of inventory computer software and control
system maintenance are provided by LPS.
320-1A-05-04 Depot Maintenance
This element refers to the cost of scheduled and unscheduled depot
maintenance not included under 320-1B-14 and 320-1C-13. The cost
of factory and offsite maintenance and refurbishment are included.
320-1B-01 ETR Ground Operations Management
This element summarizes the ETR ground operation management activities
of planning organizing, directing coordinating, controlling and
approval actions required to accomplish overall Space Tug Project
objectives which are associated with specific hardware elements.
320-IB-01-02 ETR Site Direction
This element pertains to the continuous monitoring of all functional
management disciplines to provide central direction and control of
the overall ground operations project. Included are the decision
making for management, timely resolution of problem areas to meet
established schedules, and overall surveillance of project progress
and goals.
320-IB-01-03 Information Management (ETR)
This element refers to the overall ETR management process and
activities required to ensure proper information and documentation
flow and control. Included are information coordination; identifica-
tion, control and monitor of the preparation and maintenance of
documentation; establishment, implementation and maintenance of the
Data Management Plan and Procedures; acquisition of data from sub-
contractors, vendors and others; preparation, maintenance and
submittal of the data, data schedules and accession list; establish-
ment, operation, and maintenance of a project level information file.
320-1B-06 Facilities, ETR
This element covers launch site facilities (new or modification to
existing) for maintenance, refurbishment, and launch support of an
operational program. The basic launch and operations facilities
are charged to the Shuttle and not the Tug. However, those launch
site facilities built specifically for Tug are costed. This effort
includes facilities planning, acquisition or modification, and
maintenance. Amortization of adequate existing facilities will not
be included.
126

320-lB-06-03 Maintenance and Refurbishment, ETR
This element includes all additional or modifications to existingfacilities at ETR required for maintenance and refurbishment of the
operational Tug. Maintenance and refurbishment facilities include
those necessary to accomplish on-site maintenance and repair, field
site modifications and vehicle storage.
320-IB-06-04 ETR Launch
This element includes all additional or modification to existing
launch facilities at the Eastern Test Range for the Tug. Only the
additional facilities built or modified specifically to configure the
launch facilities for Tug acceptance are included.
320-IC-06 Facilities, WTR
This element covers launch site facilities (new or modification to
existing) for maintenance, refurbishment, and launch support of an
operational program. The basic launch and operations facilities
are charged to the Shuttle and not the Tug. However, those launch
site fgcilities built specifically for Tug are costed. This effort
includes facilities planning, acquisition or modification, andmaintenance. Amortization of adequate existing facilities will not
be included.
320-C1-06-05 Maintenance and Refurbishment. WTR
This element definition is the same as 320-1B-06-03 and is used for
reporting WTR maintenance and refurbishment facilities.
320-1C-06-06 WTR Launch
This element includes all additions or modifications to existing launch
facilities at the Western Test Range for the Tug. Only the additional
facilities built or modified specifically to configure the launch
facilities for Tug acceptance are included.
320-B&C-07 Ground Support Equipment (GSE)
This element includes Site Activation and Maintenance of all GSE
required for the Tug vehicle operations. Included are all ground
based equipment required to support launch, recovery and maintenance
phases of the Tugs during operations. This element also includes
installation and checkout of Tug GSE associated with flight hardware.
320-1C-07-03 Western Test Range GSE
This element includes WTR site activation and maintenance of ground
based equipment required to support launch, recovery and maintenance
of the Tugs during operations. This element also includes installa-
tion and checkout of Tug GSE associated with flight hardware.
127

320-IC-09 Launch Operations, Western Test Range
This element provides for services manpower and operations requiredto perform those activities that comprise pre-launch and launch of theTug vehicle. These activities include launch site services/support,Tug/Shuttle mating and checkout, pre-launch checkout and countdown,launch propellants and gases, and post flight safing. Crews and supportwill be provided by ETR personnel on a temporary basis as needed tosupport WTR launches.
320-IC-09-01 Launch Site Services/Support
This element covers the support services effort to those activitiesthat comprise prelaunch and launch of the Tug vehicle. Includedare Tug peculiar procedure input functions, report preparation, datareduction, and analysis and test procedure preparation.
320-C1-09-02 Tug/Shuttle Mating and Checkout
Includes that effort, expended by Tug vehicle personnel, necessary toplace the Tug in the orbiter cargo bay, connect the interfaces, andvalidate system readiness; all integrated tests from mating toprelaunch checkout. Also included is the travel costs of the launchsupport crew.
320-IC-09-03 Prelaunch Checkout and Countdown
Includes that effort necessary for on-line test of flight hardware andassociated GSE during the period between Tug/Shuttle mating and count-down. Includes that effort necessary to prepare for and perform thecountdown to launch. Any countdown demonstration tests required toqualify the countdown procedure will fall under this category.
320-lC-09-04 Propellants and Gases
This element provides the fluids and gases required by the Tug forflight operations. Costs of operating the propellant farm fall underthe Shuttle program.
320-C10-09-05 Post Flight Safing
Includes that effort accomplished immediately after recovery necessaryto remove any ordnance flight equipment and/or neutralize harzardousconditions prior to removal of the Tug from the orbiter cargo bay.This element also includes the non-hazardous activities that takeplace immediately after orbiter landing, such as orbiter-Tug dematingand Tug-payload demating and preparation for shipment to ETR.
320-lB-10 Launch Operations, ETR
This element provides for services and operations required to performthose activities that comprise pre-launch and launch of the Tugvehicle. These activities include launch site services/support, Tug/
128

Shuttle mating and checkout, pre-launch checkout and countdown,
launch propellants and gases, and post flight safing. This effortis performed by a launch operations crew consisting of a chief of
test operations, three test conductors, eight avionics engineers,seven propulsion engineers, five structural/mechanical/thermal engi-
neers, ten avionics technicians, ten propulsion technicians, tenstructural/mechanical/thermal technicians, a chief of safety andthree safety engineers, two programmer/software engineers and eight
inspectors. A portion of this crew, thirty four (34) people, willtravel to WTR to support launches from that site. Since this crewsupports all the lower WBS elements in 320-IB-10 and 320-1B-14 thelower elements are man loaded by an approximate percentage of the total
160 hr turnaround time applied to each task. Hence the cost by taskin the lower element may be artificially high but the net result atlevel 4 is correct.
320-IB-10-01 Launch Site Services/Support
This element covers the support services effort to those activities
that comprise prelaunch and launch of the Tug vehicle. Included areTug peculiar procedure input functions, report preparation, data
reduction, and analysis, OM&H manual updates, vehicle and GSE status.
This effort will be maintained by a payload/configuration engineer,a logistics engineer and a configuration control engineer on a full
time basis. Another configuration controS engineer is used at bothsites-to support launches.
320-lB-10-02 Tug/Shuttle Mating and Checkout
Includes that effort, expended by Tug vehicle personnel, necessary toplace the Tug in the orbiter cargo bay, connect the interfaces, andvalidate system readiness; all integrated tests from mating to
prelaunch checkout.
320-lB-10-03 Prelaunch Checkout and Countdown
Includes that effort necessary for on-line test of flight hardwareand associated GSE during the period between Tug/Shuttle mating andcountdown. Includes that effort necessary to prepare for and performthe countdown to launch. Any countdown demonstration tests requiredto qualify the countdown procedure will fall under this category.
320-lB-10-04 Propellants and Gases
This element provides the fluids and gases required by the Tug forflight operations. Costs of operating the propellant farm fall underthe Shuttle program.
320-IB-10-05 Post Flight Safing
Includes that effort accomplished immediately after recovery necessaryto remove any ordnance flight equipment and/or neutralize hazardousconditions prior to removal of the Tug from the orbiter cargo bay. This
129
element also includes the non-hazardous activities that take placeimmediately after orbiter landing, such as orbiter-Tug demating andTug-spacecraft demating.
320-IC-13 Refurbishment and Integration, WTR
This element refers to preparing the Tug for shipment to the CentralRefurbishment facility in excess of the effort covered under 320-lC-09-05, post flight safing. The element also covers the effort requiredupon return of the refurbished Tug from the Central RefurbishmentFacility. Included are all onsite transferring, Tug preshipment tasksand post shipment tasks including transfer, inspection, test andstorage. Also included are preflight requirement planning effortssuch as scheduling, Tug-to-spacecraft mating and checkout.
320-IC-13-01 Scheduled Maintenance and Refurbishment. WTR
This effort is now handled at ETR but material spares are charged hereon a per flight basis.
320-1C-13-02 Unscheduled Maintenance and Refurbishment, WTR
This effort is now handled at ETR.
320-1C-13-03 Post Maintenance Checkout, WTR
This element refers to the support required to verify maintenanceactions after shipment to WTR. Includes that effort necessary totest and verify Tug vehicle subsystems and components after schedulesor unschedules maintenance/refurbishment has been accomplished, priorto Tug/Spacecraft mate.
320-IC-13-04 Tug/Spacecraft Mating and Checkout
Includes that effort prior to Tug/Shuttle mating necessary to performthe operation of mating a particular spacecraft to the Tug and thesubsequent verification of the interfaces.
320-1C-13-05 Refurbishment Requirements Planning
This element includes preflight requirement planning efforts, such as
Tug inspection requirements, Tug-to-spacecraft mating and checkout.
320-1B-14 Refurbishment and Integration, ETR
This element refers to restoring the reusable Tug after each mission to
a readiness condition for subsequent missions. All costs pertainingto ferrying the vehicle to an onsite maintenance facility, inspection,
maintenance, replacement of necessary parts and testing are included.This activity is completed when the Tug is ready for launch operations.
Includes both refurbishment and normal turnaround maintenance andcheckout between flights, both scheduled and unscheduled. (Not
including depot maintenance.) Also included are preflight requirement
planning efforts, such as Tug inspection requirements, reliability
130

versus refurbishment tradeoffs, scheduling Tug-to-spacecraft matingand checkout. Hardware costs for spares are included in thiselement for ETR launches only.
320-1B-14-01 Scheduled Maintenance and Refurbishment
This element provides the scheduled maintenance and refurbishmentrequired to maintain the Tug vehicle in a flight-worthy condition.Includes all labor and miscellaneous materials needed for scheduledmaintenance, including vehicles spares for ETR launches.
320-IB-14-02 Unscheduled Maintenance and Refurbishment
This element provides the unscheduled maintenance and refurbishmentrequired to maintain the Tug vehicle in a flight-worthy condition.
Includes all labor and miscellaneous materials needed for unscheduled
maintenance (including vehicle spares).
320-IB-14-03 Post Maintenance Checkout
This element refers to the support required to verify maintenance
actions. Includes that effort necessary to test and verify Tug
vehicle subsystems and components after scheduled or unscheduledmaintenance, refurbishment has been accomplished, prior to Tug/
Payload mate.
320-1B-14-04 Tug/Payload Mating and Checkout
Includes that effort prior to Tug/Shuttle mating necessary to perform
the operation of mating a particular payload/payloads to the Tug andthe subsequent verification of the interfaces.
320-1B-14-05 Refurbishment Requirements Planning
This element includes preflight requirement planning efforts, such as
Tug inspection requirements, reliability versus refurbishment trade-
offs, scheduling, Tug-to-Payload mating and checkout.
320-IA-15 Software
For ground operations this element provides for the maintenance and
integration effort during the DDT&E and operations phase. GSE softwareintegration included interfacing with on-board and mission softwareand hardware to assure compatibility in the Tug Avionics IntegrationLaboratory (TAIL). Maintenance includes software configuration controland developing and inputting the data for specific mission and GSE
applications, and also includes the computer operational costs ofperforming normal business functions and the complex task of fleetutilization planning.
131
320-15-03 GSE
For ground operations this element includes the maintenance andintegration during the maintenance period of software that is used withthe LPS for all Tug program applications (including loading on-boardsoftware into the Tug on-board computers), software used with otherGSE for ground checkout of Tug equipment and systems, and simulationsoftware for the TAIL. Integration of software and hardware in theTAIL is limited to the GSE requirements and constraints for eachlaunch. GSE software development, computer program changes, anddevelopment and maintenance of the software Program RequirementsDocuments for Orbiter/Tug and Spacecraft/Tug interfaces requiringground checkout, and for interfacing with mechanized fleetutilization system for long range planning and integration isincluded. The cost of business management functions are alsoincluded.
D. BASIS FOR ESTIMATE
The basis for estimate contains the definition of terms common toboth the DDT&E and operations phase compiled data and provides thepricing factors used in estimating the program costs.
1.0 Computer Systems
CDC 6000 computer system is a high speed large scale digital computingsystem dedicated to solving engineering problems and used for themechanized long range planning effort to be used by the Tug FleetManagement Office.
IBM 370-158 computer system is a high speed large scale computerwhich covers the range from medium scale through large scale systemsand provides the advantages of high speed arithmetic and logicalability with stored program techniques. It is used for businessmanagement functions.
2.0 Government Furnished Equipment (GFE)
747 ferry cost was developed from operating costs for 747 aircraft bymajor airlines at $2,500/hr with an estimated flying time of 16 hoursround trip from ETR to WTR and return with the Tug as cargo. Thecost is handled as a GFE cost to the Tug Fleet Utilization projectoffice under transportation and handling.
Also included as GSE are the Tug vehicle spares and the propellantsand gases for each mission. No procurement rates are applied tothese items. Vehicle spares were assumed to be part of the vehiclecontract cost of the Tug vehicle.
Expendable material such as janitorial suppliers at ETR and subcon-tracted work at WTR for maintenance of the GSE are estimated quantities.
132

E. PRICING FACTORS
Labor Rates - The ETR and WTR labor rates of $8.07/hr is that currently
in use for launch vehicle crews in January 1975.
For the Tug Fleet Utilization project management we used $10.19/hr
as an average rate.
Overhead - A 110% overhead rate was applied to all direct cost with
the exception of the computer center costs.
Management and Administrative - Only the computer center cost have
a 16.7% M&A rate applied.
Computer Costs - The CDC 6000 computer system cost if $636/unit.
The IBM 370-158 computer system cost if $313/unit.
Man Month - One manmonth equals 164 manhours.
GSE Items - No factors were applied to GFE items such as spares and
propellants.
Other Direct Charges - 2.5% of total direct labor.
Miscellaneous Material - $0.17/manhour to cover engineer and technician
usage.
Travel , Relocation, Per Diem, TDY Expenses - A rate of $.81/manhour
was used for all sites to cover general travel requirements of a broad
based program.
Launch Rate - By Site
1984 1985 1986 1987 1988 1989 1990 1991 TOTAL
ETR 17 21 22 17 17 15 24 21 154
WTR 2 1 2 1 1 1 2 1 11
TOTAL 19 22 24 18 18 16 26 22 165
Propellant and Gases - The estimated cost of LH , LO2, hydrazine,
N204 helium and GN2 including the order factor or loses is $16,751
per launch GFE cost using current design weights of propellants and
gases and current prices for these items.
Spares - These costs are estimated on a per flight basis using datafrom a previous transtage Tug study.
133