Tufts GIS Center Basic Mapping Livelihood Zones 2009 · PDF file · 2015-09-24Basic...
9
Tufts GIS Center 1 Basic Mapping : Livelihood Zones In Haiti - 2009 Barbara Parmenter, revised by Carolyn Talmadge 9/24/2015 DATA SOURCES...................................................................................................................................................... 1 MAPPING NETWORK DRIVES ................................................................................................................................. 1 SETTING UP ........................................................................................................................................................... 2 BASIC MAP CLEANUP ............................................................................................................................................. 2 APPLY AN APPROPRIATE MAP PROJECTION/COORDINATE SYSTEM ...................................................................... 3 WORKING WITH THE LIVELIHOOD ZONE DATA LAYER ........................................................................................... 3 DRAW ONLY MAJOR RIVERS .................................................................................................................................. 5 DRAW MAJOR ROADS ........................................................................................................................................... 6 DISPLAY DEPARTMENT CAPITALS AND THE NATIONAL CAPITAL ............................................................................ 6 CREATING A LOCATOR MAP .................................................................................................................................. 8 CREATING YOUR LAYOUT ...................................................................................................................................... 9 Data Sources We are going to make the map above using ArcMap 10.2.2. The original data sets in this exercise are from: Livelihood Zones - Famine Early Warning System Network (FEWSNet) - http://www.fews.net/sectors/livelihoods Shaded Relief – ESRI Maps and Data - http://www.arcgis.com/home/group.html?q=tags:ArcMap931_Base&t=group&owner=esri&title=ESRI%20Maps %20and%20Data&sortField=title&sortOrder=asc&content=all Roads, cities, rivers - US AID Data Repository of the Geographic Information Support Team (GIST) - https://gist.itos.uga.edu/ Mapping Network Drives outside the GIS Lab The data that will be used in this tutorial is located in the S: drive. To use files in the S: drive on a computer outside the GIS lab (Mugar Lab, Eaton Lab) you must first map the network drive in Windows. 1. Check to see if the S drive is already mapped in Computer. If it is not, follow these directions: 2. Windows 7 – Go to Start –> Computer –> Map Network Drive tab (this includes Eaton and Mugar Labs) 3. In the drop down menu labeled Drive: choose S:
Transcript of Tufts GIS Center Basic Mapping Livelihood Zones 2009 · PDF file · 2015-09-24Basic...
Tufts GIS Center
1
Basic Mapping: Livelihood Zones In Haiti - 2009
Barbara Parmenter, revised by Carolyn Talmadge 9/24/2015
DATA SOURCES ...................................................................................................................................................... 1
MAPPING NETWORK DRIVES ................................................................................................................................. 1
SETTING UP ........................................................................................................................................................... 2
BASIC MAP CLEANUP ............................................................................................................................................. 2
APPLY AN APPROPRIATE MAP PROJECTION/COORDINATE SYSTEM ...................................................................... 3
WORKING WITH THE LIVELIHOOD ZONE DATA LAYER ........................................................................................... 3
DRAW ONLY MAJOR RIVERS .................................................................................................................................. 5
DRAW MAJOR ROADS ........................................................................................................................................... 6
DISPLAY DEPARTMENT CAPITALS AND THE NATIONAL CAPITAL ............................................................................ 6
CREATING A LOCATOR MAP .................................................................................................................................. 8
CREATING YOUR LAYOUT ...................................................................................................................................... 9
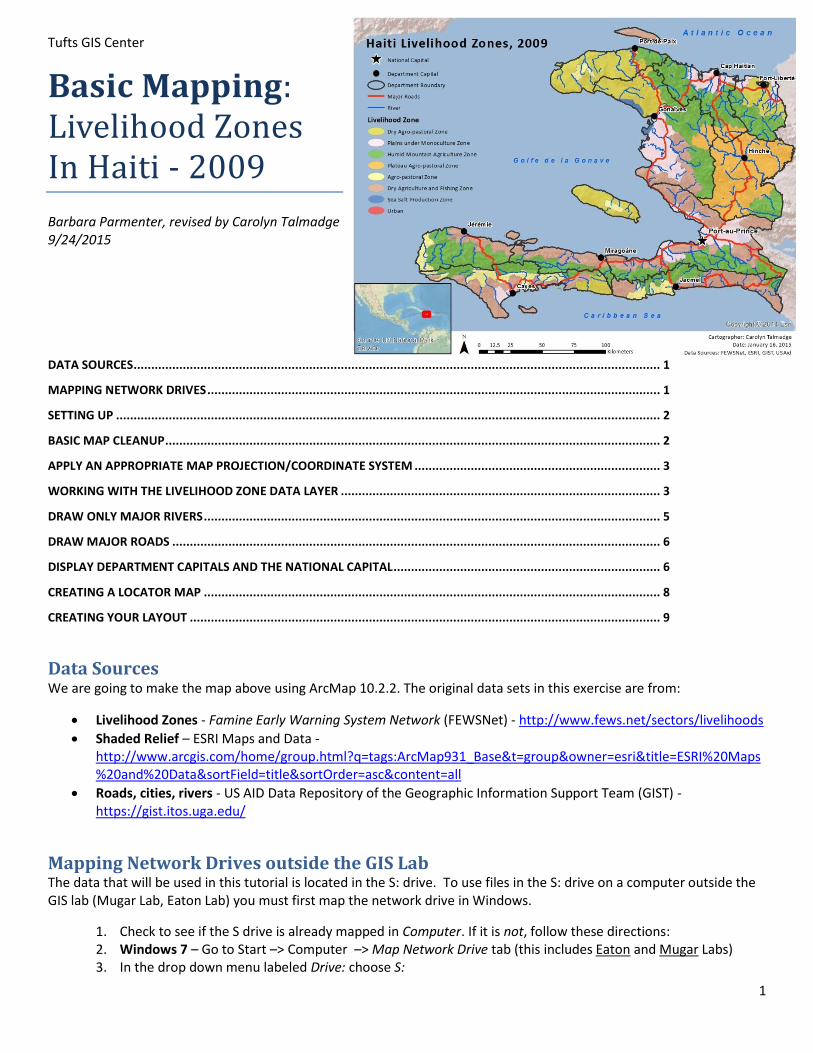
Data Sources We are going to make the map above using ArcMap 10.2.2. The original data sets in this exercise are from:
Livelihood Zones - Famine Early Warning System Network (FEWSNet) - http://www.fews.net/sectors/livelihoods
Shaded Relief – ESRI Maps and Data - http://www.arcgis.com/home/group.html?q=tags:ArcMap931_Base&t=group&owner=esri&title=ESRI%20Maps%20and%20Data&sortField=title&sortOrder=asc&content=all
Roads, cities, rivers - US AID Data Repository of the Geographic Information Support Team (GIST) - https://gist.itos.uga.edu/
Mapping Network Drives outside the GIS Lab The data that will be used in this tutorial is located in the S: drive. To use files in the S: drive on a computer outside the GIS lab (Mugar Lab, Eaton Lab) you must first map the network drive in Windows.
1. Check to see if the S drive is already mapped in Computer. If it is not, follow these directions: 2. Windows 7 – Go to Start –> Computer –> Map Network Drive tab (this includes Eaton and Mugar Labs) 3. In the drop down menu labeled Drive: choose S:
Tufts GIS Center
2
4. In the Folder: drop down menu manually enter (or copy and paste) the following pathway: \\rstore2.uit.tufts.edu\gisprojects$
5. Check the box Reconnect at logon. Click Finish. 6. Look to see that you have a personal drive (P or H) available to save your map file.
Setting Up your ArcMap Session
1. You can access the data two separate ways:
1) Navigate to S:\classes\DHP_P207\Basic_Mapping_Practice. Copy the Basic_mapping_exercise_Haiti.mxd file to your personal storage drive (H: or P: drive).
2) Download and unzip the data that accompanies this tutorial at GIS.tufts.edu to your personal (H or P) drive.
2. Open the map session (.mxd) from your personal drive by double-clicking on it.
3. After the map appears, choose File – Add Data – Add Data from ArcGIS Online…
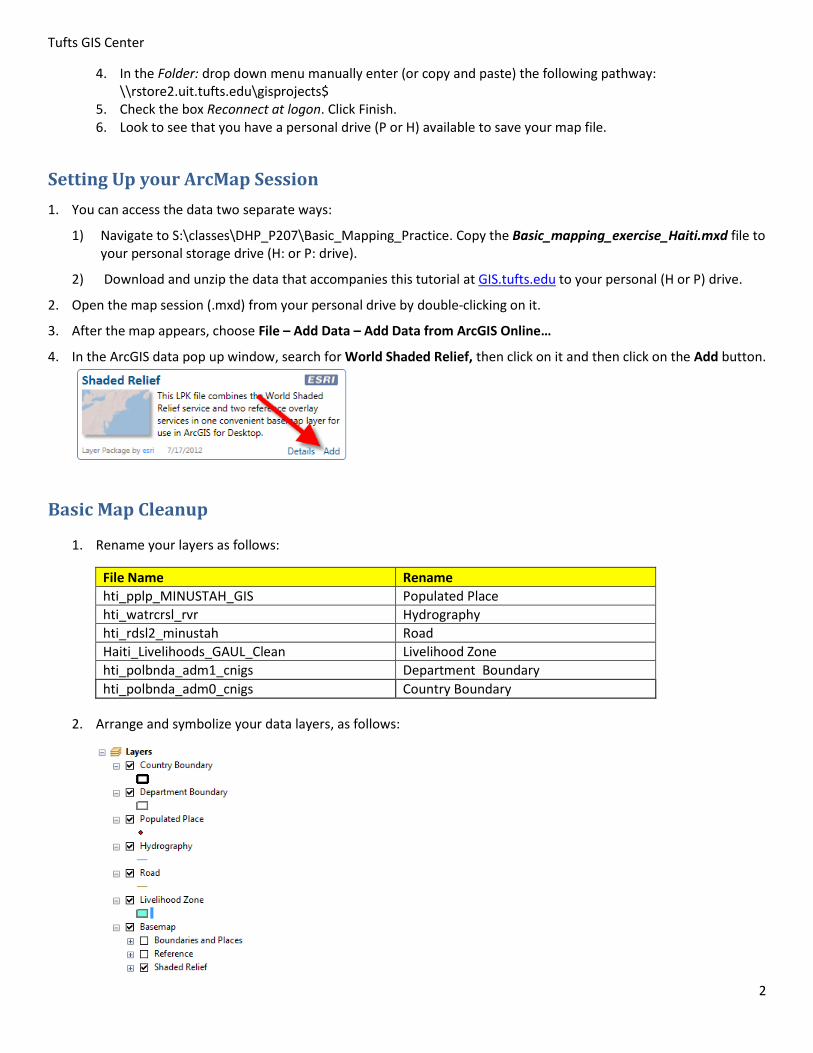
4. In the ArcGIS data pop up window, search for World Shaded Relief, then click on it and then click on the Add button.
Basic Map Cleanup
1. Rename your layers as follows:
File Name Rename
hti_pplp_MINUSTAH_GIS Populated Place
hti_watrcrsl_rvr Hydrography
hti_rdsl2_minustah Road
Haiti_Livelihoods_GAUL_Clean Livelihood Zone
hti_polbnda_adm1_cnigs Department Boundary
hti_polbnda_adm0_cnigs Country Boundary
2. Arrange and symbolize your data layers, as follows:
Tufts GIS Center
3
Apply an Appropriate Map Projection/Coordinate System
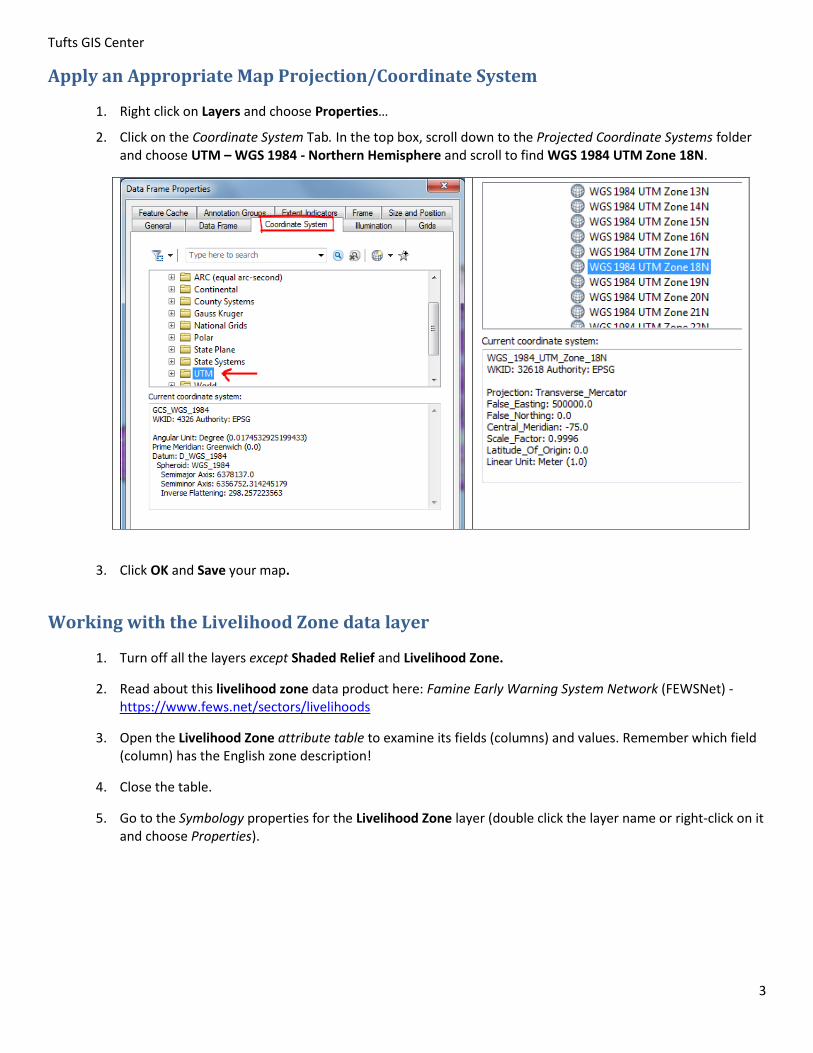
1. Right click on Layers and choose Properties…
2. Click on the Coordinate System Tab. In the top box, scroll down to the Projected Coordinate Systems folder and choose UTM – WGS 1984 - Northern Hemisphere and scroll to find WGS 1984 UTM Zone 18N.
3. Click OK and Save your map.
Working with the Livelihood Zone data layer
1. Turn off all the layers except Shaded Relief and Livelihood Zone.
2. Read about this livelihood zone data product here: Famine Early Warning System Network (FEWSNet) - https://www.fews.net/sectors/livelihoods
3. Open the Livelihood Zone attribute table to examine its fields (columns) and values. Remember which field (column) has the English zone description!
4. Close the table.
5. Go to the Symbology properties for the Livelihood Zone layer (double click the layer name or right-click on it and choose Properties).
Tufts GIS Center
4
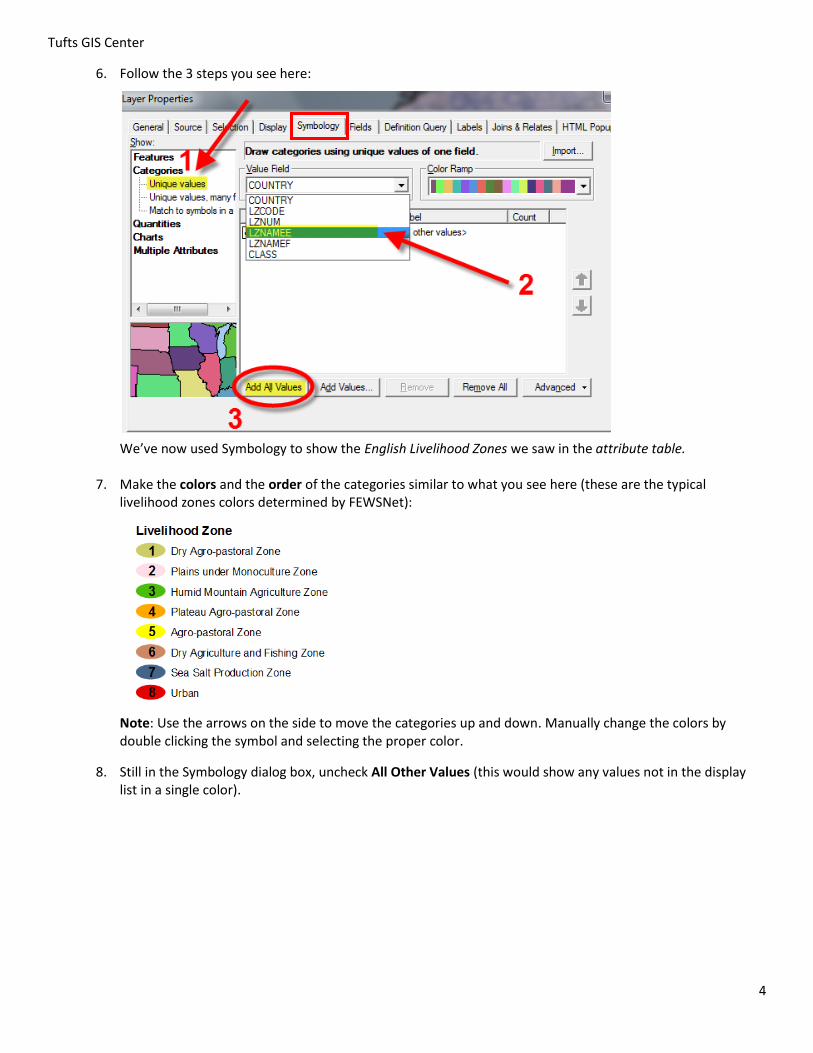
6. Follow the 3 steps you see here: We’ve now used Symbology to show the English Livelihood Zones we saw in the attribute table.
7. Make the colors and the order of the categories similar to what you see here (these are the typical livelihood zones colors determined by FEWSNet):
Note: Use the arrows on the side to move the categories up and down. Manually change the colors by double clicking the symbol and selecting the proper color.
8. Still in the Symbology dialog box, uncheck All Other Values (this would show any values not in the display list in a single color).
Tufts GIS Center
5
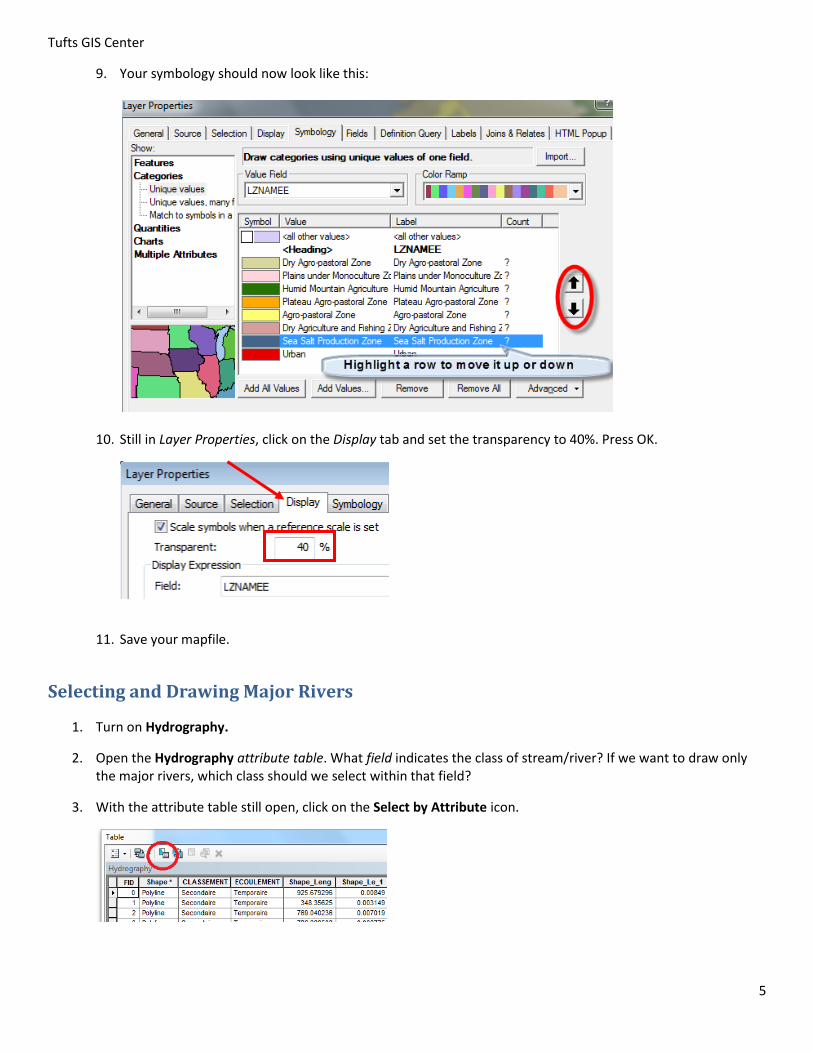
9. Your symbology should now look like this:
10. Still in Layer Properties, click on the Display tab and set the transparency to 40%. Press OK.
11. Save your mapfile.
Selecting and Drawing Major Rivers
1. Turn on Hydrography.
2. Open the Hydrography attribute table. What field indicates the class of stream/river? If we want to draw only the major rivers, which class should we select within that field?
3. With the attribute table still open, click on the Select by Attribute icon.
Tufts GIS Center
6
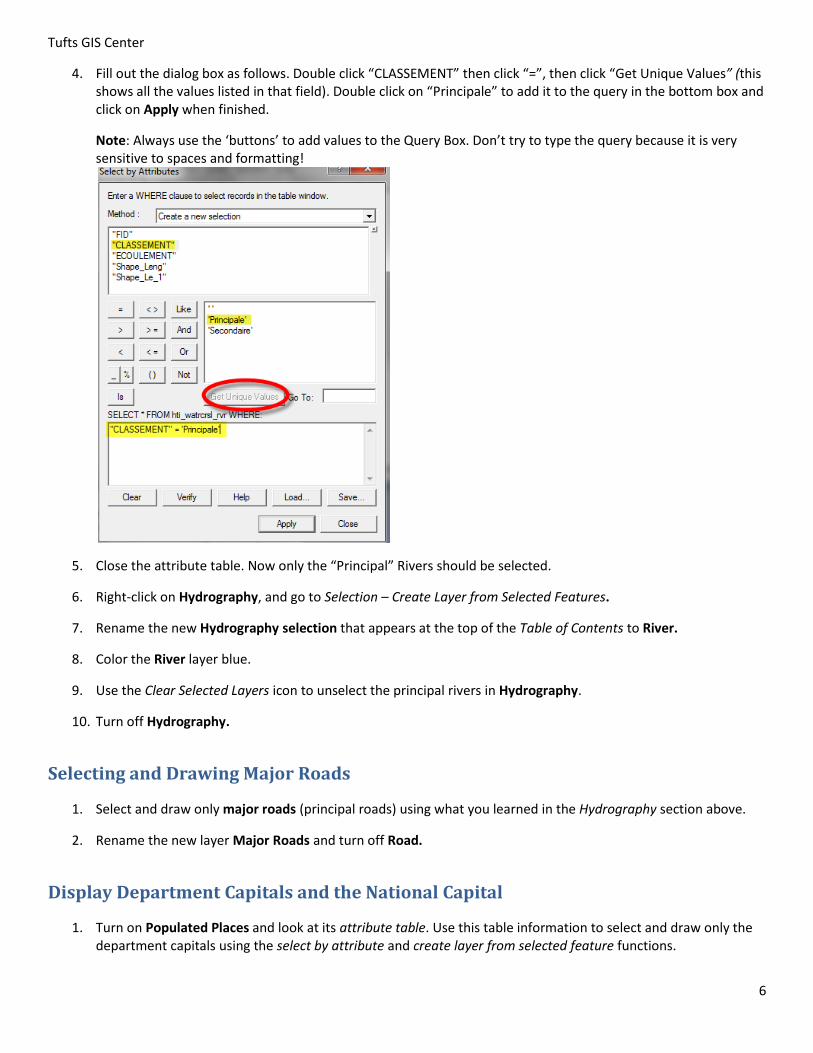
4. Fill out the dialog box as follows. Double click “CLASSEMENT” then click “=”, then click “Get Unique Values” (this shows all the values listed in that field). Double click on “Principale” to add it to the query in the bottom box and click on Apply when finished.
Note: Always use the ‘buttons’ to add values to the Query Box. Don’t try to type the query because it is very sensitive to spaces and formatting!
5. Close the attribute table. Now only the “Principal” Rivers should be selected.
6. Right-click on Hydrography, and go to Selection – Create Layer from Selected Features.
7. Rename the new Hydrography selection that appears at the top of the Table of Contents to River.
8. Color the River layer blue.
9. Use the Clear Selected Layers icon to unselect the principal rivers in Hydrography.
10. Turn off Hydrography.
Selecting and Drawing Major Roads
1. Select and draw only major roads (principal roads) using what you learned in the Hydrography section above.
2. Rename the new layer Major Roads and turn off Road.
Display Department Capitals and the National Capital
1. Turn on Populated Places and look at its attribute table. Use this table information to select and draw only the department capitals using the select by attribute and create layer from selected feature functions.
Tufts GIS Center
7
2. Rename this new layer Department Capital and change the symbol to a black dot at an appropriate size.
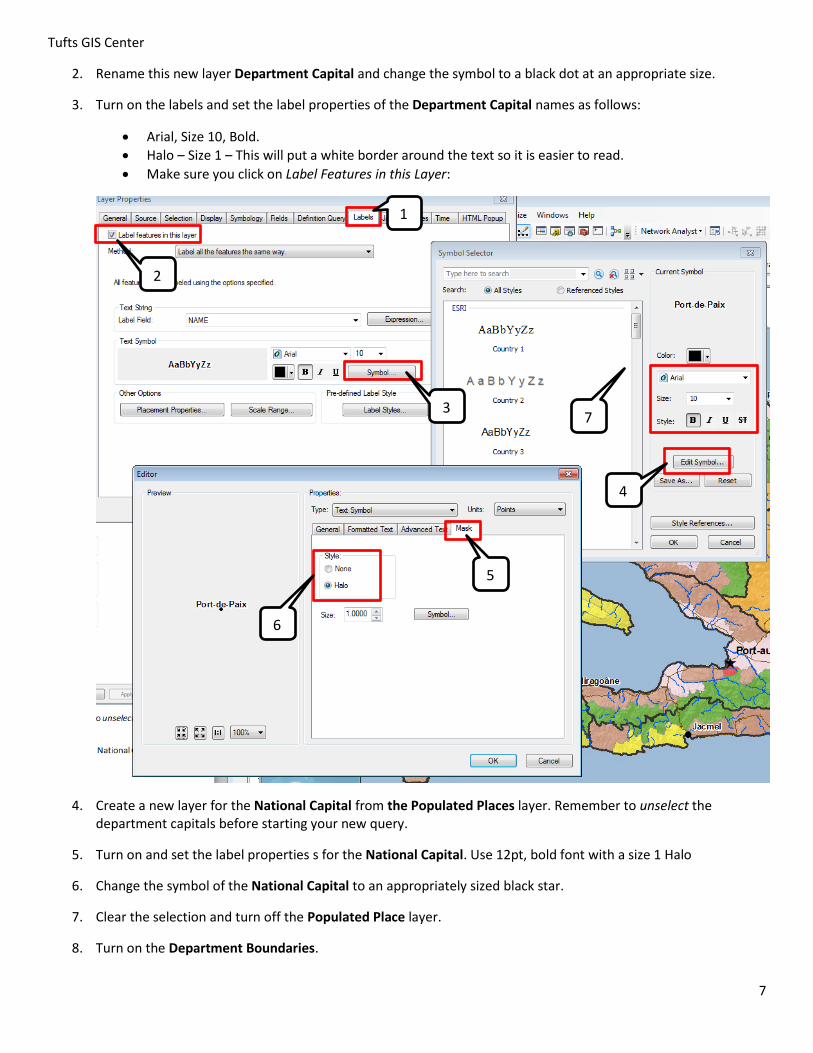
3. Turn on the labels and set the label properties of the Department Capital names as follows:
Arial, Size 10, Bold.
Halo – Size 1 – This will put a white border around the text so it is easier to read.
Make sure you click on Label Features in this Layer:
4. Create a new layer for the National Capital from the Populated Places layer. Remember to unselect the department capitals before starting your new query.
5. Turn on and set the label properties s for the National Capital. Use 12pt, bold font with a size 1 Halo
6. Change the symbol of the National Capital to an appropriately sized black star.
7. Clear the selection and turn off the Populated Place layer.
8. Turn on the Department Boundaries.
1
2
3
4
5
6
7
Tufts GIS Center
8
Creating a Locator Map
You need to show where Haiti is relative to the rest of North America.
1. Click on Insert (on the menu bar) to insert a new data frame.
2. Rename what is now called New Data Frame to Locator Map.
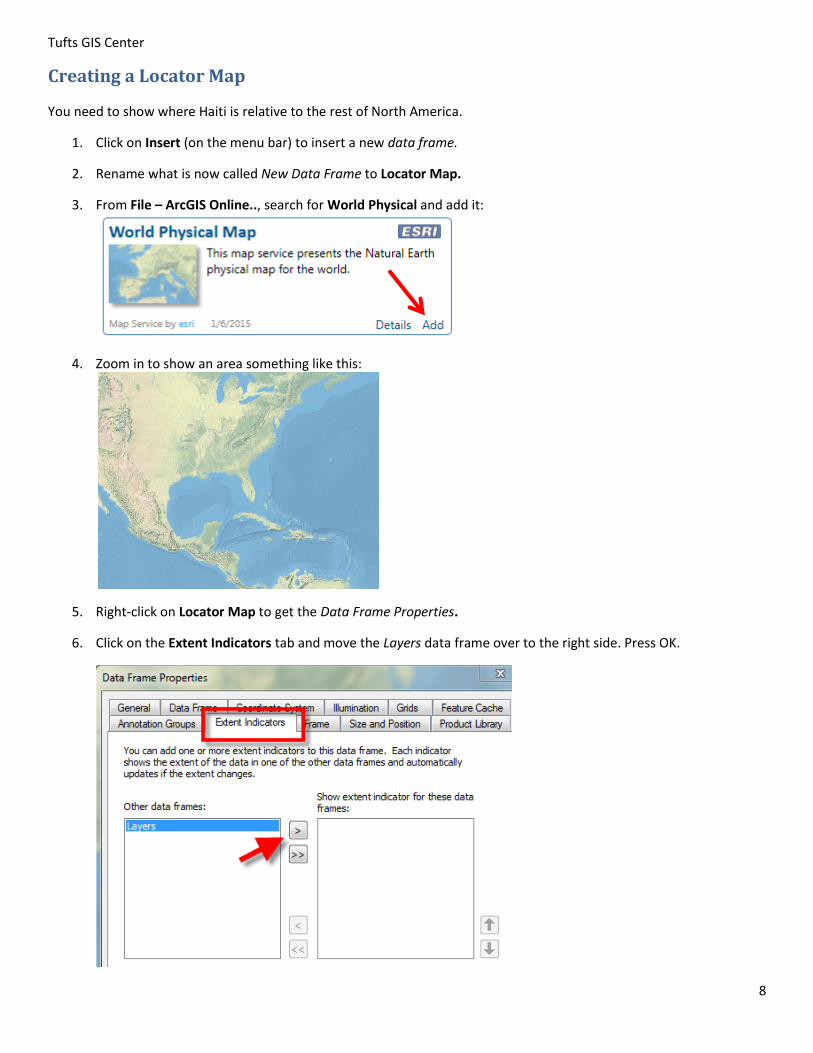
3. From File – ArcGIS Online.., search for World Physical and add it:
4. Zoom in to show an area something like this:
5. Right-click on Locator Map to get the Data Frame Properties.
6. Click on the Extent Indicators tab and move the Layers data frame over to the right side. Press OK.
Tufts GIS Center
9
Creating your Layout
Remember that the original tutorial for Learning ArcGIS Basics (India) has instructions on how to make a good map layout. We will make the map of Haiti that is on page 1 of this tutorial.
1. When you are ready to begin your layout, go to View – Layout View.
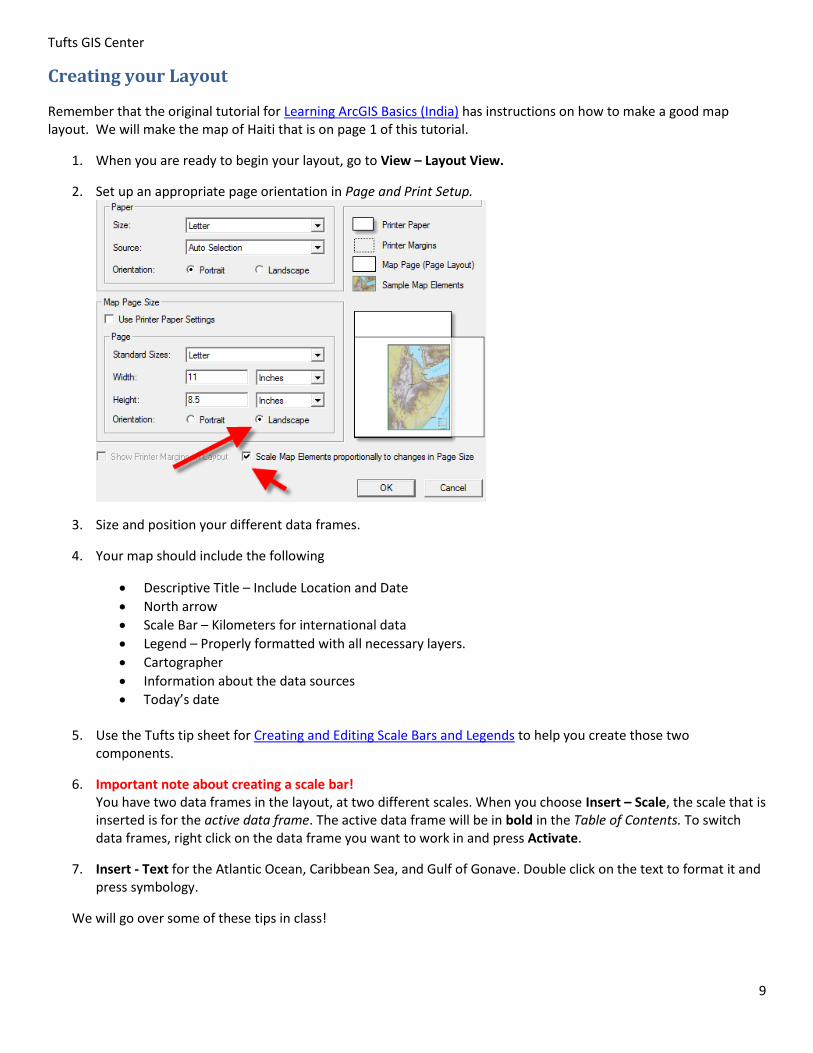
2. Set up an appropriate page orientation in Page and Print Setup.
3. Size and position your different data frames.
4. Your map should include the following
Descriptive Title – Include Location and Date
North arrow
Scale Bar – Kilometers for international data
Legend – Properly formatted with all necessary layers.
Cartographer
Information about the data sources
Today’s date
5. Use the Tufts tip sheet for Creating and Editing Scale Bars and Legends to help you create those two components.
6. Important note about creating a scale bar! You have two data frames in the layout, at two different scales. When you choose Insert – Scale, the scale that is inserted is for the active data frame. The active data frame will be in bold in the Table of Contents. To switch data frames, right click on the data frame you want to work in and press Activate.
7. Insert - Text for the Atlantic Ocean, Caribbean Sea, and Gulf of Gonave. Double click on the text to format it and press symbology.
We will go over some of these tips in class!