tuberculosis drugs
9
open access www.bioinformation.net Prediction Model Volume 7(2) ISSN 0973-2063 (online) 0973-8894 (print) Bioinformation 7(2): 82-90 (2011) 82 © 2011 Biomedical Informatics 2D-QSAR model development and analysis on variant groups of anti -tuberculosis drugs Neeraja Dwivedi 1, 2, 3 *, Bhartendu Nath Mishra 1 , Vishwa Mohan Katoch 3 1 Department of Biotechnology, Institute of Engineering & Technology, Lucknow-226021, India; 2 Department of Biotechnology, College of Engineering & Technology, IFTM, Lodhipur-Rajput, Delhi Road, Moradabad-244001, India; 3 Department of Health Research (Govt. of India) & Indian Council of Medical Research, Ansari Nagar, NewDelhi-110029, India; Neeraja Dwivedi –Email: [email protected]; Phone: +91-9411027695; *Corresponding author Received August 18, 2011; Accepted August 19, 2011; Published September 06, 2011 Abstract: A quantitative structure activity relationship study was performed on different groups of anti-tuberculosis drug compound for establishing quantitative relationship between biological activity and their physicochemical /structural properties. In recent years, a large number of herbal drugs are promoted in treatment of tuberculosis especially due to the emergence of MDR (multi drug resistance) and XDR (extensive drug resistance) tuberculosis. Multidrug-resistant TB (MDR-TB) is resistant to front-line drugs (isoniazid and rifampicin, the most powerful anti-TB drugs) and extensively drug-resistant TB (XDR-TB) is resistant to front-line and second-line drugs. The possibility of drug resistance TB increases when patient does not take prescribed drugs for defined time period. Natural products (secondary metabolites) isolated from the variety of sources including terrestrial and marine plants and animals, and microorganisms, have been recognized as having antituberculosis action and have recently been tested preclinically for their growth inhibitory activity towards Mycobacterium tuberculosis or related organisms. A quantitative structure activity relationship (QSAR) studies were performed to explore the antituberculosis compound from the derivatives of natural products . Theoretical results are in accord with the in vitro experimental data with reported growth inhibitory activity towards Mycobacterium tuberculosis or related organisms. Antitubercular activity was predicted through QSAR model, developed by forward feed multiple linear regression method with leave-one-out approach. Relationship correlating measure of QSAR model was 74% (R 2 = 0.74) and predictive accuracy was 72% (RCV 2 = 0.72). QSAR studies indicate that dipole energy and heat of formation correlate well with anti-tubercular activity. These results could offer useful references for understanding mechanisms and directing the molecular design of new lead compounds with improved anti-tubercular activity. The generated QSAR model revealed the importance of structural, thermodynamic and electro topological parameters. The quantitative structure activity relationship provides important structural insight in designing of potent antitubercular agent. Keywords: 2D-QSAR, Mycobacterium tuberculosis, MDR, MIC, TPSA Background: Infectious diseases are influencing the world with their morbidity and mortality. Tuberculosis is one among the major infectious diseases caused by Mycobacterium tuberculosis [1, 2]. It remains the leading cause of mortality due to a bacterial pathogen. WHO estimated that there were 8.8 million new cases of tuberculosis in 2020. About one-third of the world population is infected with M. tuberculosis, 10% of which will develop the disease at some point in their lives [3]. Four prescribed drugs named as Isoniazid (INH), Rifampin, Pyrazinamide, and Ethambutol, are currently used for the treatment of active TB for a period of at least 6 months. Due to long time period, patients generally failed to complete the therapy which leads to the emergence of multidrug resistant TB (MDRTB) and extensively drug resistant TB (XDRTB). The susceptibility of active TB increases rapidly because of human
Transcript of tuberculosis drugs

open access www.bioinformation.net Prediction Model
Volume 7(2)
ISSN 0973-2063 (online) 0973-8894 (print) Bioinformation 7(2): 82-90 (2011) 82 © 2011 Biomedical Informatics
2D-QSAR model development and analysis on variant groups of anti -tuberculosis drugs Neeraja Dwivedi1, 2, 3*, Bhartendu Nath Mishra1, Vishwa Mohan Katoch3 1Department of Biotechnology, Institute of Engineering & Technology, Lucknow-226021, India; 2Department of Biotechnology, College of Engineering & Technology, IFTM, Lodhipur-Rajput, Delhi Road, Moradabad-244001, India; 3Department of Health Research (Govt. of India) & Indian Council of Medical Research, Ansari Nagar, NewDelhi-110029, India; Neeraja Dwivedi –Email: [email protected]; Phone: +91-9411027695; *Corresponding author Received August 18, 2011; Accepted August 19, 2011; Published September 06, 2011 Abstract: A quantitative structure activity relationship study was performed on different groups of anti-tuberculosis drug compound for establishing quantitative relationship between biological activity and their physicochemical /structural properties. In recent years, a large number of herbal drugs are promoted in treatment of tuberculosis especially due to the emergence of MDR (multi drug resistance) and XDR (extensive drug resistance) tuberculosis. Multidrug-resistant TB (MDR-TB) is resistant to front-line drugs (isoniazid and rifampicin, the most powerful anti-TB drugs) and extensively drug-resistant TB (XDR-TB) is resistant to front-line and second-line drugs. The possibility of drug resistance TB increases when patient does not take prescribed drugs for defined time period. Natural products (secondary metabolites) isolated from the variety of sources including terrestrial and marine plants and animals, and microorganisms, have been recognized as having antituberculosis action and have recently been tested preclinically for their growth inhibitory activity towards Mycobacterium tuberculosis or related organisms. A quantitative structure activity relationship (QSAR) studies were performed to explore the antituberculosis compound from the derivatives of natural products . Theoretical results are in accord with the in vitro experimental data with reported growth inhibitory activity towards Mycobacterium tuberculosis or related organisms. Antitubercular activity was predicted through QSAR model, developed by forward feed multiple linear regression method with leave-one-out approach. Relationship correlating measure of QSAR model was 74% (R2 = 0.74) and predictive accuracy was 72% (RCV2 = 0.72). QSAR studies indicate that dipole energy and heat of formation correlate well with anti-tubercular activity. These results could offer useful references for understanding mechanisms and directing the molecular design of new lead compounds with improved anti-tubercular activity. The generated QSAR model revealed the importance of structural, thermodynamic and electro topological parameters. The quantitative structure activity relationship provides important structural insight in designing of potent antitubercular agent. Keywords: 2D-QSAR, Mycobacterium tuberculosis, MDR, MIC, TPSA
Background: Infectious diseases are influencing the world with their morbidity and mortality. Tuberculosis is one among the major infectious diseases caused by Mycobacterium tuberculosis [1, 2]. It remains the leading cause of mortality due to a bacterial pathogen. WHO estimated that there were 8.8 million new cases of tuberculosis in 2020. About one-third of the world population is infected with M. tuberculosis, 10% of which will
develop the disease at some point in their lives [3]. Four prescribed drugs named as Isoniazid (INH), Rifampin, Pyrazinamide, and Ethambutol, are currently used for the treatment of active TB for a period of at least 6 months. Due to long time period, patients generally failed to complete the therapy which leads to the emergence of multidrug resistant TB (MDRTB) and extensively drug resistant TB (XDRTB). The susceptibility of active TB increases rapidly because of human
BIOINFORMATION open access
ISSN 0973-2063 (online) 0973-8894 (print) Bioinformation 7(2): 82-90 (2011) 83 © 2011 Biomedical Informatics
immunodeficiency virus (HIV) infections, which exacerbated the situation. World Health Organization (WHO) has declared TB a global public health emergency [4]. Therefore, the development of new drugs with activity against multi drug-resistant (MDR) TB, extensively drug-resistant (XDR) TB, and latent TB is a priority task. New drug agents that will shorten the duration of current chemotherapy are also needed. Due to these factors however, tuberculosis still remains a leading cause of death world-wide. Natural products, or their direct derivatives, play crucial roles in the modern day chemotherapy of tuberculosis [5]. There is currently a re-emerging interest in natural products as being able to provide novel structures for the drug discovery effort and being particularly effective as antibacterial lead [6-8]. In the present study we cover the literature published on natural products or their direct derivatives that exhibit growth inhibitory activity towards mycobacteria, and in particular the causative pathogen of tuberculosis, Mycobacterium tuberculosis. Current natural product and related derivative antimycobacterial agents exhibit wide-ranging in vitro potency towards M. tuberculosis, with minimum inhibitory concentrations (MIC) from 0.2 µg/ml (rifampicin) through 10 µg/ml (cycloserine) [9]. The main objective of the present study was the search for novel natural compounds that would show a promise to become useful antimycobacterial agent. A series of compounds of Phenolics and quinines, Peptides, Alkaloids, Terpenes: Monoterpenes, Diterpenes, Sesquiterpenes, Triterpenes, Steroids and their synthetic, semisynthetic derivatives were selected as novel antimycobacterial agents for 2D-QSAR studies. In the present study, we screen out potential anti-tubercular activity through quantitative structure activity relationship (QSAR) for which a multiple linear QSAR regression model was developed which successfully establishes the anti-tubercular activity of different compounds in accord with the in vitro experimental data. The 2D-QSAR model provides the activity dependent structural descriptors and predicts the effective dose of other derivatives, and suggests their possible toxicity range. The relationship correlating measure of QSAR model was 74% (R2 =0.74) and predictive accuracy was 72% (RCV2 = 0.72). Using Lipinsky’s ‘Rule of Five’ Druggability of studied compounds was evaluated and in silico ADME analysis was done through bioavailability filters. QSAR studies indicate that dipole energy and heat of formation correlate well with anti-tubercular activity. These results could offer useful references for understanding mechanisms and directing the molecular design of new lead compounds with improved antitubercular activity. Methodology: The natural and synthetic drug compounds exhibiting the potent antimycobacterial Activity was taken from the reported work [14-29].The literature values and general structure of the molecule are given in (Table 1, see Supplementary material) The activity data given as MIC values. The biological activity value [MIC (µg/ml)] reported in literature are converted to -log scale and subsequently used as the dependent variable for the QSAR analysis. The -log values of MIC along with the structure of the 24 compounds in the series is presented in (Table 2, see Supplementary material), the chemical structures of known drugs were retrieved through the PubChem compound database at NCBI (http://www.pubchem.ncbi.nlm.nih.gov), while others are drawn in chem-axon /marwin sketch software. All the computational studies were performed using the
Scigress Explorer v7.7.0.47. The optimization of the cleaned molecules was done through MO-G computational application that computes and minimizes an energy related to the heat of formation. The MO-G computational application solves the Schrodinger equation for the best molecular orbital and geometry of the ligand molecules. The augmented Molecular Mechanics (MM2/MM3) parameter was used for optimizing the molecules up to its lowest stable energy state. This energy minimization is done until the energy change is less than 0.001 kcal/mol or the molecules are updated almost 300 times. Then optimized molecules were selected for calculation of the physiochemical descriptors by inserting biological activity as a dependable variable. Various 2D descriptors were calculated for optimized structures of the molecules using QSAR module of Scigress Explorer v7.7.0.47. A large number of descriptors were generated like structural, topological, electro topological and thermodynamic descriptor. The descriptor pool was reduced by removing invariable column in Scigress Explorer. The remaining physicochemical descriptors were taken into account for the reported analysis. Manual data selection method was used for data selection and variable selection. Forward feed multiple linear regression mathematical expression was then used to predict the biological response of other derivatives. QSAR analysis is a mathematical procedure by which the chemical structures of molecules is quantitatively correlated with a well defined parameter, such as biological activity or chemical reactivity. For example, biological activity can be expressed quantitatively as in the concentration of a substance required to give a certain biological response. Additionally, when physicochemical properties or structures are expressed by numbers, one can form a mathematical relationship, or quantitative structure-activity relationship, between the two. The mathematical expression can then be used to predict the biological response of other chemical structures. QSAR’s most general mathematical form is; Activity = f (physiochemical properties and/or structural properties) A QSAR model attempts to find consistent relationships between the variations in the values of molecular properties and the biological activity for a series of compounds which can then be used to evaluate properties of new chemical entities [10, 11] Some of the important chemical descriptors used in multiple linear regression analysis are: atom count (all atoms), atom count (carbon), atom count (hydrogen), atom count (oxygen), bond count (all bonds), conformation minimum energy (kcal/mole), connectivity index (order 0, standard), connectivity index (order 1, standard), connectivity index (order 2, standard), dipole moment (debye), dipole vector X (debye), dipole vector Y (debye), dipole vector Z (debye), electron affinity (eV), dielectric energy (kcal/mole), steric energy (kcal/mole), total energy (Hartree), group count (amine), group count (carboxyl), group count (ether), group count (hydroxyl), group count (methyl), heat of formation (kcal/mole), HOMO energy (eV), ionization potential (eV), lambda max UV-visible (nm), lambda max far-UV-visible (nm), LogP, LUMO energy (eV), molar refractivity, molecular weight, polarizability, ring count (all rings), size of smallest ring, size of largest ring, and solvent accessibility surface area (Å2). Lipinski’s rule of five pharmacokinetics filter was used as a drug likeness test [10]. Briefly, this rule is based on the observation that most orally administered drugs have a molecular weight (MW) of 500 or
BIOINFORMATION open access
ISSN 0973-2063 (online) 0973-8894 (print) Bioinformation 7(2): 82-90 (2011) 84 © 2011 Biomedical Informatics
less, a logP no higher than 5, five or fewer hydrogen bond donor sites, and 10 or fewer hydrogen bond acceptor sites (N and O atoms). In addition, the bioavailability of all derivatives or test compounds was assessed through topological polar surface area analysis. Molinspiration offers free on-line cheminformatics services (http://www.molinspiration.com/cgi-bin/properties). The structures of the molecule were sketched in Molinspiration, and the physicochemical properties such as logP, polar surface area, number of hydrogen bond donors and acceptors and bioactivity scores such as GPCR ligands, kinase inhibitors, ion channel modulators etc. were predicted [12].
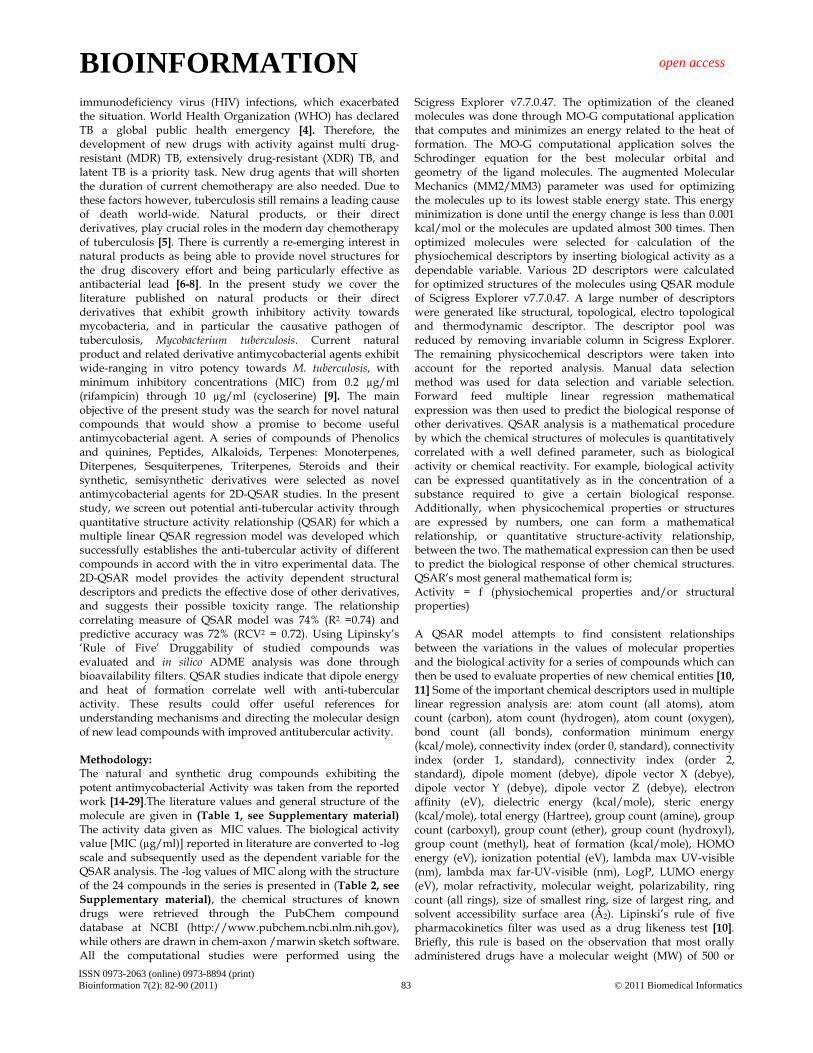
Figure 1: Fitness plot between experimental and predicted activity (log MIC) of training and test set. Results and Discussion: Quantitative structure-activity relationship (QSAR) modeling: Structure activity relationship has been denoted by QSAR model showing significant activity-descriptors relationship accuracy of 74% (R2 = 0.74) and activity prediction accuracy of 72% (RCV2 = 0.72). Initially a total of 79 drugs were used for QSAR modeling against 42 chemical descriptors. Only two descriptors were found to be significant and seem to be responsible for in vitro anti- tubercular activity (Table 4, see Supplementary material). A forward feed multiple linear regression QSAR model was developed using leave-one-out approach for the prediction of biological activity of anti tuberculosis drug molecules. We looked for a simpler descriptor for the prediction of biological in vitro activity for studied class of compounds. QSAR studies indicate that dipole energy and heat of formation correlate well with biological activity (Table 4, see Supplementary material). The QSAR mathematical model equation derived through multiple linear regression method is given below, showing relationship between in vitro experimental activity (MIC) and dependent two chemical descriptors: The best 2DQSAR and the statistics obtained are listed below: Predicted log MIC) (µg/ml) = +2.4116*Dielectric Energy (kcal/mole)-0.00395099*Heat of Formation (kcal/mole) +1.64401 [RCV2 = 0.72 (72%) and R2 = 0.74 (74%)] Eighteen drug molecules with reported anti-mycobacterial activity were included in the training data set for comparison and six molecules used as test set for evaluation of prediction
accuracy of QSAR model. Results showed that predicted activity of Oleanolic Acid and Betulin were comparable with experimental activity. A plot between experimental activity and predicted activity for both training and test set, is shown as fitness plot (Figure 1). Results indicate that Betulin molecule had higher anti –tubercular activity than Oleanolic Acid. Compliance of studied compounds also verified by Lipinski’s rule-of-five for drug likeness (Table 3, see Supplementary material). Results indicate that compounds follow most of the ADME properties, thus leading to a good drug candidate for antimycobacterial and antitubercular activity. This helped in establishing the pharmacological activity of natural compounds for their use as potential drugs. Moreover, when we calculated the topological polar surface area (TPSA) as a chemical descriptor for passive molecular transport through membranes, results showed lower TPSA of natural compounds than standard drugs (Table 3, see Supplementary material). TPSA allows for prediction of transport properties of drugs and has been linked to drug bioavailability. Generally, it has been seen that passively absorbed molecules with a TPSA > 140 Å2 are thought to have low oral bioavailability [13]. On the basis of bioavailability scores, we concluded that natural compounds have marked antimycobacterial activity but higher log P as compared to standard drugs. Model 1 C=+2.28525*Q-0.00361321*T+1.6501 rCV^2=0.66622 r^2=0.703016. Model 2 C=+2.22983*Q-0.00324021*T+1.66726 rCV^2=0.681594 r^2=0.72418 Model 3 C=+2.40735*Q-0.00423825*T+1.6047 rCV^2=0.700135 r^2=0.723656 Model 4 C=+2.4116*Q-0.00395099*T+1.64401 rCV^2=0.72135 r^2=0.744826 Conclusion: Twenty four natural and synthetic drug compounds are evaluated for antimycobacterial activity by 2D QSAR studies with oleanolic acid and betulin exhibiting good activity. The 2D technique indicates the importance of dielectric energy and heat of formation of the compounds on activity. ADME and Tox Predictions indicate that these compounds do not violate the Lipinski’s rule of five. In this sequence, dielectric energy, heats of formation physico-chemical parameter are common in all four models. These parameter show positive contribution in all four models. Therefore it is considered as desirable properties of MTB inhibitors. Comparison of different statistical parameters and validation parameters for models 1-4 suggests model 4 for further consideration. It has good correlation between biological activity and parameters as RCV2 = 0.72 (72%) and R2 = 0.74 (74%) variance in inhibitory activity. The low standard error demonstrates accuracy of the model. Descriptors used in the Significant QSAR Model-4 with value is given in Table 4. QSAR model with reliable predictive power for MTB inhibitory activity has been successfully demonstrated. The good correlation between experimental and predicted

BIOINFORMATION open access
ISSN 0973-2063 (online) 0973-8894 (print) Bioinformation 7(2): 82-90 (2011) 85 © 2011 Biomedical Informatics
biological activity for compounds in the test set further highlights the reliability of the constructed QSAR model. The finding of the study will be helpful in the design of the potent MTB inhibitors which are useful for anti-tubercular activity. Acknowledgment: The authors are grateful to Prof. S. P. Gupta, Department of Pharmaceutical Technology, MIET, Meerut, U.P., India for providing an expert opinion for 2D-QSAR model development. We are also thankful for his generous help and encouragement during the course of experimental work and manuscript preparation. References: [1] Bogatcheva E et al. J Med Chem. 2006 49: 3045 [PMID:
16722620] [2] Janin YL. Bioorg Med Chem. 2007 15: 2479 [PMID:
17291770] [3] Nunn P et al. World Health. 1999 46: 7 [4] Raviglione MD et al. JAMA. 1995 273: 220 [PMID: 7807661] [5] Dwivedi N et al. The Open Nutraceuticals Journal 2011 4:
119 [6] Newman DJ et al. Nat Prod Rep. 2000 17: 215 [PMID:
10888010] [7] Koehn FE & Carter GT. Nat Rev Drug Discov. 2005 4: 206
[PMID: 15729362] [8] Butler MS & Buss AD. Biochem Pharmacol. 2006 71: 919
[PMID: 16289393] [9] Copp BR. Nat Prod Rep. 2003 20: 535 [PMID: 14700198] [10] Lipinski CA et al. Adv Drug Deliv Rev. 2001 46: 3 [PMID:
11259830]
[11] Yoshida F & Topliss JG. J Med Chem. 2000 43: 2575 [PMID: 10891117]
[12] Ertl P et al. Ddt: Biosilico. 2004 2: 201 [13] Ertl P et al. J Med Chem. 2000 43: 3714 [PMID: 11020286] [14] Gomez-Flores R et al. American-Eurasian Journal of Scientific
Research 2008 3: 188 [15] Chen FC et al. J Nat Prod. 2005 68: 1318 [PMID: 16180806] [16] Boruwa J et al. Bioorg Med Chem Lett. 2004 14: 3571 [PMID:
15177476] [17] Collins L & Franzblau SG. Antimicrob Agents Chemother.
1997 41: 1004 [PMID: 9145860] [18] Sayed KAE et al. Tetrahedron. 2000 56: 949 [19] Gu JQ et al. Planta Med. 2004 70: 509 [PMID: 15229801] [20] Woldemichael GM et al. J Nat Prod. 2004 67: 598 [PMID:
15104489] [21] Xu ZQ et al. Bioorg Med Chem. 2004 12: 1199 [PMID:
14980631] [22] Guchi KI et al. Chem Pharm Bull. 1989 37: 2553 [23] Cynamon MH et al. Antimicrob Agents Chemother. 1999 43:
1189 [PMID: 10223934] [24] Vacher S et al. J Antimicrob Chemother. 1999 44: 647 [PMID:
10552981] [25] Ji B et al. Antimicrob Agents Chemother. 1998 42: 2066
[PMID: 9687408] [26] Slayden RA et al. Antimicrob Agents Chemother. 1996 40:
2813 [PMID: 9124847] [27] Jiménez A et al. Phytother Res. 2005 19: 320 [PMID:
16041726] [28] Wube AA et al. Photochemistry. 2005 66: 2309 [PMID:
16153670] [29] Rukachaisirikul T et al. Chem Pharm Bull. 2004 52: 760
[PMID: 15187402]
Edited by P Kangueane
Citation: Dwivedi et al. Bioinformation 7(2): 82-90 (2011) License statement: This is an open-access article, which permits unrestricted use, distribution, and reproduction in any medium,
for non-commercial purposes, provided the original author and source are credited.
BIOINFORMATION open access
ISSN 0973-2063 (online) 0973-8894 (print) Bioinformation 7(2): 82-90 (2011) 86 © 2011 Biomedical Informatics
Supplementary material: Table 1: Biological activity data and calculated –Log value for compounds
Chemical Sample and PubChem ID
MIC MIC=log(B)
CID_2794_Clofazimine 0.31 -0.509 CID_3893_Lauric 10 1 CID_5922_Isonicotinic 12 1.079 CID_6098_Cloxacillin 0.31 -0.509 CID_8655_Syringaldehyde 25 1.398 CID_10494_Oleanolic 28.7 1.458 CID_64945_Ursolic 41.9 1.622 CID_64971_Betulinic 62.1 1.793 CID_64972_Calanolide 12 1.079 CID_72326_Betulin 30 1.477 CID_72943_Heteronemin 6.25 0.796 CID_73214_Eperozolid 0.25 -0.602 CID_149096_Ofloxacin 0.5 -0.301 CID_152946_Moxifloxacin 0.375 -0.426 CID_441401_Linezolid 0.5 -0.301 CID_445629_Thiolactomycin 5 0.699 CID_463811_Litosterol 3.13 0.496 CID_465951_Oxazolidininone 1 0 CID_477494_Nephalsterol 12.5 1.097 CID_638072_Squalene 100 2 CID_3008606_Lecheronol B 128 2.107 CID_5280450_Linoleic 10 1 CID_6480075_Bornyl 25 1.398 CID_10018804_Lecheronol A 4 0.602
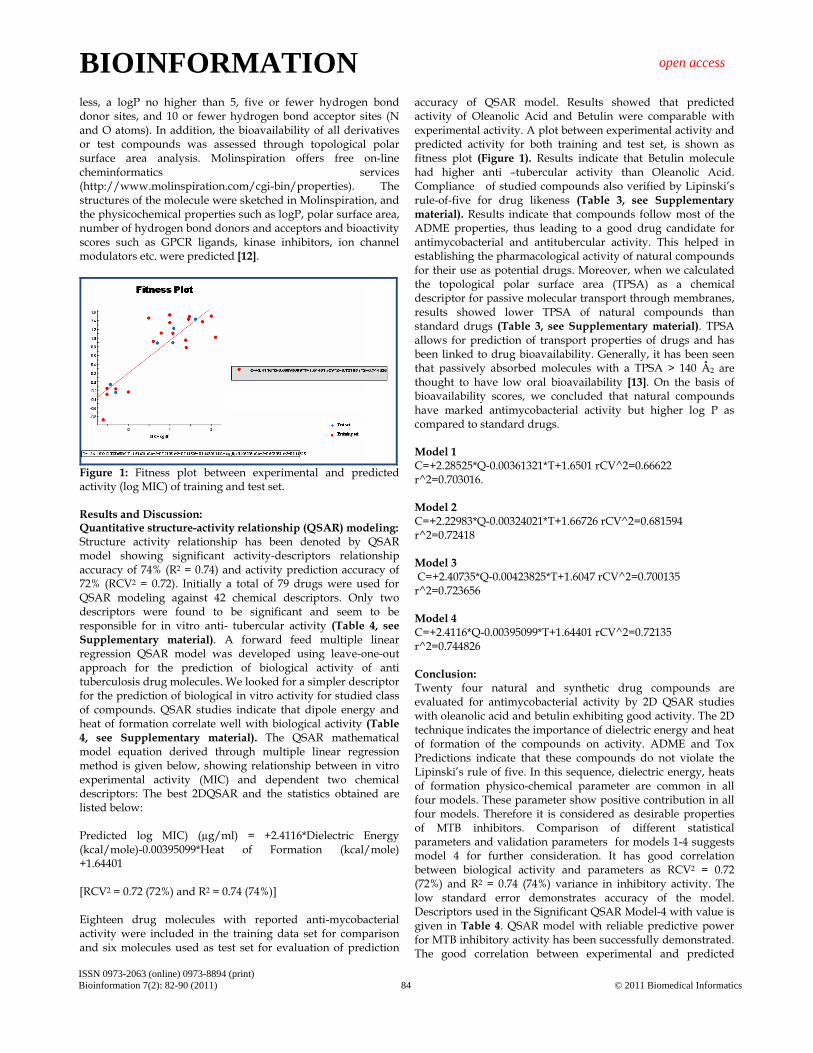
Table 2: Molecule structures and references considered for 2D-QSAR study along with experimental & calculated activities
S. No.
PubChem Compound ID and Name
Exp MIC µg/ml
Structure Exp log MIC
Pred log MIC
References
1 CID_2794_Clofazimine 0.31
-0.509 -0.155
14
2 CID_3893_Lauric Acid 10
1 1.526
15
3* CID_5922_Isonicotinic Acid
12
1.079
0.89
16

BIOINFORMATION open access
ISSN 0973-2063 (online) 0973-8894 (print) Bioinformation 7(2): 82-90 (2011) 87 © 2011 Biomedical Informatics
4 CID_6098_Cloxacillin
0.31
-0.509
-0.292
17
5 CID_8655_Syringaldehyde 25
1.398 0.785
15
6 CID_10494_Oleanolic Acid 28.7
1.458 1.433
18
7* CID_64945_Ursolic Acid 41.9
1.622 1.429
19
8 CID_64971_Betulinic Acid 62.1
1.793 1.375
20
9 CID_64972_Calanolide A 12
1.079 1.11
21
10 CID_72326_Betulin 30
1.477 1.487
20

BIOINFORMATION open access
ISSN 0973-2063 (online) 0973-8894 (print) Bioinformation 7(2): 82-90 (2011) 88 © 2011 Biomedical Informatics
11 CID_72943_Heteronemin 6.25
0.796 1.116
22
12 CID_73214_Eperozolid 0.25
-0.602 -0.87
23
* 13
CID_149096_Ofloxacin 0.5
-0.301 -0.241
24
* 14
CID_152946_Moxifloxacin 0.375
-0.426 -0.062
25
15 CID_441401_Linezolid 0.5
-0.301 -0.164
23
* 16
CID_445629_Thiolactomycin 5
0.699 0.887
26
17 CID_463811_Litosterol 3.13
0.496 1.455
18
18 CID_465951_Oxazolidininone 1
0 -0.235
23

BIOINFORMATION open access
ISSN 0973-2063 (online) 0973-8894 (print) Bioinformation 7(2): 82-90 (2011) 89 © 2011 Biomedical Informatics
*= Test set Table 3: Compliance of compounds with computational parameters of drug likeness. Lipinski’s Rule of Five and the number of violations (using Molinspiration online tool)
S No.
PubChem Compound ID and Name
TPSA (Å2)
Molecular weight [g/mol]
Log P
H-bond donors (OH group)
H-bond acceptors (O atom)
No. of rule of five violations
1 CID_2794_Clofazimine 40 473.39638 7.1 1 4 1 2 CID_3893_Lauric Acid 37.3 200.31776 4.2 1 2 0 3 CID_5922_Isonicotinic Acid 50.2 123.1094 0.4 1 3 0 4 CID_6098_Cloxacillin 138 435.88132 2.4 2 6 0 5 CID_8655_Syringaldehyde 55.8 182.1733 0 1 4 0 6 CID_10494_Oleanolic acid 57.5 456.70032 7.5 2 3 1
* 19
CID_477494_Nephalsterol C 12.5
1.097 1.225
18
20 CID_638072_Squalene 100
2 1.5
27
21 CID_3008606_Lecheronol B 128
2.107 1.018
20
22 CID_5280450_Linoleic Acid 10
1 1.354
28
23 CID_6480075_Bornyl piperate 25
1.398 0.956
29
24 CID_10018804_Lecheronol A 4
0.602 0.925
20
BIOINFORMATION open access
ISSN 0973-2063 (online) 0973-8894 (print) Bioinformation 7(2): 82-90 (2011) 90 © 2011 Biomedical Informatics
7 CID_64945_Ursolic acid 57.5 456.70032 7.3 2 3 1 8 CID_64971_Betulinic acid 57.5 456.70032 8.2 2 3 1 9 CID_64972_Calanolide A 65 370.43884 3.8 1 5 0 10 CID_72326_Betulin 40.5 442.7168 8.3 2 2 1 11 CID_72943_Heteronemin 82.1 502.68264 6.1 1 6 2 12 CID_73214_Eperozolid 102 394.397423 -0.3 2 7 0 13 CID_149096_Ofloxacin 73.3 361.367503 -0.4 1 8 0 14 CID_152946_Moxifloxacin 82.1 401.431363 0.6 2 8 0 15 CID_441401_Linezolid 71.1 337.346103 0.7 1 6 0 16 CID_445629_Thiolactomycin 62.6 210.29266 3.1 1 2 0 17 CID_463811_Litosterol 40.5 414.66364 7.4 2 2 1 18 CID_465951_Oxazolidininone 87.2 353.411703 1.5 1 5 0 19 CID_477494_Nephalsterol C 66.8 472.69972 6.9 2 4 1 20 CID_638072_Squalene 0 410.718 11.6 0 0 1 21 CID_3008606_lecheronol B 57.5 318.4504 3.2 2 3 0 22 CID_5280450_Linoleic Acid 37.3 280.44548 6.8 1 2 1 23 CID_6480075_Bornyl piperate 44.8 354.43944 5.0 0 4 0 24 CID_10018804_Lecheronol A 57.5 318.4504 2.9 2 3 0
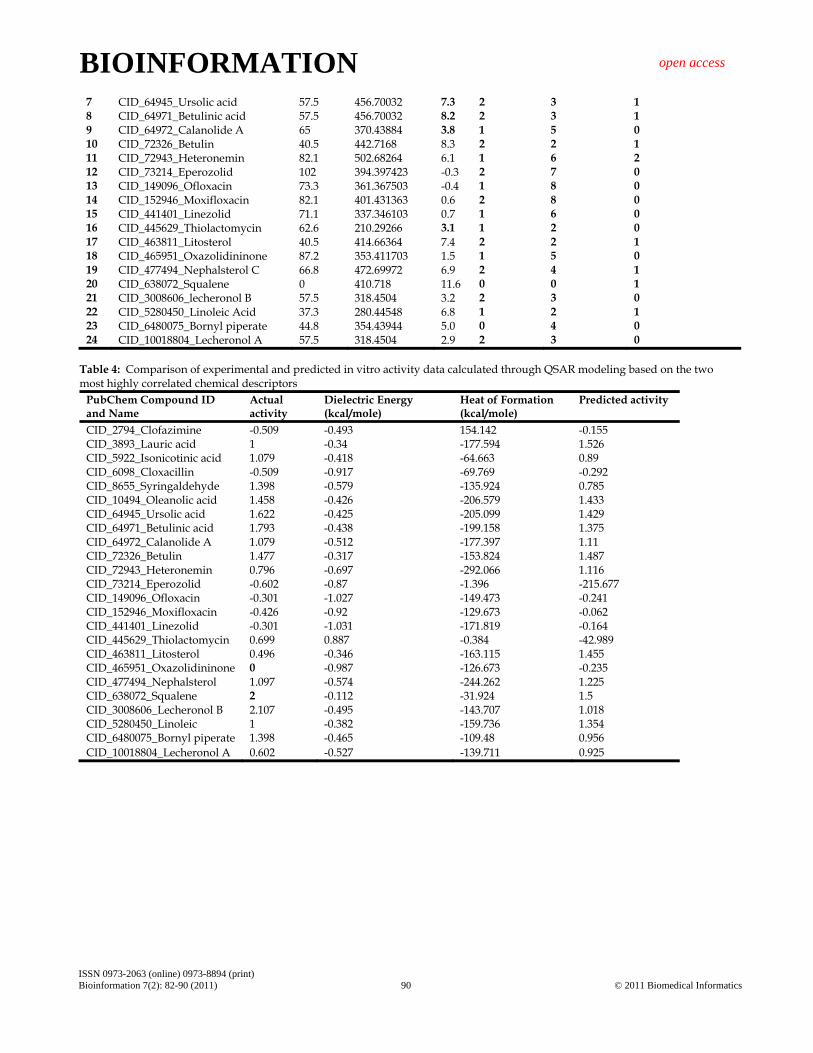
Table 4: Comparison of experimental and predicted in vitro activity data calculated through QSAR modeling based on the two most highly correlated chemical descriptors
PubChem Compound ID and Name
Actual activity
Dielectric Energy (kcal/mole)
Heat of Formation (kcal/mole)
Predicted activity
CID_2794_Clofazimine -0.509 -0.493 154.142 -0.155 CID_3893_Lauric acid 1 -0.34 -177.594 1.526 CID_5922_Isonicotinic acid 1.079 -0.418 -64.663 0.89 CID_6098_Cloxacillin -0.509 -0.917 -69.769 -0.292 CID_8655_Syringaldehyde 1.398 -0.579 -135.924 0.785 CID_10494_Oleanolic acid 1.458 -0.426 -206.579 1.433 CID_64945_Ursolic acid 1.622 -0.425 -205.099 1.429 CID_64971_Betulinic acid 1.793 -0.438 -199.158 1.375 CID_64972_Calanolide A 1.079 -0.512 -177.397 1.11 CID_72326_Betulin 1.477 -0.317 -153.824 1.487 CID_72943_Heteronemin 0.796 -0.697 -292.066 1.116 CID_73214_Eperozolid -0.602 -0.87 -1.396 -215.677 CID_149096_Ofloxacin -0.301 -1.027 -149.473 -0.241 CID_152946_Moxifloxacin -0.426 -0.92 -129.673 -0.062 CID_441401_Linezolid -0.301 -1.031 -171.819 -0.164 CID_445629_Thiolactomycin 0.699 0.887 -0.384 -42.989 CID_463811_Litosterol 0.496 -0.346 -163.115 1.455 CID_465951_Oxazolidininone 0 -0.987 -126.673 -0.235 CID_477494_Nephalsterol 1.097 -0.574 -244.262 1.225 CID_638072_Squalene 2 -0.112 -31.924 1.5 CID_3008606_Lecheronol B 2.107 -0.495 -143.707 1.018 CID_5280450_Linoleic 1 -0.382 -159.736 1.354 CID_6480075_Bornyl piperate 1.398 -0.465 -109.48 0.956 CID_10018804_Lecheronol A 0.602 -0.527 -139.711 0.925


![Melioidosis Mimicking Tuberculosis in an Endemic Zone · mimics tuberculosis [2]. Therefore, it is frequently treated with anti-tuberculosis drugs in an area where tuberculosis is](https://static.fdocuments.in/doc/165x107/605b21c8479bfc022b674719/melioidosis-mimicking-tuberculosis-in-an-endemic-zone-mimics-tuberculosis-2-therefore.jpg)