Tuberculosis Control Program - IN.gov 94.1 percent of TB cases greater than or equal to 15 years of...
26
Tuberculosis Control Program 2016 Annual Report March 27, 2017
-
Upload
duongduong -
Category
Documents
-
view
215 -
download
1
Transcript of Tuberculosis Control Program - IN.gov 94.1 percent of TB cases greater than or equal to 15 years of...

Tuberculosis Control Program
2016 Annual Report March 27, 2017
Table of Contents
I. Executive Summary………………………………………………………..1
II. Summary Statistics………………………………………………………....2
III. Tuberculosis In Indiana
a. Burden & Trends……………………………………………………..3
b. Demographics & Risk Factors………………………………………..9
c. Treatment……………………………………………………………16
d. Genotyping………………………………………………………..…19
e. Contact Investigations………………………………………….……20
IV. Appendices
a. Data Sources & Methods……………………………………………21
b. Glossary…………………………………………………………..…22
c. Sources………………………………………………………………24

I. Executive Summary
The mission of the Tuberculosis Control, Prevention and Elimination Program is to oversee, manage and facilitate activities that assure early identification and proper treatment of persons with tuberculosis; prevent transmission of Mycobacterium tuberculosis to others; increase the percentage of newly diagnosed infection cases that start and complete treatment; and provide education to both the public and health care workers. In 2016, there were 109 new cases of tuberculosis (TB) reported to the Indiana State Department of Health, a 6.0 percent decrease since 2015. There has also been an overall 15.5 percent decrease in TB cases in Indiana over the last ten years, which continues the trend seen since 1956. Marion County continued to have the most cases of any jurisdiction, with 44 cases reported in 2016 and a total of 408 cases over the past ten years. Disparities in TB continue to be seen among several populations, including by age group, race, ethnicity, gender, and foreign-born status. Among age groups, Hoosiers between 25 and 44 years of age had the highest TB rate in 2016, with 2.9 cases per 100,000 population. Almost three-quarters of the cases in 2016 in Indiana (69.7%) were among foreign-born persons, which mirrors the disparity seen at the national level and was a marked increase from 2015 (57.8%). There are several established risk factors for TB, including HIV infection, homelessness, drug and alcohol use and residence within a correctional facility. In 2016, HIV status was known among 94.1 percent of TB cases greater than or equal to 15 years of age, and 4.6 percent of all TB cases were HIV positive. Excess alcohol use was the most common measured risk factor, reported in 11.9 percent of all TB cases in Indiana. Effective treatment of TB is essential to the control and elimination of the disease, and several treatment related data measures are collected. In 2016, 94.4 percent of TB cases were started on the recommended initial therapy and 96.0 percent of cases in 2015 completed their therapy. There was one case of multi-drug resistant TB in Indiana, the same as seen in 2015. TB genotyping and contact investigation are used in TB control to help prevent additional cases. Thirteen genotype clusters with possible recent transmission were active in Indiana in 2016, while there were three ongoing outbreaks. In 2015, every case of infectious TB had contacts identified, and 60 percent of those contacts were fully evaluated for infection and disease. The vision of the Indiana State Department of Health’s TB Control, Prevention and Elimination Program is: “A Tuberculosis-free Indiana.” To achieve this vision, we will need continued collaboration between state and local health departments and continued efforts to find, diagnose, and effectively treat every case of TB in Indiana.
1
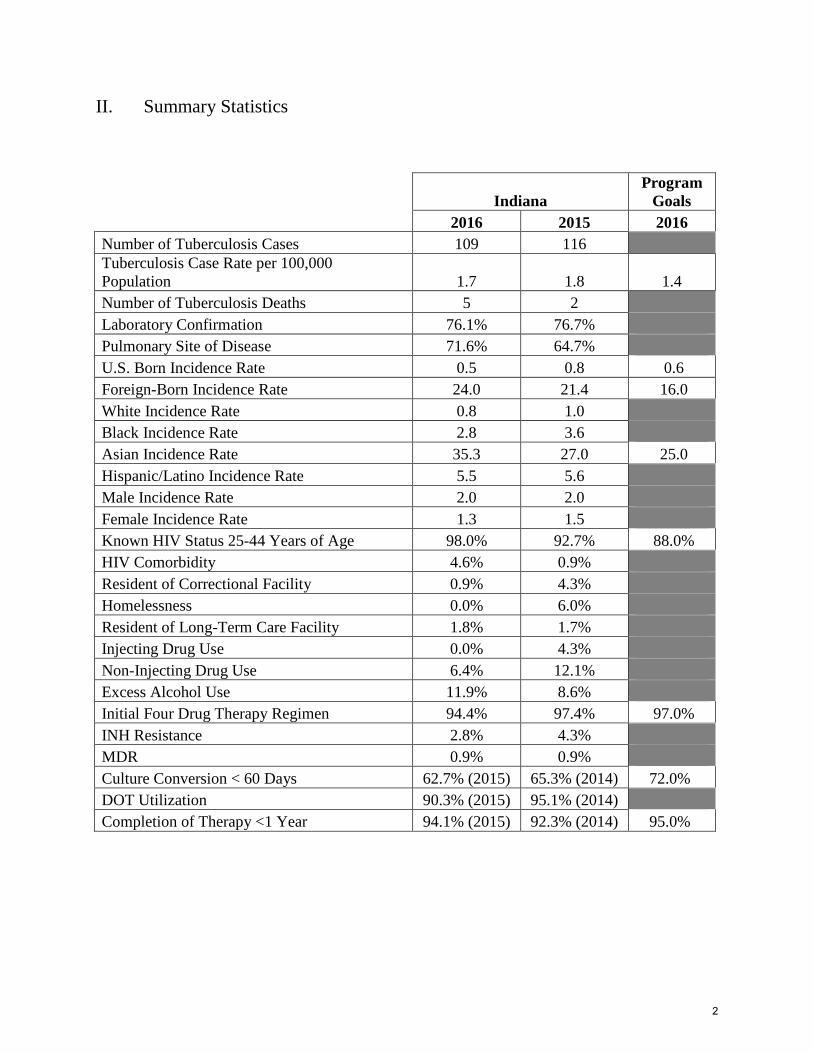
II. Summary Statistics
Indiana
Program Goals
2016 2015 2016 Number of Tuberculosis Cases 109 116 Tuberculosis Case Rate per 100,000 Population 1.7 1.8 1.4 Number of Tuberculosis Deaths 5 2 Laboratory Confirmation 76.1% 76.7% Pulmonary Site of Disease 71.6% 64.7% U.S. Born Incidence Rate 0.5 0.8 0.6 Foreign-Born Incidence Rate 24.0 21.4 16.0 White Incidence Rate 0.8 1.0 Black Incidence Rate 2.8 3.6 Asian Incidence Rate 35.3 27.0 25.0 Hispanic/Latino Incidence Rate 5.5 5.6 Male Incidence Rate 2.0 2.0 Female Incidence Rate 1.3 1.5 Known HIV Status 25-44 Years of Age 98.0% 92.7% 88.0% HIV Comorbidity 4.6% 0.9% Resident of Correctional Facility 0.9% 4.3% Homelessness 0.0% 6.0% Resident of Long-Term Care Facility 1.8% 1.7% Injecting Drug Use 0.0% 4.3% Non-Injecting Drug Use 6.4% 12.1% Excess Alcohol Use 11.9% 8.6% Initial Four Drug Therapy Regimen 94.4% 97.4% 97.0% INH Resistance 2.8% 4.3% MDR 0.9% 0.9% Culture Conversion < 60 Days 62.7% (2015) 65.3% (2014) 72.0% DOT Utilization 90.3% (2015) 95.1% (2014) Completion of Therapy <1 Year 94.1% (2015) 92.3% (2014) 95.0%
2
III. Tuberculosis in Indiana
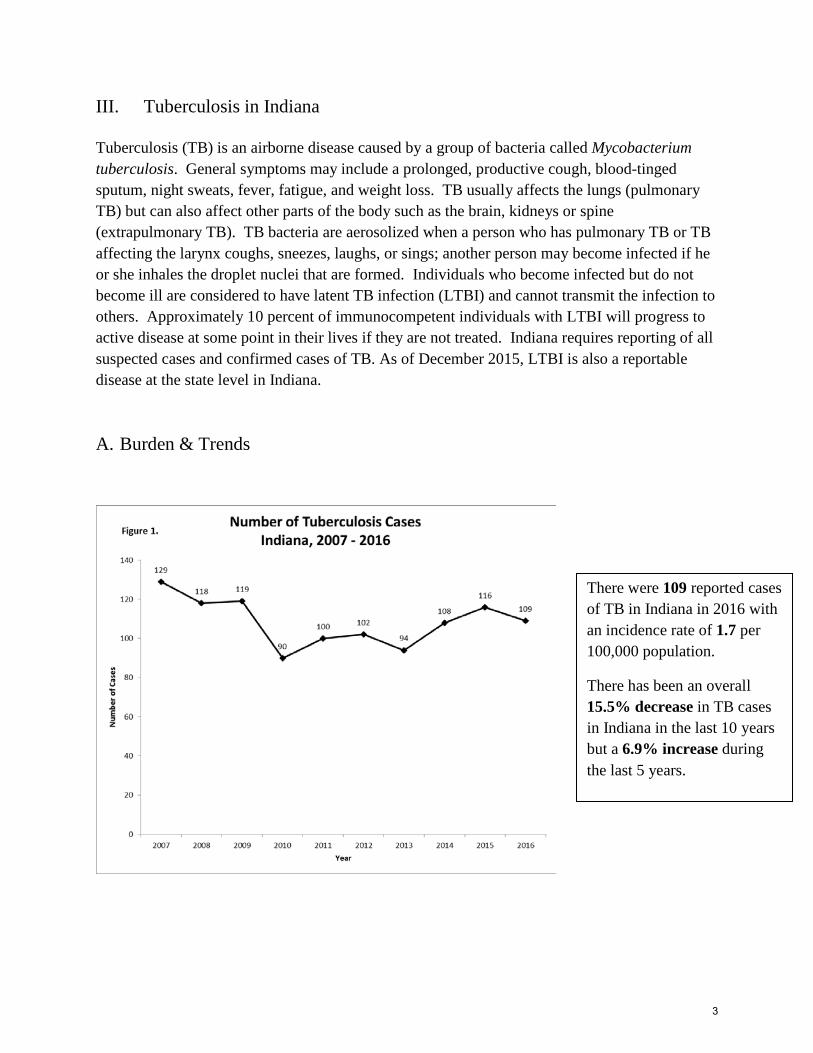
Tuberculosis (TB) is an airborne disease caused by a group of bacteria called Mycobacterium tuberculosis. General symptoms may include a prolonged, productive cough, blood-tinged sputum, night sweats, fever, fatigue, and weight loss. TB usually affects the lungs (pulmonary TB) but can also affect other parts of the body such as the brain, kidneys or spine (extrapulmonary TB). TB bacteria are aerosolized when a person who has pulmonary TB or TB affecting the larynx coughs, sneezes, laughs, or sings; another person may become infected if he or she inhales the droplet nuclei that are formed. Individuals who become infected but do not become ill are considered to have latent TB infection (LTBI) and cannot transmit the infection to others. Approximately 10 percent of immunocompetent individuals with LTBI will progress to active disease at some point in their lives if they are not treated. Indiana requires reporting of all suspected cases and confirmed cases of TB. As of December 2015, LTBI is also a reportable disease at the state level in Indiana.
A. Burden & Trends
There were 109 reported cases of TB in Indiana in 2016 with an incidence rate of 1.7 per 100,000 population.
There has been an overall 15.5% decrease in TB cases in Indiana in the last 10 years but a 6.9% increase during the last 5 years.
3

The decrease seen in TB cases in the last 10 years is in line with the downward historical trend seen in Indiana since 1956.
The number of TB-related deaths in Indiana has remained relatively stable in the last five years, with five deaths reported in 2016.
4

A diagnosis of TB is categorized as either laboratory, clinical, or provider diagnosis according to established criteria by the CDC shown below1. Provider diagnosis is defined as a case that does not meet either laboratory or clinical case definitions but in which the provider believes there is sufficient evidence for a diagnosis of TB based upon the clinical evaluation.
Laboratory Criteria
• Isolation of M. tuberculosis from a clinical specimen, OR
• Demonstration of M. tuberculosis complex from a clinical specimen by nucleic acid amplification test, OR
• Demonstration of acid-fast
bacilli in a clinical specimen when a culture has not been or cannot be obtained or is falsely negative or contaminated.
Clinical Criteria
• A positive tuberculin skin test or positive interferon gamma release assay for M. tuberculosis
• Other signs and symptoms compatible with tuberculosis (TB) (e.g., abnormal chest radiograph, abnormal chest computerized tomography scan or other chest imaging study, or clinical evidence of current disease)
• Treatment with two or more anti-TB medications
• A completed diagnostic evaluation
In 2015, 76.1% of TB cases in Indiana were laboratory confirmed (n = 83).
5

In 2016, 71.6% of TB cases in Indiana were pulmonary (n = 78). This was an increase from 2015 (64.7%).
Other sites of TB in Indiana in 2016 included: - Eye & Ear Appendages - Lymphatic - Pleural - Meningeal - Peritoneal - Bone & Joints - Spinal Cord - Skin
Top Indiana Counties by Number of TB Cases, 2016
(See Figure 6)
1) Marion County – 44 Cases
2) Allen County – 14 Cases
3) Lake County – 7 Cases
4) St. Joseph County – 5 Cases
Top Indiana Counties by Number of TB Cases, 2007-2016
(See Figure 7)
1) Marion County – 408 Cases
2) Allen County – 96 Cases
3) Lake County – 76 Cases
4) Elkhart County – 37 Cases
5) St. Joseph County – 36 Cases
In 2016, Marion County had 40.4% of Indiana’s TB cases and only 14.1% of Indiana’s population.
6

Jay
Knox
White
Jasper
Cass
Clay
Pik e
Rush
Park e
Gre e ne
Perry
Riple y
Noble
La Porte
Gibson
We lls
Pose y
Owe n
Boone
Miami
Putnam
Dubois
Pulask i Fulton
Clinton
Sullivan
Harrison
Be nton Carroll
Davie ss Martin
Orange
Morgan
Madison
NewtonWabash
Warre n
Brown
Frank lin
Adams
Stark e
Spe ncer
Decatur
Randolph
De Kalb
Fountain
Washington
T ipton
Je nnings
Steube n
Scott
Huntington
Hancock
Crawford
DearbornBartholome w
Fay e tte Union
Floyd
Ohio
Black ford
Verm.
Lake7
Vigo
Grant
Clark
Porter
Elkhart
He nry
Jack son
She lby
Way ne
Kosciusk o
Monroe
Marshall
Warrick
Lawre nce
Whitle y
Hamilton
T ippe canoe
De laware
He ndrick s
Lagrange
Montgome ry
Je ffe rson
Howard
Johnson
Switzerland
Vander-burgh
Allen14
Marion44
St Joseph5
TB CASESTB CASES20162016
Labe le d by Case s Per County(for countie s with ≥ 5 case s)
Map Author: ISDH T B Control - March, 2017
Shaded by Number ofCase s pe r County
01 to 45 or More
7

Jasper
Wells
Posey
Pulaski
Benton
Newton
Warren
Jennings
Hancock
Ohio
Allen96
Jay1
Knox3
Vigo13
White1
Cass8
Clay2
Pike1
Rush1
Parke2
Grant13
Greene3
Perry2
Clark20
Ripley2
Noble4
La Porte20
Gibson1
Porter14
Elkhart37
Owen2
Henry4
Boone3
Miami4
Jackson14
Putnam4
Dubois4
Shelby5
Fulton2
Marion408
Wayne4
Clinton4
Sullivan1
Harrison4
Carroll1
Daviess3
Martin2
Orange1
Kosciusko8
Monroe21
Morgan3
Madison9
Marshall3
Warrick6
Wabash1
Franklin1
Adams5
Starke2
Spencer1
Decatur1
Randolph1
Lawrence3
St Joseph36
Whitley3
De Kalb1
Fountain2 Hamilton
25
Washington2
Tippecanoe24 Tipton
1 Delaware9
Hendricks25
Lagrange6
Montgomery3
Jefferson3
Steuben1
Howard10
Johnson22
Scott5
Huntington3
Crawford2
Dearborn4
Bartholomew7
Fayette1
Floyd13
Verm.1
Switzerland2
Vander-burgh
19
Lake76
Jasper
Wells
Posey
Pulaski
Benton
Newton
Warren
Brown1
Jennings
Hancock
Union
Ohio
Blackford
TB CASESTB CASESANDAND
INCIDENCEINCIDENCERATESRATES
Shaded by County IncidencePer 100,000 population*
Labeled by Cases Per County
Rates based upon < 20cases are unstable
Map Author: ISDH TB Control - March, 2017
10-YEAR PERIOD:10-YEAR PERIOD:2007 to 20162007 to 2016
* 2016 population estimateswere unavailable at the time ofpublication. The 2015 Censusestimates were used in placeof 2016 estimates.
0.000.01 - 0.830.84 - 1.541.55 - 2.993.00 - 5.01
8

B. Demographics & Risk Factors
Despite prevention efforts, some groups of people are affected by TB more than others. The occurrence of TB at greater levels among certain population groups is called a health disparity. Differences may occur by gender, race or ethnicity, income, comorbid medical conditions, or geographic location2.
In 2016, 80.7% of Indiana’s TB cases were adults aged 25 years or older (N = 88).
In 2016, 12.8% of cases were among those 15-24 years old, which is a substantial decrease since 2015 (22.4%).
The TB incidence rate for those aged 15-24 years decreased from 2.8 per 100,000 in 2015 to 1.5 per 100,000 in 2016.
The 2016 TB incidence rate for adults aged 65 years and older has reached a five-year low of 1.4 cases per 100,000 population.
9

There were 7 pediatric TB cases (≤ 14 years) in Indiana in 2016, which was an increase from 2015.
Pediatric TB is a public health problem of special significance because it is a marker for recent transmission of TB and is more likely to be life-threatening3.
In 2016, Asians made up 39.4% of TB cases in Indiana, yet only 1.9% of the state’s population; 95.3% of the Asian cases were foreign-born.
The Black or African American population made up 15.6% of TB cases in Indiana in 2016 but only 9.2% of the population.
10
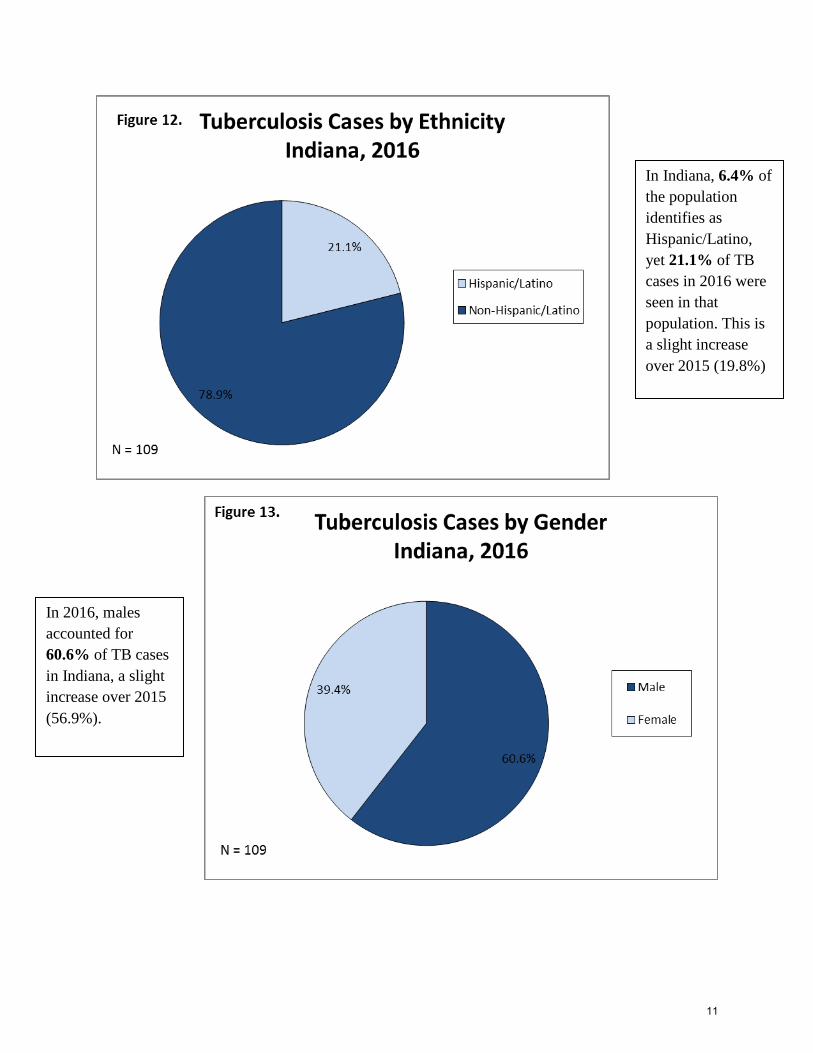
In Indiana, 6.4% of the population identifies as Hispanic/Latino, yet 21.1% of TB cases in 2016 were seen in that population. This is a slight increase over 2015 (19.8%)
In 2016, males accounted for 60.6% of TB cases in Indiana, a slight increase over 2015 (56.9%).
11
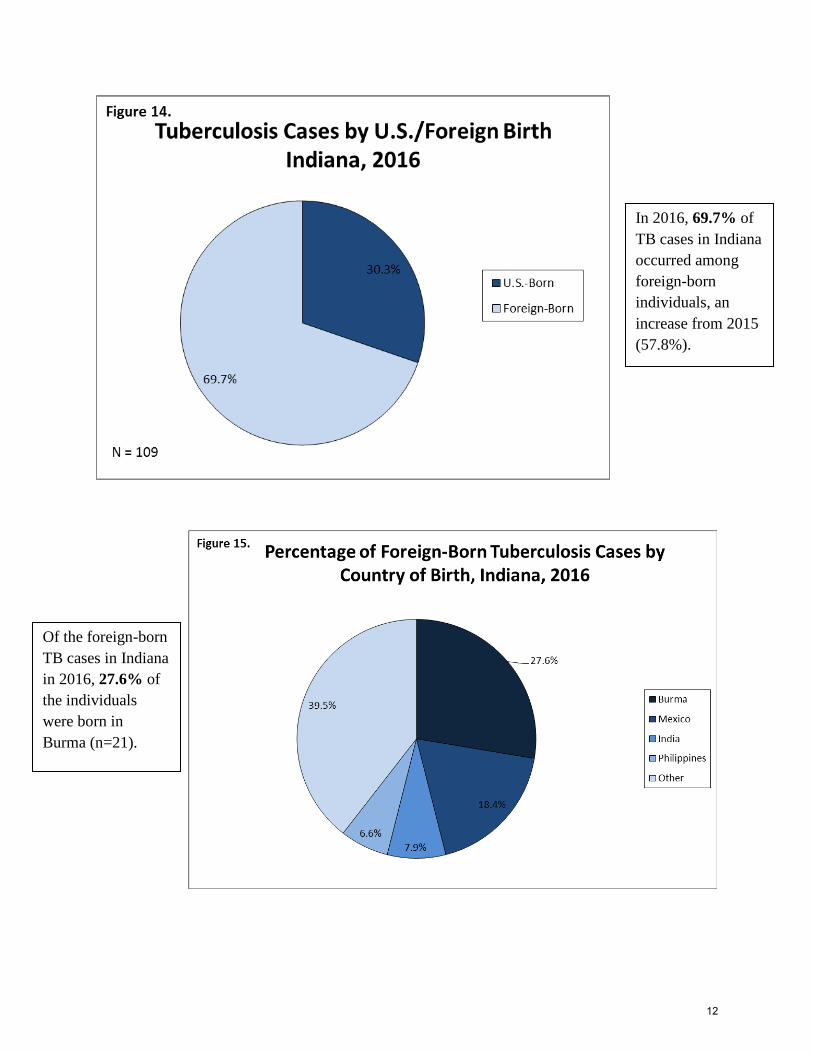
In 2016, 69.7% of TB cases in Indiana occurred among foreign-born individuals, an increase from 2015 (57.8%).
Of the foreign-born TB cases in Indiana in 2016, 27.6% of the individuals were born in Burma (n=21).
12

Foreign-born and U.S.-born cases of TB in Indiana differed in regards to age, with a higher proportion of U.S.-born cases falling in the <5 years and ≥ 65 years age groups than the foreign.-born cases.
Among the 76 foreign-born cases of TB in Indiana in 2016, 46.1% of them had been in the U.S. for more than five years.
In 2016, 21.1% of foreign-born cases had been in the U.S. less than 1 year, which is a decrease from 2015 (25.4%).
13

Percentage of TB Cases by HIV Testing Status & Age Group, Indiana, 2016
HIV Testing Status ≥ 15 Years 25-44 Years
Test Results Known 94.1% 98.0%
Testing Not Offered 3.9% 2.0%
Refused Testing 2.0% 0.0%
Someone with untreated latent TB infection and HIV infection
is much more likely to develop TB disease during his or her
lifetime than someone without HIV infection4.
Among people with latent TB infection, HIV infection is the
strongest known risk factor for progressing to TB disease4.
The proportion of TB cases in Indiana with HIV comorbidity increased in 2016 to 4.6% from a low of 0.9% in 2015. Over the past 10 years, the proportion of TB cases with HIV co-infection in Indiana has not established a clear trend.
In 2016, 3.9% of TB patients ≥15 years old were not offered HIV testing and 2.0% refused testing. Among those 25-44 years old, only 2.0% were not offered testing and no one refused testing.
14
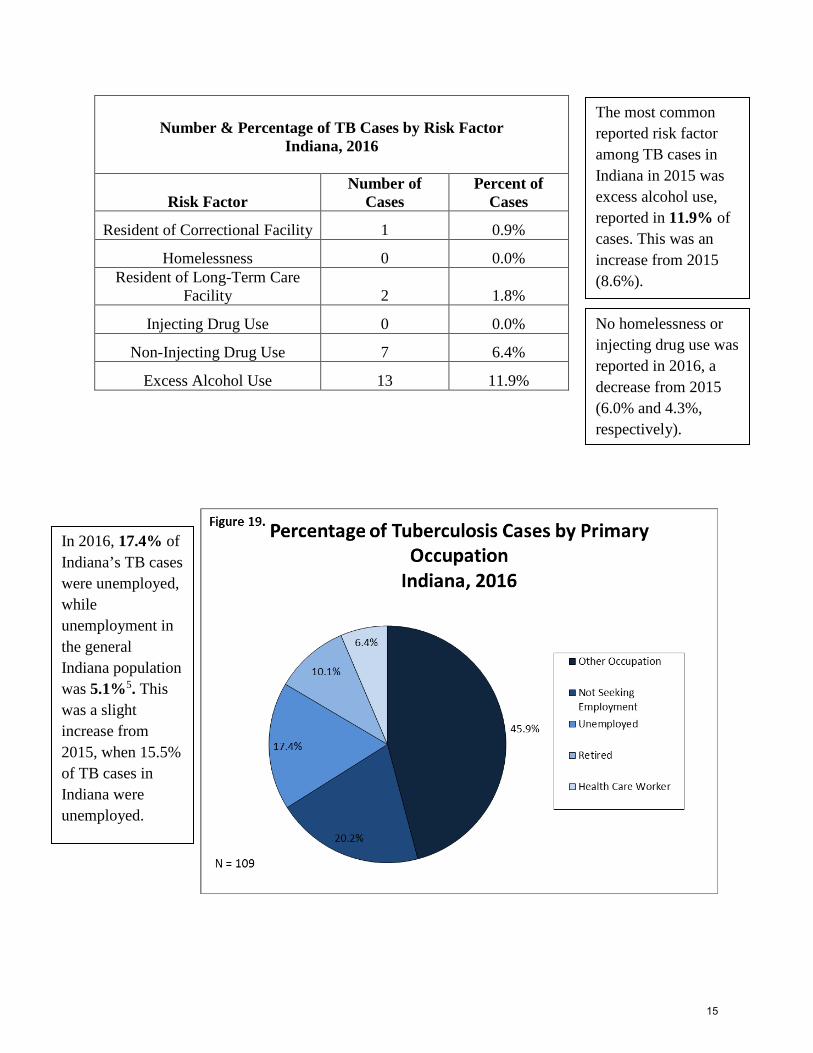
Number & Percentage of TB Cases by Risk Factor Indiana, 2016
Risk Factor Number of
Cases Percent of
Cases
Resident of Correctional Facility 1 0.9%
Homelessness 0 0.0% Resident of Long-Term Care
Facility 2 1.8%
Injecting Drug Use 0 0.0%
Non-Injecting Drug Use 7 6.4%
Excess Alcohol Use 13 11.9%
The most common reported risk factor among TB cases in Indiana in 2015 was excess alcohol use, reported in 11.9% of cases. This was an increase from 2015 (8.6%).
In 2016, 17.4% of Indiana’s TB cases were unemployed, while unemployment in the general Indiana population was 5.1%5. This was a slight increase from 2015, when 15.5% of TB cases in Indiana were unemployed.
No homelessness or injecting drug use was reported in 2016, a decrease from 2015 (6.0% and 4.3%, respectively).
15

C. Treatment
TB disease can be treated by taking several medications for six to nine months. There are 10 medications currently approved by the U.S. Food and Drug Administration (FDA) for treating TB. Of the approved medications, the first-line anti-TB agents that form the core of treatment regimens include:
• isoniazid (INH)
• rifampin (RIF)
• ethambutol (EMB)
• pyrazinamide (PZA)
It is very important that people who have TB disease finish the medicine, taking the drugs exactly as prescribed. If they stop taking the medication too soon, they can become sick again; if they do not take the medication correctly, the TB bacteria that are still alive may become resistant to those drugs. TB that is resistant to drugs is harder and more expensive to treat6.
In 2016, 94.4% of Indiana’s TB cases were started on the recommended four-drug initial therapy of INH, RIF, EMB, and PZA.
16
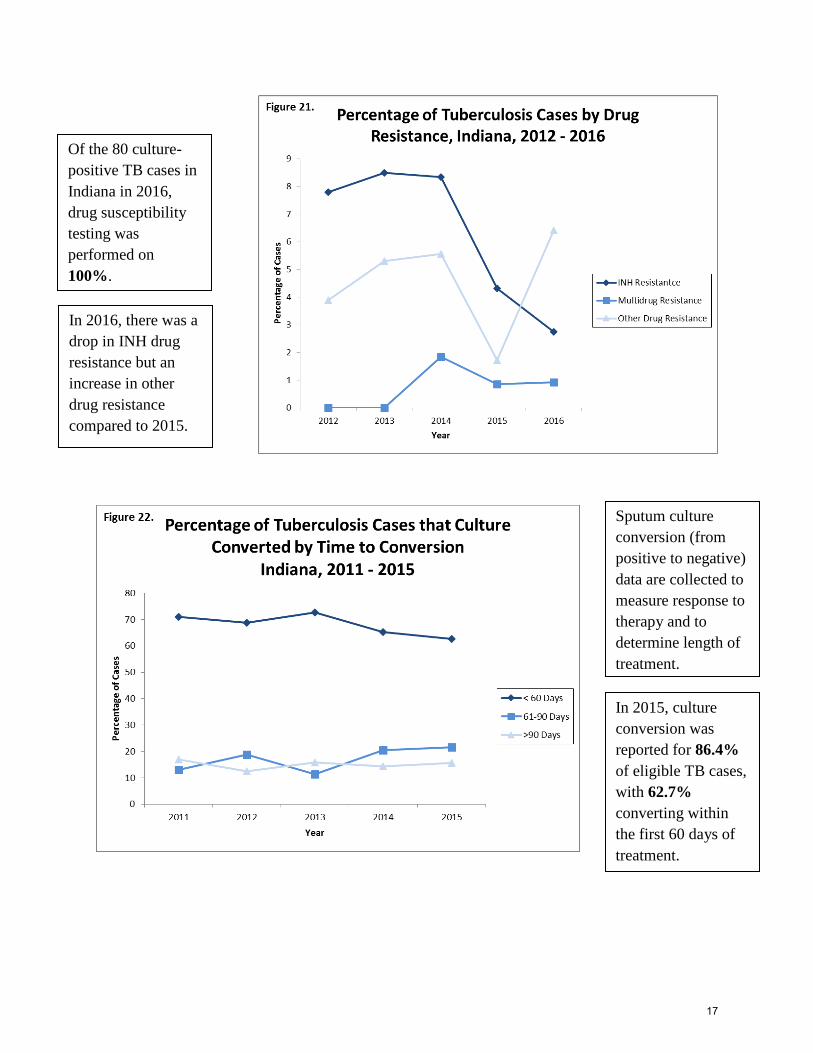
Of the 80 culture-positive TB cases in Indiana in 2016, drug susceptibility testing was performed on 100%.
In 2016, there was a drop in INH drug resistance but an increase in other drug resistance compared to 2015.
Sputum culture conversion (from positive to negative) data are collected to measure response to therapy and to determine length of treatment.
In 2015, culture conversion was reported for 86.4% of eligible TB cases, with 62.7% converting within the first 60 days of treatment.
17
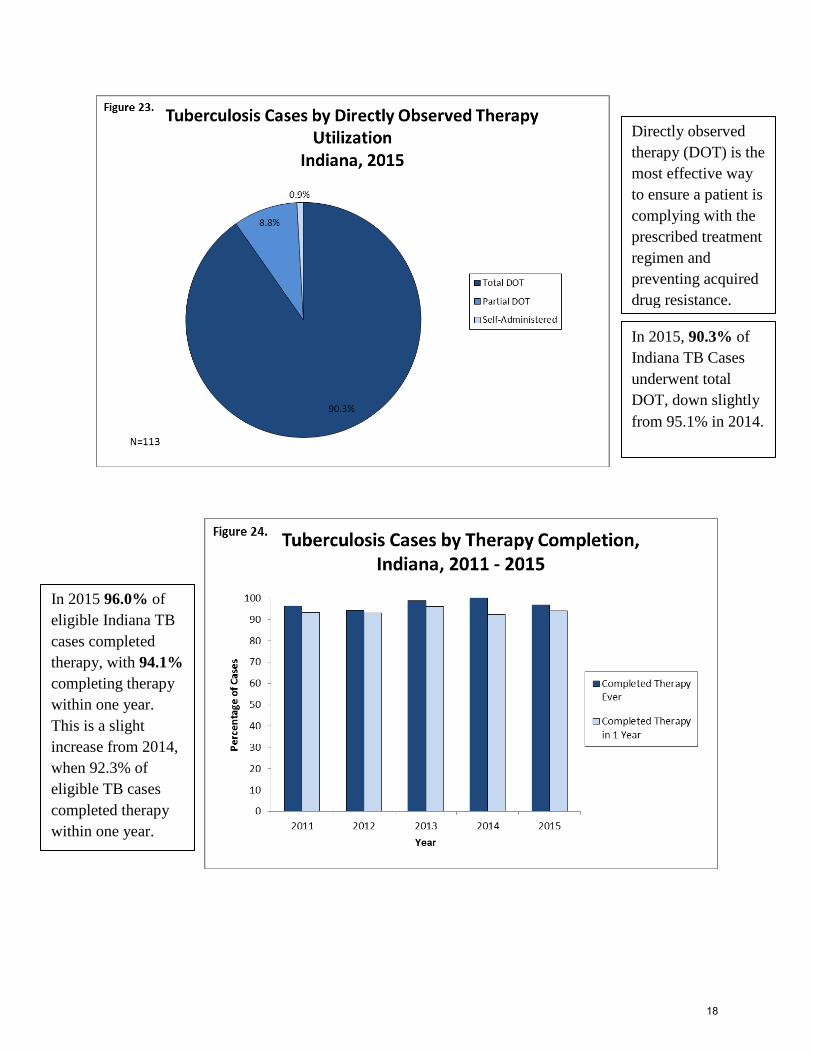
Directly observed therapy (DOT) is the most effective way to ensure a patient is complying with the prescribed treatment regimen and preventing acquired drug resistance.
In 2015, 90.3% of Indiana TB Cases underwent total DOT, down slightly from 95.1% in 2014.
In 2015 96.0% of eligible Indiana TB cases completed therapy, with 94.1% completing therapy within one year. This is a slight increase from 2014, when 92.3% of eligible TB cases completed therapy within one year.
18
D. Genotyping
TB genotyping is a laboratory-based approach used to analyze the genetic material (e.g., DNA) of Mycobacterium tuberculosis. Specific sections of the M. tuberculosis genome form distinct genetic patterns that help distinguish different strains of M. tuberculosis. TB genotyping results, when combined with epidemiologic data, help identify persons with TB disease involved in the same chain of recent transmission. In the same way, TB genotyping helps distinguish between persons whose TB disease is the result of TB infection that was acquired in the past, as compared to recently or newly acquired infection with development of TB disease.
When two or more M. tuberculosis isolates match by genotyping methods (i.e., same spoligotype and MIRU patterns), they are referred to as a genotype cluster. Patients who are members of the same genotype cluster are assumed to have the same strain, which may be a surrogate for recent transmission. However, genotyping information is only one piece of evidence used to determine transmission patterns. Genotyping information, epidemiologic linkages including spatial (geography) and temporal (time) associations, and drug susceptibility results (phenotype) can help distinguish recent transmission from activation of latent TB infection7.
\
In 2016, 100% of culture-positive TB
cases in Indiana were genotyped.
Of the cases genotyped in 2016, 37.5% were identified as part of a
cluster in Indiana.
There were 13 active genotype clusters in
2016 indicating possible recent transmission.
There were three ongoing outbreaks in
2016.
19
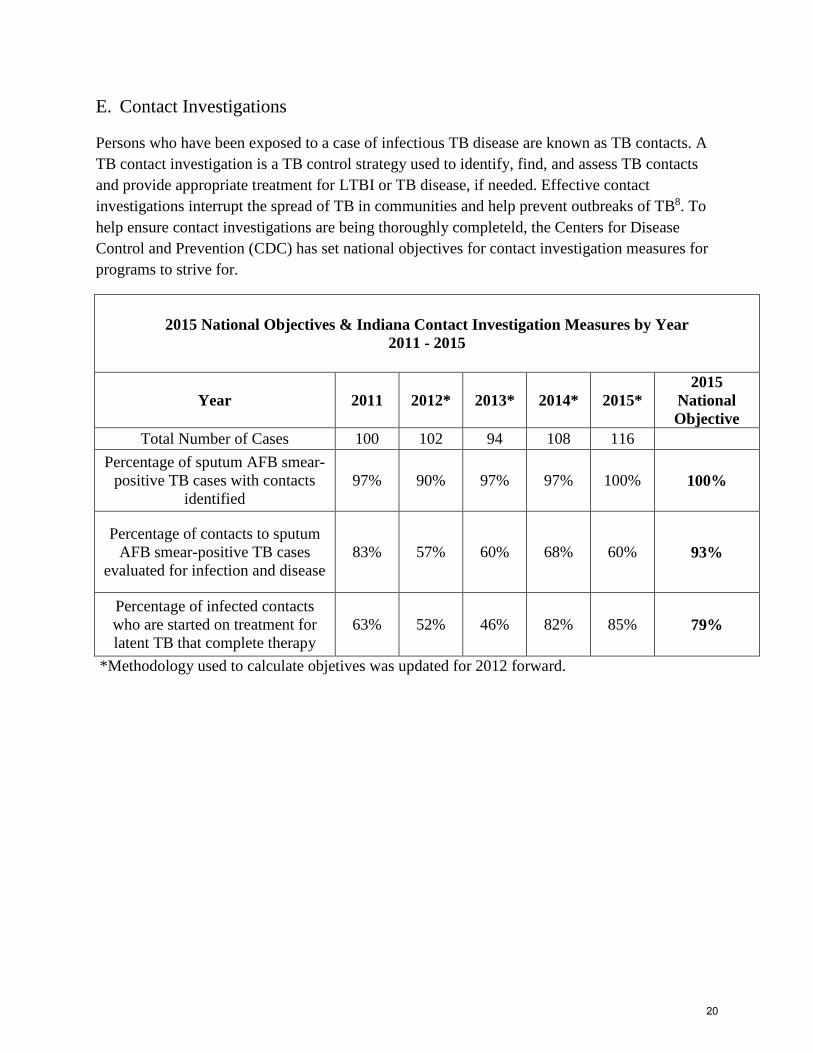
E. Contact Investigations
Persons who have been exposed to a case of infectious TB disease are known as TB contacts. A TB contact investigation is a TB control strategy used to identify, find, and assess TB contacts and provide appropriate treatment for LTBI or TB disease, if needed. Effective contact investigations interrupt the spread of TB in communities and help prevent outbreaks of TB8. To help ensure contact investigations are being thoroughly completeld, the Centers for Disease Control and Prevention (CDC) has set national objectives for contact investigation measures for programs to strive for.
2015 National Objectives & Indiana Contact Investigation Measures by Year 2011 - 2015
Year 2011 2012* 2013* 2014* 2015* 2015
National Objective
Total Number of Cases 100 102 94 108 116 Percentage of sputum AFB smear-
positive TB cases with contacts identified
97% 90% 97% 97% 100% 100%
Percentage of contacts to sputum AFB smear-positive TB cases
evaluated for infection and disease 83% 57% 60% 68% 60% 93%
Percentage of infected contacts who are started on treatment for latent TB that complete therapy
63% 52% 46% 82% 85% 79%
*Methodology used to calculate objetives was updated for 2012 forward.
20
IV. Appendices
A. Data Sources & Methods
All TB data for Indiana were pulled from the Indiana State Department of Health’s online database Statewide Investigation, Monitoring and Surveillance System (SWIMSS) and analayzed using SAS verison 9.2. Historical data pre-dating SWIMSS (prior to 2009) was pulled from the prior TB Information Management database. All local health departments in Indiana are required to enter information regarding TB cases and their contact investigations into the SWIMSS database, which is then used to transmit required information to the CDC through the Report of Verified Case of Tuberculosis (RVCT).
All population data presented and used to calculate rates within this report were obtained from the U.S. Census Bureau’s American Community Survey. Population estimates used in 2016 rates are based on 2015 population estimates, as 2016 population had not been released at the time of publication.
The total number of TB cases is based on persons whose primary residence was in Indiana at the time of diagnosis and who were verified as having TB disease in the given year. Persons counted in another state and immigrants and refugees who are diagnosed and begin treatment abroad are excluded. Foreign visitors (i.e. students, tourists, etc.) and certain other categories of non-U.S. citizens who are diagnosed in Indiana but remain in the U.S. for less than 90 days of treatment are also excluded.
Cases counts less than five are suppressed at the county level to protect patient confidentiality.
Race is collected in five categories: American Indiana or Alaskan Native, Asian, Black or African American, Native Hawaiian or Other Pacific Islander, and White. Only those racial groups with TB cases within the given time period are shown in this report.
Data measures relating to treatment (initial drug regimen, culture conversion, DOT utilization, and therapy completion) exclude cases that were dead upon diagnosis. The completion of therapy measure only includes cases for whom 12 months of treatment or less are recommended, who were alive at diagnosis, and who initiated treatment with one or more drugs. This excludes cases with any rifampin-resistent TB, meningeal TB, TB in bone or skeletal system, TB in the central nervous system, or children aged 14 or younger with disseminated TB. This also excludes cases who died or moved out of the U.S. within 366 days of initiating treatment.
21

B. Glossary
Acid-fast bacilli: Bacteria that retain certain dyes after being washed in an acid solution. M. Tubeculosis belongs to this group.
Clinical case confirmation: A clinical diagnosis is confirmed when all of the following criteria are met upon medical evaluation: (1) a positive tuberculin skin test (TST) or positive interferon-gamma release assay (IGRA) for M. tuberculosis; (2) other signs and symptoms compatible with TB (e.g., an abnormal chest X-ray or other clinical evidence of current disease); (3) current treatment with two or more anti-TB drugs, and (4) a completed diagnostic evaluation.
Cluster: A group of patients with LTBI or TB that is linked by epidemiologic, location, or genotyping data. A genotyping cluster is two or more cases with isolates that have an identical genotyping pattern.
Comorbid: The coexistence of two or more disease processes.
Contact: A person who has spent time with a person with infectious TB.
Culture: Growth of microorganisms in the laboratory performed for detection and identification of TB in sputum or other body fluids and tissues.
Culture conversion: Wherein sputum culture-positive results convert to sputum culture-negative.
Directly observed therapy (DOT): Adherence-enhancing strategy in which a health care worker or other trained person watches as a patient swallows each dose of medication. DOT is the standard care for all patients with TB disease and is a preferred option for patients treated for LTBI.
Extrapulmonary TB: TB disease in any part of the body other than the lungs. The presence of extrapulmonary disease does not exclude pulmonary TB disease.
Genotype: The DNA pattern of Mycobacterium tuberculosis used to discriminate different strains.
Interferon Gamma Release Assay (IGRA): Whole-blood tests that can aid in diagnosisng TB by measuring a person’s immune reacitivity to M. tuberculosis.
Immunocompetent: Capable of developing an immune response; possessing a normal immune system.
Incidence: The extent or rate of occurrence, especially the number of new cases of a disease in a population over a period of time.
22

Laboratory case confirmation: Laboratory diagnosis is confirmed when: (1) isolation of M. tuberculosis from a clinical specimen, or, (2) demonstration of M. tuberculosis complex from a clinical specimen by nucleic acid amplification test, or, (3) demonstration of acid-fast bacilli in a clinical specimen when a culture has not been or cannot be obtained or is falsely negative or contaminated. Latent tuberculosis infection (LTBI): Infection with M. tuberculosis in which symptoms or signs of disease have not manifested.
MIRU: Distinguishes the M. tuberculosis strains by the difference in the number of copies of tandem repeats at specific regions, or loci, of the M. tuberculosis genome.
Mycobacterium tuberculosis: The namesake member organism of the M. tuberculosis complex and the most common causative agent of TB disease in humans. In certain instances, the species name refers to the entire M. tuberculosis complex, which includes M. bovis and M. african, M. microti, M. canetii, M. caprae, and M. pinnipedii.
Multi-drug resistance: Strains of M. tuberculosis that are resistant to at least isoniazid and rifampin.
Nucleic acid amplification test: A molecular technique used to detect a virus or bacterium, such as M. tuberculosis.
Outbreak: Unusually high occurrence of a disease or illness in a population or area. Three or more cases are required for an occurrence of TB to be classified as an outbreak.
Pulmonary TB: TB disease that occurs in the lungs.
Provider diagnosis case confirmation: In which a case does not meet criteria for laboratory nor clinical confirmation but the TB Program counts as a TB case based upon physician assessment and as determined by TB Medical Consultant and TB Controller.
Resistance: The ability of certain strains of mycobacteria, including M. tuberculosis, to grow and multiply in the presence of drugs that ordinarily kill or suppress them. Such strains are referred to as drug-resistant strains and cause drug resistant-TB disease.
Smear-positive: A positive test indicating the presence of TB bacteria in sputum done by smearing the sputum on a glass slide, staining it, and looking for bacteria.
Spoligotyping: Identifies the M. tuberculosis genotype based on presence or absence of spacer sequences found in a direct-repeat region of the M. tuberculosis genome where 43 identical sequences and 36 base pairs are interspersed by spacer sequences.
Sputum: Mucus containing secretions coughed up from inside the lungs. Sputum is different from saliva or nasal secretions, which are unsatisfactory for detecting TB disease.
23

Tuberculin skin test: A test done to detect TB infection by injecting liquid tuberculin under the skin and measuring the immune reaction.
C. Sources
1. Tuberculosis 2009 Case Definition, CDC. April 29, 2015. http://wwwn.cdc.gov/nndss/conditions/tuberculosis/case-definition/2009/
2. Health Disparities in TB, CDC. November 30, 2016. http://www.cdc.gov/tb/topic/populations/healthdisparities/default.htm
3. Tuberculosis in Children, CDC. October 10, 2014. http://www.cdc.gov/tb/topic/populations/TBinChildren/default.htm
4. TB and HIV Coinfection, CDC. June 29, 2016. http://www.cdc.gov/tb/topic/basics/tbhivcoinfection.htm
5. Unemployment Rate Maps, STATS Indiana. March 27,2017 http://www.stats.indiana.edu/maptools/laus.asp
6. Treatment for TB Disease, CDC. August 11, 2016. http://www.cdc.gov/tb/topic/treatment/tbdisease.htm
7. Tuberculosis Genotyping Fact Sheet, CDC. September 1, 2012. http://www.cdc.gov/tb/publications/factsheets/statistics/genotyping.htm
8. Contact Investigations for Tuberculosis, Self-Study Modules on Tuberculosis, CDC http://www.cdc.gov/tb/education/ssmodules/pdfs/Module8.pdf
24