TTLE: 1931-1970 NUMBER
58
U) Q Z <I U) ::» 0 % II: ILl m 2 ::» z 1&1 G C Z III U II: 1&1 0.. 265 TRENDS IN ARRESTS INVOLVING INTOXICATION AND ARRESTS FOR OTHER CHAR.GES, SEA\TTLE: 1931-1970 NUMBER PERCENTAGE - Figure 7:1 ) , ' , I -:"', If you have issues viewing or accessing this file contact us at NCJRS.gov.
Transcript of TTLE: 1931-1970 NUMBER

U) Q Z <I U)
::» 0 % ~
~ II: ILl m 2 ::» z
1&1 G C ~ Z III U II: 1&1 0..
265
TRENDS IN ARRESTS INVOLVING INTOXICATION AND ARRESTS FOR OTHER CHAR.GES, SEA\TTLE: 1931-1970
NUMBER 50r-----~----·--~------r_----~------_r------~----~r_----_,
45~-----+------~------~----~------~------+-----~r-----~
PERCENTAGE
-Figure 7:1
) , '
~ ,
'~ I
-:"',
If you have issues viewing or accessing this file contact us at NCJRS.gov.
!".-,
l1.,
266
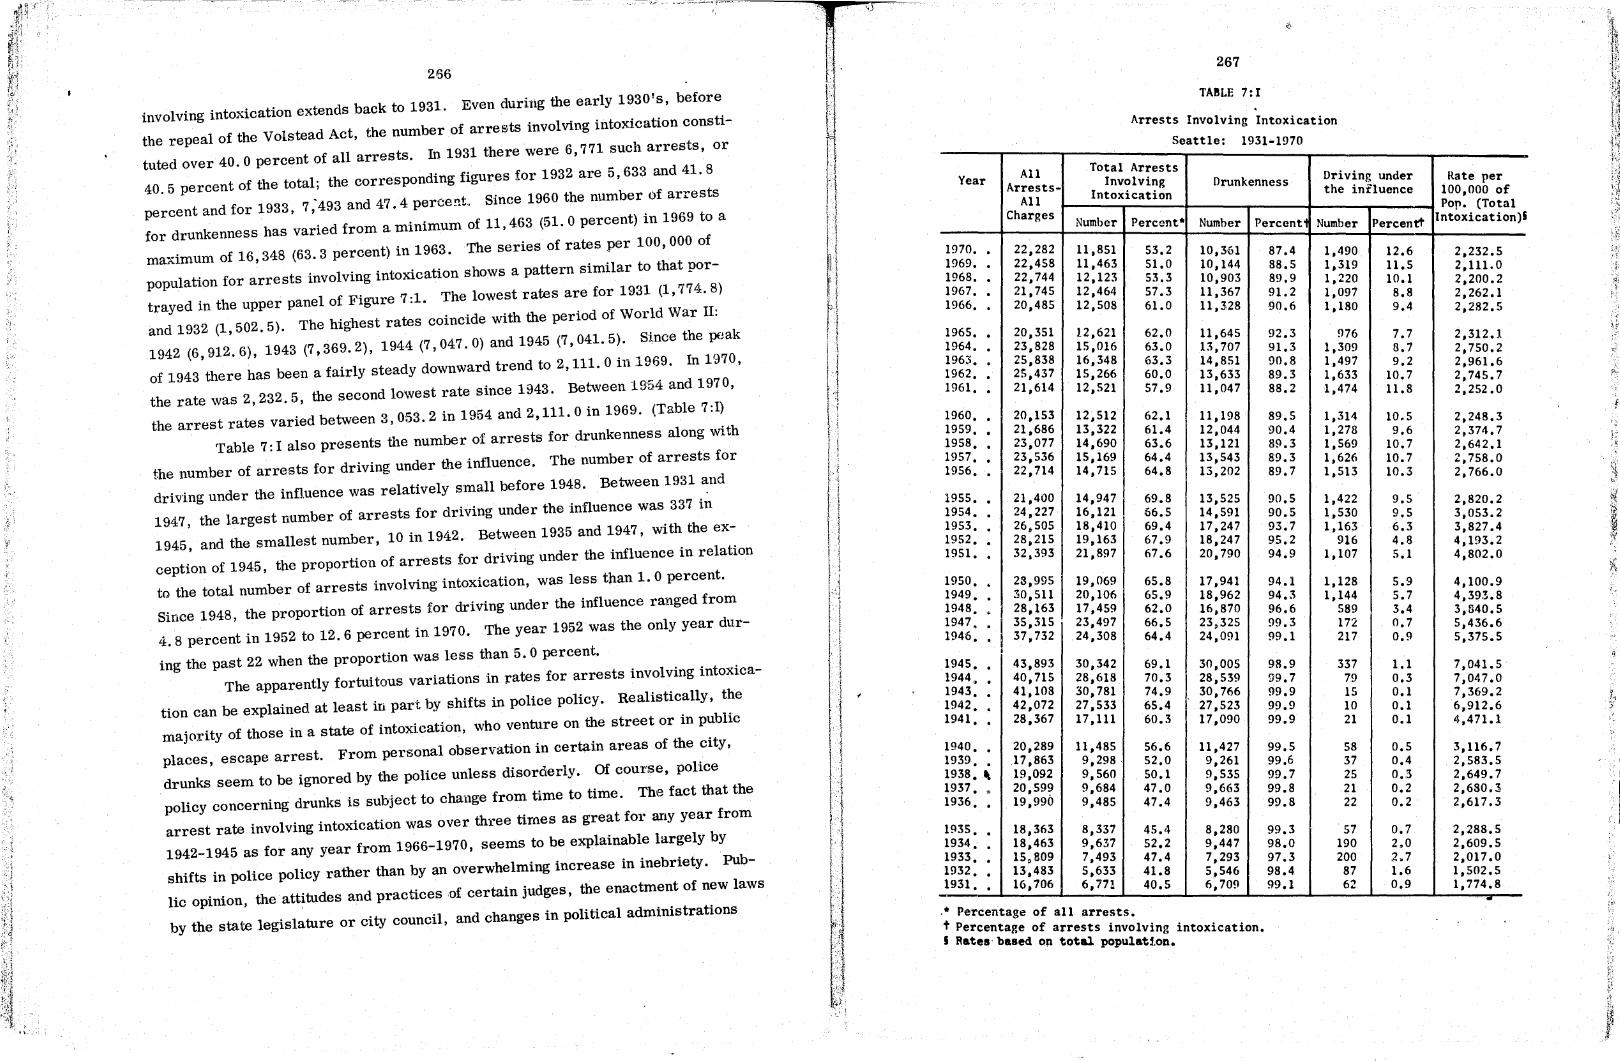
involving intoxication extends back to 1931. Even during the early 1930's, before
the repeal of the Volstead Act, the number of arrests involving intoxication consti
tuted over 40.0 percent of all arrests. In 1931 there were 6,771 such arrests, or
40.5 percent of the total; the corresponding figures for 1932 are 5,633 and 41. 8
percent and for 1933, 7 ;493 and 47.4 perce!lt. Sinee 1960 the number of arrests
for drunkenness has varied from a minimum of 11,463 (51. 0 percent) in 1969 to a
maximum of 16,348 (63.3 percent) in 1963. The series of rates per 100,000 of
population for arrests involving intoxication shows a pattern similar to that por
trayed in the upper panel of Figure 7:1. The lowest rates are for 1931 (1, 7'7L.L 8)
and 1932 (1,502.5). The highest rates coincide with the period of World War II:
1942 (6,912.6), 1943 (7,369.2), 1944 (7,047.0) and 1945 (7,041. 5). S1,nce the peak
of 1943 there has been a fairly steady downward trend to 2,111. 0 in.l969. In 1';)70,
the rate was 2,232.5, the second lowest rate since 1943. Between 19f:~4 and 1970,
the arrest rates varied between 3, 053. 2 in 1954 and 2,111. 0 in 1969. (Table 7:1)
Table 7: I also presents the number of arrests for drunkenness along with
the number of arrests for driving under the influence. The number of arrests for
ddvtng under the influence was relatively small before 1948. Between 1931 and
1947, the largest number of arrests for driving under the influence was 337 in
1945, and the smallest number, 10 in 1942. Between 1935 and 1947, with the ex
ception of 1945, the proportion of arrests for driving under the influence in relation
to the total number of arrests involving intoxication, was less tl1an 1. 0 percent.
Since 1948, the proportion of arrests for driving under the influence ranged from
4.8 percent in 1952 to 12.6 percent in. 1970. The year 1952 was the only year dur-
ing the past 22 when. the proportion was less than. 5.0 percent. The apparently fortuitous variations in rates for arrests involving intoxica-
tion can be explained at least in part by shifts in police policy. Realistically, the
majority of those in a state of intoxication, who venture on the street or in public
places, escape arrest. From personal observation in certain areas of the city,
drunks seem to be ignored by the police unless disorderly. Of course, police
policy concerning drunks is subject to change from t'J.me to time. Th\:l fact that the
arrest rate involving intoxication was over thi.·ee times as great for any year from
1942-1945 as for any year from 1966-1970, seems to be explainable largely by
shifts in police policy rather than by an overwhelming increase in inebriety. Pub
lic opinion, the attitudes and practices of certain judges, the enactment of new laws
by the state legislature or city council, and changes in political administrations
1.° •
..
r U n ~1 l"1
II l l
~\ Ii 1 . ! i J
·1 (
n I \ [ 1 I' l! r·j ! ';
t
267
TABLE 7:1
Arrests Involving Intoxication
Seattle' 1931-1970
Year All Total Arrests
Arrests- Involving Drunkenness Driving under Rate per All Intoxication the influence 100,000 of
Charges ~:=:--,~--~-i-------r------~----~~::==--l Pop. (Total urn er Percentl Number Percentt Intoxication)§ Number Percent* N b .~
1970. • 1969. • 1968 •• 1967. • 1966 ••
1965. • 1964 •• 1963 •• 1962. • 1961. •
1960 •• 1959. • 1958. • 1957. • 1956 ••
1955. • 1954 •• 1953. • 1952. • 1951 ••
1950 •• 1949 •• 1948 •• 1947 •• 1946 ••
1945 •• 1944 •• 1943 •• 1942 •• 1941 ••
1940 •• 1939 •• 1938. , 1937 •. 1936. :
1935 •• 1934 •• 1933 •• 1932 •• 1931 ••
22,282 22,458 22,744 21,745 20,485
20,351 23,828 25,838 25,437 21,614
20,153 21,686 23,077 23,536 22,714
21,400 24,227 26~505 28.215 32,393
23,995 30,511 28,163 35,315 37,732
43,893 40,715 41,108 42,072 28,367
20,289 .17,863 19,092 20,599 19,990
18,363 18,463 15 D809 13,483 16,706
.* Percentage of all
11,851 11,463 12,123 12,464 12,508
12,621 15,016 16,348 15,266 12,521
12,512 13,322 14,690 15,169 14,715
14,947 16,121 18,410 19,163 21,897
19,069 20,106 17,459 23,497 24,308
30,342 28,618 30,781 27,533 17,111
11,485 9,298 9,560 9,684 9,485
8,337 9,637 7,493 5,633 6,771
53.2 51.0 53.3 57.3 61.0
62.0 63.0 63.3 60.0 57.9
62.1 61.4 63.6 64.4 64.8
69.8 66.5 69.4 67.9 67.6
65.8 65.9 62.0 66.5 64.4
69.1 70.3 74.9 65.4 60.3
56.6 52.0 50.1 47.0 47.4
45.4 52.2 47.4 41.8 40.5
10,361 10,144 10,903 11,367 11,328
11,645 13,707 14,851 13,633 ll,047
11,198 12,044 13,121 13,543 13,202
13,525 14,591 17,247 18,247 20,790
17,941 18,962 16.870 23,325 24,091
30,005 28,539 30,766 27,523 17,090
11,427 9,261 9,535 9,663 9,463
8,280 9,447 7,293 5,546 6,709
t arrests. § Percentage of arrests involving intoxication.
Rates' baaed on total population.
87.4 88.5 89.9 91.2 ·90.6
92.3 91.3 90.8 89.3 88.2
89.5 90.4 89.3 89.3 89.7
90.5 90.5 93.7 95.2 94.9
94.1 94.3 96.6 99.3 99.1
98.9 99.7 99.9 99.9 99.9
99.5 99.6 99.7 99.8 99.8
99.3 98.0 97.3 98.4 99.1
1,490 1,319 1,220 1,097 1,180
!J76 1.309 1.497 1,633 1,474
1,314 1,273 1,569 1,626 1,513
1,422 1,530 1,163
916 1,107
1,128 1,144
589 172 217
337 79 15 10 21
58 37 25 21 22
57 190 200 87 62
12.6 11.5 10.1 8.8 9.4
7.7 3.7 9.2
10.7 11.8
10.5 9.6
10.7 10.7 10.3
9.5 9.5 6.3 4.8 5.1
5.9 5.7 3.4 0.7 0.9
1.1 0.3 0.1 0.1 0.1
0.5 0.4 0.3 0.2 0.2
0.7 2.0 '2.7 1.6 0.9
2,232.5 2,111.0 2,200.2 2,262.1 2,282.5
2,312.1 2,750.2 2,961.6 2,745.7 2,252.0
2,248.3 2,374.7 2,642.1 2,758.0 2,766.0
2,820.2 3,053.2 3,827.4 4,193.2 4,802.0
4,100.9 4,393.8 3,840.5 5,436.6 5,375.5
7,041. 5 7,047.0 7,369.2 6,912.6 4,471.1
3,116.7 2,583.5 2,649.7 2,680.3 2,617.3
2,288.5 2,609.5 2,017.0 1,502.5 1,774.8
p.:
"

'.'
'y
~.
f,. •. _" .. >'
"",;-----" _~W_!¥_ .. ,.,.,~ .. ""'"' __ .____=,·=.:,;=>__ ........... >_~·, ..... __ -""~ ........ ~~ .......... -~~~
·268
may exert a significant influence on police policy. 9
Sex Differences in Arrests Involving Intoxication. Table 7: II and Figure "
7:2 portray sex differentials in arrests for drunkenness and for driving under the
influence in the city of Seattle for the 26-year period, 1945-1970. Annual rates
were computed on the basis of the population 18 years of age and over for males
and females, respectively. The configur~tions of the two sets of curves for males and females in
Figure 7:2 show a rema.rkable similarity. However, the incidence of male arrests
is very much higher. Beginning in 1945 with a rate of 17,294.8 for drunkenness,
the trend for males has been generally downward to 5,122.1 in 1969 and 5,185.3
in 1970. The corresponding trend for females was 1,138.6 in 1945 and 298.8 in
1969 and 351. 5 in 1970. On the basis of rates per 100,000 of population 18 years
of age and over, arrests for drunkenness in 1945 were over 15 times as great for
males as for females. In 1969 the difference was 17.1 to one and in 1970, 14.8 to
one. Numerically, there were 28,149 arrests for drunkenness recorded for
males in 1945 in comparison to 9,519 in 1969 and 9 •. 621 in 1970. Among females
there were 1,856 arrests for drunkenness in 1945 and 625 in 1969 and 738 in 1970.
Arrests for driving under the influence for both males and females show
a relatively sharp rise from 1947 to 1949 followed by a more graduated increase
and leveling-out tendency. (Figure 7 :2) For the past 17 years the curve for males
ihas generally fluctuated between 600.0 and 800.0 per 100,000 of population, and
for females, between 40.0 and 70.0 per 100,000 of population. The highest rate
for males occurred in 1957 with a rate of 810.6 and for females, in 1964, with a
rate of 68.7. The year 1970 was a close second with 68.6. In actual number of
cases of arrests for driving under the influence, there were 1,505 male arrests
in 1957, 1,209 in 1969, and 1,346 in 1970. For females, there were 141 arrests
in 1964, 110 in 1969 and 144 in 1970.
Drunkenness and Recidivism
One of the most common characteristics of arrestees for drunkenness is
the frequency of arrest. Although there may be arrests for other offenses, the
9"Drunkenness arrest practices vary from place to place. Some police departments strictly enforce drunkenness statutes, while other departments are known to be more tolerant. In fact, the number of arrests in a city may be related less to the amount of public drunkenness than to police policy." The Presidentis CommissiononLaw Enforcement and the Administration of Justice, 2£. cit., p. 2.
•
..... .....
.. >< CII
tI)
.2
.. • CII
;3" .... CIS
~~ 0::
= = .,.. .....
269
I'I'I'~~ . . . . . ~OOOOO'lO ~\oLJ')LJ')LJ')
~lJ')tl')OOO
~~o~~ ~LJ')\O\O~
ON ..... \O~ . . . . . .... NNLJ')~ IJ')IJ')~~~
> .,.. ... :~~-------------... CII ... Q ~ CII .--------------------J
= ,cl ;3~
IJ') N IJ') 00 IJ') N~OO~~ ~~oooo .. .... .. .............. .....
~\ON~IJ') ~~~L/l\O ~~\O\O~ .. .. .. .. .. .... ~L/l~0'I ....................
I'\o~LJ')r--. 0 1'0'1\0\00 N OOLJ') .... N ~ . . ........
00 h. L/l N IJ') 0". I'NC"lOOIJ') ~ \0 \O-L/l L/l ~ .... .. ,~ .. .... .. \OI'L/l .... N 00 ............ NN N
J

, " ,
, ;
0>
,:
'; ;
, "
~,
270
SEX DIFFERENTIALS: ARRESTS INVOLVING INTOXICATION SEATTL£: 1945-'t9~O
20,000
'" .
,A. r- "'" ="'" '"
10,000 c_ ........ I- ~ -r- ,
""" )( ... '"
~ ~ -.l.
\ I-
"- DRUNKENNESS -
5,000
>-cg MALES QI: I-... > 0 0 z ct ... ~ 1,00 ct
0
r- LDRUNKENNESS
~ FEMALES ~
'-\. o '" QI:
r--r-r-r--
\.\
'" ---~ 50 .. I-
0 ; >- :-co
I- ! l- ;
I
~, , ,
\ ,I 00 ...
l-t:-_ r-I-
50 r t-
-FlI' - I
JL
l - , 9
10 ... .J ~~ 1i ~ .!
7 t-~ U. 6t- '. r }- I '<Ii I J
-.. Y" ~ -~ ~ .-- ~"
I~~ """'~-_II ~ ~ , L - . """ ~ " .....
DRIVING UNDER THE INFLUENCE
MALES
~ ,p\. • (I- ~~ ,~ -~ ,,_\I~ b .h
~~?',,,-,. ' " ~ ~ r--- DRIVING Ui\lDER mi: INFLUENCE A
FEMALES
1 1 1 1 J 1 1 j J 1 J 1
-
--= --
-= --
-
-
-
..::;;;
~-'~ i-.... -- -~ -
-~ -
-
---~
L-~ 11:21 fl:JIj til? -
-
-
-
-----
J I J .1 -1945 1950 1955 1960 1965 19 70
Figure 7:2
271
typical pattern is one of multiple arrests for drunkenness. However, crimes com
mitted by recidivists charged with drunkenness are generally less serious offenses.10
In the two following sections, an attempt is made to summarize the frequency of
arrests by offense for recidivists who were not arrested for drunkenness and for recidivists who were arrested for drunkenness.
Number and Distribution of Arrests of Male Rec~divists, Classified b,x
Offense Charged. Based on Two Categories of Ar;restees: (1) Those Arrested for
Drunkenness and 2 Those Not Arrested for Drunkenness Durin Three-Year
"period, 1968-1970. Table 7: III shows the total number of arrests for all male
recidivists according to offense charged, recorded during the three-year period,
1968-1970. The arrests are differentiated into two groups, one for recidivists who
had no arrests for drunkenness, and the other for recidivists who had at least one
arrest for drunkenness. Thus, a comparison can be made between the two groups of
recidivists according to type and frequency of crimes committed. For example,
80.8 percent of the arrests for murder and nonnegligent manslaughter were charged
against recidiVists with no arrests for drunkenness. J\gain, with the exception of,
vandalism, vagrancy and driving under the influence, the majority of arrests for the
various categories in Table 7: III involved recidivists who had not been arrested for
drunkenness. These facts lend support to the hypothesis that there are two fairly
distinct types of offenders--those that engage in crimes involving alcohol and those involved in nonalcohol-related crimes.
In this connection, another significant observation is that over 90.0 percent
of the arrests for violation of drug laws were committed by recidivists with no rec
ord for drunkenness during the three-year period, 1968-1970. Th~se facts seem to
indicate two distinct groups--those that specialize in the use of drugs and those that consume alcohol excessively.
Of the total number of arrests of recidivists who had been arrested for
drunkenness (26,996), the overwhelming proportion (22,956) were for drunkenness ,
itself, leaving only 4,040 arrests involving other ~.:d.mes. Driving under the influ
ence, vagrancy, disorderly conduct, violation of liquor laws and vandalism included
1,802 arrests, or over 40.0 percent, of the 4,040 arrests. The offenses charged
against male recidivists without any arrests for drunkenness cover a wider range of
crimes. Suspicion is first with 1,295 arrests, other (nonaggr'avated) assault is
--------------~-----10"Recidivist" in this study is defined as a person ar:rested two or more
times during the three-year period, 1968-1970.
"~ , I
,l'

.. ~ \
: [
~- ,
272
TABI.E 7: III
Recidivists l' Classified hy Offense Charged Ba!;ed on Two Number of Arrests of ~!ale and (2) Tho!;e not Arrested
of Arrestees: (1) Those Arrested for Drunkenness, CatcJ!ories 1970 Seattle: 1968-1970* for Drunkenness Uurlng Three-Year Period, 1968-. ,
Offense Charged
Total. . . . . . . . . . . MU1~cr-Nonneg. homicide ••• Negligent homicide •••••• Forcihle rape • • • • • • • • Robbery • • • • • • ~ • • • • Aggravated assault ••••••
Burglary ••••••••••• Larceny . • • • • • • ~ • ~ • Auto theft •••••••••• Other assault •••••••• Arson • • • • •
Forgcry-counterfeitin~ •• Fraud • • • • • • • . • • . " Embezzlement •••.••••• Stole.n prop: receiving, etc •• Vandalism • • • • • • • • . •
l'on e"c •• Weapons: possess ! :-.
Prostitution - comm. Vlce •• Sex off •• ex. f. rape, pros • N~rcotic drug laws •••••• Gamhling •••••••••••
Off. against family, child •• Driving under influence • • • Liquor laws • • • • • • • • • krunkenness • • • • • • • • • Disorderly conduct ••••••
Vagrancy- • • • • • • • • • • All other, ex. traffic •••• Suspicion • • • • • • •
Number of Arrests
Not Arre!;t. Ar rest. for Total for Drunk. Drunk.
'34,455 7,459 26,996 1/
26 21 5 6 4 2
16 15 1 340 210 130 120 93 27
406 338 68 1,474 852 622
228 199 29 1,382 856 526
19 14 5
295 259 36 161 104 57
14 12 2 292 229 63 209 92 117
384 262 122 18 59 19
114 121 53 • 158 683 75
31 23 B
3 -- 3 1,231 529 702
627 382 245 22,956 -- 22,956
632 325 307
612 181 431 382 301 81
1,599 1.295 304
Percr.ntage
Not Arrest. Arrest. for Total for Drunk. Drunk.
'.-100.0 21.6 78.4
100.0 80.B 19.2 100.0 66.7 33.3 100.0 93.8 6.2 100.0 61.8 38.2 100.0 77.5 22.5
100.0 83.2 16.8 100.0 57.8 42.2 100.0 87.3 12.7 100.0 61.9 38.1 100.0 73.7 26.3
100.0 87.8 12.2 100.0 64.6 35.4 100.0 85.7 14.3 100.0 18.4 21.6 100.0 44.0 56.0
100.0 68.2 31.8 100.0 15.6 24.4 100.n 69.5 30.5 100.0 90.1 9.9 100.0 74.2 25.8
100.0 -- 100.0 100.0 43.0 51.0 100.0 60.9 39.1 100.0 -- 100.0 100.0 51.4 48.6
100.0 29.6 70.4 100.0 18.8 21.2 100.0 81.0 19.0
of agl~ and over - included in thi.s table. '" Only "adult" arre!;tees - those 18 years
arrested two or IRore times during the threet "Recidivist" defined as a person year period, 1968-1910.
i t I
• 273
second with 856 arrests, larceny third with 852 arrests, violation of drug laws
fourth with 683 arrests, and driving under th~ influence fifth with 529 arrests. As
will be seen from Table 7: In, there are twelve other offenses with more than 100 ~
arrests.
Number and Distribution of Arrests of Female Recidivistsl
ClasSified boY
Offense Charged, Based on Two Categories of Arrestees: (1) Those Arrested for Drunkenness and 2 Those Not Arrested for Drunkenness
Period, 1968-1970. It will be observed that Table 7: IV is Similar to Table 7: III
except that the data pertain to female recidivists. Arrests are separated into two
-., groups of female recidivists for the three-year period, 1968.-1970--one group
{ represents those not arrested for drunkenness and the other, those haVing at least one arrest for drunkenness.
It will be found ffom Table 7: IV that in compartson tID male recidivists
female recidivists differentiate more distinctly into two separate types--one pri
marily involved with arrests fOJ' drunkenness and the other primarily involved with
other crimes. Also, unlike male recidivists the relative frequency of arrest for
drunkenness is far less for female recidivists. Female recidivists recorded 1,243
arrests for drunkenness, or 32.8 percent of the total for female recidivists, while
male recidivists recorded 22,956 arrests for drunkenness, or 66.6 percent of the total for male recidivists.
A comparison of offenses further emphasizes the difference between the
two groups of reCidivists. For female recidivists who had not been arrested for
drunkenness, the offenses charged cover a relatively wide range of crimes with
prostitution ranking first with 1,030 arrests; larceny is second with 252 arrests
and suspicion third with 202 arrests. Six other offenses have more than 50 arrests:
disorderly conduct (97), violation of narcotic laws (95), other assault (nonaggra
vated) (79), all other offenses (71), forgery-counterfeiting (69) and violation of
liquor laws (54). The range and frequency of arrests are not nearly as g:reat for
the group of female recidivists with at least one arrest for drunkenness. Of the
1,584 arrests for this group, 1,243 arrests were for drunkenness alone. This
leaves only 341 arrests distributed among the remaining 27 categories. Prostitu
tion ranks. second with 52 arrests, larceny third with 45, and disorderly conduct
fourth with 43. The number of arrests for the remaining offenses a.re all below 40 for each offense.
The difference between the two groups of female recidivists is further indi
cated when the proportions in each offense category are cOlllpared. The proportion

{
274
TABLE 7: IV
Recidivistst Classified by Offense Charged Based on Two Number of Arrests of F~male k d (2) Those not A.rrested
• (1) Those Arrested for Drun enness, an Categories of Arrestees. 970.
t he Three-Year Period, 1968-1970, Seattle: 1968-1 __ ~f:or~D~r~u:n:ke:n~n~e_s_S_D_u_r_1_n~g ____ ,---~----:-
Number of Arrests
Not Offense Total
Arrest. for Charged
Total. . . . . . . . . . .
~1urder-Nonneg. homicide • • • Negligent homicide •••••• Forcible rape • • • • • • • • Robbery • • • • • • • • • • • Aggravated assault ••••••
Burglary. • • • • • • • • • • Larceny • • • . • • . • • • • Auto theft •••••••••• Other assault • • • • • • • • Arson • . • . • . • . . . • .
Forgery-counterfeiting •••• Fraud . • • • • • • • • • • • Embez.zlement ••••••••• Stolen prop: receiving,etc •• ~":a.ndalism • • • • • • • • • •
Weapons: possession,.etc ••• Prostitution-comm. V1ce ••• Sex off., ex. f. rape. pros •• Narcotic drug laws •••••• Gamhling •••••••••••
Off. against family. child •• Driving under influence • • • Liquor laws • • • • • • • • • Drunkenness • • • • • • • • • Disorderly conduct ••••••
Vagrancy. • • • • • • • • • • All other, ex. traffic •••• Suspicion • • • • • • • • • •
Drupk.
3.789 2,205
5
49 10
6. 297
7 98
77 3(1
4 17 24
54 1,082
53 106
2
1 67 74
1.243 140
23 80
240
3
40 10
5 252
5 79
69 23
3 16 13
48 1,030
40 95
1
33 54
97
16 71
202
. Arrest.
for Drunk.
1,584
2
1 45
2 19
R 7 1 1
11
6 52 13 11
1
1 34 20
1,243 43
7 9
38
Percentage
Not
Total Arrest.
for Drunk.
100.0 58.2
100.0 60.0
100.0 81.6 100.0 100.0
100.0 83.3 100.0 84.8 100.0 71.4 100.0 80.6
100.0 100.0 100.0 100.0 100.0
100.0 100.0 100.0 100.0 100.0
100.0 100.0 100.0 100.0 100.0
100.0 100.0 100.0
89.6 76.7 75.0 94.1 54.2
88.9 95.2 75.5 89.6 50.0
49.2 73.0
69.3
69.6 88.8 84.2
Arrest. for
Drunk.
41.8
40.0
18.4
16.7 15.2 28.6 19.4
10.4 23.3 25.0 5.9
45.8
11.1 4.8
24.5 10.4 50.(1
100.0 50.8 27.0
100.0 30 •• 7
30.4 11.2 15.8
of age and over - included in this table. • Only "adult" arrestees - those 18 years
person a~rested two or more times during the three'''Recidivist'' defined as a
year period, 1968-1970.
275
of arrests for recidivists not arrested for drunkenness ranges from 95.2 percent . for prostitution to 49.2 percent for driving under the influence. For the majority
of crimes, 75.0 percent or more of the arrests were for the group without arrests
for drunkenness. It is obvious that female recidivists with no record of drunken-. ness during the three-year period, 1968-1970, contribute very substantially to the
total crime picture, in comparison to recidivists who have been arrested for drunk
enness at least once.
Number of Times Recidivists Are Arrested for Drunkenness in
Relation to the Types and Frequencies of Other Crimes
In this section the relationship between multiple arrests for drunkenness
(recidivism) and other offenses will be further analyzed.' Particular emphaSis is
placed on the number of times a recidivist is arrested for drunkenness and the type
and frequency of crimes committed. In the first part of thiLs· section special atten
tion is given to the arrestee, both male and female, while in the latter part empha
sis is placed on arrests. Both series--arrestees and arrests--are related to the
frequency of arrests for drunkenness as well as to the other crime categories.
Male Recidivists Cross-Classified by Specified.Qffenses and by Number
of Times Arrested for Drunkenness. Table 7: V cross-classIfies 5,190 male recid
ivists according to the varioo.s offense categories indicated on the vertical side of
the table (stubs) in relation to the number of times arrested for drunkenness in
accordance with the frequencies on the horizontal dimension (captions) of the table.
Only male recidivists arrested one or more times for drunkenness ,are included in
this table. If an arrestee were charged only for offenses other'than drunkenness,
he is not included in this table. Each recidivist is counted one time for each dif
ferent offense charged; thus, if a recidivist had four arrests for drunkenness and
other arrests for robbery, liquor law violation, and vandalism he would be counted
once for robbery, once for liquor law violation and once for vandalism each under
the column marked "4" for number of arrests for drunkenness.
In order to illustrate the interpretation of this table, it will be observed
that of the 5,190 male recidivists with at least one arrest for drunkenness, 1,144
had one drunkenness arrest, 1,576 had two drunkenness arrests, 778 had three
drunkenness arrests, and so on. Thirteen males in this group had 50 or more
arrests for drunkenness. and 161 recidivists were arrested 20 or more times dur
ing the three-year period, 1968-1970. Of the five recidivists charged with murder
or nonnegligent manslaughter, three were arrested for drunkenness once; one,
-il

.,
c,
-'::'- .;
:> ..
CIl"t3 III CIl s::: DC CIl ...
.... '" .... .e:: ou
''IN
••• u • ... .... Q,) •
.., 1 1 1 1
\01\0 1
. i I •
,J I
277
7 times, and one 17 times during the three-year period, 1968-1970. Again, 11 of
the 106 charged with robbery, two of the 63 charged with burglary, and 27 of the
458 charged with larceny had been arrested 20 or more times for drunkenness during the three-year period, 1968-1970.
Although the pattern is not a strong one, it will be seen that as the number
of arrests for drunkenness increases the frequency of recIdivists arrested for other offenses tends to decline.
In addition to the slight inverse relationship between the frequency of
arrests for drunkenness and arrests for offenses other than drunkenness, there
also is a similar pattern between arrests for drunkenness and the number of differ
ent offenses. For example, beyond the cutting-point of 8 a.rrests for drunkenness,
there are 19 offenses remaining out of a total of 28 listed in the table. Several of
the remaining categories are alcohOl-related offenses such as a violation of liquor
laws, vagrancy, driving under the influence, and disorderly conduct.
Female Recidivists CrOSs-Classified ,by Specified Offenses and by Number
of Times Arrested for Drunkenness. As will be observed from Table 7: VI, this
section corresponds with the preceding one which is devoted to male recidivists.
Table 7: VI cross-classifies " 'male recidivists by specific offense as related to
the number of times arresteu lor drunkenness during the three-year period, 1968-
1970. Only female recidivists Who were arrested at least once for drunkenness
are included in this table. There were 427 female recidivists.
This table permits an examination of the arrest record of female recidi
vists during the three-year period, 1968-1970. It will be seen that as the frequency
of arrests for drunkenness increases, the number of female recidivists arrested
for other crimes diminishes. The more serious the alcohol problem, the less in
volvement there is with other types of offenses. Of the 427 female recidivists with
at leas tone arres t for drunkenness, 94 were arres ted once for drl,ll1kenness, 170
twice, 63 three times, 40 four times, 14 five times and 46 more than five times.
The only other offenses that had 20 or more female recidivist arrests of this group
with at least one arrest for drunkenness, were: larceny, 30; driving under the in
fluence, 29; disorderly conduct, 37; and suspiCion, 31. As the frequency of arrests
for drunkenness increases, the number of other offenses becomes negligible. For
the entire group with more than five arrests fen' drunkenness, the only other offenses
for which the female recidivists were arrested are: larceny, offenses against the
family, violation of liquor laws, disorderly conduct, vagrancy, and the catch-all
I I "

~.
0.'.,
H
> ..
N ~
i I I I I I I I I I
, I I (. I I I I I I
I I I I , I I , ' .. I
I I I I I I I I I I
I I I I I I I I I ,
I N I I • I 'I I
I I I I I • I I I I
I I I I • I I I I I
• t I I I I I I • I
t I I , I , I I I I
278
I I I ,..-4 I I I I
I I I t ~ I It •
I I I I I I • I I I
I I I I I I I t I I
I I I I I I I t I I
I I 1..-4 I I I I I
I I I I I I I I I I
I I I t I t I , I I
I I I I I I I I I I
I I I I I I I I I I
I I 1 ...... ..-4 I I I
• , I N..-4 I I ~
, I t t"""'4 , I I I I
I I I N I t • I ,
, I I C'J I I I I I
~ I I I I
I'" I I I
I I I I I I
... I I I I
I I I I I I
I I I I I I I I I I
tit tI') 1"""'4 I I I
I I I I I I
O I I I I I I I I I I II:::: I I I I • I
I __ ~--~--I--I--I __ I'~~'--~~~~--------------------------~~~~~~I~I:~~ .. I I I I I II:: 1Il N I I
I , I I I
N
I I I I I I I I I I
I I I I I I I I I I
, I ,,..... I I I 1 I
t I I , I I I I I I
I 1 1..-4 I I • I I
I I I 1 I I I I I I
, ,..... I I I 1 I t I
I N I t"l I I I I
I I I I , I I t I I
It"l I
• I I I I I I I I I
t I • I , I I I I I
N¢N I I I I
I I I 0> I I I I 1
I I ~ I I
I I I I I I
INC> I
Nllt"ll 11Il~C>1 ..-4 I I I ,..-4 I
L-~-t~~~~--------------------------~] I 1Il I
-.:::t ..-4 ion co N .....
N I I U'l I I I I
~ONOOI t"l ~ I
• • I •
••• J • ... ~ . ~
• U • oM .~ . ~
• «I • 1-0 . .., .
· . . K · ~ .
III ~ 1-0
~ I'! o III 1-0 ~ s::.. «I
III «I
] I'!
OM ~ ~
-.::s
... III
oM > OM
-.::s OM U ~ r-..
~ III o ~
I {
r
f! .. · .. i. ~ i
. ~
I ' , :~ Ii f
'· ' ., \ •
H 1·/ r1 . t
279
categories of "other" and "suspicion." Several of these offense categories are alcohol-related.
Arrests Cross-Classified b Offenses and b of Arrests for
Drunkenness of Male Recidivists. This section, as well as the following one, is
concerned primarily with the cross-classification of arrests according to specific
offense categories and the frequency of arrest for drunkenness of male recidivists .
For example, since the unit of analysis is arrest, a person arrested five times for
automobile theft would be represented in Table 7: VII by a five and not by a one.
In addition, of course, he would have been arrested one or more times for drunken-ness.
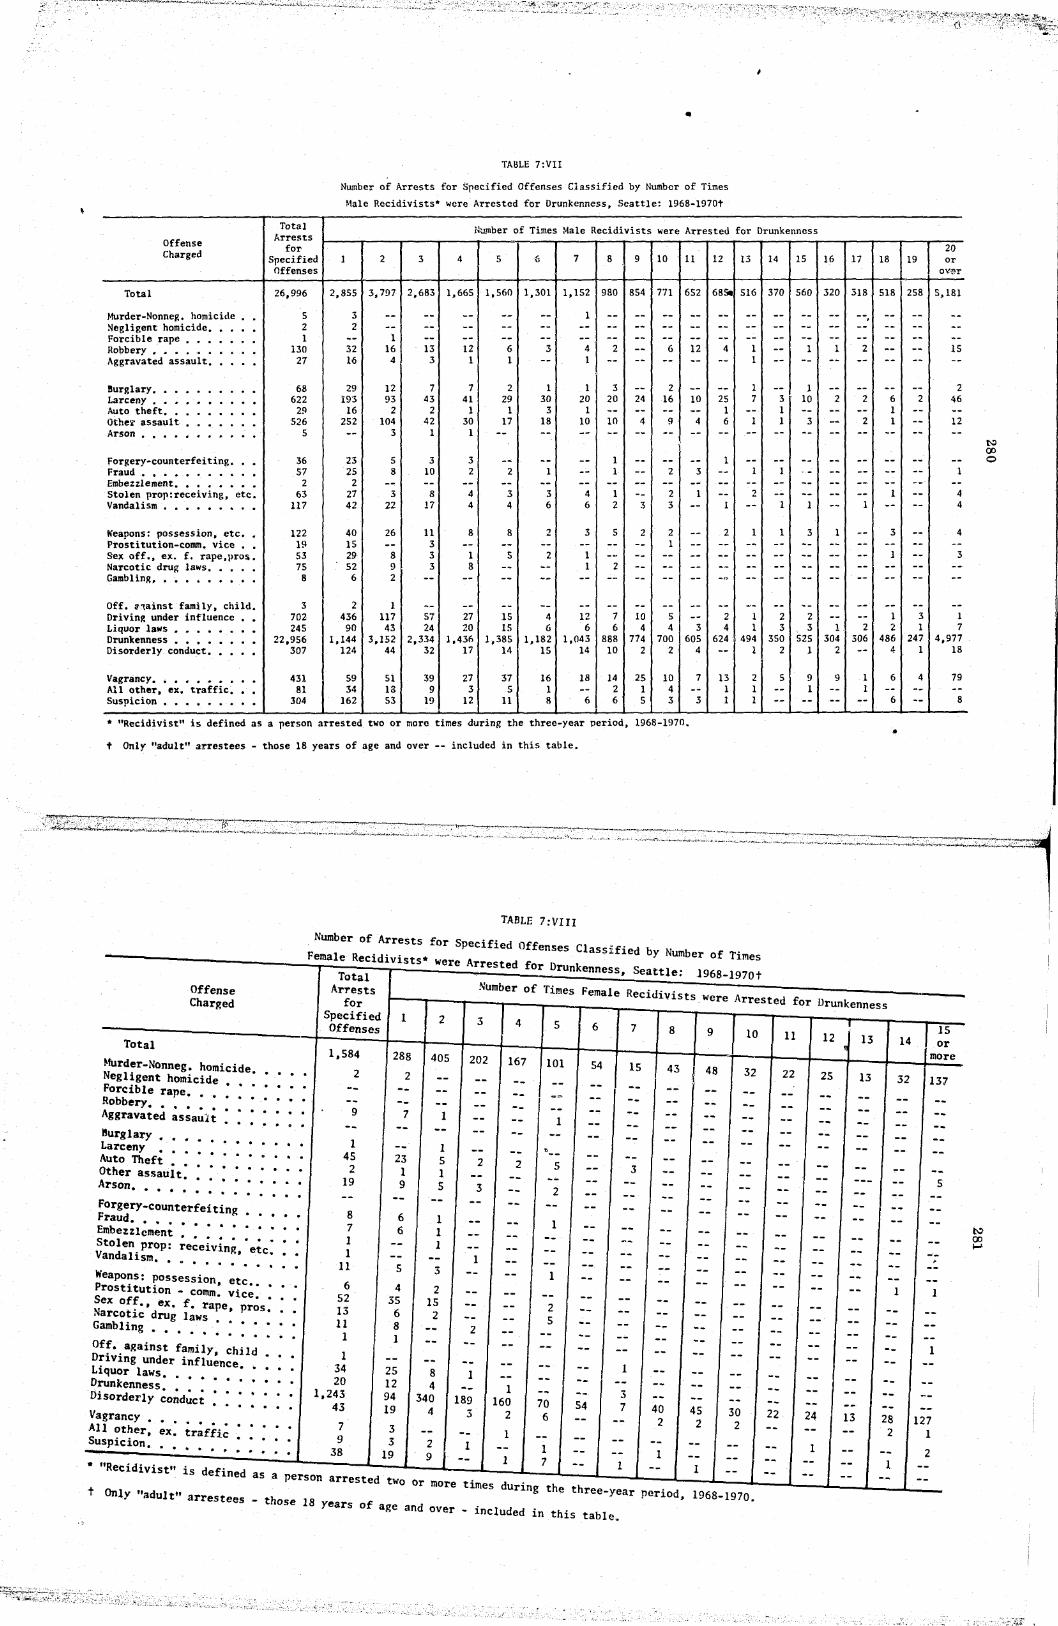
The total number of "arrests" in Table 7: VII is 26,996 recorded by 5,190
male "arrestees" (recidivists with at least one arrest for drunkenness during the
three-year period, 1968-1970). It will be seen that 22,956, or 85.0 percent, of the
26,996 arrests were for drunkenness. In addition, approximately 1,700 arrests
were for alcohol-related offenses, such as driving under the influence, violation of liquor laws, disorderly conduct and vagrancy.
The majority of offenses other than drunkenness were committed by those
with four or less arrests for drunkenness. Apart from alcohol-related offenses,
robbery, larceny, possesSion of concealed weapons, other assault and vandalism
cover a relatively wide range of frequency of arrests for drunkenness, but there
is a tendency for arrests for nondrunkenness offenses to diminish as the number of arrests for drunkenness increases.
.Arrests Cross-Classified by Offenses and by Frequency of Arrests for
Drunkenness of Female RecidiVists. Like the precedbg section, the primary unit
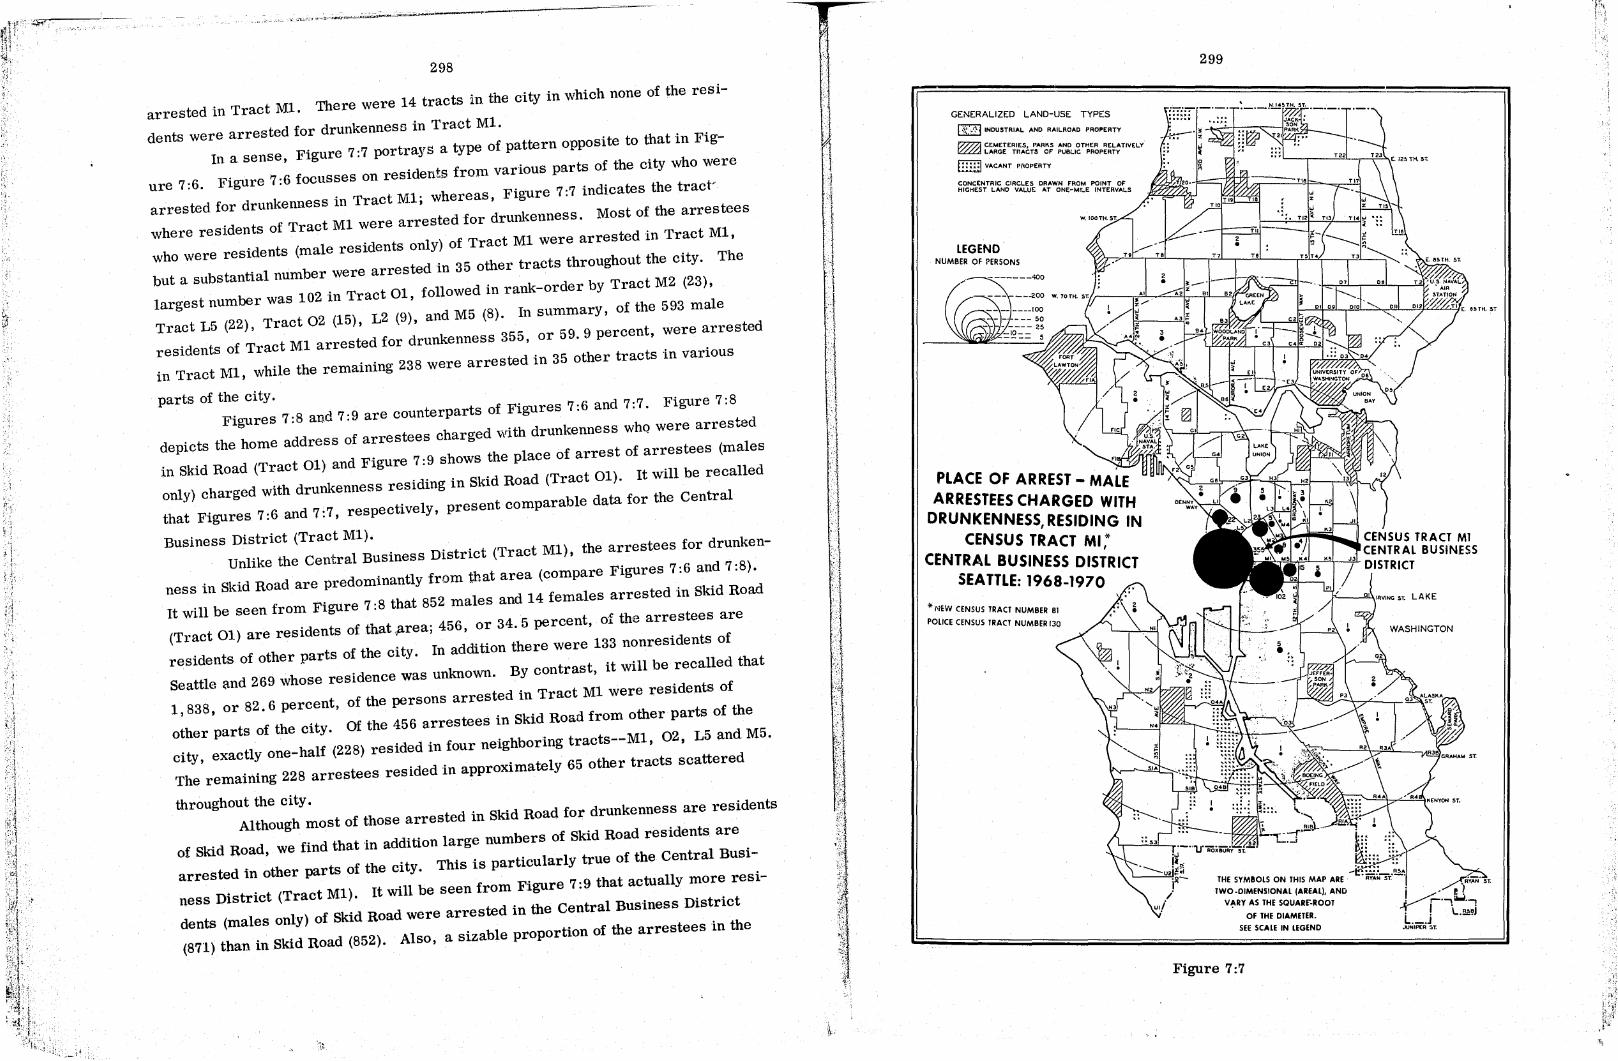
of analysis is "arrest, " not "arrestee. II Table 7: VIII presents the number of
arrests according to 28 offense categories in relation to the number of times female recidivists were arrested for drunkenness .
Table 7: VIn shows that female recidivists Who were arrested two or more
times, of which at least one was for drunkenness, during the three-year period,
1968-1970, had a total of 1,584 arrests. There were 427 female reCidivists that
conformed to the multiple-arrest and drunkenness-arrest criteria. A further
examination of Table 7: VIII reveals that 1,243, or 78.5 percent, of the 1,584
arrests were for drunkenness. In addition, there were a,pproximately 100 arrests
for alcohol-related offenses. BeSides drunkenness and other alcohol-related
crimes, the only Sizable numbers of arrests were for larceny and prostitution.
Furthermore, it will be noted that there is a tendency for frequency of arrests
•
\,
•
, :;
~ .. --~
:; .. ~.,
•
TABLE 7:VII
Number of Arrests for Specified Offenses Classified by Number of Times
Male Recidivists· were Arrested for Drunkenness, Seattle: 1968-1970t
Total Number of Times Male Recidivists were Arrested for Drunkenness Arrests Offense for Charged Specified 1 2 3 4 5 {} 7 8 9 10 11 12 13 14 15 Offenses
Total 26,996 2,855 3,197 2,683 1,665 1,560 1,301 1,152 980 854 7'11 652 68S. 516 370 560
Murder-Nonneg. homicide •• 5 3 -- -- -- -- -- I -- -- -- -- -- -- -- --Negligent homicide. • • • • 2 2 -- -- -- -- -- -- -- -- -- -- -- -- -- --Forcible rape • • • • • • • 1 -- I -- -- -- -- -- -- -- -- -- -- -- -- --Robbery • • • • • • • • • • 130 32 16 13 12 6 3 4 2 -- 6 12 4 1 -- I Aggravated assault ••••• 27 16 4 3 1 1 -- I -- -- -- -- -- I -- --Burglary •••••••••• 68 29 12 7 1 2 1 1 3 -- 2 -- -- I -- I Larceny • • • • • • • • • • 622 193 93 43 41 29 30 20 20 24 16 10 25 7 3 10 Auto theft. • • • • • • • • 29 16 2 2 1 1 3 1 -- -- -- .- 1 -- I --Othe~ assault ••••••• 526 252 104 42 30 17 18 10 10 4 9 4 6 1 1 3 Arson ••••••••••• 5 -- 3 1 1 -- -- -- -- -- -- -- -- -- -- --
)
Forgery-counterfeiting ••• 36 23 5 3 3 -- -- -- I -- -- -- I -- -- --Fraud. • • • • • • • • • • 57 25 8 10 2 2 1 -- I -- 2 3 -- I 1 --Embezzlement. • • • • • • • 2 2 -- -- -- -- -- -- -- -- -- -- -- -- -- --Stolen prop:receiving, etc. 63 27 3 8 4 3 3 4 I -- 2 1 -- 2 -- --Vandalism • • • • • • • • • 117 42 22 17 4 4 6 6 2 3 3 -- 1 -- I 1
Weapons: possession, etc •• 122 40 26 11 8 8 2 3 5 2 2 -- 2 1 1 3 Prostitution-comm. vice • • 19 15 -- 3 -- -- -- -- -- -- I -- -- -- -- --Sex off., ex. f. rape,pro$. 53 29 8 3 1 5 2 1 -- -- -- -- -- -- -- --Narcotic drug laws ••••• 75 52 9 3 8 -- -- I 2 -- -- -- -- -- -- --Gambling. • • • • • • • • • 8 6 2 -- -- -- -- -- -- -- -- -- -':>0 -- -- --Off. :11ainst family, child. 3 2 1 -- -- -- -- -- -- -- -- -- -- -- -- ~-
Driving under influence • • 702 436 117 57 27 15 4 12 7 10 5 -- 2 1 2 2 Liquor laws • • • • • • • • 245 90 43 24 20 15 6 6 6 4 4 3 4 1 3 3 Drunkenness • • • • • • • • 22,956 1,144 3,152 2,334 1,436 1,385 1,182 1,043 888 774 700 605 624 494 350 525 Disorderly conduct. • • • • 307 124 44 32 17 14 15 14 10 2 2 4 -- I 2 1
Vagrancy •••••••••• 431 59 51 39 27 37 16 18 14 25 10 7 13 2 5 9 All other, ex. traffic ••• 81 34 18 9 3 5 1 -- 2 1 4 -- I 1 -- I Suspicion • • • • • • • • • 304 162 53 19 12 11 8 6 6 5 3 3 1 1 -- --• "Recidivist" is defined as a person arrested two or more times during the three-year period, 1968-1970.
f Only "adult" arrestees - those 18 years of age and over -- included in this table.
16 17 18
320 318 518
-- --, -- -- ---- -- --
1 2 ---- -- ---- -- --
2 2 6 -- -- I
-- 2 1 -- -- --
-- -- ---- -- ---- -- ---- -- I
-- I --1 -- 3
-- -- ---- -- I
-- -- ---- -- ---- -- ---- -- I 1. 2 2
304 306 486 2 -- 4
9 1 6 -- I ---- -- 6
~.
19
258
------------
2 ----------------------------
3 1
247 1
4 ----
20 or
OV'frr
5,181
------15 --2
46 --12 ----
I --4 4
4 --3
------
1 7
4,977 18
79 --8
~ 00 o
~,,,,,,> .. -~;,,,,,,,~-", .. _- ;~-~~- '~,~, :=::~~-~-=-=~ =<-~ .. :::::~ ::.:~; ==::::..-=::::::::::;c::::;::;::
Total
Offense Charged
~furder-Nonneg. homicide. • Negligent homicide Forcible rape. • • • • • • • Robbery •••••• Aggravated assault. • • • •
Burglary • • • • • • Larceny • • • • • • Auto Theft Other assaUlt ••••••• Arson. • • • • • • • • •
Forgery-cOunterfeiting ••••• Fraud. • • • • • • • • • EmbeZZlement • • • • • Stolen prop: receivin~, etc. Vandalism. • • • • •
Weapons: possession, etc ••• Prostitution - comm. Vice. Sex off., ex. f. rape, pros. Narcotic drug laws • Gambling • • • • '" • • • • 5 • •
Off. against family. child Driving under influence. • Liquor laws. • • • • • • • • Drunkenness. • • • • •••• Disorderly conduct
Vagrancy • • • • • All other, ex. traffic • Suspicion. • • • •
TAllLE 7:VIII
Number of Arrests for Specified Offenses Classified by Number of Times
Female ReCidivists· were Arrested for Drunkenness, Seattle: 1968-1970t Total
Number of Times Female Recidivists were Arrested for Drunkenness Arrests for
Specified 1 Offenses
1,584
2
9
1 4S
2 19
8 7 I 1
11
6 52 13 11 1
1 34 20
1,243 43
7 9
38
288
2
7
23 1 9
6 6
5
4 35 6 8 1
25 12 94 19
3 3
19
405
1
1 S 1 S
1 1 1
3
2 15
2
8 4
340 4
2 9
202
2
3
1
2
1
189 3
1
167
1 160
2
1
1
2
101
1
"--5
2
1
1
2 5
70 6
1 7
S4
6
54
1
3 7
1
7
15
3
40 2
1
8 9
43 48
45 2
1
30 2
10 11
32 22
22
I
12
2S
24 13
1
13
13
28 2
1 • ftRecidivistft is defined as a person arrested two or more times during the three-year period, 1968-1970.
t Only "adult" arrestees - those 18 years of age and over _ included in this table •
. :,. ,-....
14
32
1
15 or
more
137
1
1
127 1
2
5
~ 00 I-'
.' •. ';: ~}j;f/
~ , I
! 1
"I

; '1' ~. i d
282
for nonalcohol-related offenses to decrease as the frequency of arrests for drunken
ness increases.
Special Analysis of Two Selected Groups of Male Recidivists With
Relativ~ly Large Number of Arrests for Drunkenness
In order to obtain more detailed insight into the personal characteristics
and arrest histories of recidivists with frequent arrests for drunkenness, two
groups were selected for special study. The first group is composed of 101 male
recidivists who were arrested 25 or more times for drunkenness during the three
year period, 1968-1970. The second group is a subgroup of 10 of the 101 male
recidivists who were arrested 55 or more times during the same three-year period.
Essentially, different types of data were collected for each of the groups. In the
larger group, emphasis is placed on personal characteristics, while in the second
group, arrest histories are given primary consideration.
Summary of Personal Characteristics of 101 Recidivists
Arrested 25 or More Times for Drunkenness
During the l'hree- Year Period, 1968-1970
Age Distribution of Male Recidivists Who Were Arrested 25 or More
Times for Drunkenness During the Three- Year Period, 1968-1970. It will be
observed from Table 7: IX that the overwhelming proportion--77. 2 percent--of
this group of 101 recidivists are 40 years of age and over. Almost 12. 0 percent
(11.9 percent) are 60 years of age and over. The mean age is 47.0 years and the
median age is 47.2 years.
There is a noticeable disparity between the ages of all males arrested for
drunkenness and this'special group of recidivists. For the entire group of male
arrestees for drunkenness both the mean and median age is 43.7 years. In com
parison, for this special group of l'ecidivists, the mean age is 47.0 and the median
age, 47.2 years.
283
TABLE 7: IX
Age Distribution of Male Recidivists·
Times for Drunkenness Arrested 25 or More
Seattle: 1968-1970 .
Age Recidivists
Number Percent
Total · · · 101 100.0
20 - 24 · · 3 3.0 · 25 - 29 · · · 5 5.0 30 - 34 • · · 6 5.9 35 - 39 • · · 9 8.9 40 - 44 · · · 20 19.8
45 - 49 • · 17 16.8 · 50 - 54 • · · 15 14.8 55 - 59 • · · 14 B.9 60 - 64 • · · 10 9.9 65 - 69 • · 2 2.0 ·
Average ~!ean Median -
Age • . . 47.0 47.2
*"Re d ' Cl IVlst" defined as a person arrested two or more times during the three-year period, 1968-1970.
Number of Different, Offenses of Male Recidivists Wi a W" A a M ' 1 ere rrested 25
r ore TImes for Drunkenness T bl ff " . a e 7: X presents the number of different
a enses WIth which this s .' 1 peCla group of 101 recidivists was charged In 45
44.6 percent, of the cases th I . , or , eon y charge was drUnkenness. Most of the other
~harges were fur alcohol-related offenses such as violation of liquor laws d ' lng under the infl ' rlV-
uence, vagrancy and disorderly conduct. Only approximatel 10. 0 perce~t were arrested for four or more offenses. y
- I
I

t ; 1
9,~
(.
, ., :1 :~ \
284
TABLE 7:X
Number of Different Offenses of Malle Recidivists·
Arrested 25 or ~10re Times for Drunkenness,
Seattle:
Number of Offenses
Total • • •
It •••• 2 .. • • • 3 . . . . 4 • • • • 5 • • • • 6 • • • •
7 • . . .
1968-1970
Recidivists
Numher Percent
101 100.0
45 44.6 -34 33.7 12 11.9
5 5.0 3 3.0 1 1.0
1 1.0
*"Recl' divist" defined as a person arre~ted t\'JO or 0 the t hree-year perlod, 1968-197 • more times during
t Drunkenness only.
Racial Distribution of Male Recidivists Who Were Arrested 25 or More.
k Table 7' XI clearly shows that among the 101 male recld-
Times for Drun enness. . ._
k ss Indians Negroes and Mexicans are disproportionately repre
ivists for drun enne ., thi d (32 7 sented on the basis of population in the city of Seattle. Almost one- r. .
Negroes comprise 17.8 percent and MexlCans and 2 "all other. "
percent) of the group are Indians. 5. 9 percent. There was 1 Filipino, no Chinese or Japanese
There were 41, or 40.6 percent, who were Caucasians.
~ r {
\ ,{ 1\ \ t II , I
fl J} I.i
I I I I '
I I ! \
\ '
\ '
I \ I '
\ L
11 ! I , I ·t t ~ t !
'I .' t . )
. ~
,:1 ;).
.$
285
TARLE 7:X~
Racial Distribution of Male Recidivists*.
Arrested 25 or Hare Times for Drunkenness,
Seattle: 1968-1970
Recidivists Race
INumber Percent
Total • • • 101 100.0
l~hite. · · • · 41 40.6
Indian • · · · 33 32.7
Negro. • • • · 18 17.8
~texican. • · • 6 5.9
Filipino • · • i 1.0
Ja}J~nese • · · Chinese. · • · All Other. · • 2 2.0
·"Recidivist" defined as a person arrested two or more times during the three-year peI'ioa, 1968-1970
Personal History and Police Record of Recidivists Arrested 55 or More
Times for Drunkenness During the Three-Year Period, 1968-1970. The second
special subgroup of recidivists consists of 10 persons who were arrested for drun
kenness 55 or more times during the three-year period, 1968-1970. All were
male, 4 Negro, 3 white and 3 Indian.
Their arrest histories were compiled from records of the Seattle Police
Department. For two cases, records extend back to 1949, while the remaining
eight range from 1952 to 1963. Of course, it is not assumed that the data derived
from the files of the Seattle Police Department represent the complete police rec
ord of these recidivists. It is possible that their activities extended to other local
ities before or during the period when they first came into contact with the Seattle
Police.
Since the size of this special subgroup is so small, no direct comparisons
can be made with the larger group of recidivists. However, certt~in characteristics
~,:~<II

, '.'
286
of the group may be noted. (Table 7: XII) As will be observed, the nonwhites are
overrepresented compared to their proportions in the general population. All ten
men finished at least grade school and six finished high sehool. It should be remem
bered that the personal data concerning this subgroup is largely self-reported, and
there is no practicable way of corroborating it. About half of the group is married
and about half, single. All men reported occupations in the "blue collar" category.
In view of their arrest rate for drunkenness it can be seriously questioned if any of
them have had any consistent employment record. Although 8 of these recidivists
are now over 35, the age at time of first arrest was considerably under 35 for most
of them. At time of first arrest by the Seattle Police, five were under 30 years of
age, four were between 32 and 37, and only one over forty. (Table 7; XII)
Case No.
1· · 2· · 3· · 4· · 5· · 6· · 7· · 8· • 9· ·
10· ·
TABLE i:XII
Personal Characteristics· of Recidivists Arrested in
Seattle for Drunkenness 55 or r-1ore Times During
Three-Year Period, 1968-1970
~1arital Education First Arrest Arrests Through 1970 Race Status Years Year Age Total Drunk Other
I S t 1963 20 81 78 3 N ~1 10 1957 33 124 124 --N M 8 1953 47 126 116 10 N M 12 1957 37 130 125 5 N S 12 1955 33 133 123 9
W W 12 1949 32 147 140 7 I S t 1962 25 148 147 1 I M ! 12 1957 24 159 156 3 N S 12 1949 26 164 145 19 W S 12 1952 23 198 191 7
*A11 of the cases are male and all are included in blue-collar occupations.
tNo data available.
. Although only ten persons are involved, they account for over 1,400
arrests, most of them for drunkenness spanning many years (for some, a 21-year
period). The number of arrests by the Seattle Police ranged from 81 for Case No.1
to 198 for Case No. 10. Nine of th.e ten cases were arrested 124 times or more.
They do not appear to have benefitad from their numerous contacts with the crimi
nal justice system. It will be noted from Table 7: XIn that most of the arrests are
for drunkenness with only very f€,W arrests for other offenses. Most of the other
l I I
I f I i
287
offenses are related to drunkenness such as liquor law violations ' duct and vagrancy S' h b ' , disorderly con-
• IX ave een arrested at least once for larcen group as a whole recording 19 arrests for this off y, with the arrests as part of a c ' , I ense. Instead of viewing these
rImlUa career, probably they can best be obtain money to satisfy their drink' h b' seen as attempts to
mg a It. As other studies h h nal careers and long histories in I' ave sown, crimi-together. vo vmg arrests for alcoholism seldom are found
TABLE 7:XIII
Arrcs ts other than for Drunkenness of Suhgroup of Recidivists
who were Arrested 55 or ~~re Tl"1l1CS for Drunkenness' S In .eattle
Case
Numbcr
Total • . .
1 . . 2 • • • •
,) . . . . 4 • . . . 5 • • • •
6 • • ., •
7 • • ., •
8 • • • •
9 • • ., •
10 • . . .
During Three-Year Period, 1%8-1970
Offense
Larceny (19), Vagrancy (18) , . Law (5) 0" " " , Ihs. Conduct (6) Liquor
r , rIVIng Under Influence (3) D ' picion (2), Safe Keepin (2) s ",rugs (2). Sus-WeaTlOns (1) Oth A
g ,. tolen Property (1), , erHssau1t (1), Other (2)
Liquor Lal'; (3)
None
Larceny (3), Stolen Property (1) p Under Influence (2) Di 5 C" t ' learlOns (1), Driving
" .• .On< uct (1), Vagrancy (1) Larceny (3), Drugs (1), Dis. Conduct (1)
Larceny (1), Liquor Law (1), Vagrancy (7)
Dis. Conduct (1), Vagrancy (5), Othe~ (1) Suspicion (1)
Larceny (2), Other Assaul t (1)
Larccny (9), Drugs (1), Dis. Conduct Safe Keeping (2) (2), Vagrancy (5),
Larcen~ (1), Driving Under Influence (1) I' (1), DIS. Conduct (1), Susnicion (1), Ot~e;I~~~r Law
Numher
62
3
5
9
7
1
19
6
Table 7 : XIV su " h mmarlzes t e arrest histories of this special subgroup of
recidivists. For most" th '" ' or e DLn theIr arrest history began with relativel few
annual arrests for drunkenness followed by an increase in number. The l~ est annual number of arrest@ was 33 in 1970 for Case N ' g h o. 7. Also, It should be noted
e was arrested 31 times the 19 year before. Case No. 2 was arrested 32 times in
70. Twenty or more arrests per year are not uncommon. Since 1967, it appears
..

. .,
,--- '--'-------..... --,~--
288
f these recidivists have been arrested for drunkenness at a much greater that many 0 fl t hanges either in police personnel or departmental policy. rate This may re ec c , I'
. b that with increased professionalization, old informal ways of hand mg It may e f al methods of.-. those charged with drunkenness have been replaced by more orm , _
1969 and 1970 show the greatest rate of m arrest and jail. The' last two years" ,
ell as largest number of arrests per year for drunkenness for thIS group crease as w h' , a highly
't also must be recognized that t IS group IS . _ of recidivists. Of course, 1
selected one based on the frequency of arrest during the past three years"
TABLE 7:XIV
I for Drunkenness 55 or ~10re Arrest History of Those Arrestel
n70 S ttle· 1949-1970 h Th e Year Period 1968-b , Lea . Times During t e re - , .
Number of Yearly Arrests by Case Year
#1 #2 #3 #4 #5 #6 #7 #8 1#9 #10
Total · · · · 81 124 126 130 133 147 148 159 164 198
1970 · · · · 22 32 23 26 23 28 33 23 31 24 1969 · · · · 20 . 23 22 18 22 18 31 25 20 14 1968 · · · · 18 15 11 16 10 15 18 10 12 18 1967 · · · · 18 9 11 12 12 7 13 11 13 12 1966 · · · · -- 9 10 6 9 6 9 11 6 12
1965 · · · · -- 8 10 11 14 11 14 18 14 16 1964 · · · · -- 6 4 5 4 9 8 4 4 9 1963 · · · · 3 5 8 10 7 6 8 14 7 13 1962 · · · · -- -- 1 15 3 7 14 9 4 12 1961 · · · • -- -- -- 2 4 3 -- 10 5 5
1960 · · · --· -- -- 6 2 3 -- 6 7 11 1959 · · • · -- 3 1 -- 4 2 -- 7 7 10 1958 · · · · -- 7 5 1 4 4 -- 7 3 13 1957 · · · · -- 6 4 2 4 3 -- 4 1 --1956 · · · · -- I 5 -- 4 3 -- -- 3 1
1955 · · · · -- -- 2 -- 7 8 -- -- 3 7 1954 · · · · -- -- 8 -- -- -- -- -- 5 3 1953 · · · · -- -- I -- -- 5 -- -- 4 5 1952 · • · · -- -- -- -- -- 7 -- -- 4 13 1951 · • · · -- -- -- -- -- -- -- -- 6 --1950 · · · • -- -- -- -- -- -- -- -- 4 --1949 · · · • -- -- -- -- -- 2 -- -- I --
289
The Chronic Alcoholic Offender and the
Deviancy Reinforcement Cycle for Public Intoxication
In the ~ ~ Report: Drunkenness of the President's Commission on
Law Enforcement and Administration of Justice (pp. 7-11), David J. Pittman pre
sents an excellent discussion of the characteristics of chronic alcoholic offenders,
in which middle-class and upper-class problem drinkers are differentiated from
lower-class chronic-drunkenness offenders. The deviancy reinforcement cycle is
described in some detail, shOwing how certain factors in the form of social policies,
community sanctions and attitudes toward the lower-class public drunkenness offen
der actually aggravate and reinforce his drinking problem.
Chronic drunkenness offenders are generally excessive drinkers who mayor may not be alcoholics, ~ut whose drinking has involved them in difficulties with the police, the courts, and penal institutions. They are a group for whom the penal sanctions of society have failed and to whom existing community resources have not heen applied. Although some of these men (very seldom women) are confirmed alcoholics, others are miscreants whose present use of alcohol is preliminary to alcoholism, and others are nonaddicted excessive drinkers who will never become alcholics.
As yet no studies exist which clearly differentiate an alcoholic from a nonalcoholic in the chronic drunkenness offender group. The most widely accepted definition of alcoholism is one developed by the World Health Organization which states:
Alcoholics are those excessive drinkers whose dependence upon alcohol has attained such a degree that it shows a noticeable mental disturbance or an interference with their bodily and mental health, their inter-personal relations, and their smooth social and economic functioning; or who show the prodromal signs of such development.
From this definition it is obvious that a history of arrests for public: intoXication is indicative of a drinking problem. Repeated arrests for public intoxication are certainly a symptom of the disease of alcoholism. However, as a result of the paucity of scientific research and lack of funds at the Federal, state, and local governmental levels for research and treatment stUdies on alcohOlism, there are few clear cut answers about this disease.
Two Federal appellate courts have recently held that a person cannot be convicted for behavior which is a manifestation of a disease. It has been urged upon the courts that such individuals lack mens rea or criminal intent, and that. . . any disease which de~s the individual of capacity to control his conduct will excuse conduct which would otherwise be condemned. It should be recognized that the two recent deCiSions deal only with the chronic alcoholic and one manifestation of his disease--public intOXication. They are aimed at helping only the chronic alcoholic, and not helping all drunkenness offenders. In short, the ~ ~ approach deals with

, ,
I " ;
290
one aspect of the chronic drunkenness offender problem. But society should be equally concerned with the individual who goes on a binge frorn time to time, and the drunkard whose intoxication appears to result from indolence, both of whom, through repeated arrests and incarcerati'Jns, are caught up in a deviancy reinforcement cycle or, in effect, a revolving door; this revolving door may actually contribute to an excessive drinker's becoming an alcoholic and also encourage the public inebriate to aet out secondary deviances.
On the whole, Americans have a relatively tolerant orientation toward nonexcessive drinking of alcoholic beverages. On many occasions, howeve .... , it is socially permissible to drink to excess. Th<.:~se occasions are usually private or semiprivate, and range from fraternity "beer blasts" and debutante "coming-out parties" to office parties and conventions. HoweVer, when a person's drinking starts to interfere with his work or family life, certain negative sanctions ~re invoked by his friends. His wife may be ashamed to invite guests home, and, correspondingly, friends may be embarrassed to visit. . . . Although the public labels these deviant middle class drinkers negatively, they do not invoke the same harsh sanctions against them as
with lower class alcoholics. On the other hand, the same public often considers lower class
alcoholiCS and excessive drinkers as worthless derelicts and vagrants. It is highly undesirable to have men sleeping in alleys and doorways. But the present solution--using the criminal system--fails to correct the problem and is unjust. And the public'S negative stereotype of the public intoxication offender is largely a result of this archaic and puni-
tive policy .... It is hypothesized here that "social policies directed against a par-ticular deviancy affect some differently than others, resulting in a corresponding effect on the larger public." The very nature of the administration of public intoxication laws excludes most middle and upper class alcoholics and excessive drinkers who typically drink in private or semiprivate surroundings. Public drunkenness laws discriminate against the lower class. . . . The jailed Intoxication offender represents social problems which encompass both social and class
relations in the United States. Looking at Figure 7:3, the "Deviancy Reinforcement Cycle for
Public Intoxication, " we can see the ramifications of the last statement. Excessive drinking and alcoholism are considered in a moralistic and negative manner by the larger population. When the deviant behavior of excessive drinking is acted out in public "B", the larger community's sanctions become greater, especially since these individuals are much more likely to be found in the lower socio-economic class.
Indeed, there seems to be a commonly accepted notion among therapists dealing with problem drinkers and alcoholics that there are two large sub-types. First, there is the person who has a disease and must be helped (middle and upper class alcoholics and problem drinkers). Secondly, there is the drunk or skid-rowite, who is hopeless and whom few professionals care to treat. Duff Gillespie evaluated 22 followup studies of treated alcoholics. It was found that the typical population in these public treatment facilities excluded lower-lower class whites and, especially, Negroes. The public drunkenness offender often does not expect to find tolerance even among professionals who are reputed to be among the more tolerant groupS.
t,." ;~ ,
z o -.... <{ U ->< o .... z u ...... al :J Q.
a:: o u.. w ...... U >U !Z w :E w u a:: o u.. Z w a:: >U z « -> w C w ::I: .... u.. o ...... w C o :E
291
W >U) -w ~:::> (!)..J w~ Z ....
w'"= u..J _<l: ..JZ 00
1 a.f= u..UU) o uJ Z U)O:O wO:f=
C us:::>
I ~=o ~
j / ~v)~ Qj~K
"{ 4.J ...., Cll v) ....,~K
~~~ ~~~ !,C~~ ~~~
I.L 0 W U Z W ::::J 0 W CJ)
..J <t ~ ..... W a: 0 W :r ..... W ..... <t Yo ,':I
~ CJ)
a.zU) <l:~ w ~
>U) -I':::0: z:::> :::>0 a.u
I.L 0 Z 0 i= u W a:
0
..J <t ~ ..... W a: 0 W :r ..... 11./
~ U 0' ZW -u
a:'CJ)Z w~~W ..... Z 0::::J ..... W a:..J w> a: I.L ..JW <t ~
* +-
•

',~ 1
! ~ "
., , " '
292
, kenness offenders are drawn from those The lower class pubhc drun t'onships arf; poorly educated,
who have difficulty in inter~rson:~C~:~a~inority ~d. are typicallY,depenare frequently from, an et~m;tc or ran ements (such as those found m, the dent on institutionalIzed lIvmg ar ,g d the Salvation Army and kmArmed Forces, the Merchtahnt Marmaet'aa~sadvantJge in competing with lte ) In short ey are . , dred she rs. , , role in our society. other persons for a prodUctIved , arcerations~ the negative effects of
After repeated arrests an mc . 'nf d (liD" and "E" on Figure '1 iables are reI orce 'bl the above sociologlCa, var tod individual finds it nearly i~pos,s~ e
7:3), The constant~y mcarce~~l and familial relationship; hIS abIlIty to maintain a meam~gful I?arl, dized by his arrest record to find employment IS sel'lou~ly )eopar stantly being officially labeled coupled with his poor educatIOn. By ti c~~l institutions as a public drunk, by the police, th~ ,courts and c~~~~~ d~unk; the jail becomes littl~ ~ore he begins to see mmself as a p , I t th Because the publIc mtoxthan a shelter to :-egain his physlCa s reng t himself he frequently turns ication offender is us~al~y unabl~ ~~ s~:J~~f he is ad alcoholic. The alcoto petty thievery. ThIS 1S espeCla ,Ytain his supply of alcohol, and 'fre~ holic will go to great length~ to m:I? king hours finding ways to obtain quently he spends most of his ~on t~~nalcoholic public intoxication offenmoney for alcohol. As a resu, bi m not only from diseases assodel' frequently presen,ts a, health fr~ ~ l' but also from his indifference ciated with an exceSSIVe l~take 0 a co 0 ,
to caring for himself phYSICally. ti effect on excessive drinkers Social policy has its greatest n,ega d ~i~ker who confines his drinking
who are not alcoholics. An exceSSlve r l'n the middle classes), but b t ( Pattern not uncommon t d
to weekend ou sa, find himself frequently arres ,0 who does not drink secretIvely, ,m~ ens often enough, he may be conand perhaps incarcerated. If ~hl~ di PP al and the correctional procesditioned by the enforcement, 'b e~~o ~iS drinking problem. Where before ses in such a way as to contrl u d man ed to hold a job and be a he confined his drinkin,g to ~eekendfe:~ncrea:rnglY difficult and harder breadwinner, he no~ fmds ~ ese ~~h encourage his drinking. In~t~ad to maintain, and crIses, arl'l~e ;; the social poliCies have modIfied of arrestin? his excess~;e,,~=~~~~ng~nd "D"--"A", Figure 7 :3) hi~ de-(relationshIps between :E ' he development of a more serIOUS viant behavior an~ contrIbuted ~~ t bUc intoxication offender confronts deviancy--alcohohsmo Thus" Ie PUbl which involves the total com-'t 'th a serious SOCIa pro em :~~;':/w~l as the criminal justice system. .
Ecology of Drunkenness
, ... h te '·.;11 be devoted to an analysis of various The remamder of thIS c ap I . , ,
' 't ibution of arrestees for drunkenness and for drlYmg aspects of the spatial diS r f st and place of residence
' , l' referents are place 0 arre under the mfluence. Pnma y ddition a few series of data are
differentiated according to sex. In a , of arrestees,
classified by race.
1. Figures 7,4 and 7:5 f A ·,t f Those Charged With Drunn.enness. . Place 0 rre~ 0 h ed with
present place of arrest of males and females, re~pectively, who were c arg ~
r II 293
drunkenness during the three-year period, 1968-1970. Again, it should be empha-
sized that the data on these maps indicate arrestees, not arrests. Because of
multiple arrests, the actual volume of arrests during \:he three-year period, 1968-1970, is not revealed by this map,
I J
Ii I! 1'1
'\
1 I
,
Tract M1, the Central BUSiness District shows the heaviest concentration
of arrests, both for males and for females charged with drunkenness. DUring the
three-year period, 1968-1970, there were 2,784 males and 270 females arrested
in Tract MI. Many of these arrestees were arrested two or more times during
the period. In attempting to explain the large number of arrests for drunkenness
in the Central BUSiness District, the following questions might be raised: Can the
high inCidence of arrests be accounted for by the large number of drunkards who
frequent the area? Or, are the police less tolerant of public drunkenness in the
main shopping, banking, profeSSional service and amusement center of the city
than in areas such as Skid Road? Skid Road, Tract 01, ranks second in number
of persons arrested, 1,638 males and 91 females. For males, Tract M2 ranks
third with 583, Tract L5 ranks fourth with 549 and Tract 02, fifth with 5,20. For
females, Tract M2 is second with 74, Tract L5, third with 56, and Tract 02, fourth
with 43. In general, the overwhelming proportion of arrests for drUnkenness are
made in the Central BUSiness District and contiguous areas. The number of males
arrested in the 13 census tracts compriSing the inset on Figure 7:4 totalled 7,229,
or 76.0 percent, of the 9,508 male arrestees charged with drunkenness, For fe
male arrestees (Figure 7 :5) the total for the city is 1,058 of which 691, or 65.3
percent, are included in the 13 tracts in the inset, OutSide the central area as
defined by the insets in Figures 7:4 and 7:5, there are five other tracts with notice
ably large clusterings of male arrestees (ranging from 72 to 134) and four other
tracts for female arrestees (ranging from 12 to 23). For both male and female
arrestees, two of the tracts are contiguous to the central area (Tracts Kl and K4);
one is in the southern part of the city known as Georgetown (Tract RIA) and one is
in the northwestern part of the city, the main bUSiness section of Ballard (Tract
A5). The fifth tract for male arrestees located outside the central area is the University District (Tract D6).
One of the distinctive characteristics of arrestees for drunkenness is the
large number of Indians arrested in the central part of the city. The inCidence of
drunkenness among Indians is out of all prlJportion to the number represented in
the population. This fact is also true for Negroes but to a much less degree.
MeXicans also show a high rate of drunkenness in the city of Seattle, but it is not

~ . ,
EXPLANATORY NOTE AS THE TITLE SPECIFIES. THE DATA ON THIS MAP REPRESENT THE NUMBER OF PERSONS (18 YEARS OF AGE AND OVER) ARRESTED ON THE CHARGE OF DRUNKENNESS DURING THE THREE-YEAR PERIOD. 1968-1970. D.URING THIS PERIOD MANY ARRESTEES WERE ARRESTED MORE THAN ONCE EITHER FOR DRUNKENNESS OR FOR SOME OTHER OFFENSE. SO THAT THE AOUAL VOLUME OF ARRESTS IS NOT REVEALED BY THIS MAP IN THE CASE OF MULTIPLE ARRESTS (RECIDIVISM) THE ARRESTEE WAS PLACED IN THE MOST SERIOUS OFFENSE CATEGORY. SEE TEXT FOR ADDITIONAL EXPLANATIONS AND INTERPRETATIONS •
LEGEND NUMBER OF PERSONS
.._-.,.,-:::-- ___ - -2,000
() WHITE
• NEGRO OTHER
PLACE OF ARREST MALE ARRESTEES CHARGED
WITH DRUNKENNESS SEATTLE: 1968-1970
THE SYMBOlS ON THIS MAP ARE
TWO_DIMENSIONAL (AREAL), AND VARY AS THE SQUARE-ROOT
OF THE DIAMETER.
SEE SCA LI: IN LEGEND
Figure 7:4
LAKE
WASHINGTON
EXPLANATORY NOTE AS THE TITLE SPECIFIES. THE DATA ON THIS MAP REPRESENT THE NUMBER OF PERSONS (18 YEARS OF AGE AND OVER) ARRESTED ON THE CHARGE OF DRUNKENNESS DURING THE THREE-YEAR PERIOD 1968-1970. DURING THIS PERIOD MANY ARRESTEES WERE ARRESTED MORE THAN ONCE EITHER FOR DRUNKENNESS OR FOR SOME OTHER OFFENSE SO THAT THE AOUAL VOLUME OF ARRESTS IS NOT REVEALED BY THIS MAP. IN THE CASE OF MULTIPLE ARRESTS (RECIDIVISM) THE ARRESTEE WAS PLACED IN THE MOST SERIOUS OFFENSE CATEGORY SEE TEXT FOR ADDiTiONAL EXPLANATIONS AND INTERPRET ATIONS
LEGEND NUMBER OF PERSONS
• 295
/ .. _ .. ~_:---- ----Joe // "'-. W 70TH. ST f-;;--TT,--,,;-,g~:;--J1!I...---,!l~../GRIEE~
/ \ \ (/.~-\~_~~=,oo \ (,,~,\-\--,,--!-- 25
\. \l., ( ~-:)+/=;(~5= ~.:::).1@l;;?;:?:==.-:: rW""-"':!'!!.!
INDIAN CD WHITE ~ -::'
• NEGRO 0 OTHER
PLACE OF ARREST FEMALE ARRESTEES CHARGED
WitH DRUNKENNESS SEATTLE: 1968-1970 ~
LAKE
.f~--""~ ,ov,'" ST.
THE SYMBOLS ON THIS MAP ARE TWO-DIMENSIONAL (AREAL). AND
VARY AS THE SQUARE-ROOT
OF THE DIAMETER.
SEE SCALE IN LEGEND
Figure 7:5
WASHINGTON

~~~'jr'f"~'. y~:).
P.
:'
-....... - ... --- .. -~-.. --.-~-~="~~--'--"--"-----'---~-.....--~~
296
possible to make accurate comparisons because of unsatisfactory population data.
For example, 69 male arrestees for drunkenness in Tract Ml and 56 in Tract 01
were Mexican. Filipinos, Chinese and Japanese rank lower in drunkenness than
any of the other ethnic groupS, including whites. Among the 2,784 male arrestees
in Tract Ml, 66.2 percent were white, 21. 3 percent Indian, 7.8 percent Negro,
and 4.7 percent all other. The corresponding figures for 1'ract 01 are: white,
59.7 percent; Indian, 21.1 percent; Negro, 14.7 percent; and all other, 4.6 per
cent. Among female arrestees, the proportion of Indians is considerably higher
and the proportion of Negroes, lower. In Tract Ml the percentage of white females
was 48.1, Indian females 44.4, Negro females 4.1 and all other 3.4. For Tract
01, 26.4 percent were white; 62.6 percent, Indian; 8.8 percent, Negro; and
2. 2 percent, all other. Relationship Between Home Address of Arrestees and Place of Arrest. In
the previouS section it was indicated that the highest arrest rate for drunkenness
occurred in the Central Business District. However, we find that only a relatively
small proportion of these arrestees actually reside in this part of the city. In
other words, particularly with respect to the Central Business District, place of
occurrence of many social phenomena and place of residence may be very different.
This is true not only for drunkenness, but also for many other offenses. 11 It will
be recalled that 2,784 males and 270 females were arrested for drunkenness in
Tract Ml during the three-year period, 1968-1970. However, only 355, or 12.8
percent, of the male arrestees and 33, or 12.2 percent, of the female arrestees
resided in this tract. The overwhelming proportion of arrestees came from other
areas of the city (1,838), from other parts of the state of Washi.ngton (266), and
from other states and Canada (62). In addition, residence was unknown in a sub
stantial number of cases (500). An examinaUon of Figure q:6 reveals that 871
males arrested in the Central Business District (Tract Ml) resided in Skid Road
(Tract 01). This figure of 871 arrestees from Tract 01 was noticeably in excess
of the number of arrestees--3fi "'--that actually resided in Tract M1. In the 12
tracts (exclusive of Tract Ml) in the inset on Figures 7:4 and 7:5 there was a total
of 1,342 per.-sons arrested for drunkenness in Tract Ml. The remaining tracts of
the city showed 496, or 27.0 percent, of the total for the entire city who were
110ver forty years ago, the senior author discussed this point in some detail with respect to suicidal behavior. Calvin F. Schmid, Suicides in Seattle, ill! to~, Seattle: University of Washington Press, 1928', pp. 4-23.
GENERALIZED LAND-USE TYPES
[,·~t , .... : IINOUSTRIAL AND RAILROAD PROflERTY
Wdl ~~E~~:C::ROKFS ~H! OTHER RELATIVELY ••••• r~IC PROPERTY
lliTI1J VACANT PROPERTY
~~T~I~~IRili.~SE orT"WONNEFA .. OM POINT OF - ILE INTERVALS
LEGEND NUMBER Of PERSONS
------900
• MALE
CD fEMALE
HOME ADDRESS OF ARRESTEES CHARGED WITH DRUNKENNESS I ARRESTED IN CENSUS TRACT MI* ,
CENTRAL BUSINESS DISTRICT
SEATTLE: 1968-197
... NEW CENSUS TRACT NUMBER 81
POLICE CENSUS tRACt NUMBER 130
SUMMARY DISTRIBUTION OF ARRESTEE!; BY RESIDENCE STATUS
SEATTLE 11968-1970*
RESIDENCE STATUS
NON-RESIDENTS
I KINGCOUNTY-EX.SEATTLE •• 122 113
II. WASHINGTON STt.if-i:::X. ALL OF KING "OUNTY _ •••••• 144
m.OTHER STATiS AND CANADA.. ~2 54
ALL RESIDENCE CATEGORIES
I. RESIDENTS OF SEATTL E •• _. 2,226 2P27
n NONRESiDENTS............ 328 292
*~~~SID~NCE.UNKNOWN""~,, •. 5001".465 35
Only ,.sidents at Sea"l, Included ~n thiS 'mon
297
THE SYMBOLS ON tHIS MAP ARE tWO -DIMENSIONAL (AREAL), AND
VARY AS tHE SQUARE·ROOT
Of tHE DIAMEtER.
SEE SCALE IN LEGEND
Figure 7:6
LAKE
298
arrested in Tract M1. There were 14 tracts in the city in which none of the resi
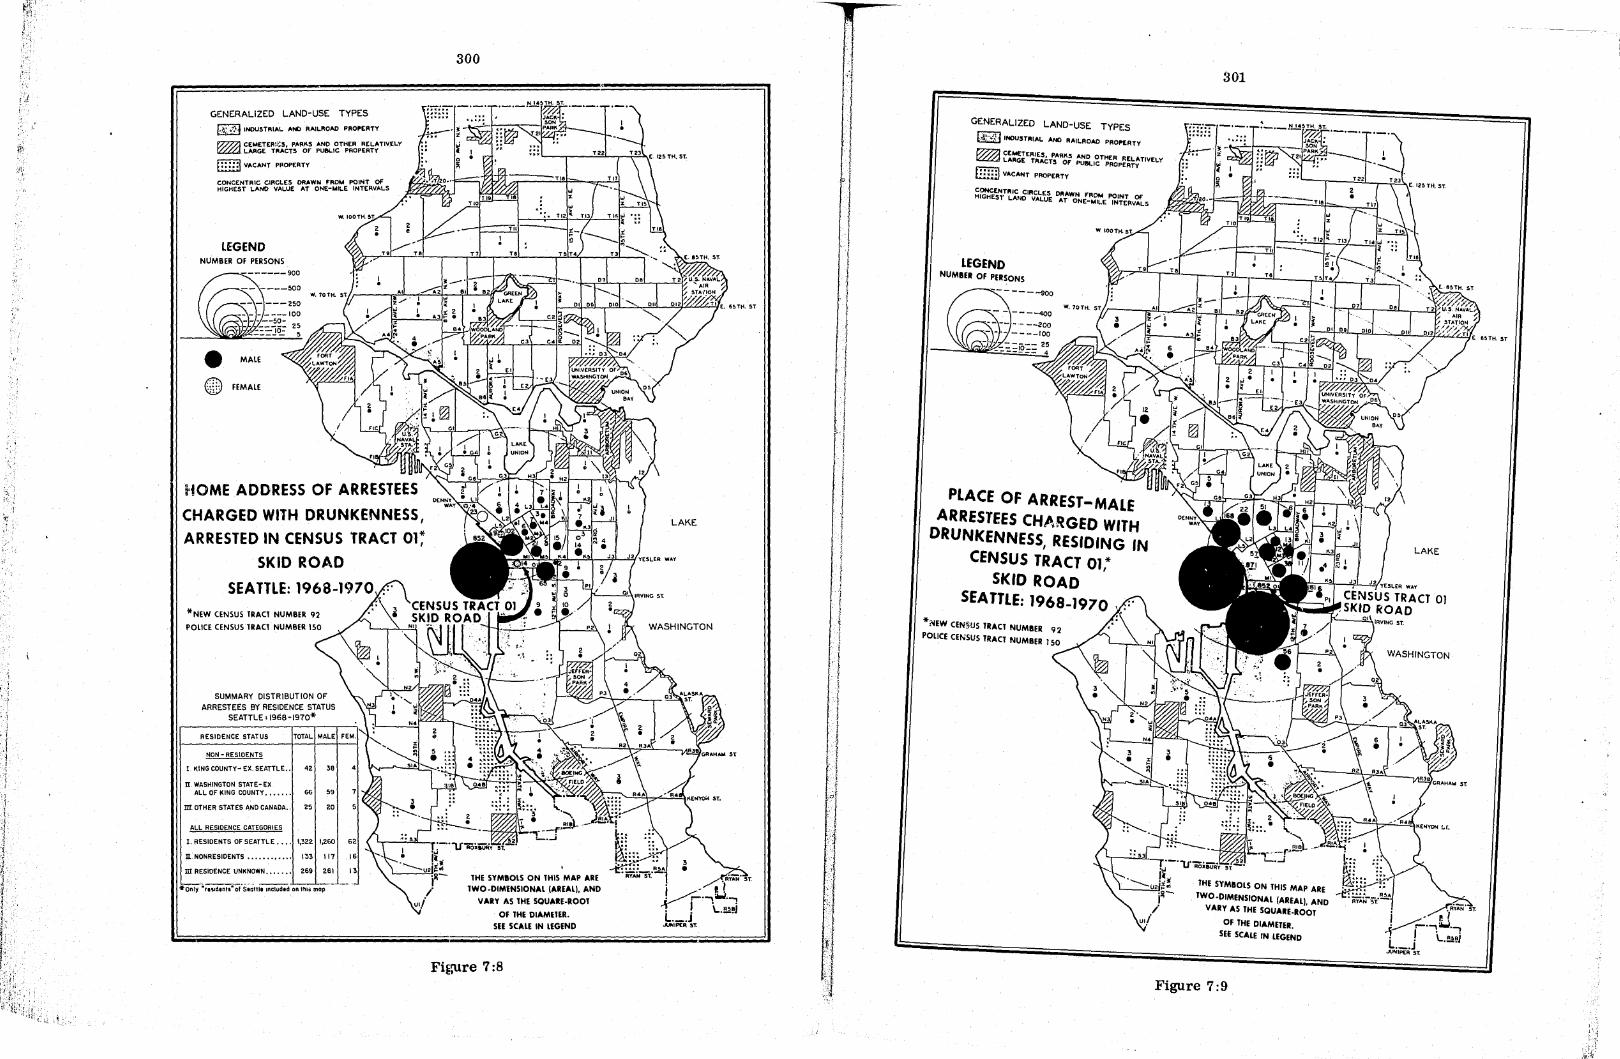
dents were arrested for drunkenness in Tract Ml. In a sense, Figure 7:7 portrays a type of pattern opposite to that in Fig-
ure 7 :6. Figure 7:6 focusses on residents from various parts of the city who were
arrested for drunkenness in Tract Ml; whereas, Figure 7:7 indicates the tract'
where residents of Tract M1 were arrested for drunkenness. Most of the arrestees
who were residents (male residents only) of Tract M1 were arrested in Tract M1,
but a substantial number were arrested in 35 other tracts throughout the city. The
largest number was 102 in Tract 01, followed in rank-order by Tract M2 (23),
Tract L5 (22), Tract 02 (15), L2 (9), and M5 (8). In summary, of the 593 male
residents of Tract M1 arrested for drunkenness 355, or 59.9 percent, were arrested
in Tract 1\1:1, while the remaining 238 were arrested in 35 other tracts in various
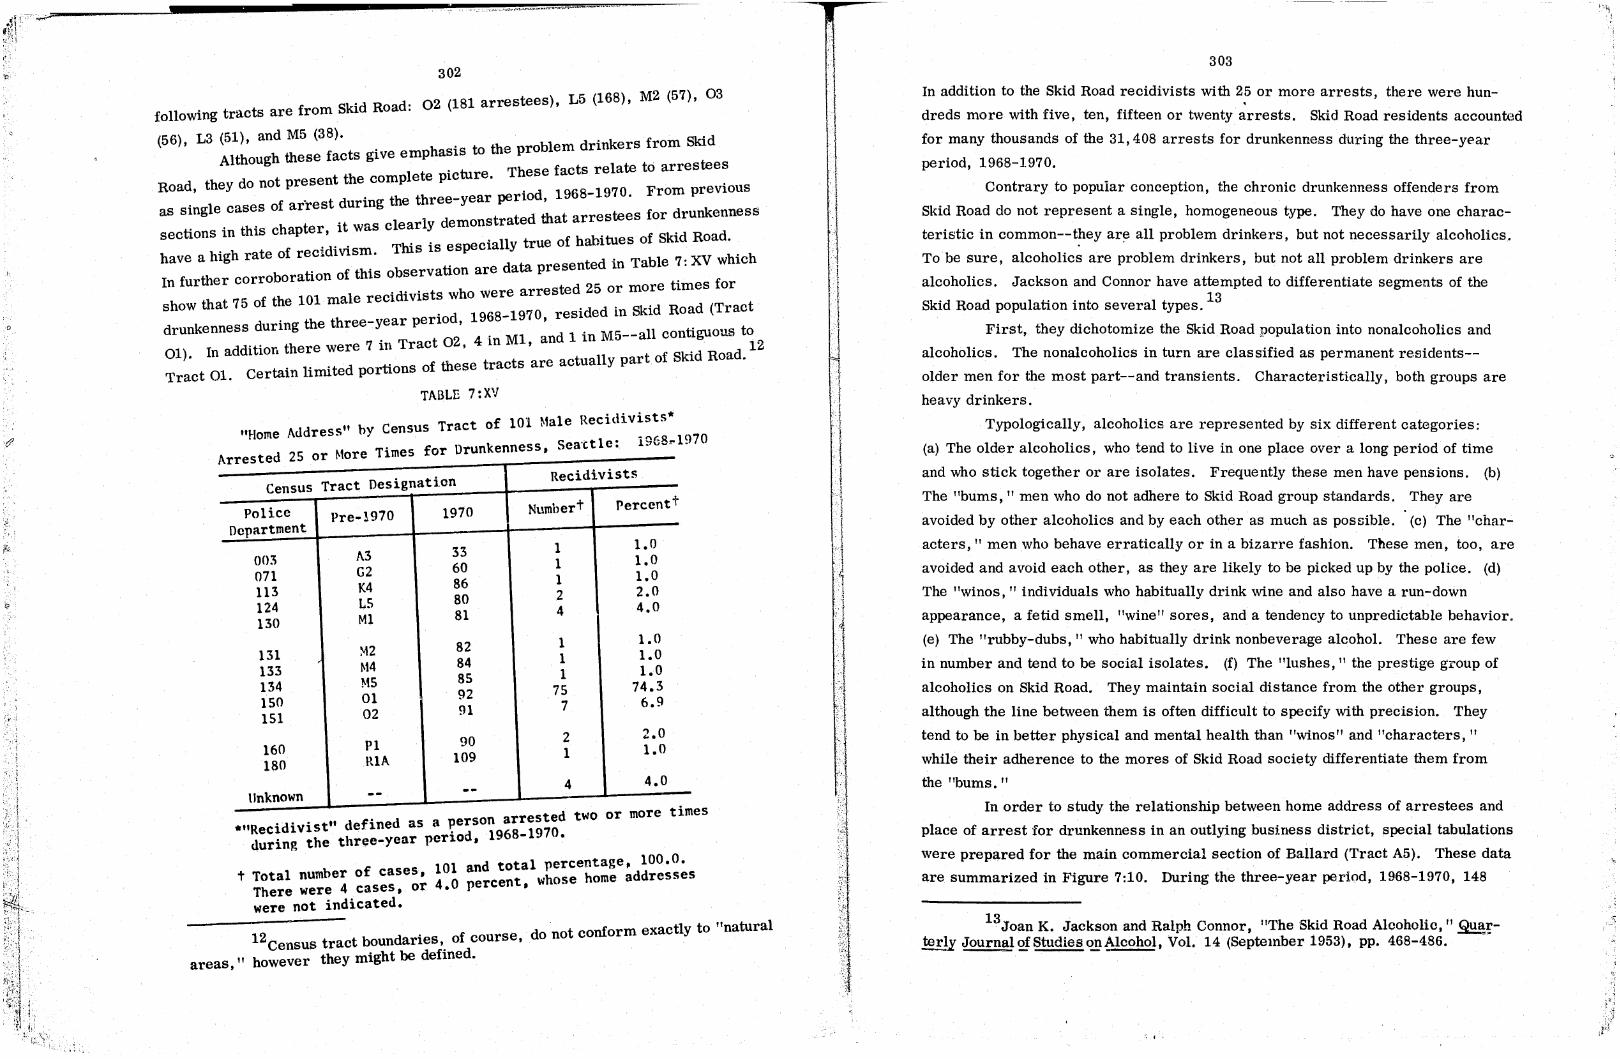
parts of the city. Figures 7: 8 an..d 7: 9 are counterparts of Figures 7: 6 and 7: 7. Figure 7:
8
depicts the home address of arrestees charged with drunkenness whQ were arrested
in Skid Road (Tract 01) and Figure 7:9 shows the place of arrest of arrestees (males
only) charged with drunkenness residing in Skid Road (Tract 01). It will be recalled
that Figures 7:6 and 7:7, respectively, present comparable data for the central
Business District (Tract M1). Unlike the central Business District (Tract M1), the arrestees for drunken-
ness in Skid Road are predominantly from that area (compare Figures 7:6 and 7:8).
It will be seen from Figure 7:8 that 852 males and 14 females arrested in Skid Road
(Tract 01) are residents of that .area; 456, or 34.5 percent, of the arrestees are
residents of other parts of the city. In addition there were 133 nonresidents of
Seattle and 269 whose residence was unknown. By contrast, it will be recalled that
1,838, or 82.6 percent, of the persons arrested in Tract M1 were residents of
other parts of the city. Of the 456 arrestees in Skid Road from other parts of the
city, exactly one-half (228) resided in four neighboring tracts--M1, 02, L5 and M5.
The remaining 228 arrestees resided in approximately 65 other tracts scattered
throughout the city. Although most of those arrested in Skid Road for drunkenness are residents
of Skid Road, we find that in addition large numbers of Skid Road residents are
arrested in other parts of the city. This is particularly true of the central Busi
ness District (Tract M1). It will be seen from Figure 7:9 that actually more resi
dents (males only) of Skid Road were arrested in the central Business District
(871) than in Skid Road (852). Also, a sizable proportion of the arrestees in the
GENERALIZED LAND-USE TYPES
1,~t':,,":IINDUSTRIAL AND RAILROAD PROPERTY
~ ~~~~~E~li:cisAR~~ ~~~LI~T~~~p~~~TIVELV P::::I VACANT P~OPERTY
CONCENTRIC CIACLES ORA HICHEST LANO V .... LUE AT WtN[_R~I~E ~~lRV'its
LEGEND NUMBER OF ~ERSONS
PLACE OF ARREST - MALE ARRESTEES CHARGED WITH
DRUNKENNESS, RESIDING IN CENSUS TRACT MI *
CENTRAL BUSINESS DISTRICT SEA TTLE: 1968-1970
* PlfW CENSUS TRACT NUMBER 81
POLICE CENSUS TRACT NUMBER 130
299
j"----"'-\IRVIINC ST. LAKE
THE SYMBOLS ON THIS MAP ARE TWO-DIMENSIONAL (AREAL), AND V~RY AS THE SQUARF-ROOT
OF THE DIAMETER. SEE SCALE IN LEGEND
Figure 7:7
WASHINGTON
I,'
GENERALIZED LAND-USE TYPES
[.,~; .. ~.J INDUSTRIAL AND RAILROAD PRO,ERTY
f7777.l CEMETERi};S, PARKS AND OTHER RtLATI'J,£LY ~ LARGE TRACTS 0"- PUBLIC PROPERTY
!:::: :1 VACANT PROPERTY
CONCENTRIC CIRCLES DRAWN FROM pOINT oF HIGHEST LAND VALUE AT ONE-MILE lNTERVJr-oLS
LEGEND
MALE
FEMAlE
HOME ADDRESS OF ARRESTEES
CHARGED WITH DRUNKENNESS, ARRESTED IN CENSUS TRACT 01;
SKID ROAD
*NEW CENSUS TRACT NUMBER 92
POLICE CENSUS TRACT NUMBER 150
I KING COUNTY- EX, SEATTLE ••
n WASHINGTON STATE-EX ALL OF KING COUNTY ••••••
nt OTHER STATES AND CANADA.,
ALL RESIDENCE CATEGORIES
1, RESIDENTS OF SEATTLE. • • 1,322
n. NONRESIDENTS ........... 133
m RESIDENCE UNKNOWN... • • • 269
S'ottl, Includ,d on thi;; mop
THE SYMBOLS ON THIS MAP ARE TWO -DIMENSIONAL (AREAL), AND
VARY AS THE SQUARE-ROOT
Of THE DIAMETER. SEE SCALE IN LEGEND
Fi~~re 7:8
LAKE
WASHINGTON
ST.
; I /1
I
, I ! ! I 1
I ,!
(
! j
I I [
I i , I I 1 . f I )
1 i ! ~
I ! [ I t
i "
1 , (
! f' 4
! I
",f. i l
i 1 { I ! !
f f 'o.r
;1 f
"1 ,,'
"'1
I If 1 I if
j
GENERALIZED LAND-USE TYPES
[:a;; . ./~ J IHOUST"IAL ANO RAILROAD PRO~RTY l?/771 CEWf;TERIES, PARKS AND OTHER RELATIVELY ~ LARGE TRACTS OF PU8l.IC PROPERTY
mE:] VACANT PROPERTY
CONCENT"'C CIACLES o...AWN FROM POINT OF HIGHEsr LAND VALUE AT ONE-MILE INTERVALS
w. ,uorH, .,-"'~
PLACE OF ARREST-MALE ARRESTEES CHA,RGED WITH
DRUNKENNESS, RESIDING IN CENSUS TRACT 01,*
SKID ROAD SEATTLE: 1968-1970
* .... EW CENSUS TRACT NUMIIER 92
POLICE CENSUS TRACT NUMBER 150
301
THE SYMBOLS ON THIS MAP ARE
TWO-DIMENSIONAL (AREAL), AND VARY AS THE SQUARE-ROOT
OF THE DIAMETER. SEE SCALE IN LEGEND
Figure 7:9
LAKE
WASHINGTON
'0
o
, '"
:, < ; .... '
302
d 02 (181 arrestees), L5 (168), M2 (57), 03 following tracts are from Skid Roa :
(56), L3 (51), and M5 (38)., h 's to the problem drinkers from Skid Although these facts give emp aSl
ot resent the complete picture. These facts relate to arrestees Road, they do n p , d 1968-1970. From previous
, f . est during the three-year perlO , as smgle cases 0 arr t t d that arrestees for drunkenness sections in this chapter, it was clearly demons ra e
, ~d' . This is especially true of habitues of Skid Road. have a high rate of rec~ IVlS~, b fon are data presented in Table 7: XV which In further corroboration of thIS 0 serva 1 ,
ale recidivists who were arrested 25 or more hmes for show that 75 of the 101 m . d 1968-1970 resided in Skid Road (Tract drunkenness during the three-year perlO " M1 ~nd 1 in M5--all contiguous to
In addition there were 7 in Tract 02, 4 lU , , d 12 01). Certain limited portions of these tracts are actually part of Skid Roa . Tract 01.
TABLE 7:XV
f 101 Male Recidivists* "Home Address" hy Census Tract 0 I
S tl' 1968~1970 d 25 r More Times for Drunkenness, .eat e.
Arreste 0
Tract Designation Recidivists Census
police Pre-!970 1970 Numbert Percent t
Department
33 1 1.0 003 A3 1.0 60 1 071 G2 1.0 86 1 113 K4 2 2.0 80 124 L5 4 4.0 130 M1 81
82 1 1.0 131 M2 1 1.0 133 M4 84 1.0 85 1 134 r.15 75 74.3 92 150 01 7 6.9 151 02 91
90 2 2.0 160 Pl 1 1.0 180 RIA 109
4 4.0 --Unknown -- . sted two or more tlmes
*"Recidivist" defined as a ~erso~9:~~~970. during the three-year perlod,
1 and total percentage, 100.0. t Total number of cases, 10 percent, whose home addresses
There were 4 cases, or 4.0 were not indicated.
do not conform exactly to "natural 12Census tract boundaries,. of course,
areas," however they might be defmed.
I , I
-I
J -I I
! ! 1 1
303
In addition to the Skid Road recidivists with 25 or more arrests, there were hun-. dreds more with five, ten, fifteen or twenty arrests. Skid Road residents accounted
for many thousands of the 31,408 arrests for drunkenness during the three-year
period, 1968-1970.
Contrary to popular conception, the chronic drunkenness offenders from
Skid Road do not represent a single, homogeneous type. They do have one charac
teristic in common--they ar~ all problem drinkers, but not necessarily alcoholics.
To be sure, alcoholics are problem drinkers, but not all problem drinkers are
alcoholics. Jackson and Connor have attempted to differentiate segments of the
Skid Road population into several types. 13
First, they dichotomize the Skid Road population into nonalcoholics and
alcoholics. The nonalcoholics in turn are classified as permanent residents-
older men for the most part--and transients. Characteristically, both groups are
heavy drinkers.
Typologically, alcoholics are represented by six different categories:
(a) The older alcoholics, who tend to live in one place over a long period of time
and who stick together or are isolates. Frequently these men have pensions. (b)
The "bums, " men who do not adhere to Skid Road group standards. They are
avoided by other alcoholics and by each other as much as possible. (c) The "char
acters, " men who behave erratically or in a bizarre fashion. These men, too, are
avoided and avoid each other, as they are likely to be picked up by the police. (d)
The "winos, " individuals who habitually drink wine and also have a run-down
appearance, a fetid smell, "wine" sores, and a tendency to unpredictable behavior.
(e) The "rubby-dubs, " who habitually drink nonbeverage alcohol. These are few
in number and tend to be social isolates. (f) The "lushes, " the prestige group of
alcoholics on Skid Road. They maintain social distance from the other groups,
although the line between them is often difficult to specify with preciSion. They
tend to be in better physical and mental health than "winos" and "characters, "
while their adherence to the mores of Skid Road society differentiate them from
the "bums. "
In order to study the relationship between home address of arrestees and
place of arrest for drunkenness in an outlying business district, special tabulations
were prepared for the main commercial section of Ballard (Tract A5). These data
are summarized in Figure 7:10. During the three-year period, 1968-1970, 148
13Joan K. Jackson and Ralph Connor, "The Skid Road Alcoholic," Qu,,!:!,terl.}:' Journal ~ Studies <>.E-Alcohol, Vol. 14 (September 1953), pp. 468-486.
" .

",
. i
,1
GENtRALiZED LAND-USE TYPES
~ I!<OU5T~IAL ANO RAILROAO P~OPE~TY
f77.77.J CEMETERIES; PARKS AND OTHER R~~:TIV[LY ~ LARGE TRACTS or PU6l..IC PROPE
1=::::1 ""CANT PROPERTY
~?tH'i~~~?t';Ng'R~Al~SE O::W~4l!~~E '1::~lRVC:L5
LEGEND NUMBER OF PERSONS
• MAlE
o FEMALE
HOME ADDRESS OF ARRESTEES
CHARGED WITH DRUNKENNESS,
ARRESTED IN CENSUS TRACT AS,*
CENTRAL BALLARD
SEATTLE: 1968-1970
* NEW CENSUS TRACT NUMbER 47
POLICE CENSUS TRACT NUMBER 5
n WASHINGTON STATE-EX ALL OF KING COUNTY, , ..... 6
m OTHER STATES AND CANADA.,
ALL RESIDENCE CATEGORIES
I RESIDENTS OF SEATTLE. .• 113
n NDIlRESIDENTS... ........ 21
m RESIDENCE UNKNOWN, • • • • • . 14
4
14
14 --
304
THE SYMBOLS ON THIS MAP ARE
TWO-DIMENSIONAL (AREAL), AND VARY AS THE SQUARE-ROOT
OF THE DIAMETER.
SEE SCALE IN LEGEND
Figure 7:10
LAKE
305
persons--126 males and 22 females--were arrested for drunkenness in Tract A5.
Residents of Seattle numbered 113, nonresidents 21, and persons whose residence was unknown, 14.
Where did the 113 residents of Seattle live? The largest number--34
males and 8 females--resided in Tract A5. Contiguous tracts included 21 additional
arrestees--A3 (9), A4 (6), B4 (3) and B3 (3); and two other tracts in close proximity
added 8 more--Al (5) and A2 (3). Strangely enough six Skid Road (01) reSidents
and three from the Central Business District (M1) were arrested in Ballard for
drunkenness. There were four cases from Tract B6. Except in three instances
the remaining 26 arrestees, numbering either one or two per census tract, resided in 23 tracts located north of Yesler Way.
Residential Distribution of Arrestees Charged With
Drunkenness or With Dri.ving Under the Influence:
Rates per 100,000 of Population
This section is devoted to an analysis of the spatial distribution of arres
tees 'Jharged with drunkenness and with driving under the influence. The data per
tain only to arrestees who are residents of SeattIe, and the cases have been allocated
to the reported home addresses of arrestees. Rates have been computed for each sex on the basis of the population 18 years of age and ove.r.
Residential Distribution of Male Arre~ Charged With Drunkenness.
Figure 7:11 presents mean rates by census tracts for male arrestees charged with
drunkenness for the three-year period, 1968··1970. Again, it should be pointed out
that the unit of analysis is the arrestee, a large proportion of whom have been
arrested many times during the 1968-1970 period. The rates per 100,000 of male
population 18 years of age and over vary from 61. 8 in Tract DIl (western portion
of View Ridge) to 104,030.2 in Tract 01 (Skid Road). The anomalous rate of
104,030.2 for Tract 01 is to a considerable extent indicative of the high degree of
populatioI'i turnover in that area. Similarly, population mobility is partially account
able for the relatively high crime rates in the Central BUSiness District and contigu-14 ous areas.
14The significance of population mobility as a factor in the comparability of rates is explained more fully in the following statement. "In making comparisons of vital and social rates between various districts in urban communities, the relative stability of the population is either disregarded or only referred to inCidentally, so tr~t the unwary reader naturally infers, if at all, that .it is a negligible factor in the comparability of the data. This, of course, is a false~assumption and may lead
1
l

, , .
,.\
5"1-10 I-INES D£Ll"IT THE CENSJ5 TftACT5 ~ 5£ATTI-E
"',T P~S C[METE"IES ANO DOT ANO DASlCO ~I~~E~;~AS OF ,u'IlI-IC ".~ftTY OTH£" "ELATiVELY LA"
DASHED LlNU D£I-I .. IT INDU5TftIAl., ftAIU\OAD ANO VACANT _ftTY
HOME ADDRESS OF MALE
ARRESTEES CHARGED WITH
DRUNKENNESS
SEA TTLE: 1968-1970
LEGEND MEAN RATE PER 100,000 OF MALE POPULATION 18 YEARS AND .OVER.
~ UNDER ~ 100
", 100-~"//-I',~ li9
1~1500. =999
~IOOO
~1999
_
SOOO
AND OVER
306
Figure 7:11
LAKE
WASHINGTON
II
307
Tract Ml (Central Business District) ranks second highest with 13,060.7 <
followed by Tract L5 (8,434.3), Tract 02 (7,996.1) and Tract M2 (6,079.7). It
will be ob~rved that only three of the 24 tracts comprising the central sector of ... the city from Elliott Bay to Lake Washington have rates less than 1,000 per 100,000
of population. Thert\ is one tract north of the central sector--Tract A5, compris
ing the main business district of Ballard--that has a rate of more than 1,000
(1,496.8), and four tracts south of the central sector that are included in this cate
gory. These tracts are located in or in close proximity to industrial areas-
Georgetown, Harbor Island, Youngstown, Delridge and High Point. There are 19
tracts with rates under 200.0 per 100~ 000 of population. Most of these tracts
represent :relatively new and substantial residential areas. It will be recalled
from Chapters 4 and 5 that the reSidential distribution of male arrestees charged
with drunkenness is Similar to the spatial patterning of most index crimes.
Residential Distribution of Female Arrestees Charged With Drunkenness.
Although there a.re considerably fewer female than male arrestees charged with
drunkenness, nevertheless the basic residential distributions manifest marked
similarities (Figure 7:12). Like male arrestees, the highest rate for female
arrestees is Tract 01 (Skid Road) with a rate of 10,333.3 and Tract Ml (Central
Business District) is second highest with 7,024.3. Tract 02 (Chinatown-Jackson
Street) ranks third with 2,071.6; Tract L5 (Pike Street Market-Belltown) ranks
fourth with 1,963.5; L3 is fifth with a rate of 1,147.1; and M2 is sixth with a rate of 1,006. O.
Outside of the central segment of the city there are only two tra.',}ts with
rates in excess of 300. O--Tract SIB with 374.8 (High POint) and Tract RIA with
341. 4 (Georgetown). There are 13 tracts with no cases ~t all. Most of these tracts
are located in the northeastern section of the city. In general, there is a clear
negative correlation between the residential distribution of arrestees for drunkenness and Socioeconomic status.
-to erroneous conclusions and implications. . . . The endless shuttling of people in and out of this district would mean that in a very short interval of time the complexion of the population would have changed many times. In other words, the population enumeration as of January 1, 1920, by the United States Bureau of the Census is not nearly so representative for this section of the city as it is for the less mobile districts. Hence, in computing rates for various territorial units on a population base taken as of a given instant, the relative turnover within the period under consideration would affect the comparability of the data. "--Calvin F. Schmid, SUicides in Seattle, 1914 to 1925, Seattle: University of Washington Press, 1928, Pp. 7-9. - ---

u .
TRACTS ~ SE"'TTLE SOLID LINES OELiMIT TIf£ CENSUS ',""",5 CEMETERIES "'WI>
DOT AND DASHED LINES IX~~~ Of' "U8LIC f'ROPE"TY OTIf£R REL",TIVELY LI'RGE '" R"'ILI\O..o ....., OASt€O l,INES O£LI"'IT INOU5Y"IAL t VI'C",,"T I'fIOPItRTY
HOME ADDRESS OF FEMALE
ARRESTEES CHARGED WITH
DRUNKENNESS
SEA TTLE: 1968-1970
LEGEND MEAN RATE PER 100.000 OF FEMALE POPULATION 18 YEARS AND OVER.
o NONE ~ 299 1~200-
UNDER 2~ r.2ii21 300-,.// /~ MORE lHAN ~ 499 ,~ //. 0.0
~~OO-WI!;' ~999
fXS15('XI 100-~199
•-.1000
AND OVER
308
LAKE
WASHINGTON
Figure 7:12
309
Residential Distribution of Male Arrestees Char ed With Drivin Under
.~.l"f1uence. Figure 7:13 presents reSident male arrestees classified by race who
were charged With driving under the influence in the city of Seattle during the three
year period, 1968-1970. During this period there were 2,249. In addition to the
2,249 residenis there were 702 nonresidents and 126 whose reSidence was unknown
who were charged With driving under the influence. Figure 7:14 indicates that mean
rates per 100,000 of population 18 years of age and over of male arrestees charged
..,;th driving under the influence vary from 54.9 in Tract D6 (mainly University -.-Business District) to 1,276.1 in Tract K5 (part of a predominantly Negro commu
nity in the central sector). Tract OJ (Skid Road) ranks second highest with 1,049.5;
and Tract Jl (part of Negro community in central sector) ranks third With 1,009.2.
With comparatively few exceptions, tracts with relatively high rates--600. 0 and
over--are located in or contiguous to the central sector of the City. Tracts with
comparatively high rates outside the central sector of the city are found in or close
to industrial areas. All of these tracts rank relatively low in SOCioeconomic status
as measured by median income and median rent, and by occupational and educational
status. Tracts A5 (Ballard) and B5 (Ballard-Fremont), located in the northern sec-.
tion of the city, Tracts SIB, 04B, RIB, RIA and R4A in Delridge-Youngstown, High
POint, South Park, Georgetown and Rainier Vista areas, located in the southern
sector of the city, all have rates of 600. 0 and over. The largest clustering of low rates is to be found in reSidential areas in northeast Seattle.
Residential Distribution of Female Arrestees Charged With Driving Under
the Influence. Figures 7:15 and 7:16 show that the reSidential distribution of female
arrestees charged With driving under the influence does not conform to a clear and
consistent pattern such as indicated by the other series discussed ill this section.
However, there is some similarity between the patterns of female arrestees for
driving under the influence amd male arrestees charged with drunkenness. The
highest rate (333.3) in Figure 7:16 is found in Tract 01 (Skid Road), but there are no cases at all in Tract M1 ([Central BUSiness District).
In tracts with relati[vely large proportions of adult females, rates for
driving under the influence are not high. Automobile ownership or accessibility
to t'le use of automobiles as well as ability to drive automobiles, no doubt operates
more restrictively on femal«~s, thus a.ccounting in part for the total rate as well as
for differentials from one part of the city to another for driving under the influence.
Perhaps the relatioInship of the reSidential distribution of arrestees
charged with drunkenness and with driving under the influence can be summarized
)1

:.,
GENERALIZED LAND-USE TYPES
t;R;.';"~) lNOUSTRI.AL. ANO RAIL.RO"O PROIlERTY
f7777.1 CEMETERIES, PARKS ANO OTHER REL"TIV[LY ~ LARGE TRACTS Of PUBLIC PROPERTY
1:::;;) VACANT PROPERTY
CONCENTRIC CIRCLES OR~WN. FROM POINT I)f HIGHEST LANO VALUE AT ONE-MILE INTERVALe.
LEGEND
EACH SYMBOL REPRESENTS ONE PERSON
o WHITE
;, NEGRO
o OTHER
HOME ADDRESS OF MALE ARRESTEES CHARGED WITH
DRIVING UNDER THE INfLUENCE t',
SEATTLE: 1968-1970 * TERM USED IN UNIFORM CRIME REPORTING.
DRIVING OR OPERATING ANY VEHICLE OR
COMMON CARRIER WHILE DRUNK OR UNDER
THE INFLUENCE OF LIQUOR OR NARCOTICS.
SUMMARY DISTRIBUTION OF ARRESTEES BY RESIDENCE STATUS
SEATTLE'1968-1970·\I-
RESIDENCE STATUS
NON - RESIDENTS
I KING CDUNTY- EX. SEATTLE ..
II. WASHINGTON STATE-EX. ALL OF KING COUNTY ..... ..
!II OTHER STATES AND CANADA ••
ALL RESIDENCE CATEGORIES
NUMBER
500 I 159
38
I. RESIDENTS OF SEATTLE .... 2,249
II.NONRESIDENTS ..... ....... 702
I m RES~~WN....... 126
*only OIflisldlnts," of Sialfle Included on thiS map
310
Figure 7:13
LAKE
'1'
.. ~ .
.... :.:,. ,.
'r '/ ':"1.
"1 ] 'I I I
,I ) ;:.:{
'.-'1' , ~
" c,
·~.;fi "
11 ,,"
,;~ \'
i)
SOLID LINES DELIMIT THE CENSUS T"ACTS Of' SEATTLE
DOT AND DASHED LIN£S DELIMIT , OTHE" "ELATIYELY LA."GE .... IP ... S Ml\S. C[WETE"I[S AND
-~ Of' 'UBLIC PROI'£RTV DASHED LIN£S DELIMIT IHDUST"IAL, "Alu.oAO AND VACANT ~TV
HOME ADDRESS OF MALE ARRESTEES CHARGED WITH
DRIVING UNDER THE INFLUENCE
SEA TTLE: 1968-1970
LEGEND MEAN RATE PER 100,000 OF MALE POPULATION 18 YEARS AND OVER.
~VNDER ~ 100
"' .. <'.JA 300-(~~~ 399
fX.X5O?l 400· ~499
I~~OO. = ~99
~600· ~699
~1'00-~999 _
IODO AND OVER
311
Figure 7:14
LAKE
WASHINGTON
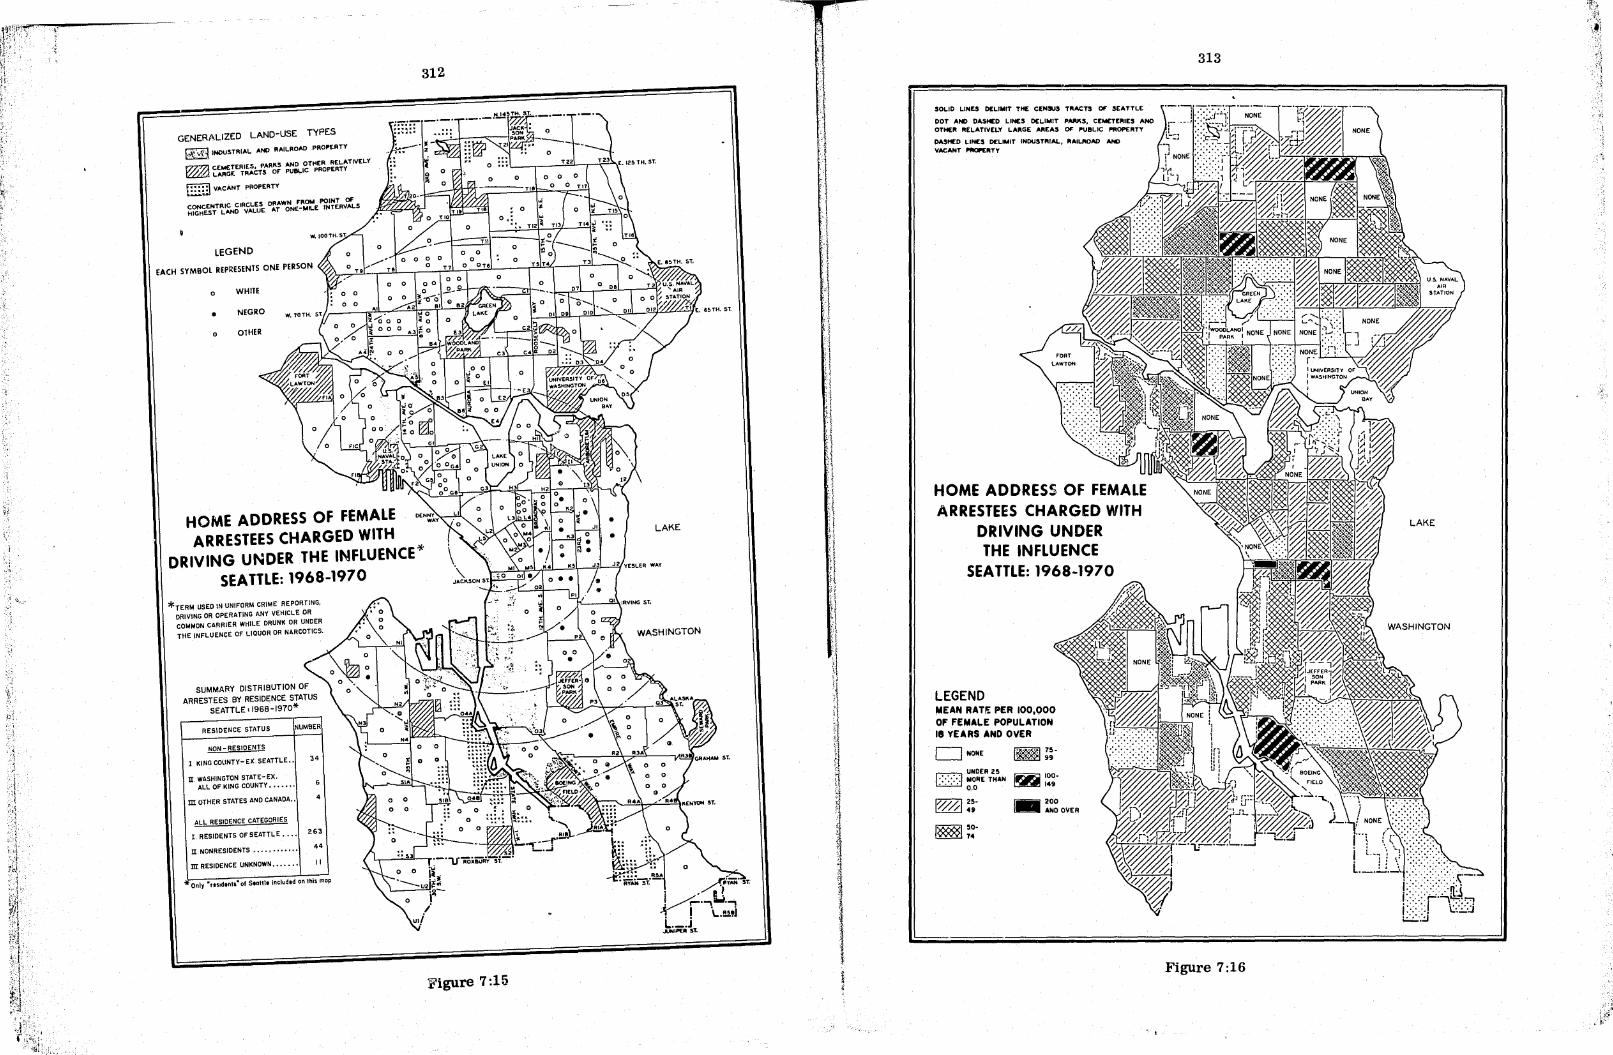
~; ).
GENERALIZED LAND-USE TYPES
['&:.1':"1 INDUSTRIAL AND RAILROAD PROP'ERTY
m'7.l CEMETERIES. PARI\S AND OTHER RELATIVEL.Y ~ LARGE TRACTS or p\J8l.IC PROPERTY
tIUTI1 VACANT PROPERTY
CONcENTRIC CIRCLES DRAWN FROM pOINT Of HIGHEST L.AND V.ALUE AT aHE-MtLE INTERVALS
LEGEND
312
o 0 o
Til
EACH SYMBOL REPRESENTS ONE PERSON o a a a
o T1 a aTe
o WHITE
• NEGRO
o OTHER
o
o
o a a a .0 -9-.., a ~-CS-o' "
0\2 81 82
HOME ADDRESS OF FEMALE ARRESTEES CHARGED WITH
DRIVING UNDER THE INFLUENCE* SEATTLE: 1968-1970
*TERM USED IN UNIFORM CRIME REPORTING. DRIVING OR OPERATING ANY VEHICLE OR COMMON CARRIER WHILE DRUNK OR UNDER
TIlE INFLUENCE OF LIQUOR OR NARCOTICS.
SUMMARY DISTRIBUTION OF ARRESTEE:'> BY RESIDENCE STATUS
SEATTLE 11968-1970*
RESIDENCE STATUS NUMBER
NON - RESIDENTS
KING COliNTY- EX. SEATTLE.. "54
n WASHINGTON STATE-EX. ALL OF KING COUNTY....... 6
m OTHER STATES AND CANADA.. 4
ALL RESIDENCE CATEGORIES
I. RESIDENTS OF SEATTLE •••• 263
n NONRESiDENTS............ 44
m RESIDENCE UNKNOWN....... I I
only -"sld,ntsM of Seottl. included on this mop
Figure 7:15
W"
o : ••• .......
LAKE
WASHINGTON
' .... ...... A!lA
·rv ...... -;i:·- ~f;;;.· Sf.
i -! ! Vr·~iW.~ . ! L.!!!!j L._.J
..IJNIPEIi 5T.
.::
SOLID LINES DELIMIT TH£ CENSJS T"ACTS C6' SEATTLE
DOT AND DASHED LINES DELIMIT PIW\ antE" RELATIVELY L"'"GE ...... EAS OF' ~B~I~ME~~:T~ DASHED LINES DELIMIT INDUSTIIIAL. RAILIIOAD AND VACANT _IITV
HOME ADDRESS OF FEMALE ARRESTEES CHARGED WITH
DRIVING UNDER THE INFLUENCE
SEATTLE: 1968-1970
LEGEND MEAN RAT!':: PER 100 000 OF FEMALE POPULATION 18 YEARS AND OVER
o NONE ~75-~99
~ UNDER 25 ~ MORE THAN ~ 100-
0.0 ~ 149
I~~I!;
I~I~~-
_
200 AND OVER
313
LAKE
WASHINGTON
Figure 7:16
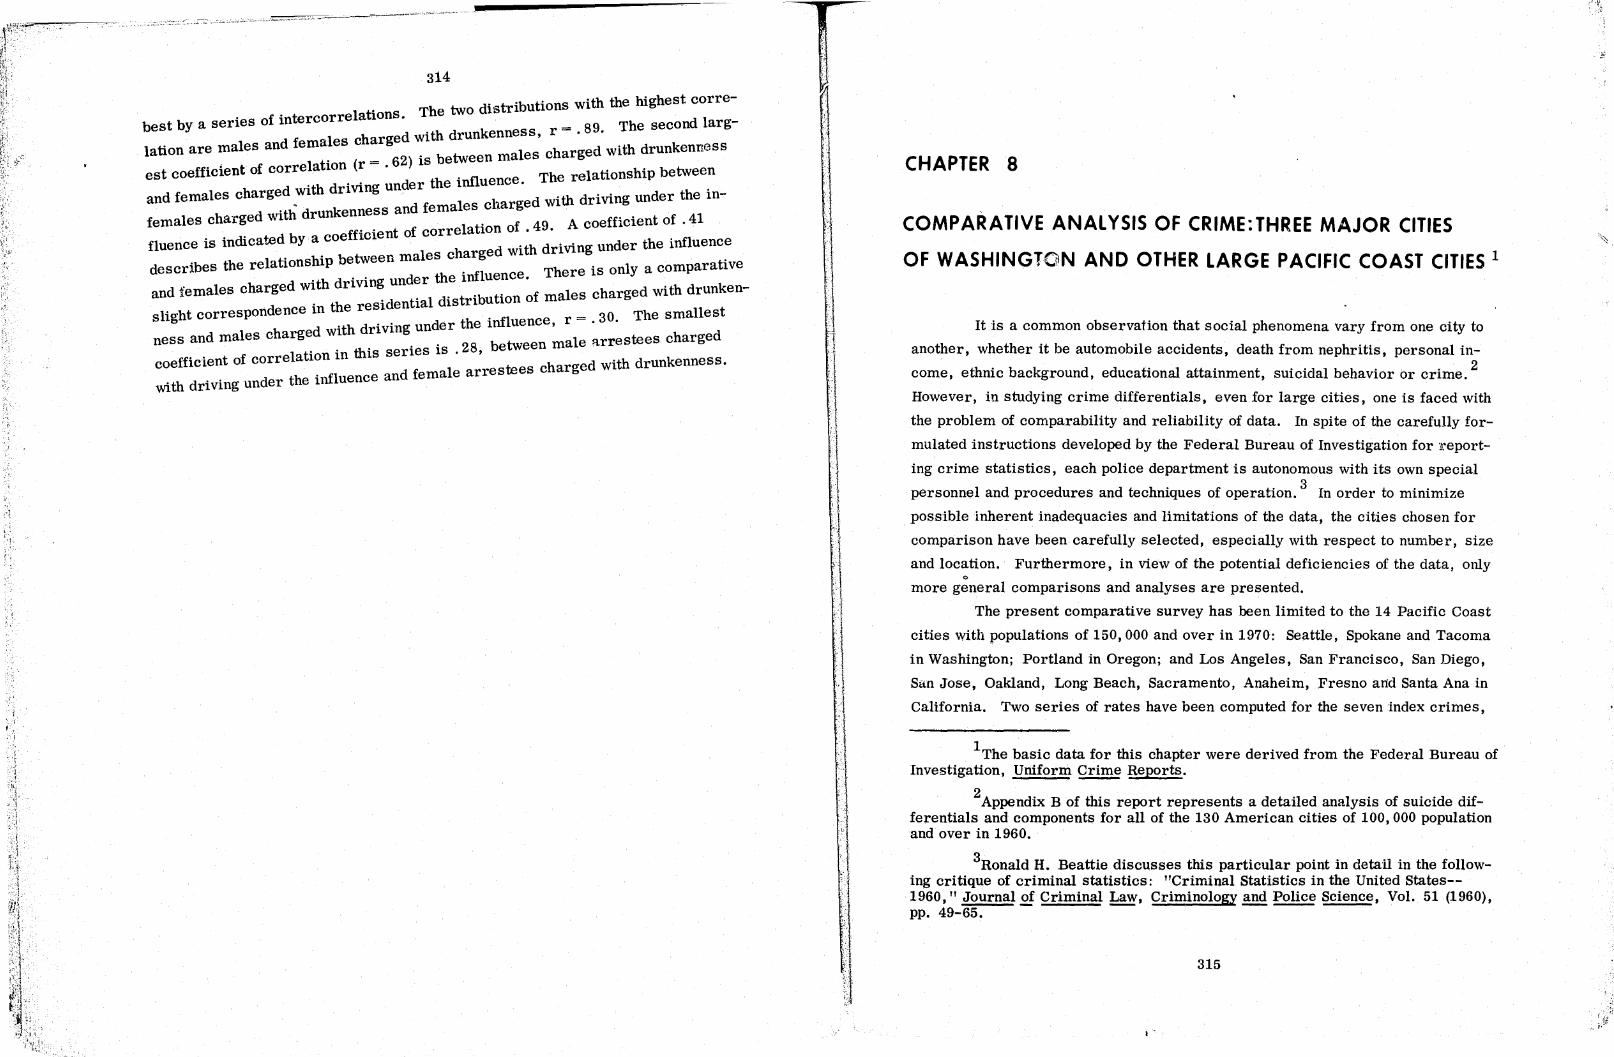
'';'
'i;
----.. ,,--~.~---- -- ..... -------------
314
best by a series of intercorrelations. The two distributions with the highest corre
r = .89. The second larg-I charged with drunkenness,
lation are males and fema es I charged with drunkenness . 0 (r = 62) is between rna es
est coefficient of correlation. 0 The relationship between o d °vin under the mfluence.
and females charged wlth rl g , h d with driving under the in-o 'd nkenness and females c arge
females charged wIth ru I to f 49 A coefficient of . 41 o t b coefficient of corre a lon o. .
fluence is indicated Y a doth driving under the influence o h· between males charge Wl
describes the relatlOns Ip 0 There is only a comparative o d 0 0 under the Influence.
and females charged wlth rlvmg 0 0 to f males charged with drunken-o th esidential dlstrlbu 10n 0
slight correspondence mer 0nfl r = 30. The smallest ith driving under the 1 uence, .
ness and males charged woo 28 b tween male Rrrestees charged I to On this serles IS 0 , e
coefficient of corre a lOn 1 te charged with drunkenness. o -~l nd female arres es
with driving under the llu uence a
/1 1 :~l !
',I ,.
I . ~
oj
J ,I
:1 I
-,1 '1 , , i
I 'I
J J "I
J :1 ,) , .. j ~.·~.:l·· -~-~
CHAPTER 8
COMPARATIVE ANALYSIS OF CRIME: THREE MAJOR CITIES
OF WASHINGTON AND OTHER LARGE PACIFIC COAST CITIES 1
It is a common observation that social phenomena vary from one city t.o
another, whether it be automobile accidents, death from nephritis, personal in
come, ethnic background, educational attainment, suicidal behavior or crime. 2
However, in studying crime differentials, even for large cities, one is faced with
the problem of comparability and reliability of data. In spite of the carefully for
mulated instructions developed by the Federal Bureau of Investigation for ~\eport
ing crime statistics, each police department is autonomous with its own special
personnel and procedures and techniques of operation. 3 In order to minimize
possible inherent inadequacies and limitations of the data, the cities chosen for
comparison have been carefully selected, especially with respect to number, size
and location. Furthermore, in view of the potential deficiencies of the data, only " more general comparisons and analyses are presented.
The present comparative survey has been limited to the 14 Pacific Coast
cities with populations of 150,000 and over in 1970: Seattle, Spokane and Tacoma
in Washington; Portland in Oregon; and Los Angeles, San Francisco, San Diego,
San Jose, Oakland, Long Beach, Sacramento, Anaheim, Fresno at1d Santa Ana in
California. Two series of rates have been computed for the seven index crimes,
1The basic data for this chapter were derived from the Federal Bureau of Investigation, Uniform Crime Reports.
2 Appendix B of this report represents a detailed analYSis of suicide differentials and components for all of the 130 American cities of 100,000 population and over in 1960.
3Ronald H. Beattie discusses this particular point in detail in the following critique of criminal statistics: "Criminal Statistics in the United States--1960," Journal of Criminal Law, Criminology and Police Science, Vol. 51 (1960), pp. 49-65.
315
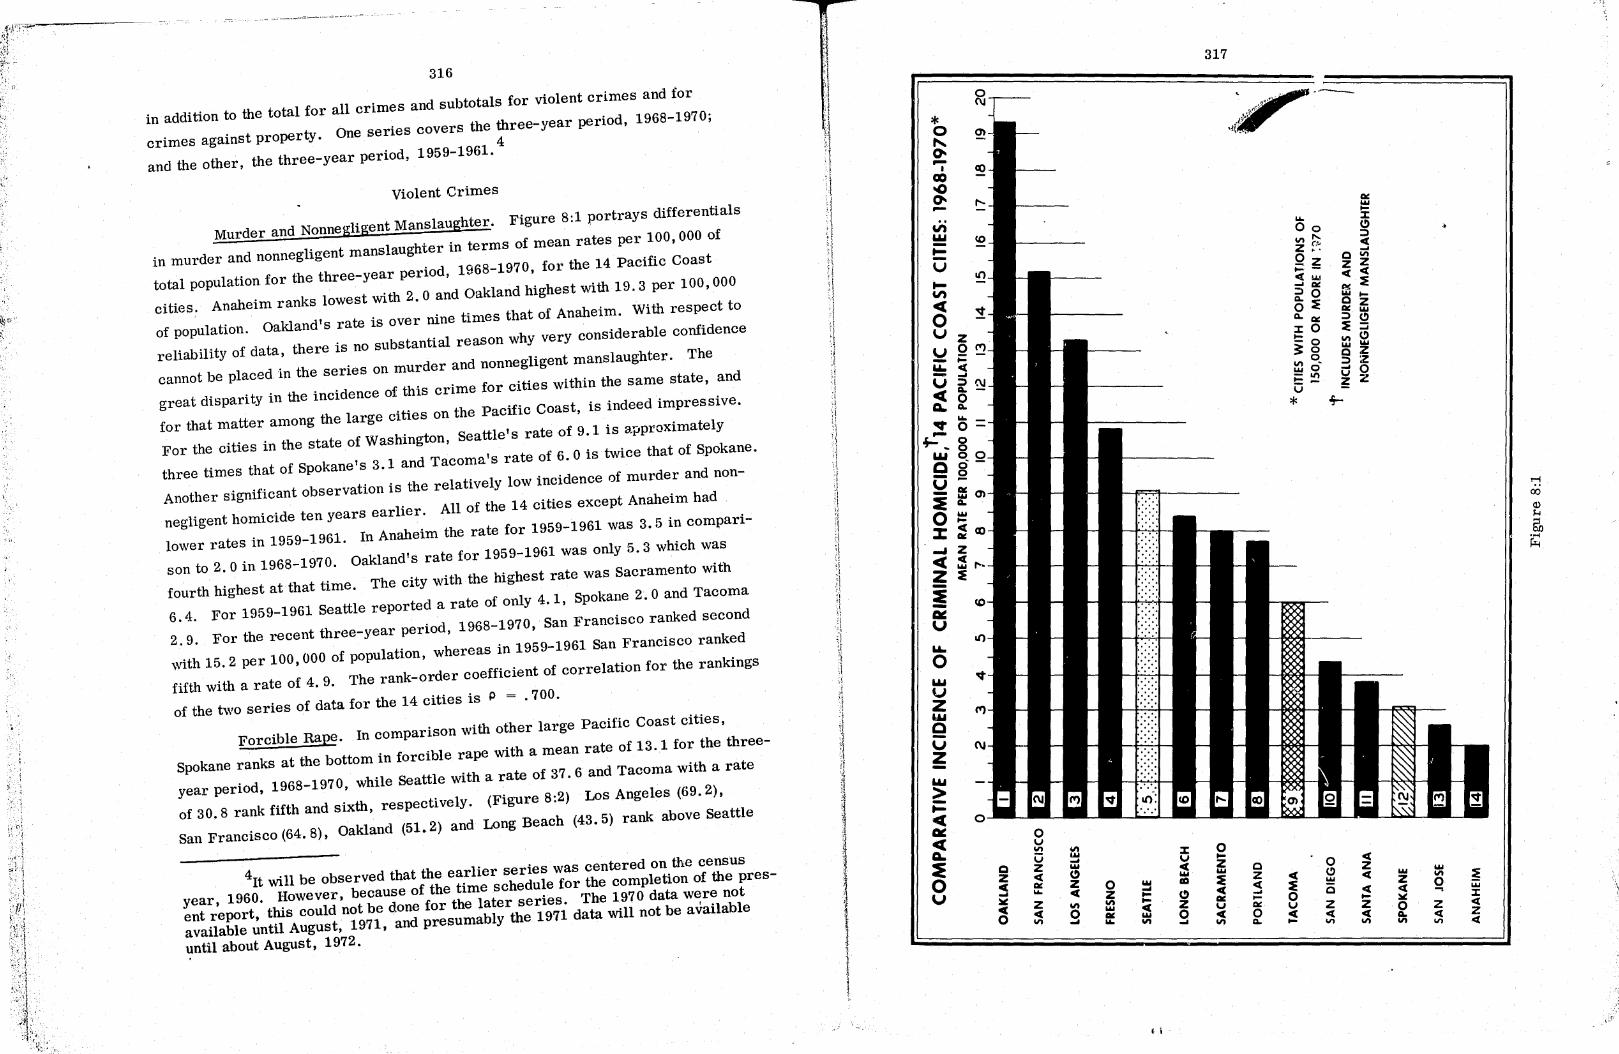
f,lt~~·
~~~)l ~~.-:( , (I
.,'
.. ' (
316
in addition to the total for all crimes and subtotals for violent crimes and for
crimes against property. One series covers the three-year period, 1968-1970;
and the other, the three-year period, 1959-1961. 4
Violent Crimes
Murder and Nonnegligent Manslaughter. Figure 8:1 portrays differentials
in murder and nonnegligent manslaughter in terms of mean rates per 100,000 of
total population for the three-year period, 1968-1970, for the 14 Pacific Coast
cities. Anaheim ranks lowest with 2. ° and Oakland highest with 19.3 per 100,000
of population. Oakland's rate is over nine tImes that of Anaheim. With respect to
reliability of data, there is no substantial reason why very considerable confidence
cannot be placed in the series on murder and nonnegligent manslaughter. The
great disparity in the incidence of this crime for cities within the same state, and
for that matter among the large cities on the Pacific Coast, is indeed impressive.
For the cities in the state of Washington, Seattle's rate of 9.1 is approximately
three times that of Spokane's 3.1 and Tacoma's rate of 6.0 is twice that of Spokane.
Another significant observation is the relatively low incidence of murder and non
negligent homicide ten years earlier. All of the 14 cities except Anaheim had
lower rates in 1959-1961. In Anaheim the rate for 1959-1961 was 3.5 in compari
son to 2.0 in 1968-1970. Oakland's rate for 1959-1961 was only 5.3 which was
fourth highest at that time. The city with the highest rate was Sacramento with
6.4. For 1959-1961 Seattle reported a rate of only 4.1, Spokane 2.0 and Tacoma
2.9. For the recent three-year period, 1968-1970, San Francisco ranked second
with 15.2 per 100,000 of population, whereas in 1959-1961 San Francisco ranked
fifth with a rate of 4. 9. The rank-order coefficient of correlation for the rankings
of the two series of data for the 14 cities is P = .700.
Forcible RaEe. In comparison with other large Pacific Coast cities,
Spokane ranks at the bottom in forcible rape with a mean rate of 13.1 for the three
year period, 1968-1970, while Seattle with a rate of 37.6 and Tacoma with a rate
of 30.8 rank fifth and sixth, respectively. (Figure 8:2) Los Angeles (69.2),
San Francisco (64. 8), Oakland (51. 2) and Long Beach (43.5) rank above Seattle
4U will be observed that the earlier series was centered on the censuS year, 1960. However, because of the time schedule for the completion of the present report, this could not be d.one for the later series. The 197 ° data were not available until August, 1971, and presumably the 1971 data will not be available
~ntil about August, 1972.
* o '" 0--I CIO 0() 0--
..... o IoU U Z w e u z -
Q Z ~ ~
~ c o z ~ en
VI ~ ~ ~
~ Z ~ en 0 ...
317
.----
l: 0 v .... ~ z ~
~ ~ c 0 Z
0 ~ IG ~ Z ~ (!) ~ ~
~
~ ~ ~ ~ Z
en ~ Z .... ~ ~ ... c ~ Q en .... at: .... 0
~ ~
~ ~ z V at: .... ~ :I:
at: ~ 0 ~ 0 v Z Z 0 Z ~
Yo VI ~ < ~
~ en 0.. .... 0.. ~ Z en en en en <t
{ I

. "i
. , , I . ,
,_11r:':'--~~--
:~f'; J>I,I
l'r" \l{(
1I~ , ., t~':},·, ' '.'" "
~
* 0
'" 0--I CO ..0 0--.. Con W -... -U ... Con <t 0 u ~ !::!: u <t ~
A- 0
• -, w A-<t ~
w ~
CO --U ~
0 "'-
u.. 0 w U ..... " w e u z -w ~ ... <t ~ <t A-~ 0 U
318
0 u
:I: VI !!! w U v ... 0 < .... Z 0 < Z .... C) < Z ca .... ~ < Z QI: < ... ... ~ C) ~ 0 < ...
~ .... ~ Z V QI: VI Z C C C 0 0 c:( 0 .... 0 VI ~ ~ ... VI ...
~
0 0 VI "-0-Z -0 ~ ~ < W ... QI: ::l 0 ~
~ 0 ~ QI:
:I: 0 !::: 0 3 0 VI O. w 0 ~ VI
U
*
0 < ~
0 Z w Z C) < .... VI ~ !:!:! 0 0 -. < < Z 0
~ ell: VI Z Z Z v .... < 4 < C QI:
VI VI VI Y. VI
~ W ~
~ .-< :I: ~ < 0 Z ~ < VI
319
and Tacoma. There are three cities that rep,orted rates under 20. O--San Diego (18.2), Anaheim (17.6) and Spokane (13.1).
For ~;b.e earlier Series of data covering the three-year period, 1959-1961,
Los Angeles again held top position with a rate of 44. 3, but Long Beach rather than
San Franciso was in second place with 27.3 and Oakland was third with 16.7.
Tacoma (12.6) ranked SLXth, Seattle (11. 8) seventh and Spokane (5.0) fourteenth.
The rank-order relationship between the 1959-1961 and 1968-1970 series for forc
ible rape was p = . 856--the highest of any of the ten series.
Robberv. Among the seven index crimes, none of the three citieB 0:; tlle
state of Washington holds either first or second place. However i Seattle holds
third place for robbery and for burglary. San Francisco (870.7) and Oakland
(721.1) rank above Seattle (429.5) in robbery. (These cities also rank above
Seattle in burglary. ) Los Angeles (425.3) ranks fourth, Portland (352.7), fifth
and Long Beach (287.8), sixth. Tacoma (165.6) is in ninth place and Spokane (90.9) - Is in thirteenth place. (Figure 8:3)
For the earlier three-year period, 1959-1961, Seattle was ill eighth place
. 0, Tacoma was in eleventh place with 44.2 and Spokane was in fourteenth
place with 29.7. Los Angeles was in first place with 217.4, San Francisco second
with 199.1, Sacramento third with 175. 0 and Long Beach fourth "ith 150.3. In
comparison with the incidence of crime for the 1968-1970 period, a rate of 217.4
would have been lower than seventh place. The lowest rate for the earlier series
was 29.7 (Spokane) and the corresponding rate for the later series was 89.1 (San "
Jose). Again, these facts as well as many others in the, two series reflect the un-
precedented increase in crime during the decade of the:. 60's.
A comparison of rank-order of the 14 cities for' ~bery in 1959-1961 and 19G8-1970 is indicated by a P of. 769.
Aggravated Assault. It \\ill be observed from Fig1lr 8:4 that rates for
aggravated assault vary from a minimum of 60.0 for Spokane to a maximum of
513.7 for Los Angeles. San Francisco \\ith 404.4 is second, Oakland (287.4) is
third, Tacoma (229. 0) fourth, Portland (201. 7) fifth and Seattle (178.2) sixth .
Rates for aggravated assault for the earlier period, 1959-1961, varied
from a minimum of 16. 9 (Tacoma) to a maximum of 298.8 (Los Angeles). For
both periods, Los Angeles, San FranCisco and Oakland held the same three top
rankings, but as indicated, Tacoma shifted fro111 last place in 1959-1961 to fourth
place in 1968-1970. Spokane ranked thirteenth (18.9) in 1959-1961 and fourteenth
(60.0) in 1968-1970. The coefficient of correlation between the rankings for the
' ....

~
""! . .;!~
,0
COMPARATIV.E INCIDENCE OF
SAN FRANCISCO
OAKLAND
SEATtlE
LOS ANGELES
PORTlAND
LONG BEACH
SACRAMENTO
FRESNO
TACOMA
SANTA ANA
ANAHEIM
SAN DIEGO
P '''b .'>~ '",0'" t ''\' ,>- "'. '0, ,"«'-::::'
ROBBERY I 14 PACIFIC COAST CITIES: 1968-1970* MEAN RATE PER 100,000 OF POfJULATION
300 400 500 600
*CITIES WITH POPULATiONS OF
150,000 OR MORE IN 1970
;,~, :/~:":;R("
I SPOKANE t::::::: I SAN JOSE ~
Figure 8:3
~,-l,l'
~ ~ o
"~~"'~,,, '·',_,.c," ",j" C. __ ,~-''"' -- 0--- ,-,,=:--" "'" '''-, '1
COMPARATIVE INCIDENCE OF AGGRAVATED ASSAULT, 14 PACIFIC COAST CITIES: 1968-1970* MEAN RATE PER 100,000 OF POPULATION
LOS ANGElES
SAN FRANCISCO
OAKLAND
TACOMA
PORTLAND
SEATTLE
LONG BEACH
SACRAMENTO
SANTA ANA
SAN JOSE
SAN DIEGO
FRESNO
ANAHEIM
SPOKANE
200 ;::u:;,() 300
Figure 8:4
*ClTIES WITH POPULATIONS OF 150,000 OR MORE IN 1970
~ t-:l ~
i'
Ij
" i ;
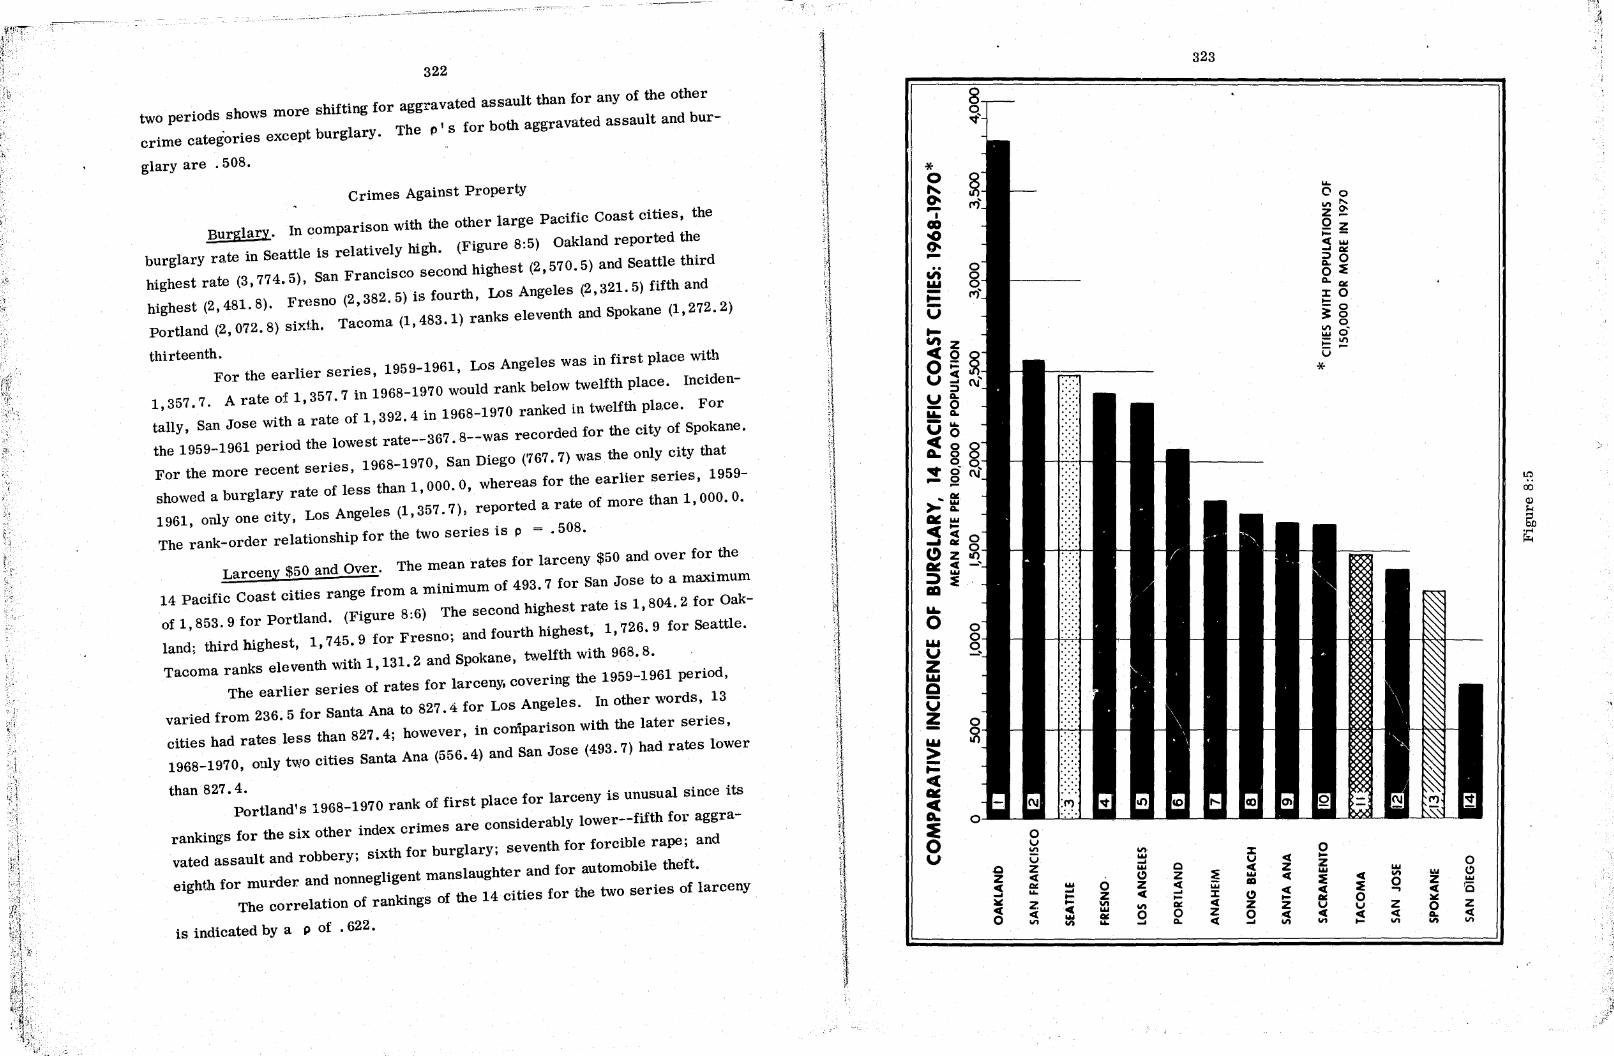
,.'
.-.------
322
two periods shows more shifting for aggravated assault than for any of the other
crime categories except burglary. The p' s for both aggravated assault and bur-
glary are .508.
Crimes Against Property
Burglary. In comparison with the other large Pacific Coast cities, the
burglary rate in Seattle is relatively high. (Figure 8:5) Oakland reported the
highest rate (3,774.5), San Francisco second highest (2,570.5) and Seattle third
highest (2,481. 8). Fresno (2,382.5) is fourth, Los Angeles (2,321. 5) fifth and
Portland (2, 072. 8) sixth. Tacoma (1,483. 1) ranks eleventh and Spokane (1,272.2)
thirteenth. For the earlier series, 1959-1961, Los Angeles was in first place with
1,357.7
. A rate o:f 1,357. 7 in 1968-1970 would rank below twelfth place. Inciden
tally, San Jose with a rate of 1,392.4 in 1968-1970 ranked in twelfth place. For
the 1959-1961 period the lowest rate--367. 8--was recorded for the city of Spokane.
For the more recent series, 1968-1970, San Diego (767.7) was the only city that
showed a burglary rate of less than 1,000.0, whereas for the earlier series, 1959-
1961, only one city, Los Angeles (1,357.7), reported a rate of more than 1,000. o. The rank-order relationship for the two series is p = .508.
Larceny $50 and Over. The mean rates for larceny $50 and over for the
14 Pacific Coast citi.es range from a minimum of 493.7 for San Jose to a maximum
of 1,853.9 for Portland. (Figure 8:6) The second highest rate is 1,804.2 for Oak
land; third highest, 1,745.9 for Fresno; and fourth highest, 1,726.9 for Seattle.
Tacoma ranks eleventh with 1,131. 2 and Spokane, twelfth with 96B. 8.
The earlier series of rates for larceny, covering the 1959-1961 period,
varied from 236.5 for Santa Ana to 827.4 for Los Angeles. In other words, 13
cities had rates less than 827.4; however, in comparison with the later series,
1968-1970, ouly two cities Santa Ana (556.4) and San Jose (493.7) had rates lower
than 827.4. Portland's 1968-1970 rank of first place for larceny is unusual since its
rankings for the six other index crimes are considerably lower--fifth for aggra
vated assault and robbery; sixth for burglary; seventh for forcible rape; and
eighth for murder and nonnegligent manslaughter and for automobile theft.
The correlation of rankings of the 14 cities for the two series of larceny
is indicated by a p of . 622.
I ,
'" V Z '" C -V ~
'" > t= C ~ C a.. ~ o V
o z S ~ ~ o
z. ~ VI
VI· w .... w C) Z ~ VI 0 ....
C Z ~ .... ~ Ill: 0 Q.
323
Z U ~
~ w II) w z C)
~ Z z ~
0 ....
~ Z ~
~ ~ z ~ VI
u. 00 VI" z~ Qz ~ -~w .... 1lI: :;)0 o~ Q.(lI:
zO ~ -0 ~o VI 0, wO - lI'I ~U
*
0 ~
Z w ~ ~ Ill: u ~ ,It
-f\~,
iA .J
'\
w 0 ~ VI 1.1.1 <.!)
~ 0 z ..., ..., ~
,-0
C
u Z ~
~ ~ 0 z Q. ~
~ VI 11'1 VI

* o "-0--I
CO -0 0--
u. o "'" U Z "'" 9 u z -
0 z « .... .... a: 0 ~
Q z 0 ..... ~ .... Z .... !Ie: VI ..,.
loW ~ e ~ loW 0 "" VI
324
0 :I: \Ii .... 0 v .....
z e .... CI loW
..... ~ .....
~ CI :i loW z ~ -< c CI ::t e ~ z e v z z
0 VI z « e 0 e
VI .... e VI VI ....
"" 00 VI'" ..... z5!: ;::, .... Qz e .... - > e .....
~ .... ~ ;::'0
a: ~:i ..... > A.~ 0 ::to
!::o Q
~ 0 Z 0 e
VI -0 ",0 - .,., .,.,
!:: -v ~
* ~
e Z ..... e e Z :i e e
0 :.: .... 0 Z v
:! 5; e VI
'" VI o ..,
325
Automobile Theft. Figure 8,7 clearly portrays the pronounced variation in rates for automobile theft among the 14 Pacific Coast cities. For example, the
rate in San Francisco (2,155.2) is over fi"" times as high as it is in Spokane (392.5).
Seattle, with a rate of 889.1 is in fifth place, and Tacoma with a rate of 581.4 is in
tenth place. Oakland with I, 450. 3 ranks next highes t to San FranciSco, followed in rank-order by Los Angeles (1,159.7) and Fresno (1,095.4).
For the three-year period, 1959-1961, San Francisco also ranked in first place with a rate of 684. 4, but Sacramento (617. 6) ranked second, Los Angeles
(570.3) third, Long Beach (546.9) fourth and Fresno (507.5) fifth. Seattle (394.3) I
ranked seventh, Tacoma (204.8) thirteer,th and Spokane (168.9) fourteenth. The re
lationship in the rankings for the 1959-1961 and 1968-1970 series is indicated by a P of. 741.
Violent Crimes Combined, Crimes Against Property Combined,
and AU Index Crimes Combined
Violent Crimes. It will be recalled that the category "violent crimes"
represents a subtotal of four index crimes comprising murder and nonnegligent
manslaughter, forcible rape, robbery and aggravated assault. Comparative data
for this category are presented in Figure 8,8. The rates vary from 167.1 for Spo
kane to 1,355.2 for San Francisco-_a differential ratio of OYer 8,1. Oakland ranks
second with 1,078.9, Los Angeles third with 1,021.5, Seattle fourth with 654.4 and
Portland fifth with 592.5. Tacoma ranks seventh with a mean rate of 431.5.
For the earlier series of data--1959-1961-_the lowest rate is 55.6 for
Spokane and the highest rate is 566.6 for Los Angeles--a differential ratio of 1,),1.
San FranCisco (392.7) ranked second, Oakland (284.8) third, Long Beach (283.5)
fourtll and Sacramento (253.4) fiftll. Seattle (122.2) ranked nintll, Tacoma (76.6)
twelfth and Spokane (55.6) fourteenth. The comparative rankings for tlle two series is indicated by a P of .798.
Crimes Against Propertr. Crimes against property represents another
subtotal conSisting of burglary, larceny over $50 and automobile tbeft. Compara
tive statistics for this category are portrayed in Figure 8,9. The mean rates for
tllis series range from 2,546. 6 for San Jose to 7, 029. 9 for Oakland. San FranCisco
(6, 004. 7) is second, Fres no (5, 223. 8) tllird and Seattle (5, 097. 8) fourth. Tacoma (3,195.7) is in tenth place and Spokane (2,633.6) is in twelfth place.
Comparable data for the three-year period, 1959-1961, vary from 782.6
for Spokane to 2,755.4 for Los Angeles. Sacramento (2,276.3) ranks second,

<"
-.... ~.:~-.,,'.:>;. " .. ~-'.-j...' :-'..-:
COMPARATIVE INCIDENCE OF
SAN FRANCISCO
OAKLAND
LOS ANGELES
FRESNO
SEl\TTLE
SACRAMENTO
LONG BEACH
PORTLAND
SAN JOSE
TACOMA
SAN DIEGO
SANTA ANA
ANAHEIM
SPOKANE
"> .. "'-'0' .,":"
AUTO THEFT,. 14 PACIFIC COAST CITIES: 1968-1970* MEAN RATE PER 100,000 OF POPyLATI9~, 800 1.000 1.200 1.400
Figure 8:7
* CITIES WITH POPULATIONS OF 150,000 OR MORE IN 1970
...... :.,~
c,., t-:l 0')
.~.>, __ ._ ............ ~'(~~.~~~.~*'"''r,..:~.-') .. , .... l>.;..~''''~~':'''-..-~~ ........... ~~~,.."...~~iW\t.~~"";.j;~.1.,U"..:...~~.-~~~~.....,.,;.'""------
COMPARA TlVE INCIDENCE OF VIOLENT CRIMES t, 14 PACIFIC COAST CITIES: 1968-1970* MEAN RATE PER 100.000 OF POPULATION
SAN FRANCISCO
OAKLAND
LOS ANGELES
SE'ATTLE
PORTLAND
LONG BEACH
TACOMA
SA~~AMENTO
FRESNO
SANTA ANA
SAN DIEGO
SAN JOSE
ANAHEIM
500 , 600 , 700 , 800 , 900
* CITIES WITH POPULATIONS OF 150,000 OR MORE IN 1970
t TOTAL VIOLENT CRIMES INCLUDE MURDER AND NONNEGLIGENT MANSLAUGHTER, FORCIBLE RAPE, ROBBERY AND AGGRAVATED ASSAULT.
II II SPOKANE
~~~~~~~~~~~~~~~~~~~~~~~~~~~~~~~~~~~~~~~~~~~II
Figure 8:8
"
c,., t-:l -::J
~ '" ,'".
\ ~

' . .
" "
* o (" ~ -I CO 00() ~ -V) i.I.& -.... -V .... V)
« o v ~ "'-Z -Q v .... «< Q.:) ~c..
-2 +- - ~ >-0 .... 0 0:=0 w o. Q.o OS! 0:= a.: Q.~ .... ~ V)< za.: -z «< e>i « V) w
~ 0:= V
"'-o w V Z w C -v ~ w > -to-« C¥ « A. ~ o v
0 z < .... ~ c 0
328
0 0 v
'" !!! .... w Z V ....
Z w 0 w C) z ~ < z < a.: 0 w < .... < .... ... z .... .... a.: • v '" '" a.: Z
0 < w 9 < a.: w
'" '" ~ '" c..
~ < 0 v Z C) < w w ~ < < z w ca W ~ < 0 < C) ~ 0 .... ~ z < Z 0 Z v
< Z < < c.. 0 '" '" < t- '" ....
w
'" 0 ~
z < '"
329
Long Beach (2, l'T8. 7) third, Fresno (1,964.0) fourth and San Francisco (1,866.5) . fifth. Seattle (1,622.1) is in eighth place, Tacoma (1, 042. 7) is in thirteenth place
and Spokane (782.6) is in fourteenth place. A comparison of the earlier (1959-1961) and later (1968-1970) series is summarized by a P of .582.
All Index Crimes Combined. Figure 8:10 presents graphically a compari
son of rates for all of the seven index crimes combined for the three-year period,
1968-1970. Oakland with a mean rate of 8,107.9 is in first place followed in ran1\:
order by San Francisco (7,359.9), Los Angeles (6,024.6), Seattle (4, 752. 2) and
Fresno (5, 555. 6). Tacoma (3,627.2) is in tenth place and Spokane (2,800.7) is in thirteenth place. San Jose shows the lowest rate with 2,790.2.
For the earlier series, 1959-1961, Los Angeles (3, 322.0) was in first
place and Spokane (838.3) was in fourteenth place. Sacramento (2,529.7) was sec
ond, Long Beach (2,462.2) third, San Francisco (2,259.2) fourth and Fresno
(2,137.0) fifth. Oakland (1,843.7) which ranked first for the recent period 1968-
1970, was in sixth place for 1959-1961. For the earlier period Seattle ranked
eighth and Tacoma thirteenth, respectively. The relationship between the rankings for the two series is fairly substantial, with a p of .758.
Summary and Conclusions. Perhaps the ten series of comparative crime
data for the 14 large Pacific Coast cities can be summarized best by a tabulation
of rankings for both the earlier and later periods. (Table 8: I) Oakland indicates
the highest mean ranking (2. 0) for the seven index crimes for the three-year period,
1968-1970; San FranciscD (2.7) is second; Los Angeles (3.1) third; Seattle (4.4)
fourth and Portland (5.7) fifth. Spokane with 13. 0 has the lowest mean ranking and,
of course, is in .fourteenth place while Tacoma with a mean ranking of 8.7 is in
ninth place. As might be expected, the rank-order based on mean rankings is very
similar to the rankings for the series of rates for all index crimes combined. The
rank-order for the top four cities--Oakland, San Francisco, Los Angeles and
Seattle--is identical; but for the remaining' cities there are several discrepancies.
It would be unwarranted to assume that one of these measures is necessarily superior to the other.
Perhaps among the most significant facts in Table 8: I are the differences
as well as similarities in ranking between the later and earlier series. For the
1959-1961 series, Los Angeles is in first place with a mean ranking of 1. 5, fol
lowed by Sacramento (3.3), San Francisco (4.3), Long Beach (4.4), Oakland (5.9)
and Fresno (6.3). Seattle and Anaheim, with mean rankings of 8.0, are tied for
seventh place. It will be observed that Oakland moved from f.ifth place in 1959-1961

;',
330
331
* 01.-0 w
1-> '" w~O a-
~e(0 - I- e(IIIZ I
Z OI.llle( ClO
..... W W we( -0.. 0 0 0C) -' 0 0 . ,..." ::J::i !!!Wl/'lt;:
a-lii ~ d~ Z UI-vtw -
01. e( )- ~. Q ~ ~Z o>zl-Col)
I-IoU III Z ..... e(WW
LoU e( 01. wO 01. U ... ~ 0 ~Z - C) 01. iO
-B5C)e(0
~
~ ~ Ci o -
Xe(-'~ u
0 U z ~ 01. Xe( C) -)-'0 ~
~ 0 W ::J)-OI.I-001. c.1~S::J
Col)
!:: 0 zw -'W e( <l
=: 0 -0 1II 1lD C) 0 -,01. ZIlDOI.0 0
III 0' e(::J e(O::J Z W 1/'1 O~ :E0I.1lDe( U
E U I-~
* ~ .. -u <l ~
~ -r~ V) LoU
~ C¥ U
><
TABLE 8:I
Comparison of Rankings of Rates for Two Series of Index Crimes for 14 Pacific Coast Cities
with Populations of 150,000 and over in 1970: 1968-1970 and 1959-1961
Mean Violent Crimes Rank
Seven Murder Forcible Robbery Aggravated City Crimes Nonneg Man Rape Assault
1968 1959 1968 1959 1968 1959 1968 1959 1968 1959 1970 1961 1970 1961 1970 1961 1970 1961 1970 1961 Oakland. . 2.0 5.9 1 4 3 3 2 5 3 3 San Francisco. 2.7 4.3 2 5 2 4 1 2 2 2 Los Angeles. 3.1 1.5 3 2.5 1 1 4 1 1 1 Seattle. 4.4 8.0 5 6 5 7 3 8 6 12 Portland 5.7 8.1 8 8 7.5 10 5 7 5 9
I Fresno . 6.4 6.3 4 2.5 11 11.5 8 6 12 8 Long Beach 6.9 4.4 6 11 4 2 6 4 7 4 Sacramento · , · 7.7 3.3 7 1 10 5 7 3 8 6 Tacoma • · 8.7 10.8 9 9.5 6 6 9 11 4 14 Santa Ana. . 1el.3 9.1 11 12 9 8 10 12 9 5 Anaheim. 10.9 8.0 14 7 13 13 11 13 13 10 San Diego. 10.9 9.1 10 9.5 12 9 12 9 11 7 San Jose · . 11. 3 10.6 13 14 7.5 11.5 14 10 10 11 Spokane. . 13.0 13.6 12 13 14 14 13 14 14 13 -
LoU Q ~ .. .J .... Property Crimes
Total and Subtotals <l .. 0 u,,! U Z t.4.I C -u ~ y"
Burglary Larceny Auto Grand Violent Property City $50 over Theft Total Crimes Crimes -1968 1959 1968 1959 1968 1959 1968 1959 1968 1959 1968 1959 1970 1961 1970 1961 1970 1961 1970 1961 1970 1961 1970 1961
Oakland. . . 1 7 2 9 2 10 1 6 2 3 1 9 San Francisco. 2 4 9 12 1 1 2 4 1 2 2 5 Los Angeles. · 5 1 5 1 3 3 3 1 3 1 5 1 Seattle. . . · · 3 8 4 8 5 7 4 8 4 9 4 8 Portland 6 10 1 5 8 8 6 7 5 7 6 6
~ ~
~ C¥
0 ~ U 0 ~ e( 0
~ III' III I- U
Z IoU ~ U W Z e( C) IoU III
-' 0 W ~ e( e( !:!:! Z 0
Z W Z IoU 0 C)
~ IlD ~ ~ e( ...., 0 Z e( 0 e( e( C Z IoU
e( :J: :iii: e( 01. ...
-' C) 0 I-·Z
U ..... e( I- Z .... 01. Z ot:t U Z Z 0 e(
... I- III 01. U
Z 4( e( .8; :iii: Z III e( IoU 0 iC[ 0 e(
\II ..,.. e( 0 IX e( .... ..,.. e( IoU
~ ..,.. -' 0 III ' ... \II .....
Fresno • . 4 9 3 2 4 5 5 5 9 6 3 4 Long Beach . 8 2 10 4 7 4 8 3 6 4 8 3 Sacramento · 10 3 7 3 6 2 7 2 8 5 7 2 Tacoma • . . 11 12 11 10 10 13 10 13 7 12 10 13 Santa Ana. · . · 9 6 13 14 12 11 11 11 10 8 11 11 Anaheim. . · · 7 5 6 6 13 12 9 9 13 11 9 7 San Diego. . · 14 13 8 7 11 9 12 12 11 10 13 12 San Jose . . 12 11 14 11 9 6 14 10 12 13 14 10 Spokane. . . 13 14 12 13 14 14 13 14 14 14 12 14

332
Sacramento dropped from second place in 1959-1961 to first plact1 in 1968-1970; hi d t
, 70' San Francisco shifted only slightly from t . r 0 sec-to eighth place In 1968-19 , , t t th'rd place' Seattle moved from
, s An eles declined from fIrs 0 I, " ond place, Lo g . . 1968-1970 Fresno occupIed SiXth
, 1959 1961 to fourth place 10 . seventh place 10 - ,t 1 for both series. Similarly,
for both serie"s. Spokane was 11'1 las pace , place 'ked relatively low in both serIes. Tacoma
Santa Ana and San DIego ran San Jose, 9-1961 to ninth place for 1968-1970. shifted from thirteenth place for 19~ , f the three Washington cities,
With regard to the respectIve rank10gs 0 db 968-1970 series was third for both robbery an ur-
Seattle's highest rank for the 1 $50 fifth for murder and nonnegligent ttl nked fourth for larceny over ,
glary; Sea e ra b.'l th ft and sixth for aggravated assault. f 'bl ape and automo 1 e e ,
manslaughter, orCl e r I' t anslaughter and larceny over d tw lfth f r murder and nonneg Igen m
Spokane ranke e ,0 obber and burglary, and fourteenth for aggra-$50 thirteenth for forcIble rape, r Y 'f th for
, , f Tacoma's highest rankmg was our vated assault and automobIle the t. , f f 'b1e rape' ninth for murder and
lt Tacoma ranked SIXth or orCl - , aggravated assau . b . tenth for automobile theft and eleventh nonnegligent manslaughter and rob ery, '.
for burglary and larceny over $50.
•
.0
.l .,!
.'
C"~APTER 9
A PRACTICAL PROPOSAL FOR THE CREATION OF A CRIME
INFORMATION AND RESEARCH CENTER FOR
THE STATE OF WASHINGTON 1
Washington occupies the unenviable position of being one of the most
backward states in the Union with respect to the availability of systematic and reli
able crime data. In fact, according to a recent survey, Washington is one of only
two states without a central records and identification system. 2 Neither does
Washington have a centralized program for compiling crime statistics. Most
states have such programs or are in the process of establishing them.
The Need for a State C rime Information and Resear.ch Center
Crime is a state matter and each state has either constitutionally or by
statute defined crime within its boundaries. Each state has also defined the degree
of, and the penalties for, violation together with the agenCies and processes to be
followed in the administration of criminal justice.
I This presentation is designed to reflect the experience of many states, Federal governmental agencies, crime commissions and criminological, statistical and legal specialists. It is basically an integrated compilation of excerpts and resumes derived from various published and unpublisher. reports. Entire paragraphs and sections have been extracted verbatim from these sources. Two of the major sources of material included in this discussion are American Bar Association, Uniform Criminal Statistics Act (1946) and the President's Commission on Law Enforcement and Administration of Justice, Crime and Its Impact--An Assess.!!!2ill (1967), pp. 123-137 and pp. 178-206. Other sources are cited in specific footnotes.
2LaW Enforcement Assistance Administration, Department of Justice, "Survey of State Criminal Justice Information Systems" (Washington, D. C., September 25, 1970). The other state besides Washington that does not have a central records and identification system is Nevada.
It should be noted, ltowever, that the Forty-second Legislature during the second extraordinary session in January- February, 1972, re-created a Bureau of Criminal Identification under the auspices of the.~State Patrol. This statute (Senate Bi11146) was signed by the Governor on February 25, 1972.
333
.,
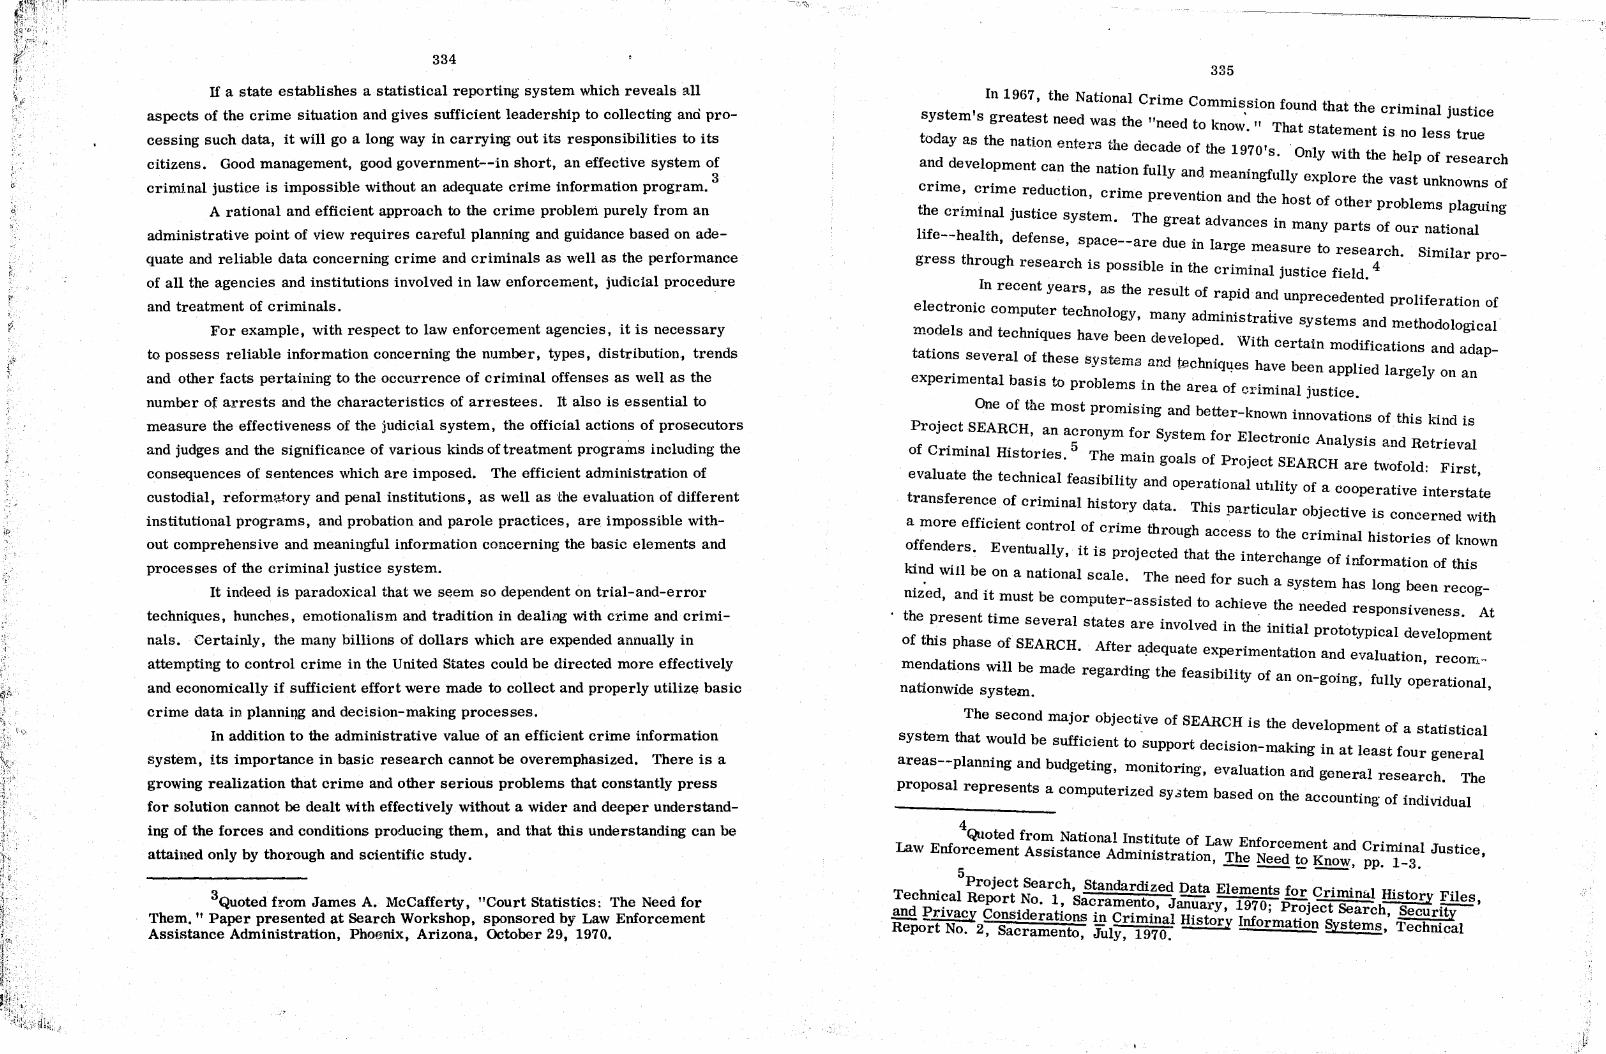
, ' ,,;<
iF: '
334
If a state establishes a statistical reporting system which reveals all
aspects of the crime situation and gives sufficient leadership to collecting and pro
cessing such data, it will go a long way in carrying out its responsibilities to its
citizens. Good management, good government--in short, an effective system 0i crhnlnal justice is impossible without an adequate crime information program.
A rational and efficient approach to the crime problem purely from an
administrative point of view requires careful planning and guidance based on ade
quate and reliable data concerning crime and criminals as well as the performance
of all the agencies and institutions involved in law enforcement, judicial procedure
and treatment of criminals.
For example, with respect to law enforc:ement agencies, it is necessary
to possess reliable information concerning the number, types, distribution, trends
and other facts pertaining to the occurrence of criminal offenses as well as the
number of arrests and the characteristics of arI'estees. It also is essential to
measure the effectiveness of the judicial system, the official actions of prosecutors
and judges and the significance of various kinds of treatment programs including the
consequences of sentences which are imposed. The efficient administration of
custodial, reform:;>.f,ory and penal institutions, as well as the evaluation of different
institutional programs, and probation and parole practices, are impossible with
out comprehensive and meaningful information concerning the basic elements and
processes of the criminal justice system.
It indeed is paradoxical that we seem so dependent on trial-and-error
techniques, hunches, emotionalism and tradition in deali.'lg with crime and crimi
nals. Certainly, the many billions of dollars which are expended annually in
attempting to control crime in the United States could be directed more effectively
and economically if sufficient effort were made to collect and properly utilize basic
crime data in plannil}g and deCision-making processes.
In addition to the administrative value of an efficient crime information
system, its importance in basic research cannot be overemphasized. There is a
growing realization that crime and other serious problems that constantly press
for solution cannot be dealt with effectively without a wider and deeper understand
ing of the forces and conditions producing them, and that this understanding can be
attained only by thorough and scientific study.
3Quoted from James A. McCafferty, "Court Statistics: The Need for Them. fl Paper presented at Search Workshop, sponsored by Law Enforcement Assistance Administration, Phoenix, Arizona, October 29, 1970.
335
, In 1967, the National Crime Commis,sion found that the criminal justice system s greatest need was the "need to know " That state t . I t
. men IS no ess rue today as the nation enters the decade of the 1970's 'Only Wl·th th h I f
. e e p 0 research and development can the nation fully and meaningfully explore the vast unknowns of
crime, crime redUction, crime prevention and the host of other problems plaguing
the criminal justice system. The great advances in many parts of our national
life--health, defense, space--are due in large measure to research. Similar pro
gress through research is Possible in the criminal justice field. 4
In recent years, as the result of rapid and unprecedented proliferation of
electronic computer technology, many administrative systems and methodological
m~dels and techniques have been developed. With certain modifications and adap
tatIOns several of these systems and techniq~es have been applied largely on an
experimental basis to problems in the area of criminal justice.
One of the most promiSing and better-known innovations of this kind is
Project SEARCH, an acronym for System for ElectrOnic AnalYSis and Retrieval
of Criminal Histories. 5 The main goals of Project SEARCH are twofold: First,
evaluate the technical feasibility and operational utIlity of a cooperative interstate
transference of criminal history data. This particular objective is concerned with
a more efficient control of crime through access to the criminal histories of known
offenders. Eventually, it is projected that the interchange of information of this
kind will be on a national scale. The need for such a system has long been recog
nized, and it must be computer-assisted to achieve the needed responsiveness. At
the present time several states are involved in the initial prototypical development
of this phase of SEARCH. Mter a~equate experimentation and evalUation, recom ..
mendations will be made regarding the feasibility of an on-going, fully operational, nationwide system.
The second major objective of SEARCH is the development of a statistical
system that would be sufficient to 'support decision-making in at least four general
areas--planning and budgeting, monitoring, evaluation and general research. The
proposal represents a computerized sy 3tem based on the accounting' of individual
4 Quoted from National Institute of Law Enforcement and Criminal Just.
Law Enforcement Assistance Administration, The ~ ~~, pp. 1-3. ICe,
. 5project Search, Standardized Data Elements for Criminal Historf Files, Techm~al Report.No. 1~ Sac.rame:nto, January, 1970; Project Search, Security .!!ill! ;PrIvacf ConSIderatIOns !E- CrIminal History Information Systems, Technical Report No.2, Sacramento, July, 1970.
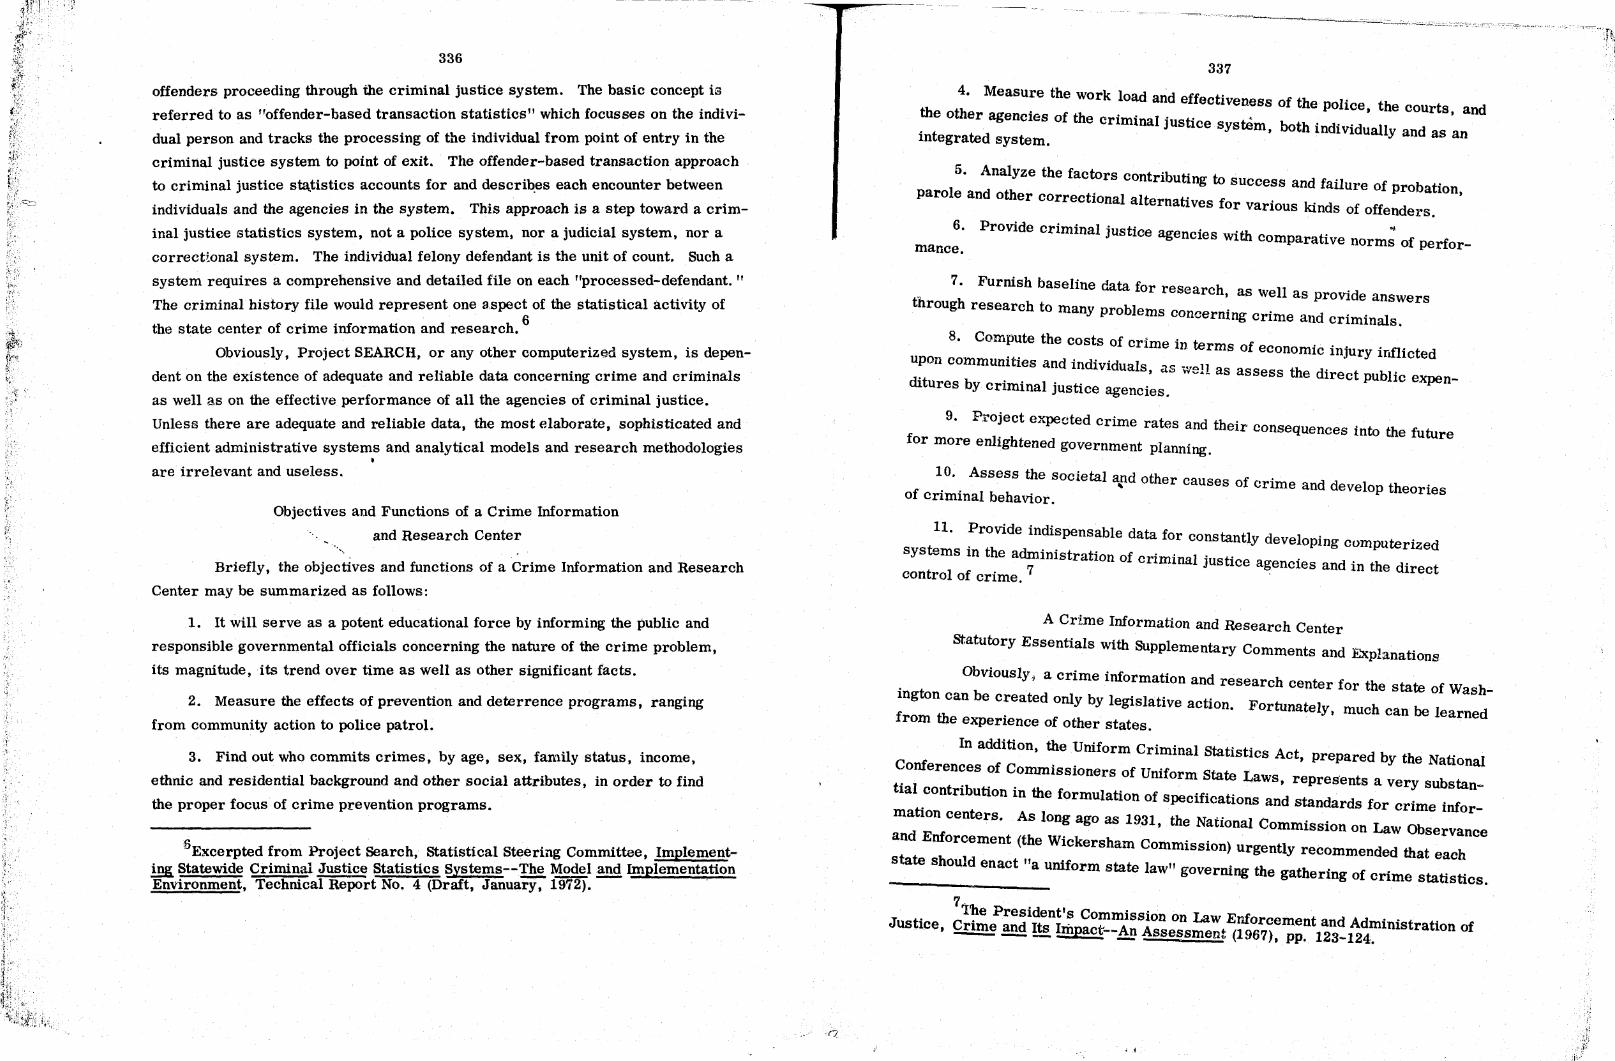
...
.(!f--------~----------·--.'
336
offenders proceeding through the criminal justice system. The basic concept is
referred to as "offender-based transaction statistics" which focusses on the indivi
dual person and tracks the processing of the individual from point of entry in the
criminal justice system to point of exit. The offender-based transaction approach
to criminal justice sta,tistics accounts for and descri~es each encounter between
individuals and the agencies in the system. This approach is a step toward a crim
inal justiee statistics system, not a police system, nor a judicial system, nor a
correcttonal system. The individual felony defendant is the unit of count. Such a
system requires a comprehensive and detailed file on each "processed-defendant. "
The criminal history file would represent one 3.SpeCt of the statistical activity of
the state center of crime information and research. 6
Obviously, Project SEARCH, or any other computerized system, is depen
dent on the existence of adequate and reliable data concerning crime and criminals
as well as on the effective performance of all the agencies of criminal justice.
Unless there are adequate and reliable data, the most elaborate, sophisticated and
efficient administrative systems and analytical models and research methodologies
are irrelevant and useless.
Objectives and Functions of a Crime Information
and Research Center .. '"''
Briefly, the objectives and functions of a Crime Information and Research
Center may be summarized as follows:
1. It will serve as a potent educational force by informing the public and
responsible governmental officials concerning the nature of the crime problem,
its magnitude, its trend over time as well as other significant facts.
2. Measure the effects of prevention and deterrence programs, ranging
from community action to police patrol.
3. Find out who commits crimes, by age, sex, family status, income,
ethnic and residential background and other social attributes, in order to find
the proper focus of crime prevention programs.
SExcerpted from Project Search, Statistical Steering Committee, Implementing Statewide Criminal Justice Statistics Systems--The ~l and Implementation Environment, Technical Report No. 4 (Draft, January, 1972). .
.. r?
337
4. Measu~e the work load and effectiveness of the police, the courts, and the other agenCIes of the criminal justice s te' " , . t ted ys m, both mdi vidually and as an In egra system.
5. Analyze the factors contribUting to success and failure of probation
parole and other correctional alternatives for various kinds of offenders. '
6. Provide criminal justice agencies with comparat' 0.,\
mance. I ve norms of perfor-
th 7. Furnish baseline data for research, as well as provide answers
rough research to many bl pro ems concerning crime and crim' al In S.
8. Compute the costs of ' , CrIme In terms of economic injury inflicted
Upon communities and individuals ~s 'vall as a th. , ,... ~~. ssess e dIrect pUblic expen-
ditUres by criminal justice agencies.
9. Project expected crime rates and th ' eir consequences into the future
for more enlightened government planning,
~O'. Assess the societal alld other causes of crime and develop theories of cnmmal behavior.
11. Provide indispensable data for constantly devel . , s te· , , opmg computerIzed ys ms m t~e ad~llmstration of criminal justice agencies and in the direct
control of crIme, .
A Crime Information and Research Center
statutory Essentials with Supplementary Comments and Explanations
Obviously, a crime 'nf t' , I orma IOn and research center for the state of Wash-mgton can be c~eated only by legislative action. Fortunately I much can be learned from the experIence of other states.
In addition, ~e ~niform Criminal Statistics Act, prepared by the National Conferences of ComnnsslOners of Uniform State L . , aws, represents a very substan
bal ,contribution in the formulation of Specifications and standards for crime infor=
matlon centers. As long ago as 1931, the National Commission on Law Ob and Enfo t th servance
rcemen ( e Wickersham Commission) urgently recommended that each state should enact "a Uniform tate 1" .
s aw goverrung the gathering of crime statistics.
7· l'!te President's CommiSSion on Law E a '. ,
Justice, CrIme.!!!2 Its Impact--An Assessmen+ (lli906r7c)ementla2nd Admlrustratlon of - - - - .. ,pp. 3-124 .
• l
·';h.

,: i
; ~ ,
~ c
,: <,
1 .. :;.
4~j -""
2 ~i.~
3
4
338
The Wickersham Commission was concerned with the establishment of an ~deqUate
f ' 'nformation which was contingent on the creatlOn of nationwide system 0 crIme 1, , ,
, tate 'de systems History graphically shows that comparatIvely lIttle effectIve s n WI . , ,
d e to implement the recommendations of the Wickersham CommisslOn. In
was on "Law Enforcement and Administration of Jus-1967, the Presideot'~ Commlsslo~ on "
tice stated that: "In short the United States is today, in the era of the hIgh speed
computer, trying to keep track of crime and criminals with a systern that was less
than adequate in the days of the horse and buggy. "
, d tatute as well as the accompanying commentary, The followmg propose s , ,
h been taken with certain modifications and abridgements from the 1946 Uruform as , , .son
Criminal Statistics Act drafted by the National Conference of comIUlsslOne~, ~
d oved by the American Bar Association. We belIeve Uniform State Laws an appr ,
d ' 'les embodied in these proposals can be used, perhaps wIth that the facts an prmClp t'
certaIn reVIsIOns an all • , " d dd't'ons as a sound and practicable basis in the prepara lOn
of a bill for legislative action. Hopefu y, m SPI 0 11 ' 'te f the extraordinary fiscal and
other problems faced by the Legislature, there will be sufficient support ,to estab
lish a crime information and research center, If the 1973 Legislature f,aIls, to act
, , th'" e it will be only a matter of time before such actlOn IS taken. POSIt! vely on IS ISSU , , h
The state of Washmgton SImp y ca ' '1 nnot afford for very much longer not to establIs
a center of this kind.
8 SESSION LAWS, 1973
CHAPTER
An Act relating to state government; , , in a state Crime Information and Research Center; p,re~c~Ibmg
creat g d t' and responsibilities of certain officers and mdi VI du als powers, u Ies
Section 1. Crime Information and Research Center
A Crime Information and Research Center
(called the center) is established [in the office
of the attorney general) [as an independent agency]
8For an excellent summary of the activities, responsibilitiheS antd legal . , k of the crime information and researc cen ers 0
and organlz~t~o~~o~:~~e;~:rida, Michigan, Minnesota and New Jersey, see: , ::o;~~e;e~rc:' Statistical Steering Committee, Technical Report No.4, .2£ . .£!!.
339
Comment to Section 1.
The object of the Crime Information and Research Center is to act as a
central agency which collects, analyzes and publishes statistical and other informa
tion drawn from reports supplied by all local and state officials or agencies concerned in any way with crime and criminals.
Strictly speaking, no state of the union possesses, at the present time, an
independent Center or Bureau of Crime Information; that is, an agency which is
solely devoted to this task and not attached to any specific state department. Most
of the present information centers are administered as divisions of some state department set up to serve some other main ]runction.
There are those who believe that a Crime Information Center should be an
independent agency, devoting its entire effort in compiling crime information and
in conducting research. The drawback in attaching a crime information and re."
search center to some other agency is the possibility that it may be regarded as a
stepchild which will suffer from lack of funds. Another drawback is the sensitivity
and rivalry of in-line agencies which could hamper the work of the center if it hap
pens to be subsidiary to one of them. Again, identification with a larger agency
may lead to overemphasis on one type of information to the neglect of others. Per
haps an independent center would be in a better ;position to maintain an even balance.
In any case, every effort must be made to avoid statistical and research work from
becoming a side issue lacking competent supervision, adequate staff and sufficient funds for conducting an effective and vital operati'.on.
1 Section 2. Director, Method of AppOintment, etc ..
2 The Governor fby and with the consent of the senate] [The Attorney
3 General] shall appoint the director of the center. He shall have statistical
4 training and experience and po8sess a knowledge of criminal law enforcement
5 and administration and of penal.and correctional institutions and methods.
6 He shall devote all his time to the duties of his offiee. He shall be furnished
7 with the necessary facilities and eqUipment and shan appoint research, statis-
8 tical, clerical and other assistants necessary for the work of the center. All
9 expenses of the center shall be paid out of the appropriation made for its
10 work. All center personnel, including the director, shall be selected and
11 shall serve in accordance with the established merit system standards and 12 regulations.
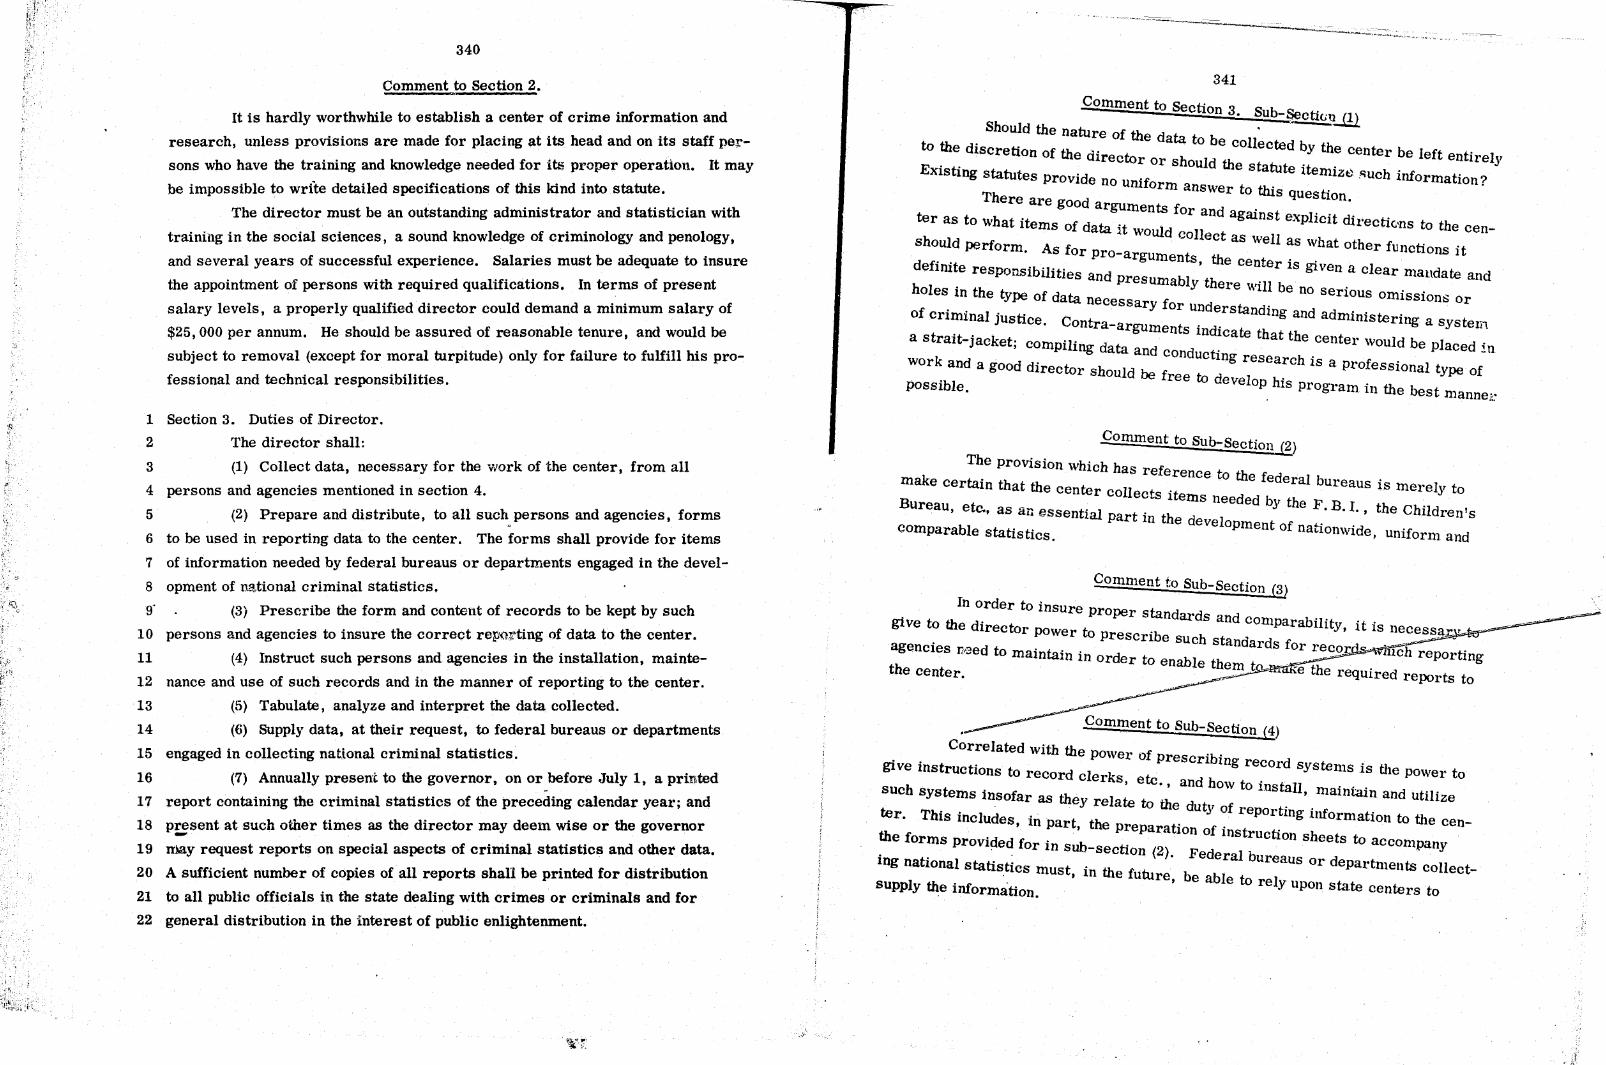
r. '
" ~
340
Comment to Section 2.
It is hardly worthwhile to establish a center of crime information and
research, unless provisions are made for placing at its head and on its staff per
sons who have the training and knowledge needed for its proper operation. It may
be impossible to write detailed specifications of this kind into statute.
The director must be an outstanding administrator and statistician with
training in the social sciences, a sound knowledge of criminology and penology,
and several years of successful experience. Salaries must be adequate to insure
the appointment of persons with required qualifications. In terms of present
salary levels, a properly qualified director could demand a minimum salary of
$25,000 per annum. He should be assured of reasonable tenure, and would be
subject to removal (except for moral turpitude) only for failure to fulfill his pro
fessional and technical responsibilities.
1 Section 3. Duties of Director.
2 The director shall:
3 (1) Collect data, necessary for the work of the center, from all
4 persons and agencies mentioned in section 4.
5 (2) Prepare and distribute, to all such persons and agencies, forms
6 to be used in reporting data to the center. The forms shall provide for items
7 of information needed by federal bureaus or departments engaged in the devel-
8 opment of national criminal statistics.
9' (3) Prescribe the form and content of records to be kept by such
10 persons and agencies to insure the correct reporting of data to the center.
11 (4) Instruct such persons and agencies in the installation, mainte-
12 nance and use of such records and in the manner of reporting to the center.
13 (S) Tabulate, analyze and interpret the data collected.
14 (ti) Supply data, at their request, to federal bureaus or departments
15 engaged in collecting national criminal statistics.
16 (7) Annually present to the governor, on or before July 1, a printed -
17 report containing the criminal statistics of the preceding calendar year; and
18 p~sent at such other times as the director may deem wise or the governor
19 nMly request reports on special aspects of criminal statistics and other data.
20 A sufficient number of copies of all reports shall be printed for distribution
21 to all public officials in the state dealing with crimes or criminals and for
22 general distribution in the interest of public enlightenment.
341
Comment to Section 3 Sub Se ' . -. cti<.;u...ill. Should the nature of the data to b . .
to the discretion of the director or sh ld ~collected by the center be left entirely EXiSting statutes provide no unif ou e statute itemizt} ,"uch information?
orm answer to this' . There are good question.
arguruents for and a' , , ter as to what items of data 't gamst explICIt directions to the ce _ h 1 would collect as . 11 n
s ouId perform. As for pro- we as what other fUnctions it d f' ' arguments, the cente' ,
e Imte responsibilities a d r IS gIven a clear mandate a d h n presumably there '11 b n
oles in the type of data ne WI e no serious omiSSions or , , cessary for understa d' .
of crmunal justice. Contra- ,n mg and administering a system arguments mdicate th t th 1
a strait-jacket; compiling data d a e center would be placed ;n k an condUcting rese h' -
wor and a good director should be f arc IS a professional type of possible. ree to develop his program in the best
, mannej:~
Comment to Sub-Section (2)
The prOviSion which has. rel'e ak i rence to the f d
m e certain that the center colI t ' e eral bureaus is merely to B ec s Items needed b th
ureau, etc., as an essential part' th Y e F. B. I., the Children's III e developm t f
comparable statistics. en 0 nationwide, uniform and
Comment f S b ' ~ vO U - SectIon (!ll In order to insure proper stand 0d
o-i t a1: sand comp b'I' ~4 ve 0 the director power to PI' 'b ara 1 lty, it is necessar T .,
, escn e such standards f . . _ - - ~ agenCIes r:f3ed to maintain ' d 01 recor .;,.. rich repo 0ti
In or er to enable the. r ng the center. m t -e the required reports to
Comment to SUb-Section 0!) Correlated with th
. , e power of prescribing record gIve Instructions to record cle k systems is the power to
h r s, etc., and how to in tall suc systems insofar as the I. . s , maintain and utilize
y re ate to the duty of . ., tel'. This includes, in part th ' reportmg lllformation to the cen-th f ' e preparatIon of instru ti h
e orms provicled for in sub-se ti 2 c on s eets to accompany . . c on (). Federal b lng national statistics must in the future ureaus or departments collect-
I . , , be able to reI supp y the information. y upon state centers to
,0
~"
,"
,.: :
',I
342
comment to Sub-Section (7)
The choice of the calendar year is desirable, since it affords the most
logical basis for uniformity and comparability. All existing federal and state sys-
tems conform to the calendar year.
1 Section 4. Report t~ Center; Duties of Persons and Agencies.
2 Every constable, city marshal, chief of police; railroad, steamship,
3 park police; sheriff, coroner, medical examiner, jail keeper, justice, magis-
4 trate; judge, district attorney, court clerk; probation officer, parole officer,
5 warden or superintendent of a prison, reformatory, correctional school, men-
6 tal hospital or custodial school; school attendance officer, school security
7 officer, attorney general, department of motor vehicles, department of wel-
8 fare, state police, department of highways, state fire marshal, bureau of
9 vital statistics, liquor control board, and every other person or agency, pub-
10 lic or private, dealing with crimes or criminals or with delinquency or de lin-
16
11 quents, when requested by the director, shall: 12 (1) Install and ma.inta~..!~cords.,needed'for reporting data required
" 13bY_~~~ ~~ (2) Report to the center as and when the director prescribes, all
15 data demanded by him (except that such reports concerning a juvenile delin
quent shall not reveal his or his parents' identity).
17 (3) Give the director or his accredited agent access'to records for
18 purpose of inspection.
Comment to Section 4.
Every effort should be made to include by title every public official who
has anything to do with criminals or delinquents in the state. Such specifications
will be of help to the director of the center and will make every public official men
tioned aware of his responsibility. In practice, only the heads of the different
offices, etc., will be requested to supply information. The formula suggested in
the statute makes the duty operative only when the Director of the center makes a
request.
1 Section 5. Annual Report. 2 (1) The annual report of the director shall contain statistics showing
3 (a) the number and the types of offenses known to the public authorities; (b)
4 the personal and social characteristics of criminals and delinquents; and
--~-~---------..,..., \'~' -~
343
5 (e) the administrative action taken by law enforcement, judicial, penal and
6 correctional agencies in dealing with criminais and delinquents.
7 (2) The director shall so interpret such statistics and so present
8 the information that it may be of value in guiding the legislature and those
9 in charge of the apprehension, prosecution and treatment of criminals and
10 delinquents, or those concerned with the prevention of crime and delinquency.
11 The report shall include statistics that are comparable with national criminal
12 statistics published by federal agencies heretofore mentioned.
Comment to Section 5.
Nearly all criminal statistics published today in the various states suffer
from a lack of interpretation. The enormous amount of tabulated material, in
such reports on crime statistics, is presented without explanation, to the great
cons~ernation of all consumers of statistics. Existing statutes pay no attention,to.
- thi~ p.roblem. It has therefore seemed desirable to in~roduce, in the second part
of the section, a directive which compels the center to give an interpretation of all
statistics included in the annual report. Furthermore, this requirement empha
sizes the importance of the research and administrative functions of the center.
1 Section 6. Penalties.
2 If any public official required to report to the center neglects or
3 refuses to comply with the requests of the director for such report, or with
4 his rules governing record systems and their maintenance, the director
5 shall give written notice thereof to the officer charged with the issuance of
6 a warrant for the payment of the salary of such official. Upon the receipt
7 of this notice, such officer shall not issue a warr~nt for the payment of the
8 salary accruing to the official until notified by the director that the salary
9 has been released by the performance of the required duty. Any official
10 who makes, or causes to be made, a fraudulent return of information to
11 the center is guilty of a misdemeanor.
Comment to Section 6
Many of the statutes specify f~nes and a few even jail sentences or removal
from office for failure to report to the center. A statute which requires the insti
tution of civil actions or criminal prosecution of neglectful officials, when duties
are of the type covered by this statute, would probably be unenforceable. Giving
'1 t •

344
to the director of the center tha power merely to hold up the payment of salary
should be a much more effective means of securing compliance. other minor sections such as interpretation, title, repeal of acts inc~nsis-
tent with the present one and time of taking effect may be added to this statute.
A Brief Description of an Exist~ng
Crime Information and Research Center
An example of the organizational structure and basic program of one of
the older, better-known and more efficient centers for crime statistics--State of
California Bureau of Criminal statistics--is portrayed in the accompanying chart.
(Figure 9:1) The center (bureau), with a director in charge, is located in the
Di vision of Law Enforcement in the state Department of Jl.1stice under the Attorney
General. The present director (chief), Mr. Ronald H. Beattie, a statistician of
wideLreputation has guided the activities and development of the center (bureau)
for many years. It will be observed that t11 ..... - .. - three major divisions in the
center (bureau) with a total of approximately6Tstaff-member::;. ...' .. - . ·companying
tabular form indicates the specific programs under each of the three.,;.~~r.dly:tsions along with the type of reporting system and coverage of each program: Th~ bureau was created by statute in 1955 after operating under executive order since
1946. Previous to that, some limited statistical functions had been carried out by
the Bureau of Criminal Identification and Investigation. In addition to the 67 staff
members in the burea~, there are several persons involved in the statistical pro
grams of the Department of Correction, Youth Authority, and Judicial Council.
Also, the Bureau of Criminal Identification, while it is not involved in statistical
analysis maintains two related functions. This bureau, which is located in the
same division of the Justice Department as the Bureau of Criminal statistics, is
responsible for processing crime reports, fingerprints, and building criminal his-
tories. Of course~ the size of the staff required for the Washin~ton State Crime
Information and Research Center probably would be considerably smaller. How
~ver, the difference in size between the Washington and California crime informa
tion centers cannot be gauged merely on the basis of the total populations of the
respective states. In determining size an.d composition of staff, such factors as
the following should be considered: relative work load based on the number of
programs; type, amount and quality of data received; the number and efficiency of
reporting agencies; the variety and volume of services demanded of the center;
and the extent and quality of the research program.
'" V -~ '" t= c( ~
'" -I
« z -~ -a:: V
345
.
I -
a: t:t I-1&.1 I-(/) (/) :r (/)-a:1-11. _11.1&.I(/) CII 1->-%-a: a: 1-11. 11. 0 CIIlCCII>-0 ua:a:1- -Z -1&.I°lC
~ %.J0a: l1.u z l&.l CII . 1&.1 ..J ~~t;u _-_N
, --~I :;)1 ~I ca'~ 'v) ZI>-0,...J - ~ ~1:2 m'~f--010:: 0::,0 Q. -,Z wlw ...J V) -1-zi ~I :;)1 '"">1
I ., I
V)I ~I
-
ul~ zlV) w l >-~I~ .... I z ZI~ WI 0:: ::EIQ WIZ u W 0:1 V) ~I-zi wi
I , I
I-
-
-
"'--
- -
I.JI . I~I I zp.:: t:t
V) ~a:(/) I .11&.1 lC ...J rJI..J a:
Ci 101~ ~ '""> 1V)a: u V),(/) ~i" If)
1._--_- 1- . - ---- --
I .1 I..J I I· 1~llC t:t
~ I~ 115 ~ 9 1~ldffi a:: ~V)Ia: -l
IV)I(/) ~ I~'-I-I
I .11-...JI!!?
0: 1~111. ~ Iz >-...J I~II- J:I :;) I~I~ (/) (,!) ICnI~ : 1&.1 0: 1V)lu 1&.1
I ~Ia:: d I-I~ If)
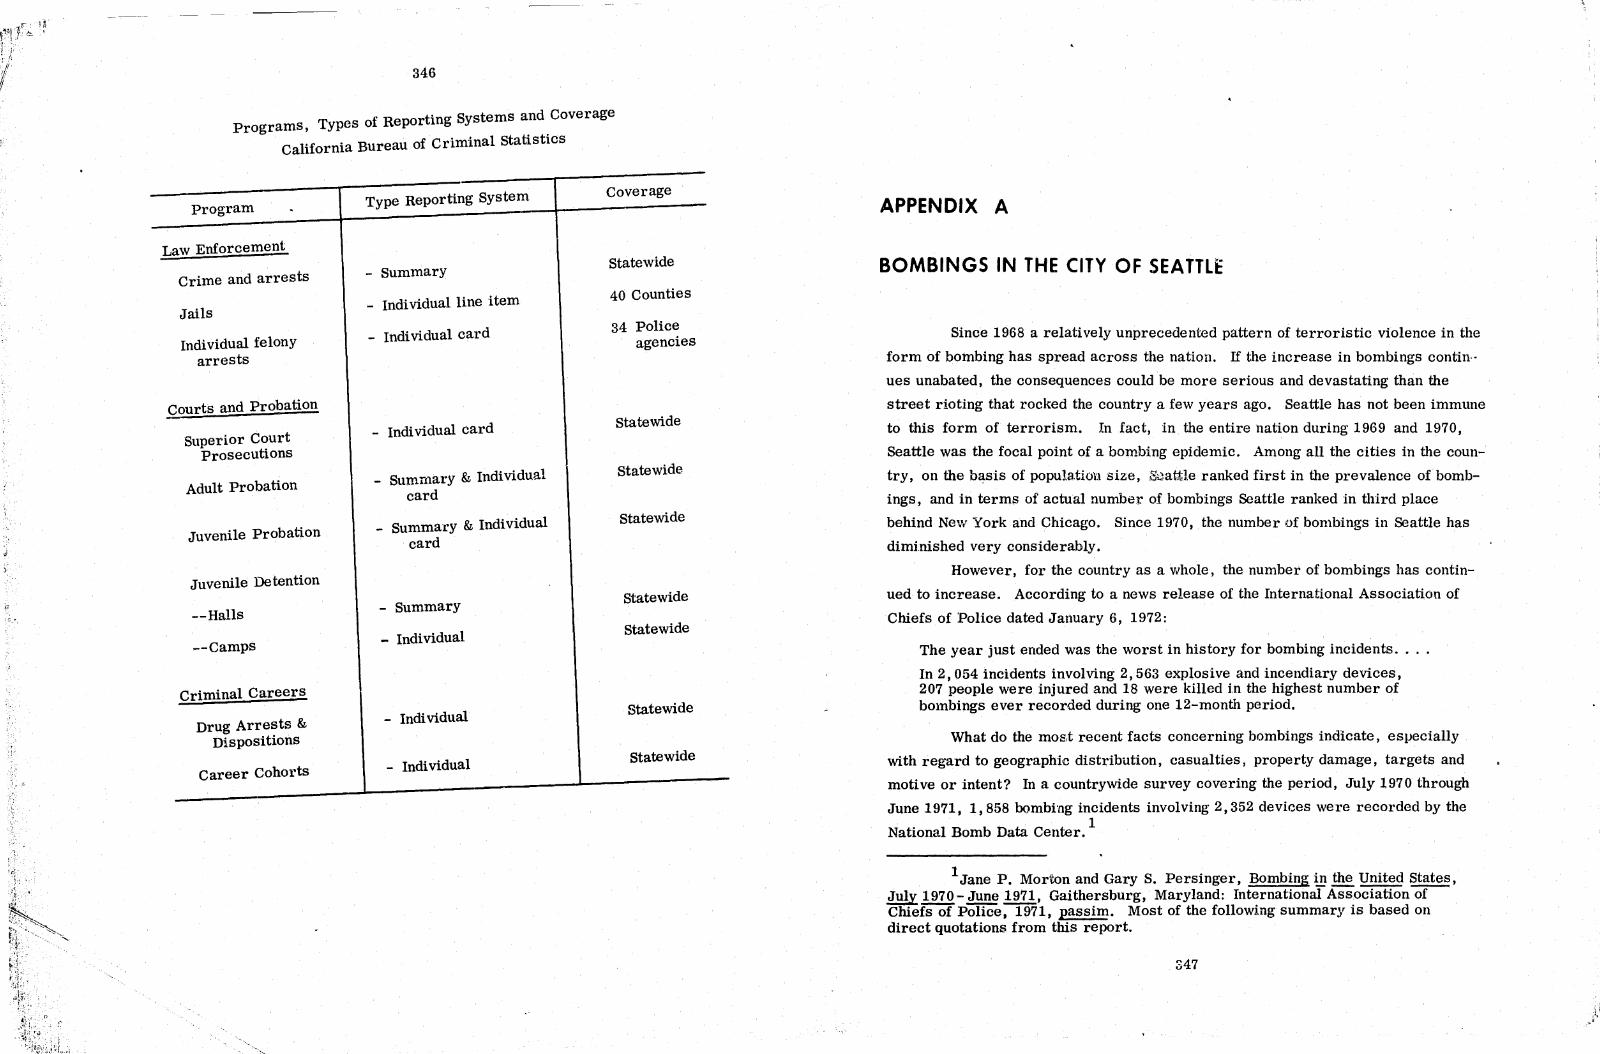
, ",
: ,
346
Programs, Types of Reporting Systems and Coverage
California Bureau of Criminal Statistics
Program
Law Enforcement
Crime and arrests
Jails
rndi vidual felony arrests
Courts and Pro~
Superior Court Prosecutions
Adult Probation
Juvenile Probation
Juvenile Detention
--Halls
--Camps
Criminal Careers
Drug Arrests & Dispositions
Career Cohorts
Type Reporting System
- Summary
_ rndi vidual line item
- rndi vidual card
- rndi vidual card
_ Summary & rndi vidual card
_ Summary & rndi vidual card
- Summary
- rndi vidual
- rndi vidual
- rndi vidual
Coverage
Statewide
40 Counties
34 police agencies
Statewide
Statewide
Statewide
Statewide
Statewide
statewide
Statewide
APPENDIX A
BOMBINGS IN THE CITY OF SEA TTLt
Since 1968 a relatively unprecedented pattern of terroristic violence in the
form of bombing has spread across the nation. If the increase in bombings contin··
ues unabated, the consequences could be more serious and devastating than the
street rioting that rocked the country a few years ago. Seattle has not been immune
to this form of terrorism. In fact, in the entire nation during 1969 and 1970,
Seattle was the focal point of a bombing epidemic. Among all the cities in the coun
try, on the basis of popula.tion size, S~attJ.e ranked first in the prevalence of bomb
ings, and in terms of actual number of bombings Seattle ranked in third place
behind New York and Chicago. Since 1970, the number of bombings in Seattle has
dimi.nished very considerably.
However, for the country as a whole, the number of bombings has contin
ued to increase. According to a news release of the International Association of
Chiefs of Police dated January 6, 1972:
The year just ended was the worst in history for bombing incidents ...
In 2,054 incidents involving 2,563 explosive and incendiary devices, 207 people were injured and 18 were killed i.n the highest number of bombings ever recorded during one 12-month period.
What do the mos.t recent facts concerning bombings indicate, eSIJecially
with regard to geographi'c distribution, casualties, property damage, targets and
motive or intent? In a countrywide survey covering the period, July 1970 through
June 1971, 1,858 bombing incidents involving 2,352 devices were recorded by the
National Bomb Data Center. 1
1 Jane P. Moriton and Gary S. Persinger, Bombing ~ the United States, July 1970 -~ l!!1!, Gaithersburg, Maryland: International Association of Chiefs of Police, 1971, passim. Most of the following summary is based on direct quotations from this report.
347

348
Of the 1,858 incidents, 1,550 (83.4 percent) were reported to have at
least one functioning device, while in 308 (16.6 percent) incidents the device or
devices did not function. Incendiary incidents totalled 995 (53.6 percent), outnum
bering explosive in~idents, which totalled 863 (46.4 percent).
California dOPlinated all other states in terms of bombing incidents with
391-:"'325 functioning and 66 nonfunctioning incidents. This total represents 21. 0
percent, or over one-fifth of all reported bombing incidents from July, 1970 '
through June, 1971. Second in total incid£;!nts was New York with 182, followed by
Ohio with 172, Georgia with 101, Florida with 99, Illinois with 85, New Jersey
with 76 and Michigan with 71. The state of Washington with 12 incidents during
this period ranked thirtieth among the 50 states, Washington, D. C. and Puerto
Rico. On the basis of population, however, Washington, D. C. ranked first with
a rate of 27.8 per million, followed in rank-order by New Mexico (22.6), Georgia
(22.0), California (19.6), Ohio (16.1), Florida (14.6) and Nevad,a (14.3). Washing
ton and Iowa, both with a rate of 3.5, ranked 37.5 among the 50 states, Washington,
D. C. and Puerto Rico. North Dakota, South Dakota, Arkansas and New Hamp
shire reported no bombings during this period.
Among the nine geographical regions of the United States, the Pacific
region--AI2.ska, California, Hawaii, Oregon and Washington-~ranked first in total
incidents with 426 (22.9 percent), followed by the East ,North Central Region-
Illinois, Indiana, Michigan, Ohio and Wisconsin--with 386 (20.8 percent). The
number of bombing incidents per million of population also places the Pacific
Region at the top with 16.1, but the South Atlantic Region--Delaware, Maryland,
District of Columbia, Virginia, West Virginia, North Carolina, Georgia and Flor
ida--is in second place with 11. 4; the Mountain Region--Montana, Idaho, Wyoming,
Colorado, New Mexico, Arizona, Utah and Nevada--is in third place with 9.8. The
East North Central Region, which ranked second in actual number of cases, is in
fourth place on the basis of population with 9.6 per million. The incidence of bomb
ing is higher in large cities than in smaller cities and in unincorporated areas.
Cities with populations ranging between 100,000 and 250,000 exhibited the highest
rate with 23. 4'per million and cities of 250,000 or more in population were second
with 14.2. The rate for unincorporated areas was. 5.
For the reporting period--July, 1970 through June, 1971--a total of 195
bombing casualties was recorded. The greatest number of casualties, 130 injuries
and 10 deaths, was suffered by individuals who were neither public safety officials
1l.0r criminal bombe:rs. Twenty-six injuries and six deaths were reported for
,
! it
349
bombing suspects, while police personnel su.stained twenty-two injuries and one fatality.
, Although the PaCific Region ranked first in the number of bombing inCidents,
it ranked fourth in casualties--20 injuries and 5 deaths. The East North Central
Region ranked first in casualties (50) followed by West North Central Region (40) and Middle Atlantic R.egion (37).
Of the 1,550 incidents involving detonating or igniting bombs, 750 reported a total of $15,555,695 in property damage.
As a general rule, very few of the 1,858 reported incidents were preceded
by any form of a warning. Only 57 incidents (3.1 percent) were preceded by a
warning. Specifically, 41 of these were telephone warnings by males, 9 were tele-.
phone warnings by females, 2 were in the form of a notice to news media and 5
were contained in messages left or delivered to the scene.
The most frequent targets of bombing attacks were commercial or manu
facturing facilities which were struck 705 times, ReSidential properties ranked
second with 407; educational faCilities, third with 297; vehicles, fourth with 167;
recreational facilities, fifth with 140; and nonpolice governmental facilities, sixth
with 133. Other target groups, such as police facilities, transportation facilities,
military facilities, utilities, judicial facilities and miscellaneous and unknown, collectively accounted for 503 devices.
A complete and detailed breakdown of the 1,858 incidents and 2, 352 devices
by motive or intent is not POSSible, simply because the motive or intent could not
be determined in many cases. As a result, 764 incidents and 925 devices have been
placed in the unknown category. Of the classifiable motives, 338 devices and 263
incidents indicated racial protests. In addition, there were 205 incidents of juve
nile vandalism; 118 incidents of political protest; 101, revenge; 80, other protest;
70, public safety harassment; 51, anti-war protest; 41, labor disputes; and 165, all other.
The sudden and unexpected pattern of bombing in Seattle in recent years is
graphically revealed by the following statistics: In 1968 there were only 4 minor
explosions representing $8.00 in damages. In 1969, there were 32 explOSions, 17
major and 15 minor, representing $339,130 in damages; in addition, there were
129 bomb threats. In 1970, 41 explosions occurred, 23 major and 18 minor, result
ing in $101,132 in damages; there were 447 bomL threats. In 1971, there were 11
explosions, 2 major and 9 minor, causing $7, 10~damage; there were 286 bomb
threats. The statistical record of incendiary bombs during the past four ye&.rs is as follows: 1968, 56; 1969, 42; 1970, 21; and 1971, 11.
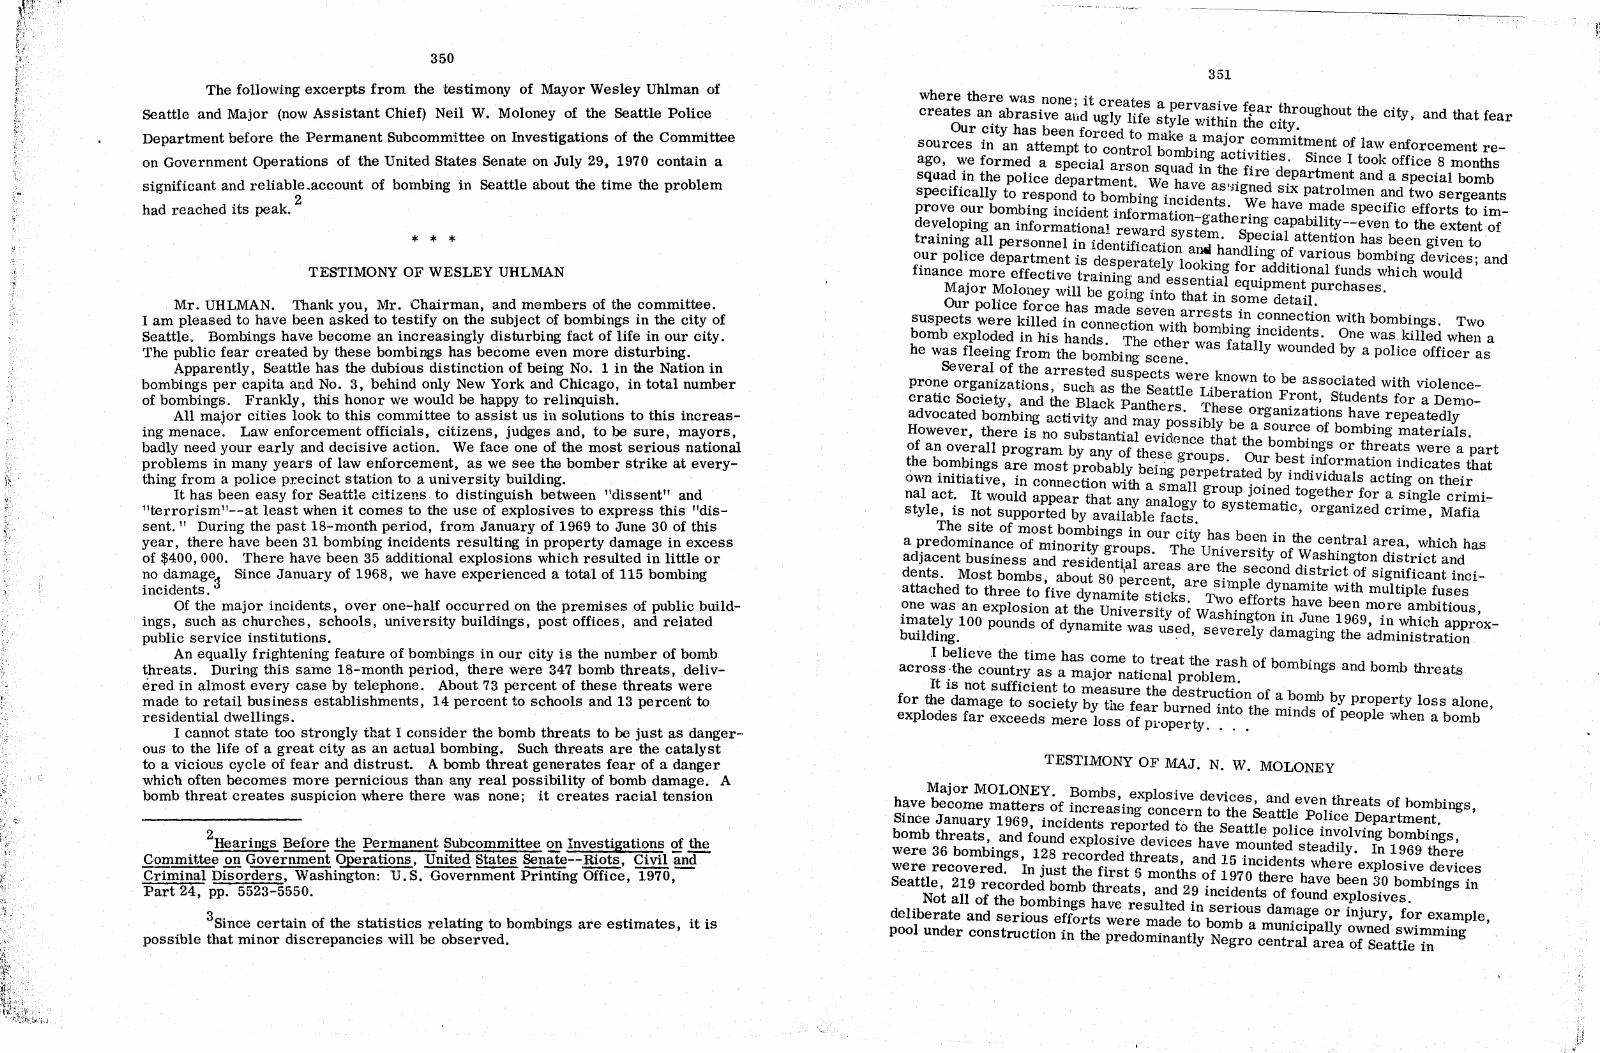
:~ .- ~'I
t.
:·"'1\ >-.. -.--~.---~>-.--.~ .. ~.-~.-.-->.---:'
350
The following excerpts from the testimony of Mayor Wesley Uhlman of
Seattle and Major (now Assistant Chief) Neil W. Moloney of the Seattle Police
Department before the Permanent Subcommittee on Investigations of the Committee
on Government Operations of the United States Senate on July 29, 1970 contain a
significant and reliable.account of bombing in Seattle about the time the problem
had reached its peak. 2
* * * TESTIMONY OF WESLEY UHLMAN
Mr. UHLMAN. Thank you, Mr. Chairman, and members of the committee. I am pleased to have been asked to testify on the subject of bombings in the city of Seattle, Bombings have become an increasingly disturbing fact of life in our city. The public fear created by these bombings has become even more disturbing.
Apparently, Seattle has the dubious distinction of being No. 1 in the Nation in bombings per capita and No.3, behind only New York and Chicago, in total number of bombings. Frankly, this honor we would be happy to relinquish.
All major cities look to this committee to assist us in solutions to this increasing menace. Law enforcement officials, citizens, judges and, to be sure, mayors, badly need your early and decisive action. We face one of the most serious national problems in many years of law enforcement, as we see the bomber strike at everything from a police precinct station to a university bUilding.
It has been easy for Seattle citizens to distinguish between Itdissent" and "terrorismll--at least when it comes to the use of explosives to express this "dissent." During the past 18-month period, from January of 1969 to June 30 of this year, there have been 31 bombing incidents resulting in property damage in excess of $400, 000. There have been 35 additional explosions which resulted in little or no damageg Since January of 1968, we have experienced a total of 115 bombing incidents.
Of the major incidents, over one-half occurred on the premises of public buildings, such as churches, schools, university buildings, post offices, and related public service institutions.
An equally frightening feature of bombings in our city is the number of bomb threats. During this same 18-month period, there were 347 bomb threats, delivered in almost every case by telephone. About 73 percent of these threats were made to retail business establishments, 14 percent to schools and 13 percent to residential dwellings.
I cannot state too strongly that I consider the bomb threats to be just as danger-' ous to the life of a great city as an actual bombing. Such threats are the catalyst to a vicious cycle of fear and distrust. A bomb threat generates fear of a danger which often becomes more pernicious than any real possibility of bomb damage. A bomb threat creates suspicion where there was none; it creates racial tension
2Hearings Before the Permanent Subcommittee ~ Investigati.ons 2! the Committee.Q!! Government Operations, United States Senate--~, Civil and Criminal Disorders, Washington: U. S. Government Printing Office, 1970, Part 24, pp. 5523-5550.
3Since certain of the statistics relating to bombings are estimates, it is possible that minor discrepancies will be observed.
351
where there was none; it creates a pervasi ve fe t ' creates an abrasive and ugly life st I 'thi tho ar ,hroughout the CIty, and that fear o 't h Y e WI n e Clty ur Cl y as been forced to make am' : sources in an attempt to control bomb' aJor, c,o~mltment of law enforcement re-ago, we formed a special arson s l~g actl~lties, Since I took office 8 months squad in the police department W q~d In th~, fIre d~partment and a special bomb specifically to respond to bomb' ~ ~~e aS~)lgned SIX patrolmen and two sergeants prove our bombing incident infol;!~~i~~:nts. 'V!e have ~~de specific efforts to im-developing an informationa~ rewa d t gathermg ,capablhty--even to the extent of training all personnel in id~ntif' r t . sys ~m. Sp~Clal attention has been given to o,ur police department is despe;~:e~~~ a k' ha~dhng o,f ,various bombing devices; and fmance more effective training and es~~nt~~1 or ,addItIonal funds which would
Major Moloney will be going into that in eqUlP~en~ purchases . Our police force has made seve s?me etall.
suspects were killed in connection w~t~rr6sts, In ?o~nection with bombings. Two bomb exploded in his hands. The th bombIng mCldents. One was killed when a he was fleeing from the bombing s~en~~ was atally wounded by a police officer as
Several of the arrested Suspects were k " prone organizations, such as the Seattle L'b now~ to be assocIated WIth violencecratic Society, and the Black Panthers 1 eratIOn F~on~, Students for a Demo-advocated bombing activity d . ,These orgamzatIOns have repeatedly However, there is no SUb~t:~ia~:~~~!~~b!h ~et: sourc~ of bombing materials. of an overall program by any of tho ., a e bombl?gs or threats were a part ~he bombings are most probably b::-
e groups. Our be,st ~~ormation indicates that
own initiative, in connection with a ~~perpetrat~d, by mdlvlduals acting on their nal act. It would a.ppear that an analoa11 group Jome~ togethe~ for a single crimistyle, is not supported by avail~le fa tgy to systematic, orgamzed crime, Mafia
Th 't f c s. e Sl e 0 most bombings in our c't h b ' a predominance of minorit rou SlY a,s ee,n m the central area, which has adjacent business and reSi~e~tiar a' The U~~erslty of Washington district and dents. Most bombs, about 80 perc~~:s :re ,e second di~tric~ of significant inciattached to three to five dynamite st' k re~mple dynamIte Wlth multiple fuses ?ne was an explosion at the Universi~c ~f o,effort~ have been more ambitious, Imately 100 pounds of dynamite was lrsed washmglton m Ju?e 1969, in which approx-building. ' ' severe y damagmg the administration
I believe the time has come to tre t th across ·the country as a major naticnat belrash of bombings and bomb threats
It' tuff" . pro em. IS no s lClent to measure the destructio f
for the damage to society by the fear burned i t ~; a ?O:b by property loss alone, explodes far exceeds mere loss of P' 'ope ty n 0 e mm s of people when a bomb
1. r ..
TESTIMONY OF MAJ. N. W. MOLONEY
Major MOLONEY. Bombs explosi d ' have become matters of increa~in conc;~ eVlCes, and even ,threats of bombings, Since January 1969 incidents g '. n to the Seattle Pohce Department. bomb threats, and found eXPlo:i:o~!~~c~s ~:v~eattle :~ice in~olving bombings, were 36 bombings, 128 recorded threats and 1 ~OU~l steadily. In 1969 there were recovered. In just the first 6 months of 1~71;~~dent~ where eX~losive ~evic~s Seattle, 219 recorded bomb threats and 29' 'd t e~~f ave been .,0 bombmgs 111
Not all of the bombings have re'sulted inl~Cl ,en so, ound explosives. deliberate and serious efforts were made to b:~~uS darr~a?e or injury, for example, pool under construction in the pre do min antI N a mUIDClpally owned swimming
y egro central area of Seattle in

,"
:., ,
352
November 1969, and again in January 1970: In both instances only superficial damage was done to the pool's foundation.
Several delibera,tely set explosions in the past year in Seattle have caused con-siderable damage; an explosion at the University of Washington in June of 1969, in which an estimated 100 pounds of dynamite was used, caused at least $300,000 dami:l.ge; $15, 000 camage was done to an apartment under construction on December 1, 1969, It is almpst impossible to assess the actual value (in terms of wages and lost production) due to these bombings or of the time expended in evacuating the many businesses and numerous schools which received bomb threats, In 1969 approximately 3, 000 persons had to be evacuated until threatened premises could be searched or explosive devices removed. During the first 6 months of 1970 approximately 1,200 persons were similarly inconvenienced.
Prior to 1969, bombs and related explosions were a relatively infrequent occurrence in Seattle. During the 5-year period from 1955 to 1960 only two dozen cases were reported to the Seattle police Department. Of those, a series of four in less than 3 years was related to a business rivalry between a local association of coin machine operatorl3 (pinball and music machines) and certain individuals who wished to wrest from the association more machhie locations. Even a city mayoralty candidate's car was damaged by one of these bombs. However, all of these bombings had certain characteristics in common; the 9xplosive used was dynamite, the explosion resulted from a lighted fuse, rather than from a mechanical detonating device, there appeared to have been care exercised in order that no lives be lost or endangered, comparatively small amounts of explosives were used, the bombs were hurriedly placed and no attempt was made to cause extensive damage or great monetary loss. Many investigative hours were expended in the investigation of these occurrences, but there was insufficient evidence on which to base
a criminal prosecution. It cannot be de~rled that a number of local bombings and related incidents have
been politically motivated. It is known that several of the persons responsible are, or have been, active participants in radical groups such as the Black Panthers, the Students for a Democratic Society, and the Seattle Liberation Front.
Building contractors engaged in federally funded projects have been prominent in the suspicions raised by the bombing activities involving construction sites. An injunction was in effect for a period of time early in 1970 enjoining the contractors from engaging in any violence or disrupting in any way the federally funded model cities program. "Minuteman" literature was left at the scene of a pipe bomb explosion at the Seattle Civic Center in February of 1969. A homemade black powder bomb complete with a timing device was detonated in May of 1969, just outside a building housing a military display at the Seattle Civic Center; damage (mostly glass breakage) was limited to about $600.
It is unknown what motivated the persons responsible for the bombing at the University of Washington Administration Building on June 29, 1969; the suspects have not as yet been identified. However, the university, like many others around the country, has been a target of very active antiwar activity because of the ROTC program and recruiting on campus by corporations with defense contracts.
A Seattle Gity Light substation was damaged by a dynamite explosion on November 12, 1969. That same night a five-stick dynamite bomb, which did not explode was found just outside a telephone company building, six blocks from the
City Light station. ' On November 19, 1969, three dynamite explosions in a half-hour period
occurred during the night in Seattle's predomi,nantly Negro central area. Approximately $3, 000 damage occurred in a building housing the Central Branch of Seattle Cr.)mmunity College; earlier there had been demonstrations led by the Black Student Union (BSU), protesting PlJliCie~. of the community college. A Safeway store
353
was damaged appreciably and two em 10 ee . , Inc. had refused to contribute money ~nd f s d
were Injured slightly; Safeway Stores,
pally owned swimming pool under const u O? to tl.~, Slack ];an~hers. A municicontractors had criticized the pro'ect b r ct10n wa~ da~~ed. shghtly, local building were being employed on the const;uctiO:~ause an lDsufflClent number of Negroes
In December 1969, considerable dama e f ' apar.tment, intended for 10w-inco7n g ro~ a dynamIte bomb occurred to an
predominantly Negro central are~ ;f~r~~ts, ~~ICh, was under construction in the housing a division of the model ~ities ea e. so 10 December 1969, an office mite explosion. program was severely damaged by a dyna-
In January 1970, a young activist cou 1 S'l SDS members, were appreh.,rij~,;~.~ ".' acin p ~ Ib as and Judith Bissell, both known RC?TC building at the UniverE'~"" ',f ;';{ . ~ a om un,der the steps of an Air Force ball each on charges of endr-;,\"'~i:, \~f~h~:~ton. ThIs c?uple late~ forfeited $25,000 rants are no\\; outstanding f<., ;)otil '1i'1 M' property WIth explOSIves. Bench war-them SDS members, the o.thE..' two li;:;3 . arch ~, 1970, four young men, two of a dynamite bomb which dam(';~d " ~'·.·S s~mptgl1~ers, were ar,re~ted after setting These same persons had been active in' os ff,l~e branch bmld10g and vehicle. and Seattle Liberatio.n Front So' f t~Cal pohtlCal demonstrations with the SDS in Chicago. at the Democrati~ con~n~~n.ese people were involved in the 1968 riots
On January 19, 1970, a dynamit b b on the Seattle University campus T~ c;;n e~ploded at the Liberal Arts Building observed thrfie Negro males run~in fe amage amounted to $2,200. Witnesses versity has been the object o.f di~tu gb rom ~le scene. This priva.te Catholic Uni-
On January 28 1970 a s r ances ead by the Black Student Union. damage as a result of a d~na~i:g~;;,~, ihe ~emple DeHirsh, sustained $3, 000
On March 20 1970 'b P ace at the front doors. Bush School which is a ~~::fee gi~~? fi~edl'~ith marbles was exploded at the Helen No threats had been made prior to theS~ o~,ocated on the edge of the central area. ever come to light. xP OS1On and no reason for the bombing has
The University of Washington th" ary 20, 197Q; two..dynamite bo.mbs w~~l e VIctIm O,f ano.ther explosio.n o.n Febru-construction site of the new Scho.ol'of AY ~~~ o.~Whlch,e~ploded, were placed at a little damage. Three days orio.r to thisrc
1 ~~. re i1mldlllg; fortunately, there was bomb under a corner of the Armo th a cI,lzen ,ound an unexploded gasoline t~e following month two homemad~Yd on ~ Umverslty of Was.hingt?ll campus and slderable damage to some parl"ed veh?~mlt~ ~om~s Io.aded WIth 1 mch nails did con-Police. " IC I3S e o.ngmg to. the UniverSity Security
The homes of two State legislators b th hit nantly Negro central area of SeattJ . ' ,,0 d w e and bo.th living in the predomi-explosions during the spring of 19./0' W11. e a~aged by separate dynamite bomb to. the ho.me of a State senator who h~s sr-;;:~~lmatelY $1, 000 damage was caused plans to run for election in his new distrbt ~oV~d t? another area of the city but placed at the front door of as. te repredentativ~'sP{1l19, ,1970, ~ dynamite bomb He does not plan to resume his p T '1 orne did conSIderable damage.
Following these two bomb' ,,1 lC~ career as a result of this act. homes of other politicalleade;~gSb~~ '~~ fersodllinel WI ere assigned to guard the weeks. ' ~~ll a e an oca, over a perio.d of several
• On the same night of the bomh' , f th S· ?ther serio.us bombings, all believ~~gt~ ha~e ~ate representative's ~lOme, three 10 Seattle's predominap4-1y Ne ro ce t"een, caused,by dynamIte, occurred imately $2, 000 damage was i;flicte~ ~:lt:~s;rlCt 10 a per10d of ~5 minutes. '. Approx~amage was inflicted on a real estate office o~::~~e PreS?yterla,n Church; $4,000-hng property primarily in the Ne 0 ' , y a whIte ,bus1l1essm.an hand-damage was done to a white-owne~r dl~~:~~~nt~~taarea tOf thd
e CIty; and a~out $2,000 r uran un er constructIOn.

" '.'
) ~ .
354
The telephone company again suffered about $2, 000 damfl.ges when another of its buildings was damaged by a dynamite explosion in June of this year. An attempt was made to damage another telephone company building during the same month by means of an incendiary device. The month before two public telephone booths were completely destroyed in south Seattle by dynamite bombs detonated 12 minutes apart.
Two cases in particular have been of special significance to the Seattle police Department in the first -half of 1970. The first of these involved the bombing of Fuson's Department Store on January 13, 1970. The store had been owned and operated by the same white business family, at the same location in the predominantly Negro central distrtct of Seattle for 50 years. On January 8, 1970, Fuson shot and killed a 19-year-old Negro male while this person was attempting to commit a robbery. The deceased's accomplice was wounded and later charged and convicted of attempted robbery. Mr. Fuson received telephone threats following the incident and police units were detailed to keep a surveillance on his store. The surveillance was discontinued after a few days, and on January 13, the store was bombed during the night. Damage to the store and to neighboring establishments was estimated at approximately $17,000. police protection of Mr. and Mrs. Fuson, their store and home, was continued until the end of February. 2,000 man-hours were expended in this effort. On May 18, 1970, Mr. and Mrs. Fuson filed suit against the city of Seattle, charging that insufficient effort was made to protect their property. Later, the Seattle police Department was advised that Mr. Fuson was moving his remaining stock and business out of the city of Seattle.
Seattle police received information in early May that ano'~her bomb would be detonated at the Hardcastle Realty. This same white-owned realty had been bombed on April 19, 1970. Officers were watching the premises when a young Negro male was seen to approach the building; the man set an object down at the front door and the officers could see the reflection of a flame as he attempted to light the fuse. He was ordered by the officers to stop, but ran from the scene. One of the offi{:ers ordered him to stop again and when he refused, the suspect was killed. He succeeded in lighting the fuse, but the bomb did not detonate. The device was found to consist of three sticks of dynamite, taped together with a fuse and blasting cap.
Further investigation of this case identified the deceased as Larry Eugene Ward, age 22, a discharged serviceman who had served in Vietnam, but who had also been arrested for burglary in Taeoma, Wash. , on March 19, 1970. He had admitted his complicity in this crime and on May 11, just 4 days before his death, he was convicted of burglary and sentenced to 3 years in prison, deferred on con-dition he not engage in further criminal activity.
The CHAIRMAN. Do I understand he was out on probation'? He had plQd
guilty to burglary? Major MOLONEY. He pled guilty to burglary and received a deferred sentence.
* * *
Mr. UHLMAN. At the risk of not sounding, and I hope I am not being demagogic, this is certainly one difficulty we have had in terms of dealing with these problems by the courts. We apprehended a young man with dynamite in the trunk of his car. He publicly stated his mission in life was to blow up the military recruiting station inside our city limits. This is what he stated his life purpose to be. He was convicted of possessing this dynamite, having been found in the trunk of his car and was given 6 months deferred sentence. He is on the streets again.
* * *
355
Major MOLONEY. Continuing the ft· Chair~an, the feelings amon the oun re eren:~e 0 .t?IS particul~r. case, Mr. very hIgh since the Ward Sho~ti y dgtr , mo ... o mIhtant black CItizens have run spa~e. at the coroner's inquest :;ic:~ollar~~ numbers of them !illed a~l available' deCISIon of three to two found that th ov.e. The coron~r's Jury, Wlth a split Considerable criticism has been level::o~~~-be .bomber dIed by criminal means. criminal charges were filed against th ~f' e Kmg County prosecutor because no
On July 3 1970 ad' e 0 lCer who shot Ward. the University' Fede;al S:~i~m~t:n~omb acco~mt,ed ~or more than $3,000 damage to ?y the Seattle Police Departr~ent ind~~:~e:~~ld:~~ m Seat,tle. I~or,mation received mg of Ward. This case is still unde" t~a t' s was m retahatlOn for the shoot-
I 'd r Inves Iga lOn nCl entally, since this statement . clipping from the BerkeJe
t Ba b was prepared, we have been supplied with a
g,roup of the Seattle Lib~r~tionr F'r:t ~nd~g~fund newspaper in, Berkel~y, that a hcular bombing. n a e are takmg credlt for thIS last par-
The CHAIRMAN. A little late t LiberatIon Front is. r, no now, I want you to tell us what this Seattle
Go ahead. Major MOLONEY. It is difficult t t' ,
?ccurred. in Seattle during the past yea~ ~:de~~~~~e Ithe varl~u~ bombings which have mformatIOn from confidential informa ts l' a f: SUSPlCIO?S based both upon clusions but it is difficult to prove the n and ,~O,glC dIrect attentlOn to certain conindiscriminate in some res cts e se Su~plCions. The attacks have seemed as more likely victims' bu:;es~:S t ~~r~a~n type~ of establishments have emerged the Black Panthers; sci-wols such as ~h~c U .av: r~ US~d the ~xtortion attempts of tensive ROTC program' and constru' ~Ve.LSI yo Washmgton which has an exdo not employ Negroes~-have all bee~It~~:~~:s engaged in Federal contracts which
Banks, as visible signs of "the t bI' h ' " damage as i:l. result of ev~r thin froes a ;s ment ha~e sustained considerable particularly vulnerable, a~, a; a r~u~~:s to d~~a~~te. Publ~c bui~dings seem security measures had to be taken ,P?SSI, e re,at ,earher thIS year, Police Depar.tment. During civil d~::~ pubhct~afety bUll~mg housing the Seattle crea$ed considerably. r ances ese securlty forces have been in-
Certain laws are in effect in the State of W h' . . posseSSion of an explosive device with inte t to as m'1t~n regardmg explosives: endangering life and ro rt b ,n use 1 o,r an unlawful purpose, by explosives are allPfel~y ~ff:n::~losives, a~: dama,gmg buildin~s or vehicles offenses var K' '. " e maxImum penalties for these , ~. ... eepmg or transportmg explosives in a manner prohibited b I IS a gross mIsdemeanor Since earl th' th y aw regarding the urchase ~f e . y, IS year ere has been stricter control careful record~ of amounts ~~\~s~:~Siol~~:~~d dealers are now required to keep
Obtai~~~~;e~~i~i~a~e~e~:: ~~~~l~~ t!~lc:;n;mite ille1ally
,used, in SeattJ,e has been
~~~~ ~:r~::,ite has often bee'n stored impr.:'pe';;;' o~o~:a~~~~~l~~:o:~~::ef!::' city.
legal owne;s :ree~~f~:~:n~ t::O~~~h~:~en ~f resptonsibility be placed upon the that certain minimum standards be set b l~ ef mos shecure manner possible and
Of . I Y aw or suc storage speCla concern to law enforcement . s th d I . th II'
which allows a subject to post bond and re 1. et Ie ay m e spe~dy trial process" th mam a arge over a perIOd of s I ';:~~ s;;r to teontinUally receive postponements in the trial date. The Sea~:ra teC:i~~ f::~i::::e~a~f e=~~:~s~e~:~:~!~o~:~:e~~I::dereUcpeonntlYth~ Plr.ovige pro-• elr Ives.
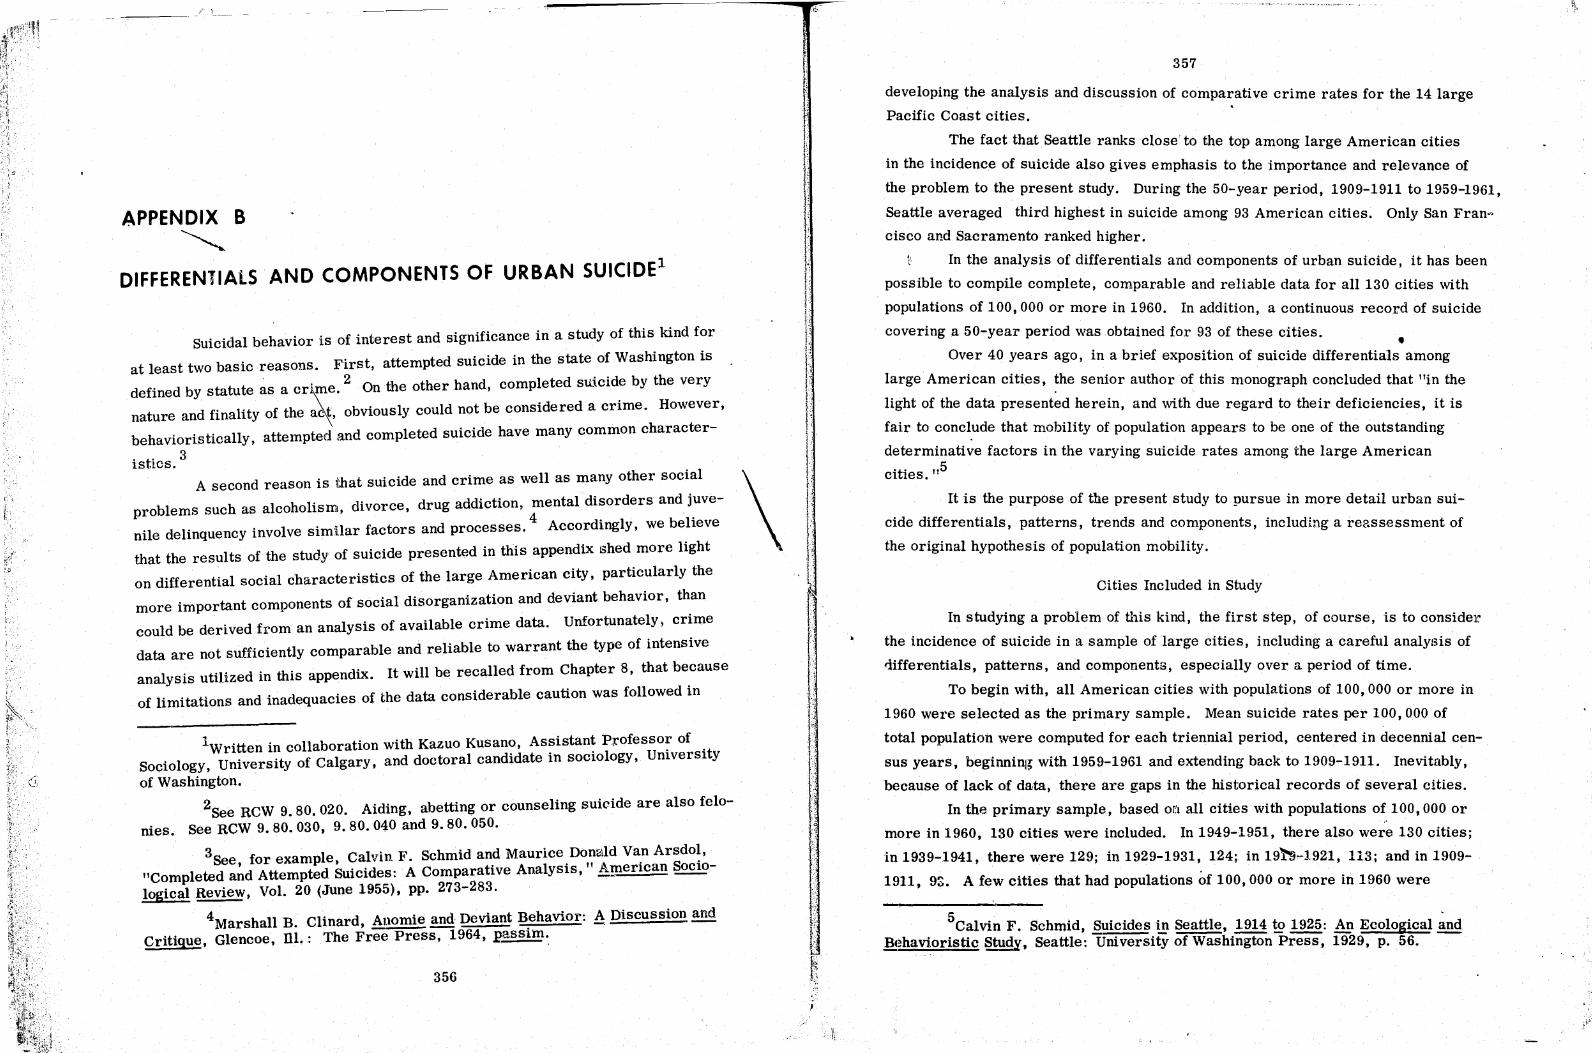
f.,
APPENDIX B ~.
DIFFERENTIALS AND COMPONENTS OF URBAN SUICIDE1
Suicidal behavior is of interest and significance in a study of this kind for
at least two basic reasons. First, attempted suicide in the state of Washington is
defined by statute ~s a crime. 2 On the other hand, completed su,i.cide by the very
nature and finality of the ~, obviously could not be considered a crime. However,
behavioristically, attempted and completed suicide have many common character-
. t. 3 IS ;lCS.
A second reason is that suicide and crime as well as many other social
problems such as alcoholism, divorce, drug addiction, mental disorders and juve
nile delinquency involve simHar factors and processes. 4 Accordingly, we believe
that the results of the study of suicide presented in this appendix shed more light
on differential social characteristics of the large American city, particularly the
more important components of social disorganization and deviant behavior, than
could be derived from an analySiS of available crime data. Unfortunately, crime
data are not sufficiently comparable and reliable to warrant the type of intensive
analysis utilized in this appendix. It will be recalled from Chapter 8, that because
of limitations and inadequacies of the data considerable caution was followed in
lWritten in collaboration with Kazuo Kusano, Assistant Pl'ofessor of Sociology, University of Calgary, and doctoral candidate in sociology, University
of Washington.
2See RCW 9.80.020. Aiding, abetting or counseling suicide are also felonies. See RCW 9.80.030, 9.80.040 and 9.80.050.
3See , for example, Calvin F. Schmid an~ Maurice.Do,~2\ld Va.n Arsdo~, "Completed and Attempted Suicides: A Comparative AnalysIs, A!llerlCan SOClOlogical Review, Vol. 20 (June 1955), pp. 273-283.
4Marshall B. Clinard, Anomie and Deviant Behavior: A Discussion and Critique, Glencoe, Dl.: The Free-preBs, 1964, 'p'assim~
356
\
ji
l~ I; ( Ie I: I;
I \', I I'
357
developing the analysis and discussion of comparative crime rates for the 14 large
Pacific Coast cities. .
The fact that Seattle ranks close to the top among large American cities
in the incidence of suicide also gives emphasis to the importance and relevance of
the problem to the present study. During the 50-year period, 1909-1911 to 1959-1961
Seattle averaged third highest in suicide among 93 American cities. Only San Fran·~
cisco and Sacramento ranked higher.
t In the analysis of differentials and components of urban suicide, it has been
possible to compile complete, comparable and reliable data for all 130 cities with
populations of 100,000 or more in 1960. In addition, a continuous record of suicide
covering a 50-year period was obtained for 93 of these cities. • Over 40 years ago, in a brief exposition of suicide differentials among
large American cities, the senior author of this monograph concluded that "in the
light of the data presented herein, and with due regard to their deficiencies, it is
fair to concl.ude that mobility of population appears to be one of the outstanding
determinative factors in the varying suicide rates among the large American
cities. ,,5
It is the purpose of the present study to pursue in more detail urban sui
cide differentials, patterns, trends and components, including a reassessment of
the original hypothesis of population mobility.
Cities Included in Study
In studying a problem of this kind, the first step, of course, is to consider
the incidence of suicide in a sample of large cities, including a careful analysis of
<lifferentials, patterns, and components, especially over a period of time.
To begin with, all American cities with populations of 100,000 or more in
1960 were selected as the primary sample. Mean suicide rates per 100,000 of
total population were computed for each triennial period, centered in decennial cen
sus years, beginninl~ with 1959-1961 and extending back to 1909-1911. Inevitably,
because of lack of data, there are gaps in the historical records of several cities.
In the primary sample, based on all cities with populations of 100,000 or
more in 1960, 130 cities were included. In 1949-1951, there also wer~ 130 cities;
in 1939-1941, there were 129; in 1929-1931, 124; in 19l'9-1921, 113; and in 1909-
1911, 9:). A few cities that had populations of 100,000 or more in 1960 were
5calvin F. Schmid, Suicides gt Seattle, 1914!g 1925: An Ecological ~nd Behavioristic Study, Seattle: University of Washington Press, 1929, p. 56. --
,

["
", :.r';'
358
virtually nonexistent in 1910, and even later. Furthermore, although every effort
was m:,tde to obtain suicide data from state and local registrars for earlier years,
there were many instances where data were not available. It will be observed that
complete records covering the entire fifty years have been compiled for 93 cities.
In a longitudinal study in which the politically defined city is used as the
basic unit of analysiS I serious questions arise concerning the comparability of the
units not only with respect to a given point in time but, more especially, over a
period of time. It is obvious that for any given point in time, the cities in our
sample vary markedly in population size, territorial size and in many other char
acteristics. Furthermore, when comparisons are made over a period of half a
century, differences become more pronounced and complicated. Even if it were
considered more desirable to use some unit of analysis defined in terms of "natural
area" rather than "political area" it would be extremely difficult, if not impossible
to do so because of the paucity of data, as well as the fact that reporting systems
for vital statistics and other data are organized on the basis of clearly defined
administrative areas as determined by political and governmental structure. The
various cities as they have been selected for this study do possess specifiC, tradi-
tional, well-known and meaningful identities. Furthermore, in this connection it is pertinent to point out that in a paral-
lel examination of political-city, urbanized-area and SMSA data centered aroun.d
1960, Hadden and Borgatta concluded "that gen~ra1izations about urban phenomena
should be relatively constant independently of the type of data used. ,,6
Variation of Suicide: A Preliminary Summary
For the three-year period, 1909-1961, Table B: I shows that the incidence
of suicide ranges from 6.6 per 100,000 of total population for Knoxville and Provi
dence, to 28.1 for San Francisco. The median rate is 10.4 and the mean rate,
11.3. There are 52 cities, or 40.0 percent, with rates under 10.0 per 100,000 of
population, one with a rate of over 25.0, two with rates between 20.0 and 24.9, and
14, or 10.8 percent, with rates between 15.0 and 19.9. The ten highest ranking
cities for the 1959-1961 period are San FranciSCO (28.1), Sacramento (21. 9),
Miami (20.2), Oakland (19.8), Pasadena (19.8), st. Petersburg (19.8), Seattle
(19.7), Glendale (19.5h Los Angeles (19.2) and Long Beach (18. 'n.
6 Jeffrey K. Hadden and Edgar F. Borgatta, American Cities, Their ~ Ch~racteristics, Chicago: Rand-McNally, 1964.
I
I I '" w
....l
'" ;::
~
'" I '" U'I
~ 0 ... ~
I
'" ,. c
'" 0,
.~ '" c ~ '" " c. Co ~
l? .5
::l " .. {!. ~ ... .. 0 0
0 c c c 0 c::. 0 C 0 ;; ~
... .... " 0 c.
'" III " " .~ ,w I.' ... '" '" "
";
"" Co .~ 0 tJ c.. .~ ... , '" V) .. ,
';
'" " .... ... u " .. tJ .... .. " e <
"" " '"
359
+- ~ 0 ~'J 4- r- "~~i-C\I of-
....; 00.0 ~ (...: C\l ..... C\t C'J C'i
CC:-l-~~~ ~ 01-0 ~ CI.._C'J
+-O ..... i-M
l':O 0 -i C't "I
4-00-;"""(.:1
c-i 00 t.d "1M -
,... r:: ~ ,.... 6H-----------------------~ ~I I
o c:') .... co 00::+ l~ 0 l-l- t-- ..... C') I~ C') 0 ~ (;0 C-I C\J 00 ..... 0000<:') c,:I 'X.IM~ l- 00 Qoom .... O..,.l-!N:1)
M~M"';~ ...... C\I~ __ "';ddc-.iooj _ ...... -..... M:-;~r;-.:M - ............ -1-
l":.xr~~t...! ........ .,... .... ~~~...;.; ...... ..., .............. L~ ~ ~ 0 eN ~N-C\t-
~o~~c-) C\1 ........ N
M ? c) d ,-:-............
., '2 " ,... c::
§ I r~----~--~--------------------------------------~------------------~ "" ~ ~ * "'!
... .... O::OC)-N
... ~ e., C") M I';" C": M C\I 0 00 C!)
c:: ¢oc)c\ld o"':t":-:e:l """' ...... -~ -.... -
-a os
-:,c,:)OCl~
t..:t-!t...!~...: ............ 0C\10000
~l":~~l~ ...... C':II~ ~ N
~Q~Q-r _ .... .-.(-
O ..... ~t-O ...... Nc;,~C\I "'~O')oo~
~~l":MM o~:r:";'~ ~c;""';""';c:n o",:~::c.:n ~ ........ ~ C'l ............. .... .... _ .... _....e
,... c:: o:l
~ ~r1--------------------------------------------------~ ..., " ~C!)C\1C<'O
o t": ci ~ c:) ~=:~c;~ l"-:r t-OQ C\! C\1. ~ l: c: M t- t- l.~ 0::- t- C\' M "1' ...... ~ C'\Jt--C')o C')~C'\JI~C'\J ~C)C)~o
o l~ ai L,,! 0 <1 r:: c:) ,..: l"; N a:;) 0""': ~ 0 ai
.......... .....""" .... - ~ . . . . ...... C') .... Oe-.1 .-I ...... ...., ....
t-ooC):3 oo ........ ,... ~ cl"'; ~ l": .... ..... ................ or.Qooc-ioo ,... ~ r-o:"l""'C')O ............ ....,,..1,....

···'·~~~~\:r~~\~~~-:;:~~T~--"'~;"~~~~··:·~:"~' .. "'~ ", '
<:: D
TABLE B:r
Suicide Rates per 100,000 of Total popu1ationw American Cities with Populations of 100,000 or )Iorl: in 1960: 1909-11 to 1959-61 (Continued)
1960 1959-1961 1949-1951 1939-1941 1929-1931 1919-1921 City Population
Rank Rate Rank Rate Rank Rate Rnni" Rate Rank Rate Rank
Greensboro, N. C. 99 9.8 81 ;;.8 128 9.6 118 18.7 55 1.7 113 Hammond, Ind. . • • • • 112 8.1 108 1l.0 70 10.4 116 15.5 D4 14.8 41 Hartlord, Conn. · ... 77 9.7 83 11.6 37 13.8 78 14.4 98 17.4 24 lIonolulu, Hawail · .. 43 8. ;; 103 10.7' 79 13.6 54 23.3 23 24.6- 6 Houston, Te~. · . . . ~
7 9.8 81 12.9 40 15.1 61 21.0 36 14.7 43
Indianapolis, rnd. • • • • 26 13.2 29 14.4 28 17.5 34 21. 9 30 15.3 36 Jackson, Miss. • . • • . 84 8.8 96 9.5 94 8.0 124 11.7 116 24.8 5 Jacksonvllle, Fla. · .. 61 9.01 86 12.4 48 15.4 5'; 18.5 58 13.1 58 Jersey City, N.J. · .. 47 8.0 110 6.0 110 11.1 105 1l.0 120 9.8 95 Kansas City, Kans. . • . 98 11. 2 48 10.8 76 14.8 64 14.8 91 14.2 47 .
Kansas City, lila. · .. 27 13.3 28 11.4 60 16.4 43 22.4 28 20.4 14 Kno~vil\e, Tenn. · ... 111 6.6 129 10.2 85 7.8 126 14.8 91 9.0 99 Lan~ing, lIIich. · ... 118 10.;; 63 11. 6 37 9.3 119 18.3 61 10.:5 87 Lint:oln, Nebr •.•.•. 95 12.4 34 6.6< 121 11.8 97 12.7 110 9.7 97 Little Rock, Ark. . . .. 117 12.4 34 13.7- 31 14.8 64 20.8 39 t '"
Long Beach, Calif. · .. 35 18.7 10 20.;; 8 22.3 16 20.4 42 24.6 6 Los Angeles, Calif. . . • 3 19.2 9 19.3 11 27.3 4 25.1 16 24.3 10 Louis\ ille, K~·. • • . . . 31 11.8 40 11.4 60 14.6 69 18.3 61 15.9 34 LUbbock, Tex. .. . • • . 94 7.8 114 7.4 11;; 15~ 7 31 t ... t ... Madison, Wis. · .... 96 11.6 41 12.;; 46 17.3 35 29.9 8 7.0 109
lIIemphis, Tenn. · ... 22 8.1 108 5.B 128 8.1 123 18.3 61 12.1 71 1I1iaml, Fla. . . . . . . 44 20.2 3 1;;.6 23 18.8 27 21 •• 32 18.6- 19 1Ililwaukee, Wis. · ... 11 10.2 70 10.7 79 16.6 41 20.1 45 15.0 40 Minneapolis, lIIinn. . • . 2;; 12.8 31 11. 3 63 16.8 38 24.8 17 17.2 28 Mobile. Ala .•.••.. 38 6 .• 127 5.9 127 9.3 119 13.2 86 S.8 100
MontogomElry, Ala. . • . 89 11.4 44 7.8 112 10.7 111 12.6 111 9.2 98 Nash"il\e, Tenn. · ... 73 11. 1 51 11. 1 68 14.1 73 21.2 35 10.1 92 New Bedford, Mass. .. 12;; 7.2 121 11.9 ;;3 13.0 87 18.1 64 10.7 85 New Haven, Conn. · .. 81 8.6 101 11.2 65 18.9 26 16.0 78 14.4 45 New Orleans, La. · .. 1;; 6.7 127 6.;; 124 11.4 101 16.0 78 12.5 65
New York, N. Y. · " .. 1 9.4 86 10.3 82 15.7 31 20.1 4;; 13.2 55 Newark, N. J. · .... 30 10.2 70 12<1 50 14.1 73 20.3 43 14.2 47 Newport News, Va. • • . 108 7.3 119 13.4 34 6.3 127 8.7 123 10.3 90 Niagara Falls, N. Y. .. 126 7.8 114 7.7 114 13.2 86 le.6 122 7.2 108 Norfolk, Va. • . . • • . 41 10.3 68 11.2 65 l:5.7 51 16.2 i7 11.5 75
Oakland, Calif. . • . . • 33 19.8 4 16.4 19 23.7 15 26.9 12 23.7 11 Oklahoma City, Okla •.. 37 lQ.8 59 9.2 97 11.7 99 15.6 82 19.7· 17 Omaha, Nebr. · .... 42 9.3 89 12.7" 42 22.3 16 31.2 6 20.4 14 Pasadena, Calif. · ... 10;; 19.8 4 16.3 20 24.0 14 21.5 33 12. ;; 65 Paterson. N.J .•..•. 85 10.0 77 13.8 22 15.8 49 23.3 23 13.2 55
Peoria, Ill. ......... 123 16.2 13 12.2 49 15.5 56 "., t 43 17.1 29 Philadelphia, Pa. • • . • 4 10.1 75 8.4 106 13.9 77 17.2 71 12.5 65 Phoeni.'<, Ariz. . • . . • 29 11.6 41 19.7 10 27.0 5 38.1 4 t ... Pittsburgh, Pa. 16 10.8 ;;9 10.8 76 11.0 108 1-1.5 96 11.2 80 Portland, Ore. . • • • . 32 1-1.3 20 19.3 12 24.4 11 31.0 7 18.2 21
-- ---- ---- ~-----
L-____ ~.
L- ________ .- - - - - -
~ Before 1937 cases allocated according to place of occurrencc. a(tcl' that date. according to residence.
,"-- ."
".""6' 1<,- ... ,,,.; :.:t..:" .. ,
, , -----..~~~.--~----------------
L "
,.~
i~ . ---; \...
'III ...
• ~~ • .I.,
• .. ----.
• •• • ~'
"
~ >""~\ . \
-/
1909-19'.1
Rate Rank
6.3* 9,~
27.1 11· 24.3 2!!
t '" t '"
28.5 13 t '"
17.3 , 59 19.7 46 17.8 55
30.2 12 17.4 58 13.9 75 15.2 67
t '"
28.1" 15 31.8 10 17.9 53
t '" 20.9 31
23.9 25 t ...
20.7 33 19.9 42 12.9 80
8.7 89 14.5 72 11.4 84 18.2 50 17.1 60
17.6 56 20.2 39
t ... 32.8 7 19.8 44
32.6 8 t '"
31.4 11 7.7 91
20.2 39
t ... 17.9 53
t ... 20.5 35 26.9 18
-
, - ~'-""'- - ~-- - -, - ~,------.-
l
CI' O'l o
! I I'
I
...
~

... ,.,..
()
1~:,"
.. ~: .. ~u_·o li-, "~
....
/, ~i~6i' City Population
Rank
Portsmouth, Va. · ...... 106 Providence, R. I. . . • . 56 Richmond, Va. . . . . . 52 Ro('nester, N. Y. ....... 38 Rockford, Ill. ....... 96
Sacramento, Calif. · .. 63 st. Louis, Mo. . ••.. 10 St. Paul, Minn. · ..... 40 St. Petersburg, Fla. · . 69 Salt Lake City, Utah · . 65
San Antonio, Tex. · .. 17 San Diego, Calif. . . . . 18 San Francisco, Calif. • . 12 San Jose, Calif. · .... 57 Santa Ana, Calif. · .. 130
Savannah, Ga. · ........ 82 Scranton,Pa. ........ 113 Seattle, Wash. · ....... 19 Shreveport, La. · ..... 76 South Bend, Ind. · ..... 91
Spokane, Wash. ....... 68 Springfield, Mass. · .. 72 Syracuse, N. Y. ....... 53 Tacoma, Wash. · .... 83 Tampa, Fla ••••... 48
Toledo, Ohio ...••. 39 Topeka, Kan. · ....... 100 Torrance, Calif. · ..... 128 Trenton, N.J. · ....... 107 Tucson, Ariz. · ....... 54
Tulsa, . Okla. ......... 50 Utica, N. Y. ........ 129 Washington, D. C. · .. 9 Waterbury, Conn. . . . . 121 Wichita, Kans. · .... 51
Wichita Falls, Tex. . . . 127 Winston-Salem, N. C. · . 115 Wor ter, Mass. · .. 66 Yonkers, N. Y. · ...... 64 Youngstown, Ohio . . . • 75
.J.,., . ...,..':
TABLE B:I Suicide Rates per 100,000 of Total population'
., \.
,;,."',., « ,,~.,.· .... '.n'._-'~'-"
American Cities with Populations of 100,000 or More in 1960: 1909-11 to 1959-61 (Continued)
1959-1961 1949-1951 1939-1941 1929-1931 1919-1S21
Rate Rank Rate Rank Rate R!lIlk Rate Rank Rate Rank
9.9 79 8.3 107 12.5 93 13.9 103 9.8 95 6.6 129 9.6* 92 I 10.6 113 13.3 106 11. 2 80
13.8 25 12.7 42 15.9 4G 19.7 47 8.7 102 11.2 48 12.1 50 18.6 28 18.5 58 12.1 71 14.2 21 13.3 35 20.5 21 14.8 91 15.7 35
21. 9 2 21.6 6 31.5 2 43.7 2 27.3 3 12.6 33 10.9 72 14.5 73 14.5 70 24.5 19 8.2 107 8.0 110 10.5 ~·14 14.6 94 13.1 58
19.8 4 21.7 5 24.7 10 17.3 69 t . .. 11.1 51 10.2* 85 16.2 44 15.2 86 13.0 62
9.2 92 9.8 89 14.4 72 18.6 57 13.4 53 14.1. 22 17.6 16 22.3 16 44.6 1 38.1 1 28.1 1 24.7 1 32.3 1 38.9 3 33.0 2 14.5 19 17.1 18 21.4 19 16.8 74 24.4 9 14.6 18 23.1* 2 19.8 25 20.9 38 15.1 39
7.6 U6 13.1 37 J.5.6 54 19.2 49 10.0 93 9.3 89 8.2 109 10.7 Ul 10.9 121 8.5 104
19.7 7 23.1 2 31.4 3 33.9 5 22.0 12 10.6 62 6.6 121 14.9 63 18.7 55 11.4 78 10.8 59 16.1 21 20.4 22 28.2 10 14.1 50
15.2 17 17.9 1:5 24.3 13 27.7 11 24.6 6 11. 5 43 9.0 100 11.1 105 15.6 82 12.3 68 8.8 96 10.7 79 13.4 8'1 14.5 97 12.0 73
16.9· 12 22.5 4 24.-1 11 29.0 9 18.6 19 15.3 16 18.2 14 18.4 30 25.4 15 17.4 24
12.8 31 14.7 25 18.1 31 17.6 66 17.8 23 10.9 56 12. 7 42 14.7 67 13.5 105 17.3 26 10.2 70 9.0* 100 t . .. t ... t . .. 8.8 96 ll.5 59 11.2 104 22.7 27 16.2 32
13.9 23 20.9* 7 25.2 9 25.6 14 t . .. 10.2 70 10.0 88 15.2 60 14.4 98 t '" 11.3 46 10.8 76 12.6 91 11.5 118 8.5 104 10.2 70 12.6 45 20.3 23 23.6 22 14.2 47 6.8 126 9.6 92 11.8 97 14.4 90 12.7 63
13.9 23 13.7 31 15.4 57 15.9 81 17.1 29 7.2 121 4.4 130 12.6 91 t ... l' .,. 8.4 104 8.7 104 5.8 128 11.1 119 5.5 III 9.6 85 8.2 108 11.4 101 11.6 117 11.1 83 7.S 113 8.5 105 11.9 96 I 11.9 114 6.3 110 8.0 110 9.7 91 12.5 93 17. '1 67 10.3 90
-_.- --- -L-
'I
II Before 1937 cases allocated itccording to place of occurrence, after that daie, according to residence. • Based on two-year period. t Data not available.
_ ... j' .... - ..
:\ \ I
1909-1911
Rate Rank
t . .. 16.2 65 12.0 83 20.6 34
t . .. 39.5 2
I 18.7 9 14.1 73
t . .. 27.3 16
22.4 29 38.7 3 45.6 1 24.2 23
t '"
13.8 77 10.0 86 34.0 6
t . .. 19.9 42
23.6 2'1 18.0 51 19.2 47 28.3 14
t ... 24.1 24
t . ... t . ..
14.1 73 t . .. t ...
12.5 82 26.5 20 18.7 48 15.2 67
1'- -~r --.-':'[ <- ~:'.-
I t . ...
9.4 8S, 10.0 .81> 15.2 ~.:r.
.-::'--;"', ! • .:;
,;:l-' ''''''fJ''-:~ -, "'>.~:1..
.\ . ~)'
c,., 0) , .~ ~1
.) ,
."" '. )i
H
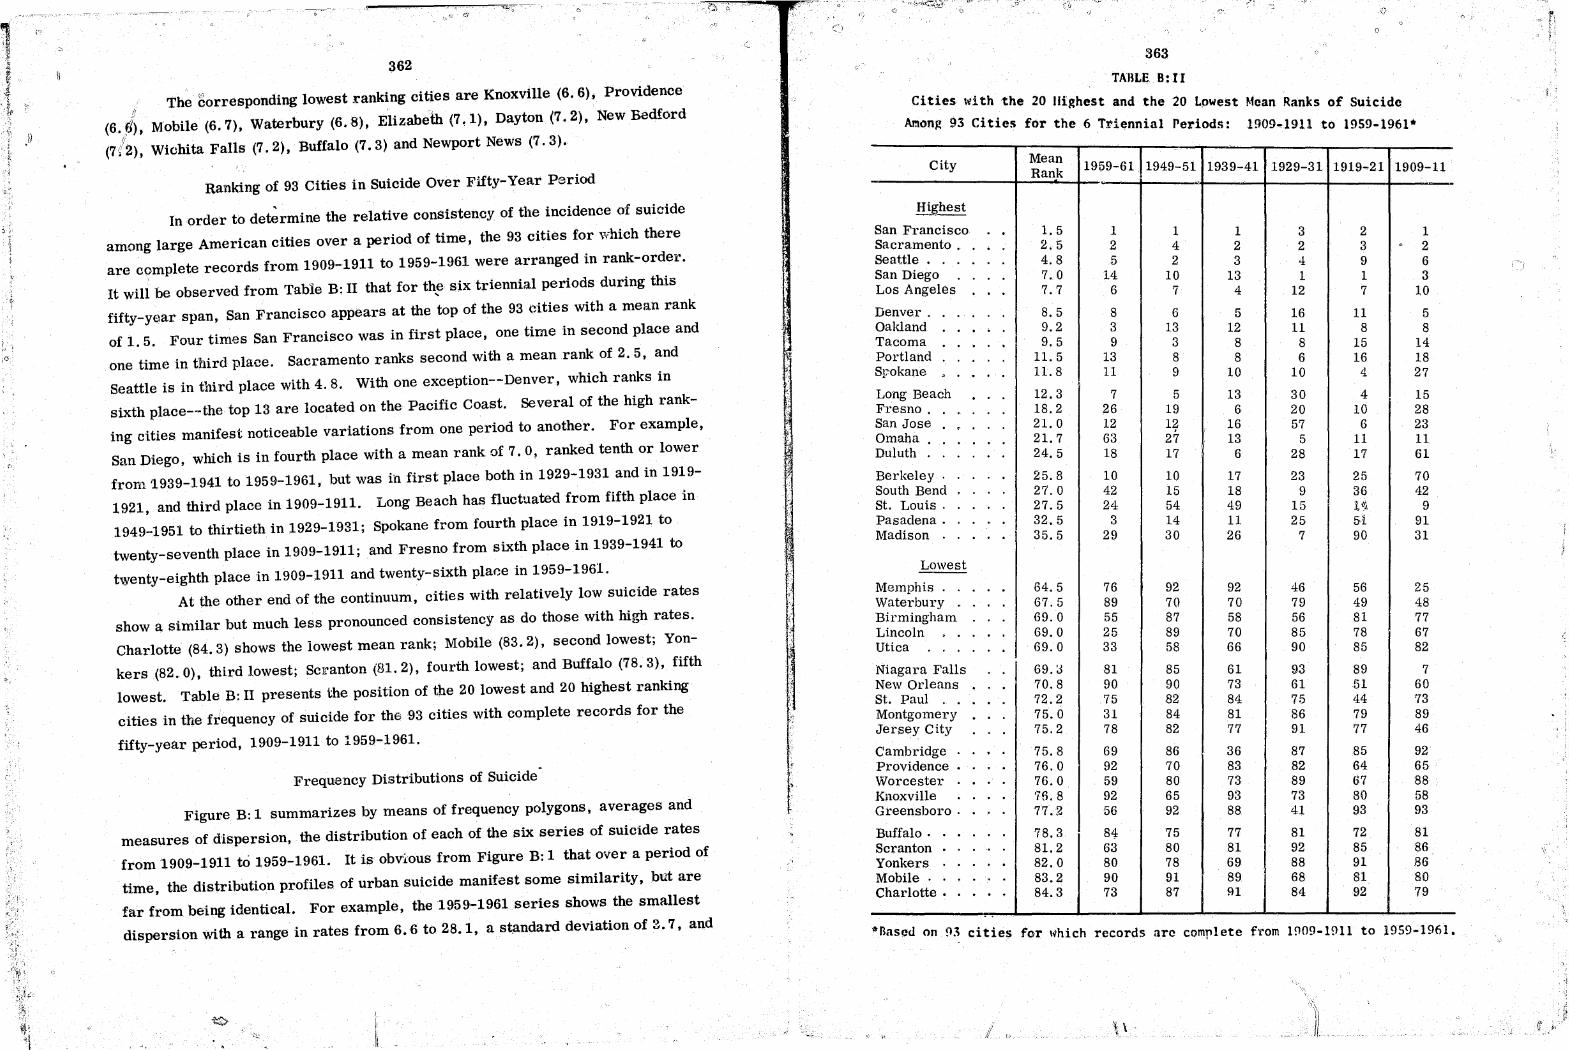
o.
, , :'" '~
~. -~-.. -. "
362
The corresponding lowest ranking cities are Knoxville (6.6), Providence II
(6.6), Mobile (6.7), waterbury (6.8), Elizabelh (7,1), Dayton (7.2), New Bedford
(7(2), Wichita Falls (7.2), Buffalo (7.3) and Newport News (7.3).
Ranking of 93 Cities in suicide Over Fifty-Year Period ,
In order to determine the relative consistency of the incidence of suicide
among large American cities over a period of time, the 93 cities for \vhich there
are complete records from 1909-1911 to 1959-1961 were arranged in rank-order.
It will be observed from Table B: II that for the six triennial periods during this .. fifty-year span, San Francisco appears at the top of the 93 ('!ities with a mean rank
of 1. 5. Four times San Francisco was in first place, one time in second place and
one time in third place. Sacramento ranks second with a mean rank of 2.5, and
Seattle is in third place with 4. 8. With one exception--Denver, which ranks in
sixth place--the top 13 are located on the Pacific Coast. Several of the high rank
ing cities manifest noticeable variations from one period to another. For example,
San Diego, which is in fourth place with a mean rank of 7. 0 ~ ranked tenth or lower
from '1939-1941 to 1959-1961, but was in first place both in 1929-1931 and in 1919-
1921, and third place in 1909-1911. Long Beach has fluctuated from fifth place in
1949-1951 to thirtieth in 1929-1931; Spokane from fourth place in 1919-1921 to
twenty-seventh place in 1909-1911; and Fresno from sixth place in 1939-1941 to
twenty-eighth place in 1909-1911 and twenty-sixth place in 1959-1961.
At the other end of the continuum, cities with relatively low suicide rates
show a similar but much less pronounced consistency as do those with high rates.
Charlotte (84.3) shows the lowest mean rank; Mobile (83.2), second lowest; Yon
kers (82.0), third lowest; Scranton (81. 2), fourth lowest; and Buffalo (78.3), fifth
lowest. Table B: II presents the position of the 20 lowest and 20 highest ranking
cities in the frequency of suicide for the 93 cities with complete records for the
fifty-year period, 1909-1911 to 1959-1961.
Frequency Distributions of Suicide
Figure B: 1 summarizes by means of frequency polygons, averages and
measures of dispersion, the distribution of each of the six series of suicide rates
from 1909-1911 to 1959-1961. It is obvious from Figure B: 1 that over a period of
time, the distribution profiles of urban suicide manifest some similarity, but are
far from being identical. For example, the 1959-1961 series shows the smallest
dispersion with a range in rates from 6.6 to 28.1, a st.andard deviation of 3.7, and
r
.::~
363
TABLE. B: II
o
Cities with the 20 lIi frhest and the 20 Lpwest to ~1ean Ranks of Suicide
Arnon~ 93 Cities for the 6 Triennial Periods: 1909-1911 to 1959-1961*
City Mean 1959-61 11949-51 Rank 1939-41 1929-31 1919-21 1909-11
"
Highest
San Francisco . 1.5 1 1 1 3 2 1 Sacramento . 2.5 2 4 2 2 3 < 2 Seattle. 4.8 5 2 3 4: 9 6 San Diego 7.0 14 10 13 1 1 3 Los Angeles 7.7 6 7 4 12 7 10
Denver. 8.5 8 6 5 16 11 5 Oakland · 9.2 3 13 12 11 8 8 Tacoma 9.5 9 3 8 8 15 14 Portland 11. 5 13 8 8 6 16 18 Spokane , · 11. 8 11 9 10 10 4. 27
Long Beach · 12.3 7 5 13 30 4 15 Fresno. 18.2 26 19 6 20 10 28 San Jose < 21. 0 12 I? 16 57 6 23 Omaha. 21. 7 63 27 13 5 Duluth 24.5 18 r.
11 11 17 6 28 17 61
Berkeley 25.8 10 10 17 23 25 70 South Bend 27.0 42 15 18 9 36 42 St. Louis. 27.5 24 54 49 15 lilt 9 Pasadena. 32.5 3 14 11 25 51 91 Madison 35.5 29 30 26 r;
I 90 31
Lowest
Memphis. 64.5 76 92 92 46 56 25 Waterbury 67.5 89 70 70 79 49 48 Birmingham 69.0 55 87 58 56 81 77 Lincoln 69.0 25 89 70 85 78 67 Utica 69.0 33 58 66 90 85 82
Niagara Falls I 69.:3 81 85 61 93 89 7 New Orleans 70.8 90 90 73 61 51 60 St. Paul · 72.2 75 82 84 75 44 73 Montgomery · 75.0 31 84 81 86 79 89 Jersey City 75.2 78 82 77 91 77 46
Cambridge . 75.8 69 86 36 87 85 92 Providence · 76.0 92 70 83 82 64 65 Worcester 76.0 59 80 73 89 67 88 Knoxville '/5.8 92 65 93 73 80 58 Greensboro. 77.2 56 92 88 41 93 93
Buffalo. · 78.3 8';1: 75 77 81 72 81 Scranton . 81. 2 63 80 81 92 85 86 Yonkers 82.0 80 78 69 88 91 86 Mobile· 83.2 90 91 89 68 81 80 Charlotte. . 84.3 73 87 91 84 92 79
..
·Rascd on 93 cities for I-lhich records arc complete from 1909-1911 to 1959-1961.
i J/ f>
Ii '. I, :
! , i

o I-~ ~
I
0-o 0-~
•• V) W I-« a:: w Q ..-U -:l V)
u.. o z o --~ .... V) -Q
'364'
I'
I
~ 11'1
... I")
1")., ... 1")
L--"+---+---t-- 0. NO.ll -!---+--\..'
0.' 11'1
11'1 .... o ., 11'1 I")
Njjjj>
~Z\U
~~-:-;;---
11'1 ....
o I")
11'1 N
0 N
o
z 0 ~
« ...i ::; Q..
0 Q..
0 0 0 0 0
{'
i:
I "
f ~
'.
tj ~ Q)
~ ...... ~
365
a coefficient of variation of 32. 7 percent. In 1919-1921, the range was 1. 7 to 38.1,
the standard deViation was 5.6, and the coefficient of variation, 39.6 percell.t. The
mean and median rates, respectively, for 1959-1961 were 11.3 and 10.4, as com
pared to 20.2 and 19.4 in 1909-1911. The corresponding measures for the depres
sion period of 1929-1931 were also high with a mean of 19.1 and a median of 18.3.
Suicide by Geographic DiViSion
Table B: III and Figure B:2 portray trends and patterns of urban suicide
in a gf:Jographical context. Unweighted means of suicide rates for each of the six
TABLE B:III
Distribution of Suicide Rates
Cities with Populations of 100,000 or Hore in 1960
by Geographic Division: 1909-11 to 1959-61
Division 1959-61 1949-51 1939-41
N x.* N - X* N X* Total . · • 130 11.3 130 12.0 129 15.6
New England . • • 10 8.6 10 10.2 10 13.6 !l-Hddle Atlantic · • 19 9.3 19 10.6 19 13.0 East North Centra!. :N 10.8 24 I1.S 24 14.9 West North Central. 11 11.6 11 11.4 11 15.8 South Atlantic · • 16 11.5 16 12.4 16 14.6 Ea~t South Central. 9 9.S 9 8.6 9 11.1 West South Central. 17 9.6 17 9.0 17 14.1 Mountain . • . . · 5 14.0 5 16.0 5 21.8 Pacifict • . . . • 19 16.5 19 17.9 IS 23.1
1929-31 1919-21 1909-11 Division ... , N X* N X* N X~
Total • · · 124 19.1 113 14.4 93 20.2 New England . · · 10 14.il l 10 12.6 10 16.8 Middle Atlantic · · . 19 16.4 19 11.3 19 17.4 flast North Central. "4 ~ 18 8 ! 23 12.S 21 20.9 .. . ", OK
West North Central. 11 l<'~ --. ~ 10 16,,6 9 21.4 ~""'\~ ·l So' 'th Atlantic . . 16 17.6/ 14 10.9 9 15.6 East South Central • 9 15.8 9 12.9 7 15.6
West South Central. 1(2 17.6 9 15.4 2 19.8 ~.fot!ntain . . . • . 5 25.9 2 16.7 2 31.0 Pacifid ~ • • . . ll8 26.4 I 17 22.5 14 28.5 -=8I!J!'It_
*Unweighted Mean. tIncludes Alaska al1d Hawaii.
l \

* ' .... ~
I
0-In 0-.... 0 .... .... ....
I
0-0 0-.... •• V)
z 0 -V) -> -c u -:J: c.. <t a: C) 0 w C)
>-a:a w Q -U -;:) V)
z « a:a ~
-::- ...... -
III-eiel
c' 15-lIto61
'''-115:6'
15:-6Z6,~ •••
,J" r-----
36.6
III-U5el
li-e"el
'''-155:11'
IE-liZ!! I
IZ-1I161
, , , ,J __ ~,,,,"J'-'''--
------,-1 ...
,..----, , i :
I .... :I: 04; ~ '" .... IX , w::l ..... /3 0Z I "'w , U
1S1-1I'i!!1
••• ,.-11"61
•••• ,.-6E61
le-lS .. el
1'i-6"61
'''-65:6'
IE-6ZIII
IZ- 61151
II -110111
•••• ,E-6ZIII -Z-N"I +< I I I
!oJ
12-61111 :E
11I-6li61
15-6"'1
'''-6E61
1£"6Z61
IZ- 11161
\1-&061
.,,.. .. on~..,N·-Z + .... + .. +++~
:E
... '" 0 ~
'" 0 0 0 0
0 0
..... 0 VI
z 0 ;:: c( ..... ::l IL 0 .:.. :r =: :; II)
w ... U
COl 0-
*
---C-;I~· -,.,..,......,...._~- -- -~.~- .. -- -- ----
C"I
~ r 4)
~ t,\ ..... r..
367
triennial periods, 1909-1911 to 1959-1961, were computed for cities located in
each of the nine Geographic Divisions as defined'by the United States Bureau of the ...
Census. The differences between the averages for all cities and the avera.ges for
cities in each of the Geographic Divisions were used as indices of rank, as well as
for trends over time. For example,darge cities in the New England Geographic
Division rank consistently belo~ the national average in suicide, while cities in
the Pacific Geographic Divisio~ invariably rank above the national average in SUi_if
cide. A further examination of Figure B:2 shows that in addition to the New Eng
land Geographic DiviSion, the Middle Atlantic and East South Central Divisions
ranked uniformly below the national average, and with only one exception each,
East North Central and West South Central show rates lower than the average for
the entire (~ountry. Like the Pacific Division, the frequency of urban suicide in
the Mountain Divi.sion itl conspicuously higher than the national average .
Intercorrelation of Suicide for Six Triennial Series
In a further effort to measure trends and patterns of urban suicide over a
period of time, 15 intercorrelatlons were derived for the six triennial series of
rates from 1909-1911 to 1959-1961. Figure B:3 and Table B: IV present in detail
the results of this analysis. Again, a pronounc\':'jd consistency runs through the·
patterns of urban suicide over a long period of time. All of the coefficients are
positive. The lowest ccefficient of correlation is between the 1959-1961 and 1909-
1911 series, I' = .510. The highest is between the 1949-1951 and 1939-1941 se}l.'ies,
I' = .769. Generally, of course, the sl}orter the period between any two serie(.'),
TABLE I3:IV
Intercorrelations of Suicide Rates
Cities \'lith Pgpulations of 100.000 or Hore in 1960: 1909-11 to 1959-61
Triennial
Period 1959-61 1949-51 1939-41 1929-31 1919-21 1909-11 ,
~-
1959,·61 · · · -- .724 .728 .559 .592 .S10
1949-51 · · · -- .769 .631 .593 .609
1939-41 · · · -- .719 .652 .595
1929-31 · " · -- .660 .615
1919-21 · · · -- .730
1909-11 · · · --

.... ~
I
0-LI\ 0-.... 0 I-.... ....
I
0-0 0--•• en Wi I-<t ~
w' e -u -;:) '" u. 0 Z 0 -I-<t -' w ~ ~
0 ~ <II
U '. " ... ~ W I-Z -
L'
ooO'OtB Uti H'f'1iI tt-6161
OOC'OOI Ud U.,lI It"AUt
" II ;;'
" "
368 t 1/
II
000'001 114 u.. It-6Ut
" " 000'001 Ud u..... It"6161
~~~mm~mm~nn~~
iii " ...
" " N N 05»0'001 114 u.,. 1I"60At
,~ d ~ g ~ei ... > -0 0_ .00
'" :il !!Ie:; z z ~Ci rE ... 0 Z III C III ~ Z ... .., '" If>
'" .. !:! u .., III .. en u 0 -~ N a: !i:!
0 ... m c
~ z '" .. fl 0 P=l Q '" ~ !II Q) Q
~ Z ~ .. ~ :;: If>
! 0 a ....
... 0 ~ I-III Z .. '" u :IE ..
;;; a: u .. .. ... ~ m If>
'" '" If>
~ j .. N . ., ... 0 Z :>-.. 0 ... c z c ... .. )( ...
. 1········/· :;:: ,/~,
I
t' l'
369
the higher the coefficients of correlation, and obviously, the longer the Period, the
lower the coefficients of correlation. Thera ~rre.a few exceptions to this rule, such
as the relatively high correlation (r = • 728) fo~ the 1959-1961 and 1939-).941 series .
Suicide and Population Mobility
In an attempt to determine with f;ome degree of specificity the various fac
tors associated with the incidence of urban suicide, 30 variables reflecting social~
eccmomic, educational and demographic conditions were selected for analysis. A
complete list of these variables is included in Table B: V.
Two forms of multivariate analysis were applied, namely regression
analysis and factor analysis. Stepwise regression, in which a sequence of multlple
regression equations are derived in a stepwise manner seemed particularly appro
priate, since it is possible to gauge the incremental importance of each independent
variable by its influence on R as well as on R2. At each step, one variable is added
to the regression, the added variable being the one which makes the greatest T'educ
tion in the error sum of squares. 7 Table B: V presents the more salient r€Bt1!ts of
the regression analysis. It will be observed that a mobility index--number of hotels.
motels and tourist courts per 100,000 of population--stands out with considerable
prominence. Another mobility index--proportion of residents living in same house
in 1960 as in 1955--and a relatively less direct index of mobility--population change
between 1950 and 1960--are included in the top five independent variables. "Over
crowding"--units with 1. 01 or more persons per room--and median age of popula
tion are the other two variables among the first five. For suicide and the first five
variables, R = .727 and R2 = .528. When the remaining 23 variables are added, 2
R = . 826 and R =. 682.
The same sE!'ries of variables, including suicide, were factor analyzed by
the principal axes method. Factor analysis possesses two special advantages. The
first is parsimony: It can reduce a large number of interrelated variables to a rela
tively small number of independent factors. The second advantage is in pro\l;ding
a means for discovering underlying unities. The first ~€ven factors extracted were
7W. J. Dixon (ed.), BMD, Biomedical Computer Programs, Los Angeles: University of California Health Services Computing Facility. School of Medicine, 1964; R. I. Jennrich and P. F. Sampson, "Application of Stepwise RegreSSion to Non-linear Estimation," Technometrics, Vol. 10 (February 1968), pp. 63-72; R. A. Gordon, "Issues in the Ecological Study of Delinquency, " American Sociological Review, Vol. 32 (Decem,ber 1967), pp. 927-944; R. A. Gordon, "Issues in Multiple Regression, II Ameri£!!! Journal q! Socjology, Vol. 73 (March 1968), pp. 592-616.

I
i ! ~. j i
I f
! A
o
/' i ··"te,
370
11 (I
retained and rotated orthogonally to simple structure. Also, the factor loadings
were normalized.
,TARtE Il:V
~'u.1 Uple Correlation Coefficients between Suicide and 30 other Variahles
Derived According to Stepwise }1ul tiple Rer,ression Techniques
130 Cities: 1~59-61
* Var. Incre-
Independent Variables No. R R2 ment R2
Hotels, Motels, per 100,000 · · · · · 15 .536 .288 .288 Units, 1. 01 or more persons ,per room · 5 .638 .407 .119 Residence, same 1960 as 1955 . · 13 .666 .443 .036 Median Age . . · . . · · · · · · · · · 11 .714 .509 .066 Population Change, 1950-60 . · 12 .727 .528 .019
Median Income . . · · · · · · 16 .744 .554 .026 Housing Units, One-Unit structure · · · 28 .761 .579 .025 Vacant Units for Rent. 27 .782 .612 .033 Population Density · . · · · " 1 .790 .624 .012 Median Monthly Rent , 18 .797 .635 ,011
Home Equipment Index · , 30 .802 .644 .009 Unemployed in Labor Force · · · 3 .807 .651 .007
~
Employed in Education · · · 22 .811 .658 .007 Employed, Mfg. L~urable Goods · · · 24 .813 .661 .003 Nonwhite Population .' · · 7 .815 .664 .003
Foreign-Born Population · · · · · · · · · 8 .816 .666 .002 Living in Group Quarters · · 21 .817 .668 .002 Migrants, Different County · · , 14 .819 .671 .003 College Graduates , . · 23 .820 ,673 .002 Native- Born, Foreign or Mixed Parentage 9 .822 .675 .002
65 Years and Over 4
.823 .677 .002 , · 6 Employed, Mfg. Non-Durable Goods 25 .824 .679 " 002 Males, 18 and Over · 10 .824 .679 .000 Age. of City . . . · . · · 29 .824 .680 .001 Median Grade Completed · · · · · · 20 .825 .680 .000
0
Less than 5 Years of School 4 .825 .681 .001 V\.~hite Collar Occupation · · · · · · 19 .826 .681 .000 J!"lamily Income, Under $3,000 2 .826 .682 ,001
* Variables 17 (Median Value, Owner-Occupied Units) and 26 (Employed, Wholesale and Retail Trade) not included because F-level or tolerance insufficient for further computation.
T ! .1
371
Suicide appears in two of the factors, namely, Factor III and Factor V.
The Significance of suicide in Factor III is sharp'and explicit, but in Factor V. it
lacks clarity and prominence. Rather, age manifests itself as an important dimim
sion in Factor V. The particular configurations of Factors In and V as well as
those for five other factors are presented in Table B: VI.
"i\nLF. 8:\'1
Summa!';.' Description of Factors Showing Positive and Negative I.oading"
Suicide lind :10 Other Socioeconomic anel Demographic Variahles. 130 Cities: 1!l5p·61
Variable
Factor I
Vacant Units for Rent • Housing Units, One-Unit Structul'e population Density Index, Home Equipment Age of City
Foreign-Born . • • • • • . • • • • Employed, Wholeallie and RetaH Trade Median Value, Owner-Occupied Units Native-Born, Foreign or MLxed Parentage Median Age • • • ••
Median Grade Completed •. Population Increase, 1950-1960 Migrantll, Different COWlty • Nonwhite Population . . . Unemployed in Labor ForC)C .
Factor 11
Median Income, •• '" Family Income, Under $3,000 Median Monthiy Rllnt • Less than 5 Years of School . Employed, Mfg, Durable Goods
Median Value, OWner-Occupied Units • Units, 1.01 or More Persons per Room Empl<:lyed, Wholesale and Retail Trade Nonwhite Population Median Grade Completed •
Native-Born, Foreign or !\fixed parentage ,Index, Homo Equipment • Males, 18 and Over •• • Population Increase, 1950-1960
Factor 111
Hotels, Motels, Etc. per 100,000 Suicide Rate , . • • • , • • • • Employed, Mfg. Nondurable Goods Residence, Same in 1960 as 1955. , Migrants, Different County
population Increase, 1950-1960 Employed, Wholesale and Retail Trade . Age of City
Var. Factor Loading No, Posiw Nega-
27 28
1 30 29
8 26 17
9 11
20 12 14
7 11
16 2
18 4
24
17 5
26 '1
20
9 30 10 12
15 31 25 13 14
12 26 29
tive tive
.960
.894
.719
.689
.583
.511
.427
.356
.302
.966
,925
.677
.647
.417
.392
.374
.370
.324
.917
.820
.655
.588
.539
,921
.856
.641
.371
.365 .357
.955
.717
.508
.498
.426
,718 .704
.452
Variable
Median Grade Completed , White Collar Occupations
Factor IV
college Graduates . • Employed in Education , • White Collar Occupations Unemployed in Labor Force Median Grade Completed .
Employed, IVIfg. Durable Goods Living in Group Quarters Migrants, DlIferent County • • Residence, Same in 1960 as 1955 Median ValUe, Owner-Occupied Units
Less than 5 Years of School
Factor V
65 Years and Over . MedianAge • • Units, 1.01 or More Persons pcr Room population Increase, 1950-1960 • Suicide Rate
Residence, Same in 1960 as 1955 Less than 5 Years of Schoo1 Males, 18 and Over , Age of City • Nonwhite Population
Migrants, Different County .
Factor VI
Living in GrouP Quarters Males, 18 and Over • Employed, Mfg. Nondurable Goods Employed in Education , Migrants, Different County
Factor VII
Nonwhit~ Population
Factor Loading Var, . No. P(,)si- Nega-
20 19
23 22 19 3
20
24 • 21
14 13 17
4
G 11
5 12 31
13 4
10 29
7
14
21 10 25 22 14
tiv,e !ive
.407
.382
,758
.653
.371
.317
.914 ,820
.514
,488
,445
.378
,963 .914 .840
.722
.461
.452
,321
.791
.627
.465
.457
.361
.359
.841
.730
.368 ,332
.738 Native-Born, Foreign or Mixed Parentage
7 9 8 3
.702
.623
.492
.402
Foreign-Born . ,. • Unemployed in Labor Force •. • Employed, Mfg. Nondurabl~ Goods _--1.._...1-_--1.. __ 25
* Only Factor Loadings of .300 or higher are inlliuded in this tabulation.
The mobility component, represented by three indices, variables 15, 13
and 14 and a less direct index of mobility expressed as population change by vari
able 12, are notably significant in Factor III. Two industrial indices--percentage
of employment in manufacturing producing nondurable goods such as food and

--- -------~~~~-7
372
beverages, textile-mill products, rubber goods, apparel, leather and printing-
and employment in wholesale and retail trade also are significant. Age of city-
measured from the first decade that a city reached a population of 50, OOO--and
socioeconomic status as reflected by median grade completed and by white collar
occupations comprise the t~ree remaining va:riables in Factor In. The fact that a mobility index--residence same in 1960 as in 1955--indi
cates a Significant positive loading (.488) in Factor V may seem contradictory, but
actually the primary connotation of Factor V is age. Suicide and, parti.cularly,
mobility are of subSidiary Significance. In Factor V the variable, 65 years of age
a.nd over, ranks highest with a loading of .914, and median age ranks second high
est with a positive loading of .820. Accordingly, in interpreting the loadings in
Factor V emphasis should be placed primarily on age and, secondarily, on the re
lationship of age to suicide.
Both the multiple regression and factor analyses clearly indicate that the
incidence of suicide in the large American city is associated with population mobil
ity. In addition, of course, but much less definitive and significant, are other
componed.ts such as (1) age composition of population, (2) socioeconomic status of
population, (3) race, (4) overcrowding, (5) age of city and (6) industrial character
istics of city.
Mobility of Population and Suicide
A Brief Interpretation
Although there is a demonstrable association between urban suicide and
population mobility, any attempt to present a reasonably complete and precise ex
plication of the mechanism involved would be indeed a difficult and complicated
task. The moving about of people has a profound impact on individual behavior,
interpersonal relationships and on community structure. Mobility implies bewil
dering change, the making and breaking of social ties. Mobility vastly increases , social contacts, mental stimulation and new experiences while at the same time it
tends to break down traditional relationships and emancipates the individual from
the requirem.ents and restraints of custom and social norms. The avoidance of
social responsibilities and involvements, as weI! as isolation, detachment, anomie
and alienation may \Oe frequent concomitants. The standards and forces of commu
nity control and restraint may tend to weaken and diSintegrate. There is a lack of
identity with others and a lack of group integration, consiste;:1cy, stability and cohe
Sion. In a milieu of this kind the individual may become detached from his social moorings, and as a consequence become demoralized and may commit suicide.
~
n 1
I
// u
373
It is important to recognize that mobility varies wit-Jot sex, age, marit3~"
status, occupation and other characteristics. Yonilg adults, especially single
males, are the most mobile of any group. Occupationally, farm laborers and
other seasonal workers show the highest rate of mobility. A large proportion of
migratory workers are older adult males among whom the incidence ofJ3uic~de is
extraordinarily high. Most are "homeless, voteless anqJwomRnless. II Mobility is
a striking characteristic of present-day American society, and for millions of.
people it is a way of life. Geographically, the West is the most mobile of all re
gions.
Certainly, the relatively high incidence of suicide in all of the Pacific
Coast cities can.be accounted for, at least in part, by highly mobile populations I
including large numbers of agricultural and other seasonal workers.. It is in the
anonymous, impersonal milieus of the central business districts and skid roads
of San Francisco, Seattle and other Pacific Coast cities, where large numbers of
drifters, migratory workers, tourists, nomads and deviants gravitate, that the
frequency of suicide reaches its peak.
Summary and Conclusions
In order to analyze differentials, trends and components of urban suicide
in the United States, data were compiled for all cities wi~~ populations of 100,000
or more in 1960 for six triennial periods, covering a fifty-year period from 1909-
1911 to 1959-1961.
In an effort to determine the relative consistency and constancy of urban
patterns of suicide during a span of five decades, the following analyses were
made: (1) ranking of cities according to the frequency of suicide for each of the
six triennial periods from 1909-1911 to 1959-1961; (2) compilation and analysiS of
frequency distributions of suicide for all of th2 larger cities; (3) analysis of trends
and patterns of suicide for all of the larger cities according to their location by
Geographic Division, and (4) computation of intercorrelations among each series
of urban sui.cide rates.
As a basis for testing the relationship between suicide and mobility of
population as well as other factor6, suicide rates and 30 other social, economic,
educational and de1nog~phic variables were analyzed by means r1 multiple regres
sion and factor analysis -techniqUes. The results of thess analY8~~ clearly indi
cated an association between suicide and population mobility. In addition, there
are other less significant factors which require further exploration.

r·-
;;;i
i , "- ."

"