TSX: PPL; NYSE: PBA TSX: VSN - Veresen Inc. · PDF fileTSX: PPL; NYSE: PBA TSX: VSN....
19
TSX: PPL; NYSE: PBA TSX: VSN
Transcript of TSX: PPL; NYSE: PBA TSX: VSN - Veresen Inc. · PDF fileTSX: PPL; NYSE: PBA TSX: VSN....

TSX: PPL; NYSE: PBA
TSX: VSN

Forward-looking statements and information
This presentation is for information purposes only and is not intended to, and should not be construed to constitute, an offer to sell or the solicitation of an offer to buy, securities of Pembina Pipeline Corporation ("Pembina"). This
presentation and its contents should not be construed, under any circumstances, as investment, tax or legal advice. Any person accepting delivery of this presentation acknowledges the need to conduct their own thorough investigation
into Pembina and its activities before considering any investment in its securities.
This presentation contains certain forward-looking statements and information that are based on Pembina's expectations, estimates, projections and assumptions in light of its experience and its perception of historical trends as well as
current market conditions and perceived business opportunities. In some cases, forward-looking information can be identified by terminology such as "expects", "will", "would", "anticipates", "plans", "estimates", "develop", "intends",
"potential", "continue", "could", "create", and similar expressions suggesting future events or future performance.
In particular, this presentation contains forward-looking statements, including certain financial outlooks, pertaining to, without limitation: the proposed acquisition of Veresen Inc (the "Transaction"), including the expected closing date and
the anticipated benefits of the Transaction to Pembina's and Veresen's securityholders, the expected size and processing capabilities of the combined company, as well as anticipated synergies (including strategic integration and
diversification opportunities, tax benefits and the accretion to cash flow of Pembina), financial results related to and growth opportunities associated with the assets acquired pursuant to the Transaction, future dividends which may be
declared on Pembina's common shares and any future dividend payment date; the ongoing utilization and expansions of and additions to Pembina's business and asset base, the timing and anticipated receipt of required regulatory,
court and securityholder approvals for the Transaction, expectations regarding the combined company's anticipated credit rating, the composition of Pembina's board of directors following closing of the Transaction and expectations
regarding future commodity market supply, demand and pricing and supply and demand for hydrocarbon and derivatives services.
Undue reliance should not be placed on these forward-looking statements and information as they are based on assumptions made by Pembina as of the date hereof regarding, among other things, the ability of the parties to satisfy the
conditions to closing of the Transaction in a timely manner, that favourable growth parameters continue to exist in respect of current and future growth projects (including the ability to finance such projects on favorable terms), future
levels of oil and natural gas development, potential revenue and cash flow enhancement; future cash flows, with respect to Pembina's dividends: prevailing commodity prices, margins and exchange rates, that Pembina's businesses will
continue to achieve sustainable financial results and that the combined company's future results of operations will be consistent with past performance of Pembina and Veresen and management expectations in relation thereto, the
availability and sources of capital, operating costs, ongoing utilization and future expansion for the combined company, the ability to reach required commercial agreements, and the ability to obtain required regulatory approvals.
While Pembina believes the expectations and assumptions reflected in these forward-looking statements are reasonable as of the date hereof, there can be no assurance that they will prove to be correct. Forward-looking statements
are subject to known and unknown risks and uncertainties which may cause actual performance and financial results to differ materially from the results expressed or implied, including but not limited to: the ability of the parties to
receive, in a timely manner, the necessary regulatory, court, securityholder, stock exchange and any other third-party approvals, including but not limited to the receipt of applicable competition approvals; the ability of the parties to
satisfy, in a timely manner, the other conditions to the closing of the Transaction; the failure to realize the anticipated benefits or synergies of the Transaction following closing due to integration issues or otherwise and expectations and
assumptions concerning, among other things: customer demand for the combined company's services, commodity prices and interest and foreign exchange rates, planned synergies, capital efficiencies and cost-savings, applicable tax
laws, future production rates, the sufficiency of budgeted capital expenditures in carrying out planned activities, the impact of competitive entities and pricing; reliance on key industry partners, alliances and agreements; the strength and
operations of the oil and natural gas industry and related commodity prices; the regulatory environment and the ability to obtain regulatory approvals; fluctuations in operating results; the availability and cost of labour and other materials;
the ability to finance projects on advantageous terms; and tax laws and tax treatment. In addition, the closing of the Transaction may not be completed, or may be delayed if the parties' respective conditions to the closing of the
Transaction, including the timely receipt of all necessary regulatory approvals, are not satisfied on the anticipated timelines or at all. Accordingly, there is a risk that the Transaction will not be completed within the anticipated time, on the
terms currently proposed or at all.
Additional information on these factors as well as other risks that could impact Pembina's operational and financial results are contained in Pembina's Annual Information Form and Management's Discussion and Analysis for the year
ended December 31, 2016, and described in our public filings available in Canada at www.sedar.com and in the United States at www.sec.gov. Readers are cautioned that this list of risk factors should not be construed as exhaustive.
The forward-looking statements contained in this document speak only as of the date of this document. Except as expressly required by applicable securities laws, Pembina and its subsidiaries assume no obligation to update forward-
looking statements and information should circumstances or management's expectations, estimates, projections or assumptions change. The forward-looking statements contained in this document are expressly qualified by this
cautionary statement. Readers are cautioned that management of Pembina approved the financial outlooks contained herein as of the date of this presentation. The purpose of the financial outlooks contained herein is to give the reader
an indication of the value of Pembina's current and anticipated growth projects, including with respect to the acquisition of assets pursuant to the Transaction. Readers should be cautioned that the information contained in the financial
outlooks contained herein may not be appropriate for other purposes.
In this presentation, we refer to certain financial measures such as adjusted EBITDA, adjusted cash flow from operating activities, total enterprise value and operating margin, among others that are not determined in accordance with
International Financial Reporting Standards ("Canadian GAAP"). Management believes these non-GAAP and additional GAAP measures provide an indication of Pembina's ability to generate liquidity through cash flow from operating
activities and the expected effect of growth projects on Pembina's current business, as well as the anticipated effect of integration of Pembina's and Veresen's businesses as a result of the Transaction. These measures may also be
used by investors and analysts for assessing financial performance and for the purpose of valuing an issuer, including calculating financial and leverage ratios. The information contained herein with respect to non-GAAP and additional
GAAP measures may not be appropriate for other purposes. For more information about these non-GAAP and additional GAAP measures, see the Appendix to this presentation. All financial information is expressed in Canadian dollars
unless otherwise specified.2

Transaction overview
3
Transaction creates a premier, integrated North American energy infrastructure company
Transaction
Overview
• Offer to acquire all outstanding shares of Veresen in exchange for 0.4287 common shares of Pembina
or $18.65 in cash for each Veresen share, subject to pro ration(1)
• 21.8% premium to Veresen's 20-day weighted average share price of $15.31
Financial
Highlights
• Increases Pembina's long-term, fee-for-service revenue 85%+ fee-for-service over the long term
• Combined company is expected to maintain strong BBB investment grade credit rating
• Increases Pembina's enterprise value by 45% ~$33 BB
• Combined 2018 adjusted EBITDA of $2.55 - $2.75 BB
• Expected annual synergies of $75 - $100 MM and accretive to Pembina's ACFPS in 2018
• Upon close of the transaction Pembina will increase its divided by 5.9% ($2.16 per share annualized)
• Combined near term growth projects of ~$6 BB and unsecured growth projects of ~$20 BB
Regulatory /
Timing
• Expected closing in Q3 – Q4 2017(2), subject to customary regulatory approvals required in Canada and U.S.
• Pembina's senior executive will lead combined company, with Mick Dilger as President and CEO
• Three of Veresen directors will be appointed to Pembina's Board at closing
(1) Subject to proration, a maximum of approximately 99.5 million Pembina common shares to be issued and maximum cash consideration of approximately $1.523 billion.(2) Subject to Veresen's shareholder approval.See "Forward-looking statements and information."
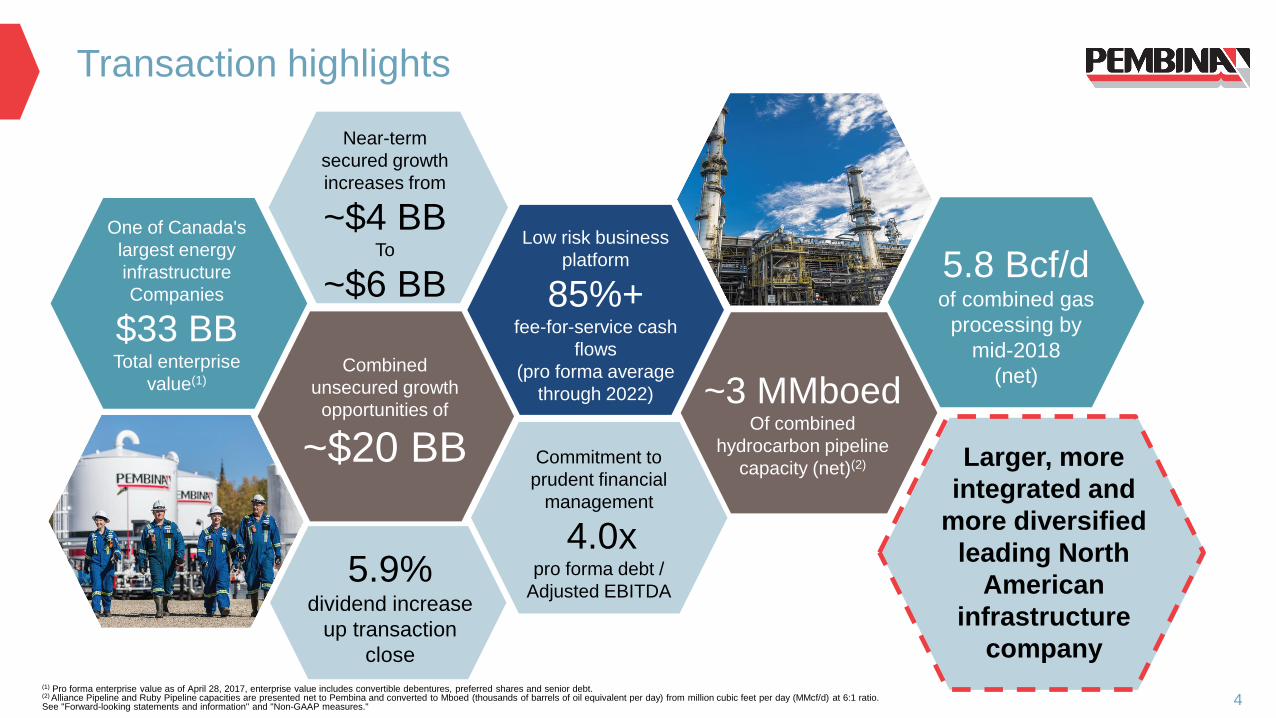
Transaction highlights
4
One of Canada's
largest energy
infrastructure
Companies
$33 BBTotal enterprise
value(1)Combined
unsecured growth
opportunities of
~$20 BB
Near-term
secured growth
increases from
~$4 BBTo
~$6 BB
Low risk business
platform
85%+fee-for-service cash
flows
(pro forma average
through 2022)
5.8 Bcf/dof combined gas
processing by
mid-2018
(net)
Commitment to
prudent financial
management
4.0xpro forma debt /
Adjusted EBITDA
~3 MMboedOf combined
hydrocarbon pipeline
capacity (net)(2)
(1) Pro forma enterprise value as of April 28, 2017, enterprise value includes convertible debentures, preferred shares and senior debt.(2) Alliance Pipeline and Ruby Pipeline capacities are presented net to Pembina and converted to Mboed (thousands of barrels of oil equivalent per day) from million cubic feet per day (MMcf/d) at 6:1 ratio.See "Forward-looking statements and information" and "Non-GAAP measures."
5.9% dividend increase
up transaction
close
Larger, more
integrated and
more diversified
leading North
American
infrastructure
company
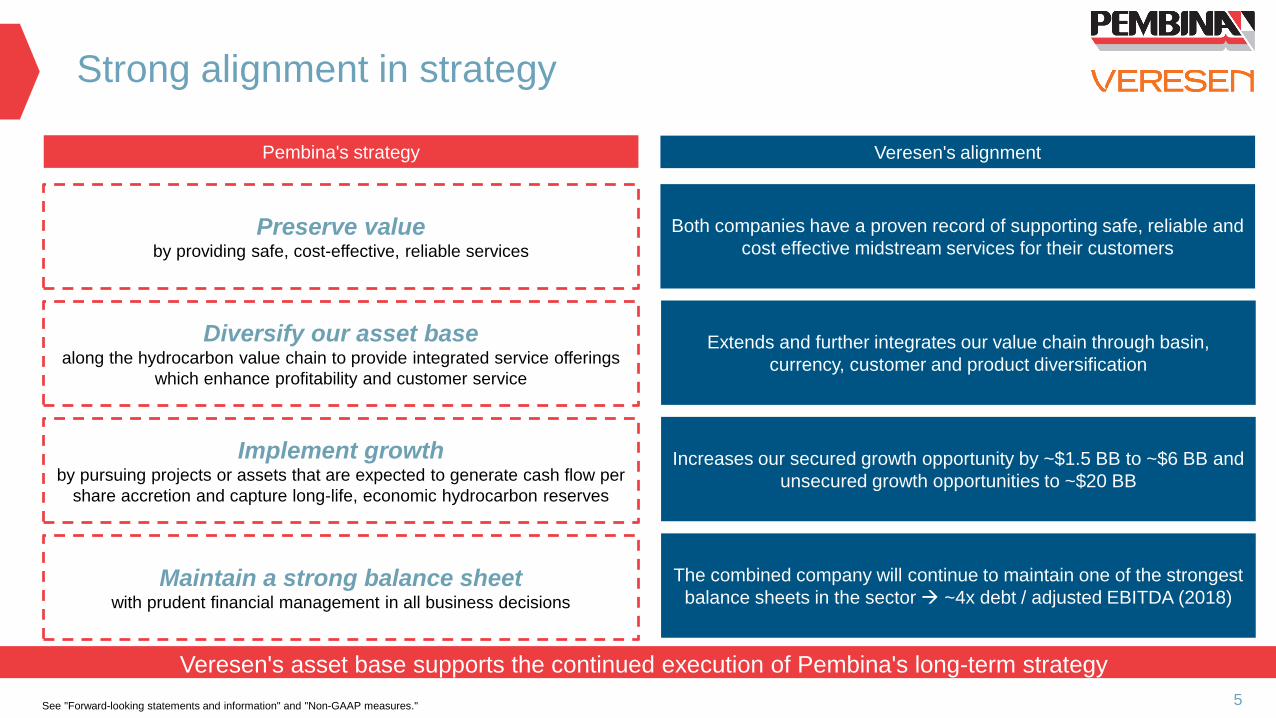
Strong alignment in strategy
5
Veresen's asset base supports the continued execution of Pembina's long-term strategy
Pembina's strategy
Preserve value by providing safe, cost-effective, reliable services
Diversify our asset base along the hydrocarbon value chain to provide integrated service offerings
which enhance profitability and customer service
Implement growth by pursuing projects or assets that are expected to generate cash flow per
share accretion and capture long-life, economic hydrocarbon reserves
Maintain a strong balance sheet with prudent financial management in all business decisions
Veresen's alignment
Both companies have a proven record of supporting safe, reliable and
cost effective midstream services for their customers
Extends and further integrates our value chain through basin,
currency, customer and product diversification
Increases our secured growth opportunity by ~$1.5 BB to ~$6 BB and
unsecured growth opportunities to ~$20 BB
The combined company will continue to maintain one of the strongest
balance sheets in the sector ~4x debt / adjusted EBITDA (2018)
See "Forward-looking statements and information" and "Non-GAAP measures."
Canada79%
US21%
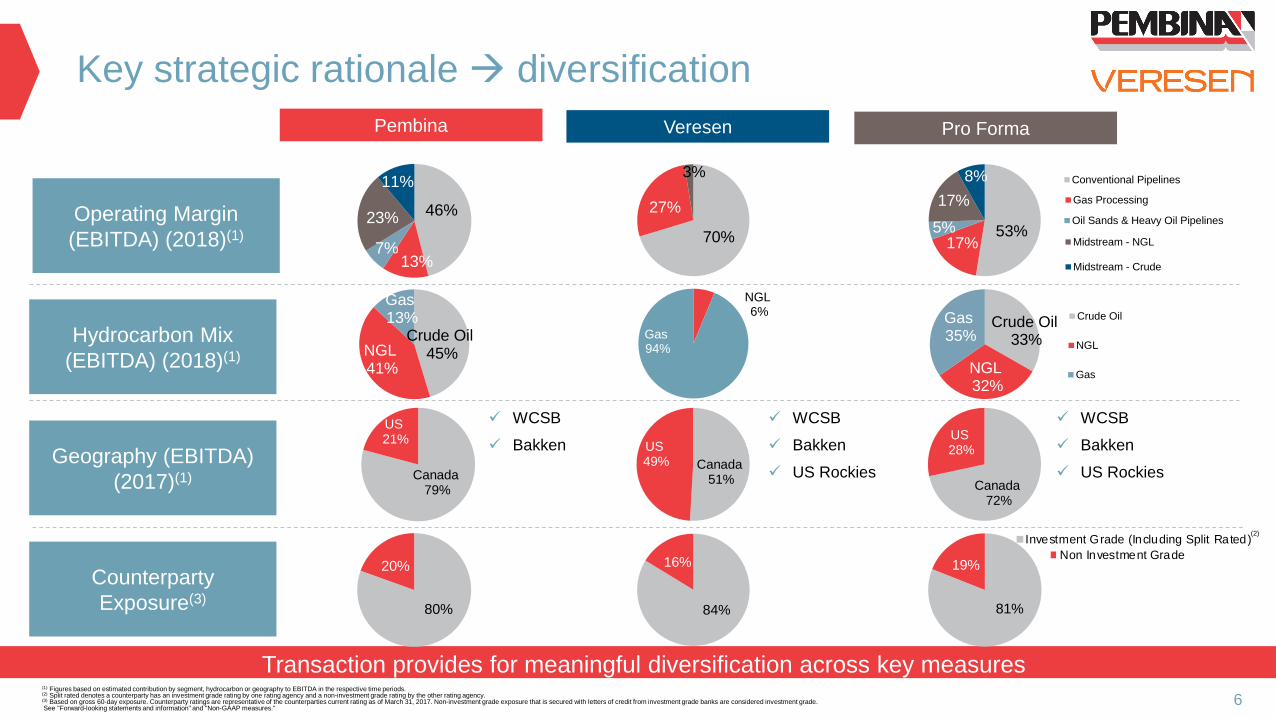
Key strategic rationale diversification
6
Operating Margin
(EBITDA) (2018)(1)
Pembina Veresen Pro Forma
Hydrocarbon Mix
(EBITDA) (2018)(1)
Geography (EBITDA)
(2017)(1)
Counterparty
Exposure(3)
WCSB
Bakken
WCSB
Bakken
US Rockies 76%
24%
Investment Grade (Including Split Rated) Non Investment Grade
46%
13%7%
23%
11%
70%
27%
3%
53%17%
5%
17%
8%
Crude Oil45% NGL
41%
Gas13%
NGL6%
Gas94%
Crude Oil33%
NGL32%
Gas35%
Canada51%
US49%
Canada72%
US28%
80%
20%
84%
16%
81%
19%
Transaction provides for meaningful diversification across key measures(1) Figures based on estimated contribution by segment, hydrocarbon or geography to EBITDA in the respective time periods.(2) Split rated denotes a counterparty has an investment grade rating by one rating agency and a non-investment grade rating by the other rating agency.(3) Based on gross 60-day exposure. Counterparty ratings are representative of the counterparties current rating as of March 31, 2017. Non-investment grade exposure that is secured with letters of credit from investment grade banks are considered investment grade.See "Forward-looking statements and information" and "Non-GAAP measures."
WCSB
Bakken
US Rockies
76%
24%
Investment Grade (Including Split Rated) Non Investment Grade
33%
32%
35%
Crude Oil NGL Gas
33%
32%
35%
Crude Oil NGL Gas
33%
32%
35%
Crude Oil NGL Gas
(2)
52%
18%
5%17%
8%
Conventional Pipeline Gas Processing Oil Sands & Heavy Oil Midstream - NGL Midstream - Crude
52%
18%
5%17%
8%
Conventional Pipeline Gas Processing Oil Sands & Heavy Oil Midstream - NGL Midstream - Crude
52%
18%
5%17%
8%
Conventional Pipeline Gas Processing Oil Sands & Heavy Oil Midstream - NGL Midstream - Crude
52%
18%
5%
17%
8%
Conventional Pipelines Gas Processing Oil Sands & Heavy Oil Pipelines Midstream - NGL Midstream - Crude
52%
18%
5%
17%
8%
Conventional Pipelines Gas Processing Oil Sands & Heavy Oil Pipelines Midstream - NGL Midstream - Crude
7

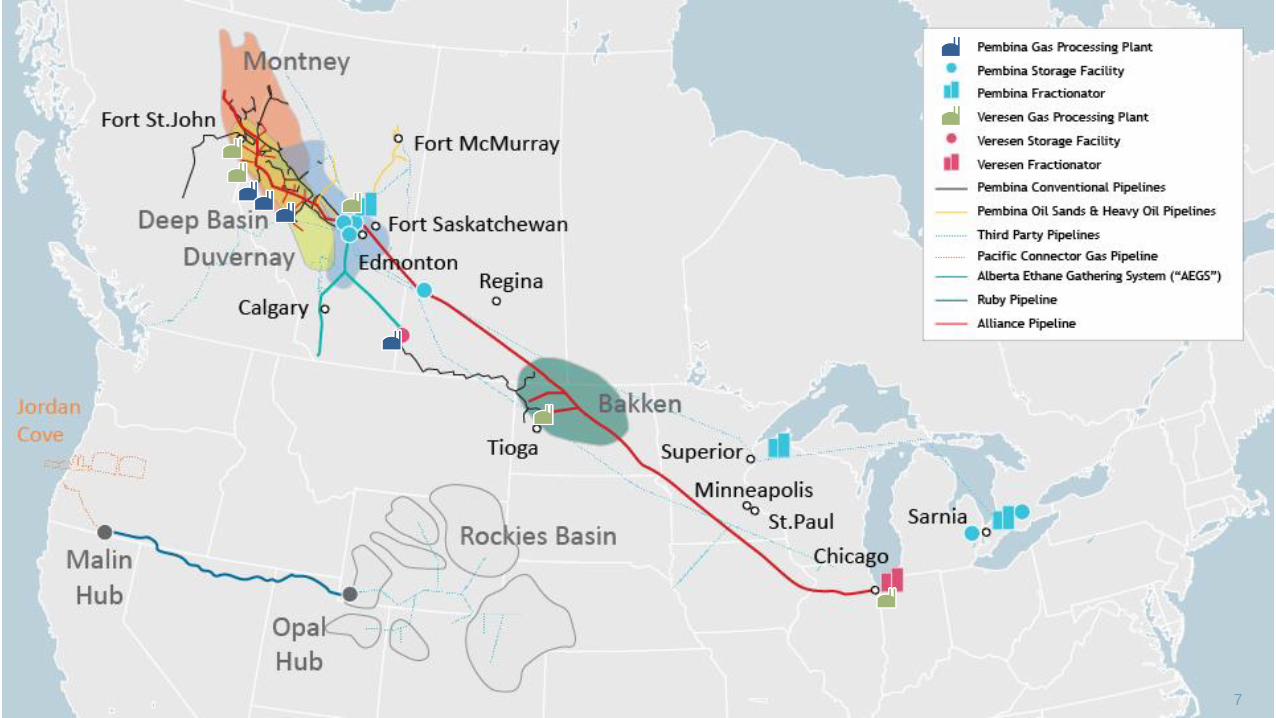
Integrated, customer-focused value chain
8
Refining (Partial
Upgrading)
MarketingOil / C5 / Oil Sands Terminalling
NGL Storage Fractionation Distribution
Consumption
Gathering, Processing,
Field Extraction
Field Terminals Consumption
Propane exports
Redwater + Empress East + Sarnia & Corunna
Mainline Extraction, Fractionation, Distribution
PDH/PPProduction
Natural Gas
Pipelines
(Alliance)
Fractionation
(Aux Sable)NGL Distribution
(Aux Sable)
Mainline
Extraction
(Aux Sable)
Via NGTL
NGL Midstream
Crude Oil Midstream
Oil &
Condensate
Value Chain
("LVP") Production
Value chain extension opportunities
Crude Oil Midstream
Gas/NGL
Value Chain
("HVP")
Combination of Veresen and Pembina adds fully integrated, parallel natural gas value chain
Conventional Pipelines
Conventional / Oil Sands
Pipelines
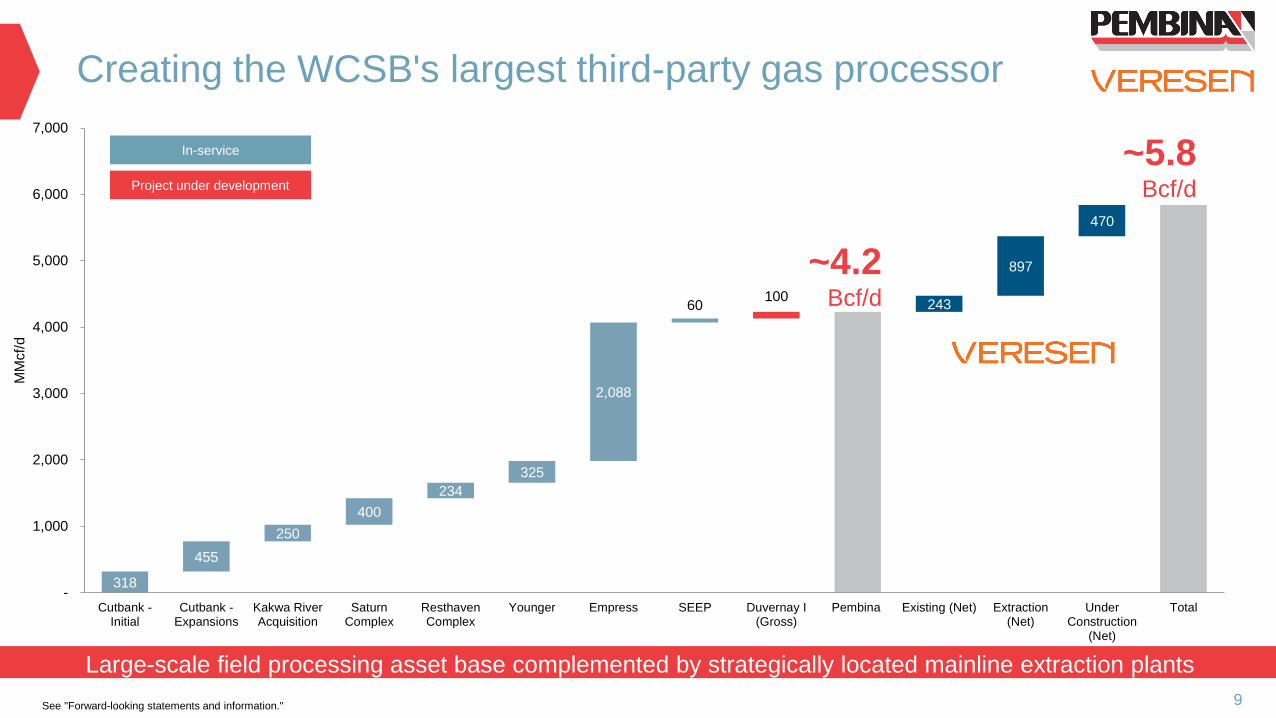
318
455
250
400
234
325
2,088
60 100
243
897
470
-
1,000
2,000
3,000
4,000
5,000
6,000
7,000
Cutbank -Initial
Cutbank -Expansions
Kakwa RiverAcquisition
SaturnComplex
ResthavenComplex
Younger Empress SEEP Duvernay I(Gross)
Pembina Existing (Net) Extraction(Net)
UnderConstruction
(Net)
Total
MM
cf/
d
Creating the WCSB's largest third-party gas processor
9
Large-scale field processing asset base complemented by strategically located mainline extraction plants
~5.8Bcf/d
~4.2Bcf/d
In-service
Project under development
See "Forward-looking statements and information."

65
8 9
73
55
18
20
56
-
50
100
150
200
250
300
350
RFS I RFSDebottleneck
RFS C3+Debottleneck
(Q1 2016)
RFS II(Q1 2016)
RFS III(Q3 2017)
RFS III Growth(Potential)
Sarnia Pembina Aux Sable (Net) Total
Mbpd
Fractionation capacity across three NGL market hubs
10
~300 mbpd of NGL fractionation capacity in three of North America's premier liquids markets
~300 Mbpd
~250Mbpd
Uncommitted ProjectIn-service Project under development
See "Forward-looking statements and information."
Edmonton Sarnia, Ontario US Midcontinent
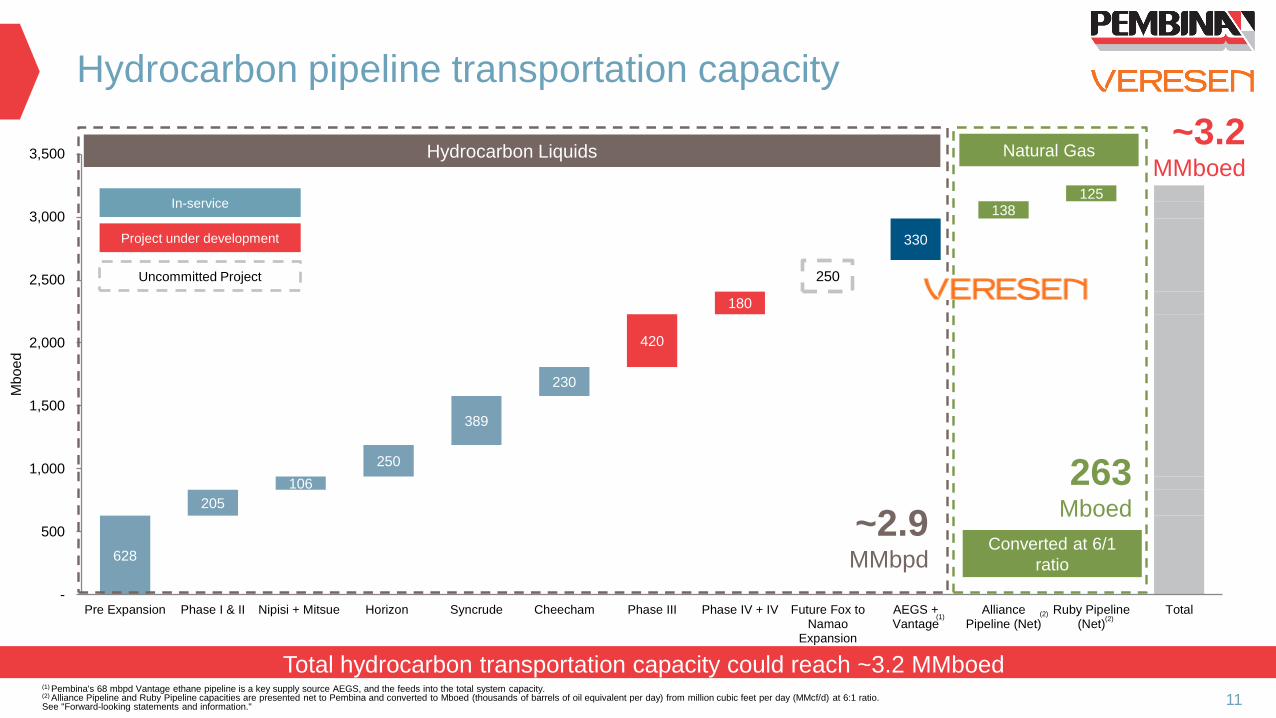
628
205
106
250
389
230
420
180
250
330
138 125
-
500
1,000
1,500
2,000
2,500
3,000
3,500
Pre Expansion Phase I & II Nipisi + Mitsue Horizon Syncrude Cheecham Phase III Phase IV + IV Future Fox toNamao
Expansion
AEGS +Vantage
AlliancePipeline (Net)
Ruby Pipeline(Net)
Total
Mboed
Hydrocarbon pipeline transportation capacity
11
Total hydrocarbon transportation capacity could reach ~3.2 MMboed
Natural Gas
~2.9 MMbpd
263Mboed
(1) Pembina's 68 mbpd Vantage ethane pipeline is a key supply source AEGS, and the feeds into the total system capacity.(2) Alliance Pipeline and Ruby Pipeline capacities are presented net to Pembina and converted to Mboed (thousands of barrels of oil equivalent per day) from million cubic feet per day (MMcf/d) at 6:1 ratio.See "Forward-looking statements and information."
(2)(1)
In-service
Project under development
Uncommitted Project
Hydrocarbon Liquids~3.2
MMboed
Converted at 6/1
ratio
(2)

Financial 'Guard Rail' considerations
12
Veresen transaction fits well with Pembina's financial 'Guard Rails'
1
2
3
4
5
Maintain target of 80% fee-for-service contribution to
EBITDA
Maintain 'strong' BBB credit rating
Target 75% credit exposure from investment grade
and secured counterparties(1)
Target <100% payout of fee-for-service distributable
cash flow by 2018(2)
Target 8 -10% cash flow per share growth without
putting guard rails at risk
Pembina Combined
~84% (2018 – 2022)
~87% (2018 – 2022)
>20% FFO / Debt >20% FFO / Debt
80% 81%
85% 80%
Low End High End
(1) Based on gross 60-day exposure. Counterparty ratings are representative of the counterparties current rating as of March 31, 2017. Non-investment grade exposure that is secured with letters of credit from investment grade banks are considered investment grade. (2) Illustrative calculation based on total common share dividends, preferred share dividends, interest, general and administrative expenses and illustrative cash taxes as compared to consolidated fee-for-service net operating income. Payout ratio calculation is inclusive of increase dividend upon transaction close. See "Forward-looking statements and information" and "Non-GAAP measures."
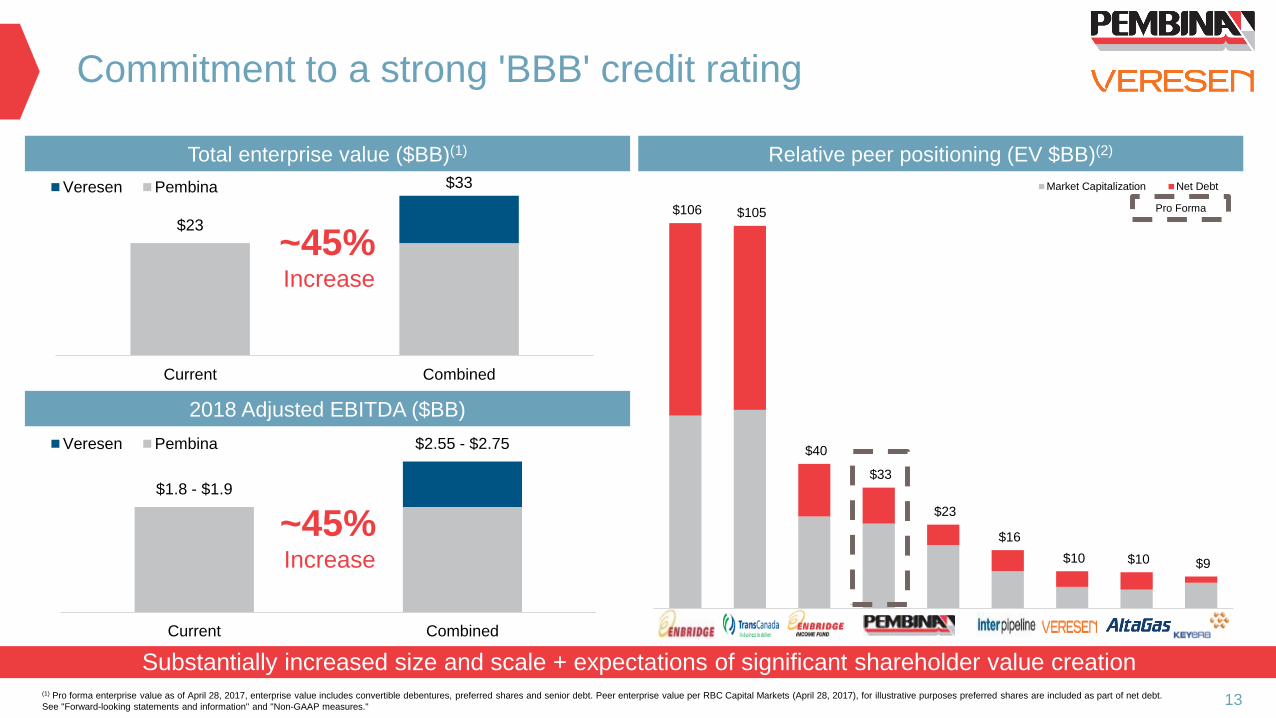
$106 $105
$40
$33
$23
$16
$10 $10 $9
Market Capitalization Net Debt
Commitment to a strong 'BBB' credit rating
13
Substantially increased size and scale + expectations of significant shareholder value creation
Relative peer positioning (EV $BB)(2)Total enterprise value ($BB)(1)
2018 Adjusted EBITDA ($BB)
(1) Pro forma enterprise value as of April 28, 2017, enterprise value includes convertible debentures, preferred shares and senior debt. Peer enterprise value per RBC Capital Markets (April 28, 2017), for illustrative purposes preferred shares are included as part of net debt.
See "Forward-looking statements and information" and "Non-GAAP measures."
~45%Increase
~45%Increase
Pro Forma
$23
$33
-
$5
$10
$15
$20
$25
$30
$35
Current Combined
Veresen Pembina
$1.8 - $1.9
$2.55 - $2.75
-
$0.5
$1.0
$1.5
$2.0
$2.5
$3.0
Current Combined
Veresen Pembina

~44%
~64% ~61%
~65%
~63%
~33%
~13%
~19%
~18%
~24%
~22%
~19%
~15%
~13%
~10%
~1%
~4%
~5%
~4%
~4%
-
$1
$1
$2
$2
$3
$3
$4
2015A 2016A 2017E 2018E 2018(Combined)
We are committed to a low-risk business platform
14
85%+ of operating margin is expected to be generated from fee-for-service contracts in 2018
Summary of operating margin by type ($MM)(1)
(1) 2014 - 2016 figures based on actual results (including internal allocations), while forward years are based on Pembina's current long-term forecast and actual results may vary depending on asset utilization, project in-service dates, commodity pricing and other factors.
See "Forward-looking statements and information" and "Non-GAAP measures."
Fee-for-Service Take-or-Pay / Cost-of-Service Product Margin Frac Spread
Total fee-
based =
77%
Total fee-
based =
77%
Total fee-
based =
80%
Total fee-
based =
83%
Total fee-
based =
86%

2014 2015 2016 2017 2018
-
$1.0
$2.0
$3.0
2014 2015 2016 2017 2018
$B
B
Capital Expenditures Internal Equity DRIPPreferred Shares Common Equity DebtVeresen Power Asset Sale
Pembina's financial outlook and considerations
Pembina has developed a well thought out financing plan that ensures strong financial position
15
Capital expenditure funding Financing considerations
• Commitment to Pembina's financial objectives:
− Financing growth 50% debt / 50% equity over
the investment cycle
− Conservative credit metrics to maintain 'strong'
BBB rating
− Ensuring ample liquidity
• The ~$1.5 BB cash portion of the transaction will be
initially funded through Pembina's revolving credit
facility, with subsequent preferred share and medium
term note offerings
− No common equity requirements foreseen,
(DRIP or public issuance)
See "Non-GAAP measures." & "Forward-looking statements and information."
2017 / 2018 Capital
~$3.5 BB

Commitment to a strong 'BBB' credit rating(Managing toward target credit metrics)
16
Through the transaction Pembina will ensure prudent financial management and a strong balance sheet
Debt / Adjusted EBITDA (x) (2018 Forecast)(1)Credit Highlights
Fund from Operations / Debt (%) (2018 Forecast)(3)Debt to Total Capitalization (%) (2018 Forecast)(2)
(1) Debt to adjusted EBITDA calculated as total debt divided by adjusted EBITDA, on a proportionate consolidation basis.(2) Debt to total capitalization calculation assumes exclusion of debt related to Veresen's subsidiaries.(3) Debt to funds from operations calculated as per Standard and Poor's methodology.
See "Forward-looking statements and information" and "Non-GAAP measures."
4.0x
3.75x - 4.25x
2.0x
2.5x
3.0x
3.5x
4.0x
4.5x
Pro Forma Target
20%
18% - 22%
-
5%
10%
15%
20%
25%
Pro Forma Target
38%
38% - 40%
-
5%
10%
15%
20%
25%
30%
35%
40%
45%
50%
Pro Forma Target
• Increased size, scale and asset diversity serve to create
enhanced credit profile
• Combined balance sheet remains strong only a modest
increase in near term leverage
• The combined company will maintain a strong BBB
investment grade credit rating
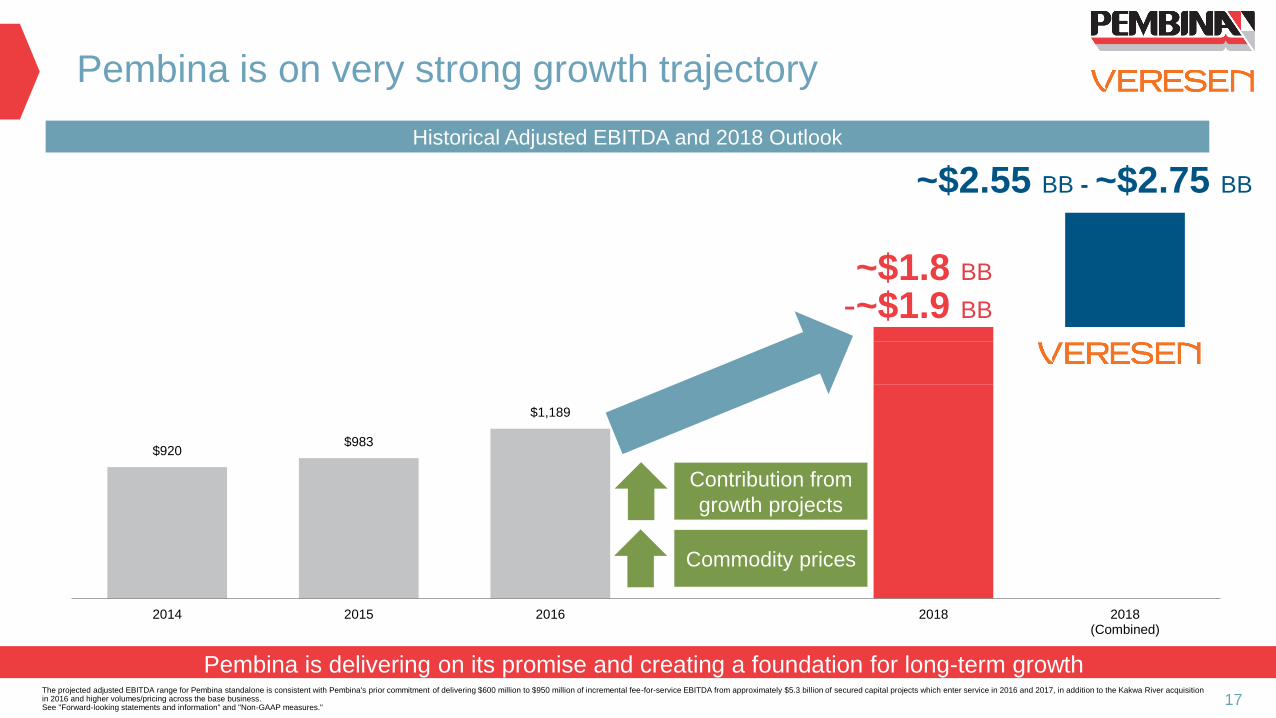
$920 $983
$1,189
2014 2015 2016 2018 2018(Combined)
Pembina is on very strong growth trajectory
17
Pembina is delivering on its promise and creating a foundation for long-term growth
~$1.8 BB
-~$1.9 BB
The projected adjusted EBITDA range for Pembina standalone is consistent with Pembina's prior commitment of delivering $600 million to $950 million of incremental fee-for-service EBITDA from approximately $5.3 billion of secured capital projects which enter service in 2016 and 2017, in addition to the Kakwa River acquisition in 2016 and higher volumes/pricing across the base business. See "Forward-looking statements and information" and "Non-GAAP measures."
Historical Adjusted EBITDA and 2018 Outlook
~$2.55 BB - ~$2.75 BB
Commodity prices
Contribution from
growth projects

Conclusions
18
This transaction is expected to drive meaningful value for shareholders and customers
Proven history of safe and reliable operations while developing enduring relationships with local communities
Our long term strategy remains unchanged and continues to create significant shareholder value
Committed to delivering 2018 Adjusted EBITDA of $2.55 BB to $2.75 BB (pro forma)
The transaction significantly increases Pembina's size, diversification, and enhances customer service offering
Substantial portfolio of opportunities support Pembina's 8 – 10% adjusted cash flow per share growth target
See "Forward-looking statements and information" and "Non-GAAP measures."
Non-GAAP measures
This presentation uses certain terms that are not defined by GAAP but are used by management of Pembina to evaluate the Veresen transaction.
Non-GAAP financial measures do not have a standardized meaning prescribed by GAAP and are therefore unlikely to be comparable to similar
measures presented by other companies.
Pembina uses the non-GAAP terms: Total Enterprise Value (market value of Pembina's common shares plus preferred shares and convertible
debentures plus senior debt less cash and cash equivalents), Adjusted EBITDA (earnings for the year plus share of profit (loss) from equity
accounted investees (before tax, depreciation and amortization) plus net finance costs plus income taxes plus depreciation and amortization
(included in operations and general and administrative expense) and unrealized gains or losses on commodity-related derivative financial
instruments. Adjusted EBITDA also includes adjustments for loss (gain) on disposal of assets, transaction costs incurred in respect of
acquisitions, impairment charges or reversals and write-downs in respect of goodwill, intangible assets and property plant and equipment, non-
cash provisions and ), Adjusted Cash Flow from Operating Activities (cash flow from operating activities plus the change in non-cash operating
working capital, adjusting for current tax and share-based payment expenses, and deducting preferred share dividends declared), and the
additional GAAP term Operating Margin (gross profit before depreciation and amortization included in operations and unrealized gain/loss on
commodity-related derivative financial instruments). Adjusted EBITDA is used interchangeably with EBITDA in this presentation.
Management believes these non-GAAP measures provide an indication of the results generated by Pembina's business activities and the value
those businesses generate. Investors should be cautioned that these non-GAAP measures should not be construed as an alternative to net
earnings, cash flow from operating activities or other measures of financial performance determined in accordance with GAAP as an indicator of
Pembina's performance. For additional information with respect to financial measures which have not been identified by GAAP, including
reconciliations to the closest comparable GAAP measure, see Pembina's Management's Discussion and Analysis for the fiscal year ended
December 31, 2016, available on SEDAR at www.sedar.com or in Pembina's annual report on Form 40-F for the fiscal year ended December 31,
2016 available on EDGAR at www.sec.gov.
19