TSX InSAR Assessment for slope instabilities monitoring … · TSX InSAR Assessment for slope...
31
TSX InSAR Assessment for slope instabilities monitoring in alpine periglacial environment (western Swiss Alps) C. Barboux , R. Delaloye, C. Collet University of Fribourg, Switzerland T. Strozzi Gamma Remote Sensing AG, Bern, Switzerland H. Raetzo Federal Office for the Environment, Wabern, Switzerland 19-23 September 2011 | ESA-ESRIN | Frascati (Rome), Italy
Transcript of TSX InSAR Assessment for slope instabilities monitoring … · TSX InSAR Assessment for slope...

TSX InSAR Assessment for slope instabilities monitoring in alpine periglacial environment (western Swiss Alps)
C. Barboux, R. Delaloye, C. ColletUniversity of Fribourg, Switzerland
T. StrozziGamma Remote Sensing AG, Bern, Switzerland
H. RaetzoFederal Office for the Environment, Wabern, Switzerland
19-23 September 2011 | ESA-ESRIN | Frascati (Rome), Italy

Introduction
Periglacial environment : alpine and high alpine zone potentially concerned by permafrost
In the Valais Alps : lower limit of permafrost = 2400 m a.s.l. in northern exposition and 2700 m a.s.l. in south-facing slope
Periglacial belt: portion located above this lower limit to the summits excluding glaciated area
Introduction
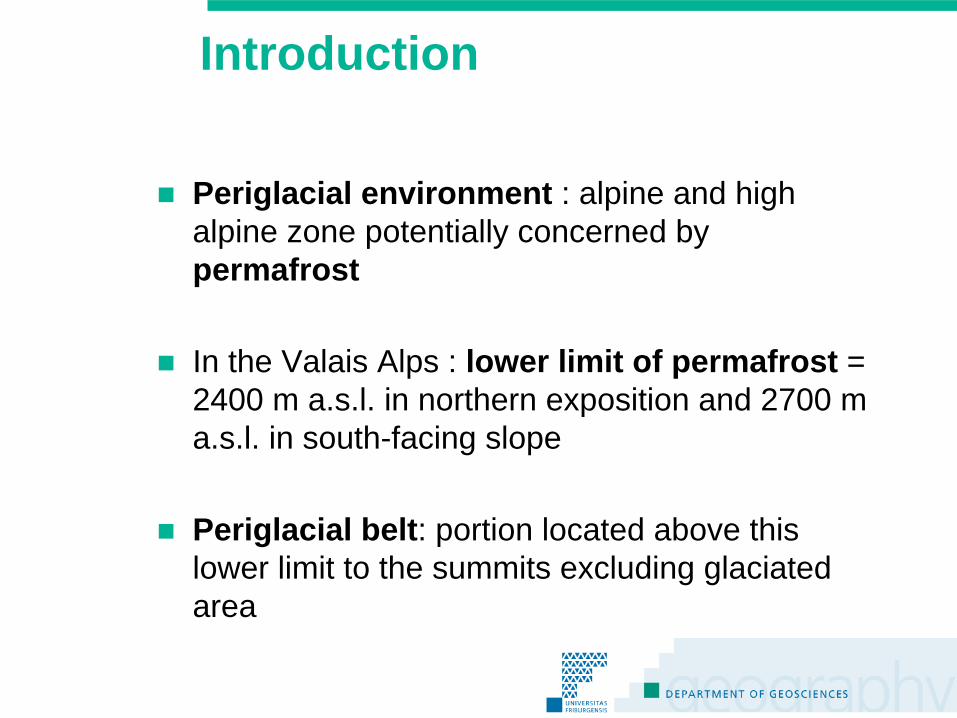
This environment is potentially affected by loose sediments

Introduction
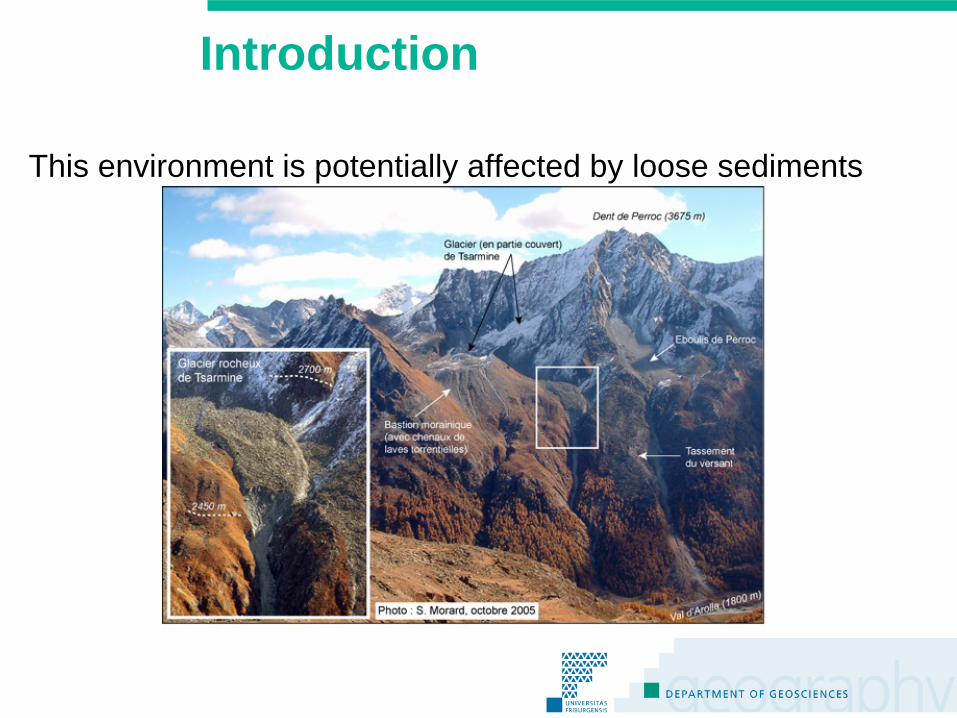
Perennially frozen terrain are susceptible to move and their dynamics are partly controlled by the thermal state of permafrost
Any change in permafrost creep rate modifies the transfert rate of loose material along the alpine slope and may affect the frequency, magnitude and type of related slope instabilities
Introduction
Succeptible
to move : permafrost creep
Introduction
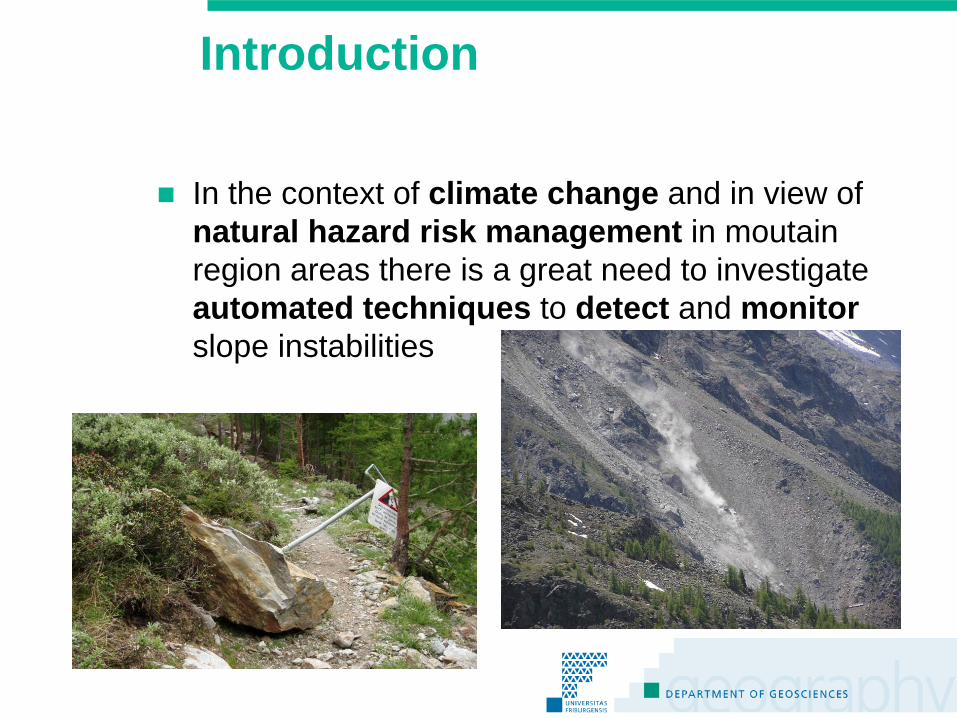
In the context of climate change and in view of natural hazard risk management in moutain region areas there is a great need to investigate automated techniques to detect and monitor slope instabilities
Studied area and InSAR
The topography of the Western Swiss Alps, mainly consisting of north-south oriented valleys is optimal for an InSAR application
Since 2005, several inventories of InSAR detected slope have been compiled at a regional scale using large set of InSAR data
Inventories of slope movement
12
3
45
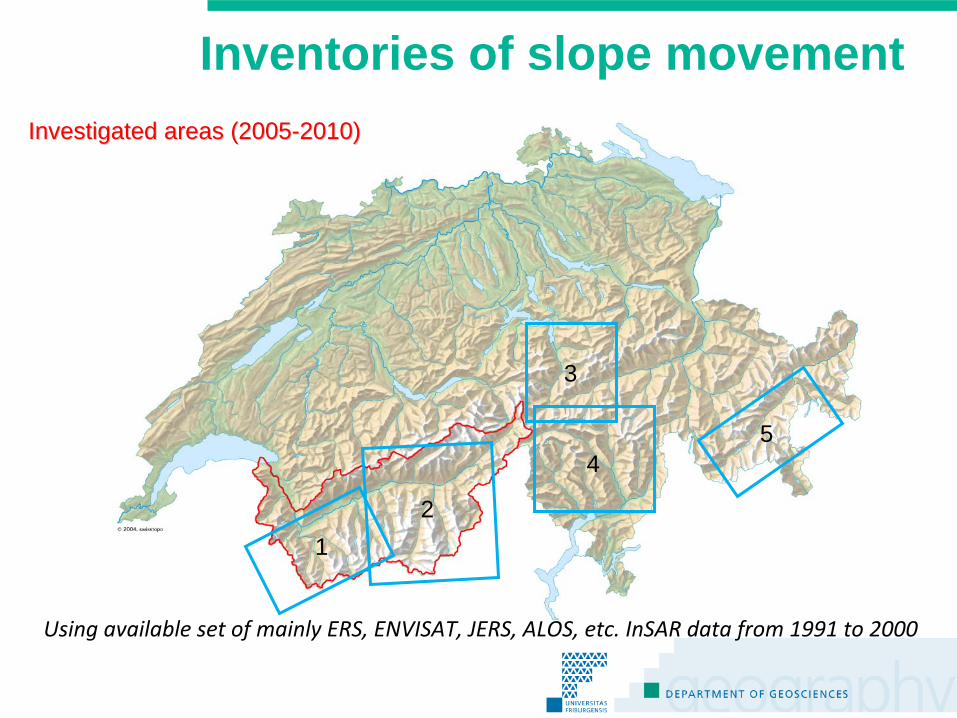
InvestigatedInvestigated areas (2005areas (2005--2010)2010)
Using available set of mainly ERS, ENVISAT, JERS, ALOS, etc. InSAR
data from 1991 to 2000

InventoriesAbout
2‘000 landforms
outlined
:
-Rock glaciers-Debris‐covered
glaciers-Landslides-…
+ determination
of the
magnitude
order of the
displacement
rate
(cm/d, dm/m, cm/m, cm/y)

InSAR potential
The use of InSAR has been evaluated to estimate magnitude of the movement and verified on different selected sites with known phenomena
Fast moving slopes were detected thanks to 1- and 3-day repeated cycle of ERS-1/2
However since the extinction of ERS-1/2 tandem the higher rate of rapidly moving rockglaciers (>1m/y) can no longer be detected or surveyed on C-band and L-band monthly interferograms
Terrasar X potential
Aim target : investigate the potential of TSX InSAR for slope motion monitoring in Valais
Is these high resolution X-band interferograms with 11 days time interval are suitable for monitoring very active landforms ?

Terrasar-X InSAR Assessment
In order to provide a reliable assessment of InSAR visibility for slope motion monitoring, a map of visibility characterizing the velocity compression is calculated.
An index value ranging between 0 and 1 is used to determine the suitability of TSX to monitor each of our 30 surveyed test-landforms.

Terrasar-X InSAR Assessment
1st step : Exclude areas which are polluted by irreversible geometric distorsions
Visibility mask
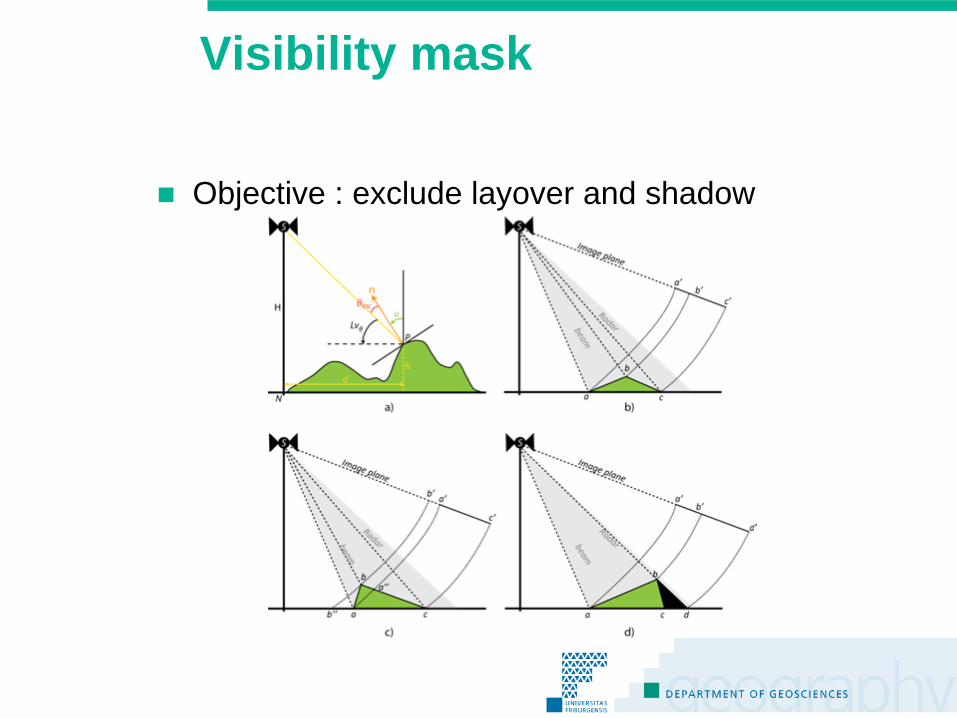
Objective : exclude layover and shadow

Visibility mask
Typical results
Limitations : binary characterization of InSAR visibility
Desc. LOS Asc. LOS

Terrasar-X InSAR Visibility
1st step : Exclude areas which are polluted by irreversible geometric distorsions
2nd step : Determine a quality index, ranging between 0 and 1, which characterizes the InSAR visibility. The quality of the observation is evaluated for the displacement on a unit area of the ground surface which is directly related to the topography and the look angle.
Visibility map
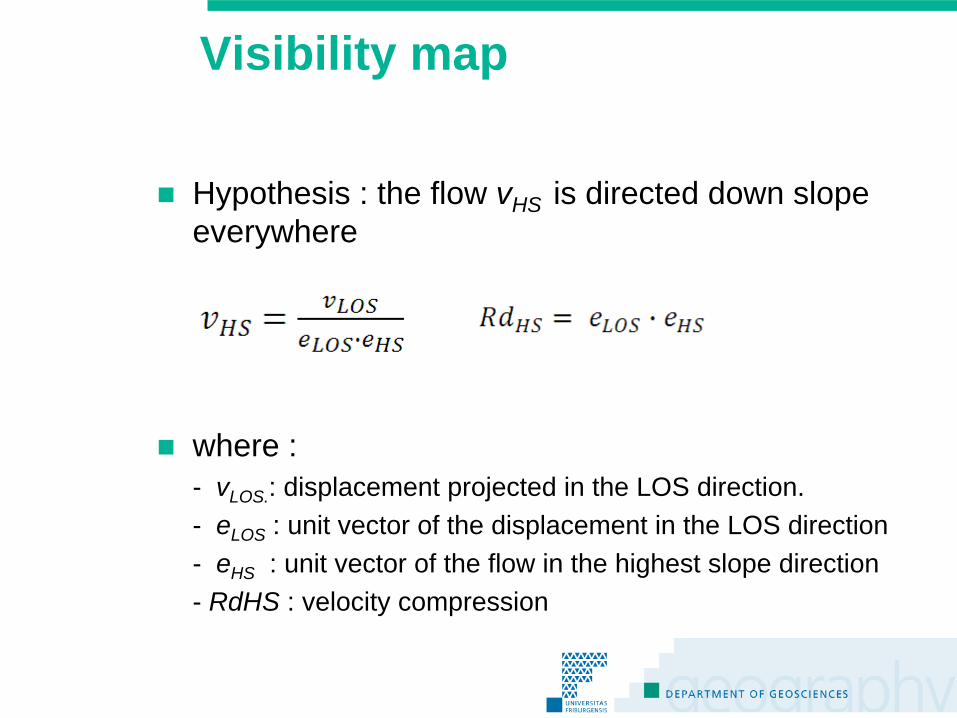
Hypothesis : the flow vHS is directed down slope everywhere
where : - vLOS. : displacement projected in the LOS direction. - eLOS : unit vector of the displacement in the LOS direction- eHS : unit vector of the flow in the highest slope direction- RdHS : velocity compression
Visibility map
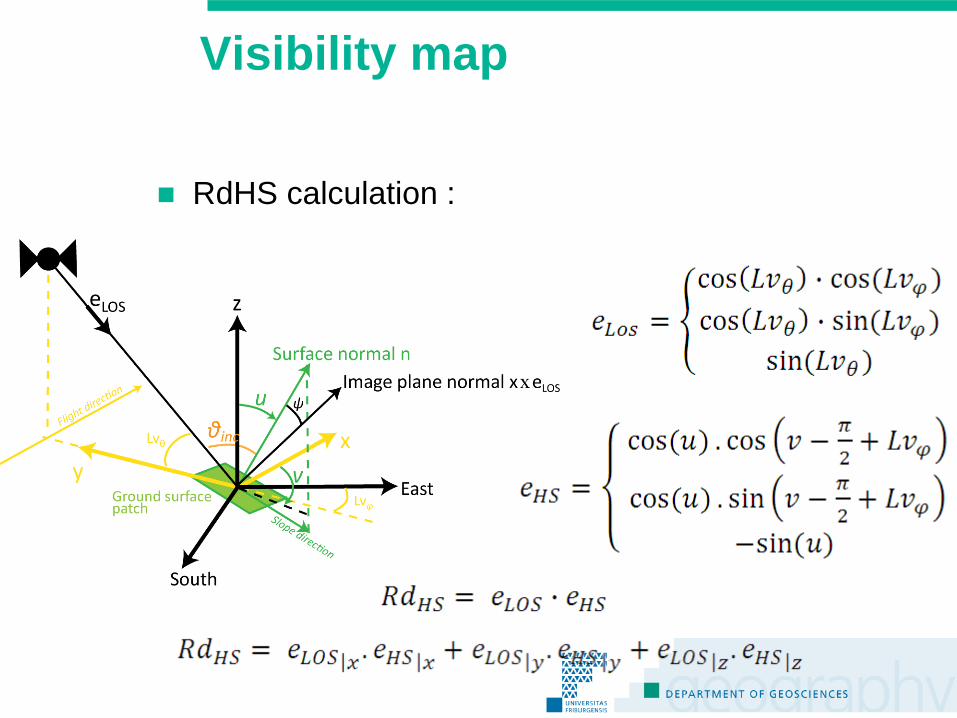
RdHS calculation :

Visibility map calculation
Typical results
Descending : RdHS = 45% (std = 0.21) Ascending RdHS = 77% (std = 0.14)
Desc. LOS Asc. LOS

Application to the Valais
85.6% of the alpine periglacial belt is visible by TSX InSAR. Remaining area is either masked by layover or shadow or not covered by the specific orbits.
Almost 49.2% of the belt is visible in both two modes

30 surveyed landforms
30 landforms are annually or seasonally surveyed by GPS field measurementssince 2000 for the longest series
30 surveyed landforms
Different kind of typology : 18 rock glaciers, 9 landslides, 2 covered glaciers and 1 moraine
Most of them are located on slope of about 25° and have an area smaller than 10ha. Their flows are more or less 11.6° directed toward the highest slope direction
97,1% of these landforms are visible by TSX either in ascending or in descending mode. Remaining area is in layover or shadow

InSAR Visibility calculation
When the visibility score does not exceed 50%, the specified mode is turned down for the considered landform.^ 21 landforms can be observed in 2 modes, 9 in only one
mode
The visibility map was computed for each landform
Then the maximal deformation rate was computed
with vLOS|max = λ/2 ]/[51.0max|max ym
RRv
VdHSdHS
LOS

InSAR Visibility calculation
For most of the west- oriented landforms Vmax can reach 1m/y in descending mode and 3.5 m/y in ascending mode
Reverse phenomena for east-oriented landforms
Vmax reaches 1m/y in both modes for north- oriented landforms
InSAR Visibility calculation
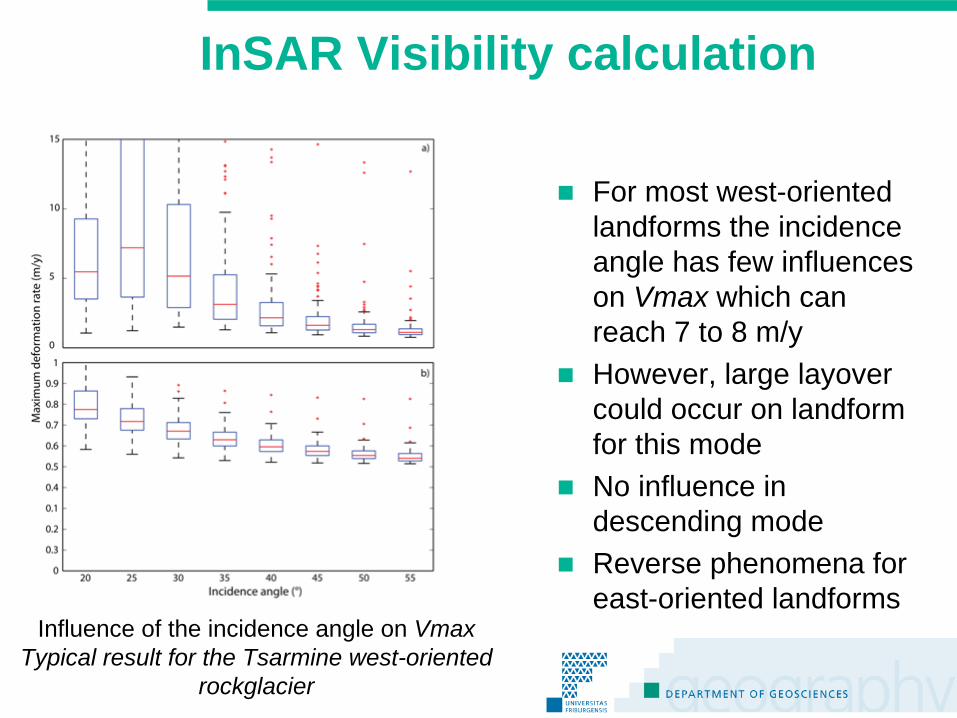
For most west-oriented landforms the incidence angle has few influences on Vmax which can reach 7 to 8 m/y
However, large layover could occur on landform for this mode
No influence in descending mode
Reverse phenomena for east-oriented landforms
Influence of the incidence angle on VmaxTypical result for the Tsarmine west-oriented
rockglacier

Discussion
Some comparison were performed by combining InSAR observations and differential GPS measurements :The maximal deformation rate was compared to the local velocity, for each surveyed GPS point which is classified as detectable or undetectable
In most cases, the detectable and undetectable point classification corresponds to InSAR observation (in term of correlated and decorrelated signal respectively).
Discussion
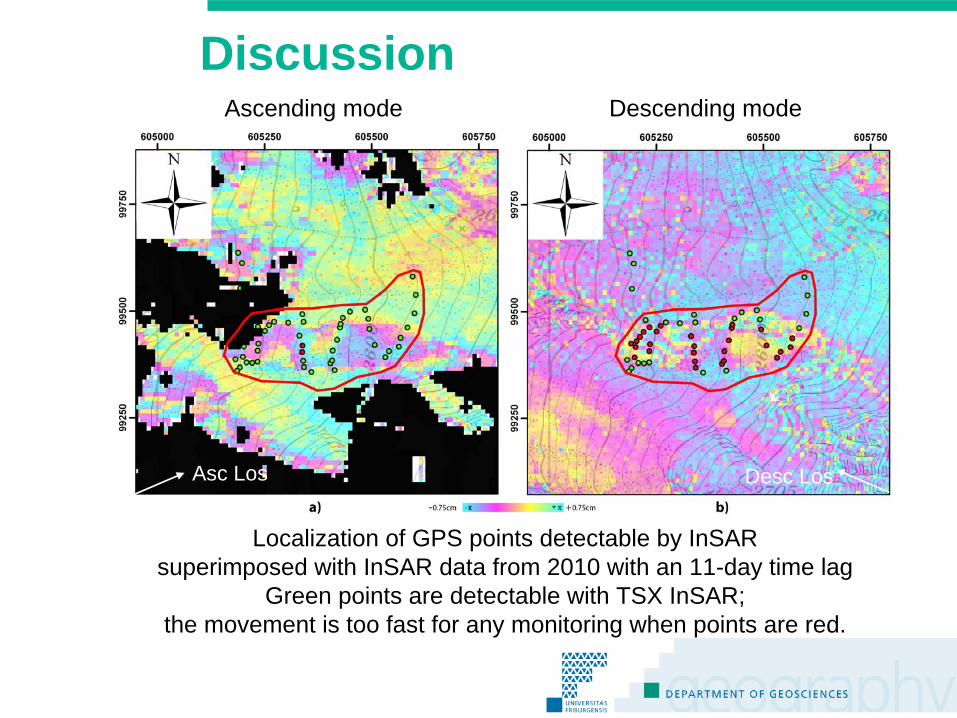
Localization of GPS points detectable by InSARsuperimposed with InSAR data from 2010 with an 11-day time lag
Green points are detectable with TSX InSAR; the movement is too fast for any monitoring when points are red.
Ascending mode Descending mode
Asc Los Desc Los
Conclusion
It is possible to monitor some very active rockglaciers (1- 3.5m.y-1) when geometrical distortions do not hide them with the shortest repeat pass of 11 days.
Lower velocity rates could be well monitored using longer time lags.
At higher rate velocities, decorrelation occurs in most cases and TSX appears to be unsuitable for a precise analysis of these kinds of very rapidly moving landforms.
The high resolution of TSX looks suitable to monitor slope instabilities with narrow width (until 50 meters width).

Thanks for your attention !

Discussion
N°23N°14
N° 14 : (0.3*1.5/0.19)*(365/11)= 79 cm/y; 84 cm/y (GPS 2010); N° 23 : (0.8*1.5/0.19)*(365/11) = 210 cm/y; 214 cm/y (GPS 2010);
TSX Ascending : 11 days 20100718-20100729 RdHS =0.19