Tsunami modelling: on the use of databases (topo ... · Tsunami modelling: on the use of databases...
62
mardi 26 avril 2016 Tsunami modelling: on the use of databases (topo-bathymetry, land- use,…) for real events R. Pedreros, S. Le Roy, A. Lemoine, M. Terrier, J. Lambert and colleagues BRGM (French Geological Survey) Risks et Risk Prevention Division Coastal and Climate Change Risks / Seismic and Volcanic Risks TANDEM AND DEFI LITTORAL: TSUNAMI SCHOOL Bordeaux, April 25-29 2016
Transcript of Tsunami modelling: on the use of databases (topo ... · Tsunami modelling: on the use of databases...

mardi 26 avril 2016
Tsunami modelling: on the use of
databases (topo-bathymetry, land-
use,…) for real events
R. Pedreros, S. Le Roy, A. Lemoine, M. Terrier, J. Lambert and
colleagues
BRGM (French Geological Survey) Risks et Risk Prevention Division
Coastal and Climate Change Risks / Seismic and Volcanic Risks
TANDEM AND DEFI LITTORAL: TSUNAMI SCHOOL
Bordeaux, April 25-29 2016

Risk simulation
• Landslide
zoning
• Active
Volcanoes
• Sismic
zoning
Assets
definition
List of
categories of
exposed
elements
•geolocation •Determination
of physical
parameters
Choice of
evaluation
method
Vulnerability index :
•Vs, structural,
•Vf, functional,
•Vc, human
Evaluation of assets
vulnerability
Statistical
approach
(typology,
district)
Determinist
approach
(for each
building) population,
habitat, safety
centers,
historical
monuments,
schools, roads,
railways, water
supply, etc.
Damage functions
Computing Data
acquisition
Socio-
economic
functioning
(territory)
Catalog of
Historical
tsunamis bathymetry
topography
Far field
sources
Near field
sources
Interpretation
Tsunami hazard evaluation
Numerical
modelling
Scenarios
Risk scenarios
Evaluation of Tsunami risk
(BRICE)

A- Tsunami Hazard Evaluation 1-Historical database
2-Water level measurements – Field observations
3- Topo-bathymetry – Building database
4- Land-use
B- Evaluation of assets vulnerability 1- Damages to buildings
2-Damages to people

mardi 26 avril 2016
RIS/RIC
> 4
1 – Catalogs of historical tsunamis
•National Geophysical Data Center (NGDC, globe)
•Russia science academy
•Genesis and Impact of Tsunamis on the European
Coasts (GITEC , 2001)
•Italian Catalogue
•Caraïbes : O`Loughlin et Lander (2003), Lander et al.
(2002), Zahibo et Pelinovsky (2001)
Italian Catalogue, 67 events

Tsunami database (www.tsunamis.fr) > Base on original documentary source (books, scientific articles, historical
articles, manuscripts, newspapers, travellers’ accounts, chronicles,
catalogues of earthquakes and meteorological data) to prevent errors
existing in most tsunami catalogues (unit conversion problems, false
tsunamis, etc…)
> « True » tsunamis (observations with confidence level, intensity maps,
bibliography and “movies” from numerical simulations)
> list of “False” tsunamis (meteotsunami)
Lambert et Terrier 2011

Tsunami database : error example
> Tsunami of Lisbon 1755 :
• Lander et al. 2002 give the distance of the sea’s withdrawal as
“1.6 km” for Martinique whereas the contemporary accounts
evoke at the most a distance of “200 pas” (200 paces)
equivalent to ~ 160 m at Trinité
• For O’Loughlin and Lander (2003) a flood height of “4.6m” is
envisaged at Martinique, whereas contemporary accounts only
give a height of “4 pieds” (4 feet) equivalent to 1.30 m at Trinité

mardi 26 avril 2016
RIS/RIC
> 7

mardi 26 avril 2016
RIS/RIC
> 8

mardi 26 avril 2016
RIS/RIC
> 9

mardi 26 avril 2016
RIS/RIC
> 10
1- Paleo-tsunami database (NOAA)
> Tsunamites: 1KY to 100 KY. Qualitative information (intensity and
localisation)

South-Central Chile
~AD1100
~AD1300
AD1575
AD1960
Cisternas et al. (2005 Nature)
Giant (M~9.5) earthquakes ~300 yr interval
NOT ~ 100 yr as inferred from historic data

mardi 26 avril 2016
RIS/RIC
> 12

2 – Water level
mardi 26 avril 2016
RIS/RIC
> 13
> Tide gauges, tsunamimeters, GPS buoy : mesure de la hauteur et de
la période des tsunamis couvrant environ les 50 dernières années. Ils se font
généralement aux niveaux des ports (marégraphes). Les données en haute mer
(tsunamimètres) sont rares et concernent essentiellement les zones où un
système d’alerte. La fréquence d’acquisition des marégraphes n’est pas adaptée
à la quantification des tsunamis champ proche (améliorations en cours)
Still water
level
Solar panel
GPS sensor

mardi 26 avril 2016
RIS/RIC
> 14

Results obtained on Rank 0 (600m resolution)
> Preliminary comparison with Tsunami dart 21418 (about 800km
off Japan coasts)

Results obtained on Rank 1 (200m resolution)
> GPS buoys measurements

Results obtained on Rank 1 (200m resolution)

mardi 26 avril 2016
RIS/RIC
> 18
3 - Sources de données (caractérisation des tsunamis)
Marégraphes http://www.ioc-sealevelmonitoring.org/

mardi 26 avril 2016
RIS/RIC
> 19
mardi 26 avril 2016
RIS/RIC
> 20
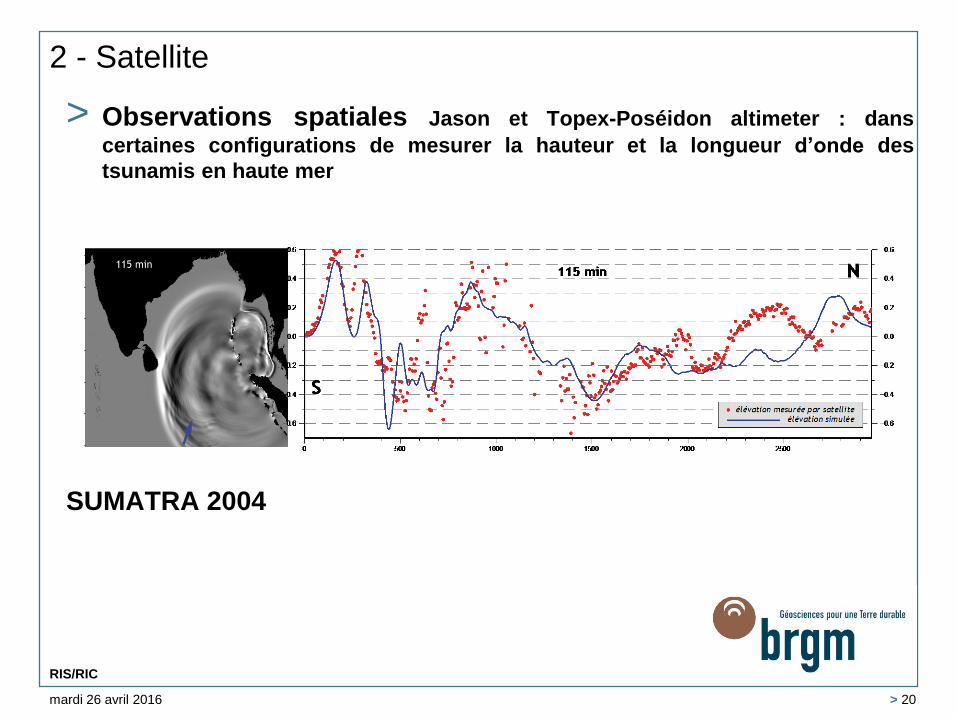
2 - Satellite
> Observations spatiales Jason et Topex-Poséidon altimeter : dans
certaines configurations de mesurer la hauteur et la longueur d’onde des
tsunamis en haute mer
SUMATRA 2004
123 min115 min
8000000 8500000 9000000 9500000 10000000 10500000 11000000 8000000 8500000 9000000 9500000 10000000 10500000 11000000
-500000
0
500000
1000000
1500000
2000000
2500000
-500000
0
500000
1000000
1500000
2000000
2500000

mardi 26 avril 2016
RIS/RIC
> 21

2- Field observations
> Campagnes de terrain post-évènement : déplacement sur les lieux
ayant été le plus touchés dans le but de mesurer le run-up et la limite
d’inondation, recueillir des témoignages (nombre de vagues, hauteurs,…)
et constater les dégâts occasionnés. Ces données sont exploitées pour le
calage des modélisations des tsunamis et l’établissement d’échelles
d’endommagements utilisées pour l’estimation de la vulnérabilité.
mardi 26 avril 2016
RIS/RIC
> 22
(GSMB, BRGM)

2- Field observations : Japan 2011
mardi 26 avril 2016
RIS/RIC
> 23

mardi 26 avril 2016
RIS/RIC
> 24

> 25
3- Topo-bathymetry
> Bases de données mondiales
Bathymétrie
• GEBCO 2014 ~900 m
• ETOPO : ~ 1800m
Topographie
• SRTM : 90 (30) m
x 90 (30m) m

mardi 26 avril 2016
RIS/RIC
> 26
3- Topo-bathymetry > Bases de données mondiales (accès libre)
GEBCO :
ETOPO 1:
Topographie : SRTM (~90m)
Trait de côte: GHSS, NGA (-> 50 à
200m)

Bathymetry : Emodnet
> Résolution spatiale ~ 230m x 230m (février 2015)!!!
> Levés bathy + GEBCO 2014

3 - Bathymétrie : Emodnet
> Produit sans Gebco Avec fusion Gebco 2014

mardi 26 avril 2016
RIS/RIC
> 29
3- Topo-Bathymetry
> Base de données nationales
SHOM : Dalles + trait de côte
Histolitt Résolution la plus haute
~ 25 m
IGN : MNT 50m

Bathymétrie : Homonim 500m résolution, SHOM

mardi 26 avril 2016
RIS/RIC
> 31
3-Topo-Bathymétrie
> Base de données nationales
Nouveaux produits SHOM (notamment projet TANDEM)
MNT de façade (~100m) + localement
produits fins

High grid resolution influence
Resolution from 3,7km to 500m
=>maximum Sea Surface Elevation X3
No quantitative comparison between
simulations and observations for large
scales

33
Vue générale
3- topo-bathy : Lidar
Système laser (terrestre / aéroporté)
Précision en z : 5-20 cm
terrestre
Topo-bathy (laser+smf)
(golfe du morbihan)
Topo-bathy (laser, jusqu’à prof de 37m)
Toulon
Presqu’ile de Giens
© litto3D
© litto3D
© litto3D

3- Building database : IGN – Open Street Map, …
> Building footprint
> schools, roads,
hospital…
> Floors: 1,2,…
mardi 26 avril 2016
RIS/RIC
> 34

> 35
3- Building+DTM: DEM
MNE « Brut »
(Litto3D)
Bâti
(Litto3D)
Extraction du bâti par la
couche « bâti » de la
BDTopo de l’IGN (prise en
compte d’un buffer de
1 m)
MNT
(Litto3D traité par l’IGN)
MNE ne prenant en
compte que le bâti
> Lidar, Litto3D (SHOM-IGN), BDTopo (IGN), Google StreetView, field
observations

> 36
TypologieManning Chow, 1959
(Min-Norm-Max)
Manning
Engineers Australia, 2012Manning retenu
Béton, asphalte asphalte (0.013-0.016) 0,02 – 0,03 0.016
Prairie
short grass
(0.025-0.030-0.035)
high grass
(0.030- 0.035-0.050)
0,03 – 0,05 0.04
Champs
mature row crops
(0.025-0.035-0.045)
mature field crops
(0.030-0.040-0.050)
buissons: 0,05 – 0,07 0.05
Urbain dense 0,2 – 0,5 0.4
Urbain éparse 0,1 – 0,2 0.1
Forêt dense
heavy stand of
timber, a few down
trees, little
undergrowth, flood
stage below branches
(0.080-0.100-0.120)
0,07 -0,12 0.1
Forêt éparse
cleared land with tree
stumps, no sprouts
(0.030-0.040-0.050)
0.04
Surface en eau 0,02 – 0,04 0.03
Sol fortement rugueux 0.050-0.070-0.080 0.07
Sol moyennement rugueux 0.035-0.045-0.05 0.045
Sol faiblement rugueux 0.025-0.030-0.033 0.03
4 - Land-Use: Roughness
Bunya et al. (2010)
Le Roy et al. 2013

> 37 > 2
3 and 4: building representation models
Engineers Australia (2012)
Syme, 2008

> 38 > 2
4- Coastal flooding vs representation of urban areas Exemple Tsunami de Nice 1979
Le Roy et al. (2011, 2014)
Impermeable blocks Raised roughnes

SUMATRA 2004 (Mw 9.2) –Sri Lanka
Tsunami modeling : dec 2004 - (Mw 9.2)
8927000 8928000 8929000 8930000 8931000 8932000 8933000 8934000 8935000
665000
666000
667000
668000
669000
670000
671000
0
1
2
3
4
5
6
7
heau
(m)
limite d'inondation(donnée de terrain)
courbe d'élévation 6 m
bâti 8m, marée 0.5m,
frottement à terre 0.5
Simulation 6 : ondes longues,
A
C
D
D
B
- Nested grid -> 20m
- Homogeneous rougness
Poisson, Garcin et Pedreros, GJI, 2009

SUMATRA 2004 (Mw 9.2)
- Nested grid -> 2.5 m
- Buildings (Lidar datas)
- Land use
Inundation calculation at Sri Lanka (Galle bay)
8927000 8928000 8929000 8930000 8931000 8932000 8933000 8934000 8935000
665000
666000
667000
668000
669000
670000
671000
0
1
2
3
4
5
6
7
heau
(m)
limite d'inondation(donnée de terrain)
courbe d'élévation 6 m
bâti 8m, marée 0.5m,
frottement à terre 0.5
Simulation 6 : ondes longues,
A
C
D
D
B
Pedreros et al 2013 Pedreros et al. 2013

Inundation – Water height
With buildings and structures Without buildings and structures
Pedreros et al. 2013

mardi 26 avril 2016
RIS/RIC
> 42

A- Tsunami Hazard Evaluation 1-Historical database
2-Water level measurements – Field observations
3- Topo-bathymetry – Building database
4- Land-use
B- Evaluation of assets vulnerability 1- Damages to buildings
2-Damages to people
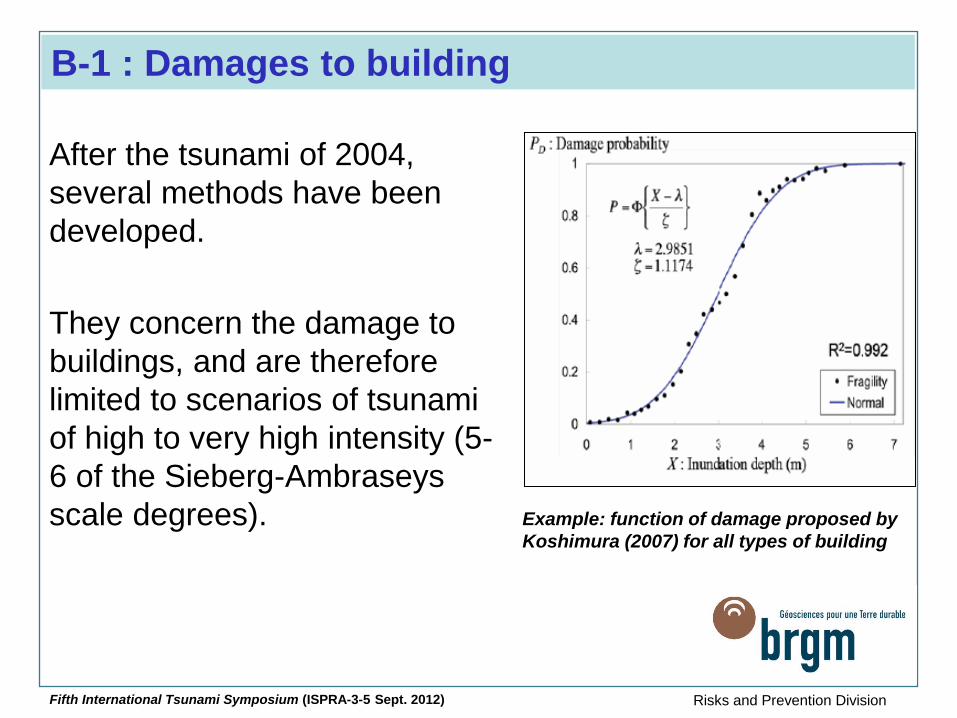
After the tsunami of 2004,
several methods have been
developed.
They concern the damage to
buildings, and are therefore
limited to scenarios of tsunami
of high to very high intensity (5-
6 of the Sieberg-Ambraseys
scale degrees). Example: function of damage proposed by
Koshimura (2007) for all types of building
B-1 : Damages to building
Fifth International Tsunami Symposium (ISPRA-3-5 Sept. 2012)
Risks and Prevention Division

B-1 : Damages to building – Sri Lanka
Peiris, 2006

Example of Sri-Lanka:
Typology & Damage scale
> Buildings typology (SW Sri Lanka) – L : light (wood, sheet metal…) ;
– B1 : light bricks;
– B2 : 2 ranks of bricks ;
– CB1 : concrete blocks, bad quality;
– CB2 : concrete blocks, good quality with concrete columns;
– C : reinforced concrete;
– LB : traditional in rubblestones.
> Damage scale • 5 classes (D0 to D4) :
– D0 : superficial damages, no structural damages.
– D1 : cracking, destruction of windows and doors, habitable and repairable ;
– D2 : collapsing of walls without damages to the building integrity, moderate scouring of fundations, not habitable but restorable ;
– D3 : destruction of several bearing walls, important scouring of fundations, not restorable ;
– D4 : total destruction of the building ;
D4
D3
D2
D1
Garcin et al. 2008

Example of Sri-Lanka: vulnerability
curves from the 2004 Sumatra
Tsunami
To each building type is
associated a damage
function by tsunami, based
on post-event observations.
This damage function is a
curve giving the damage
probability (from D4 to D1)
depending of the inundation
height affecting the
building.
Vulnerability functions (L)
0
10
20
30
40
50
60
70
80
90
100
0 0.5 1 1.5 2 2.5 3
highest submerged height (m)
dam
ag
e s
tate
pro
bab
ilit
y
(%
)
D4
D4+D3
D4+D3+D2
Vulnerability functions (CB2, LB, C)
0
10
20
30
40
50
60
70
80
90
100
0 1 2 3 4 5 6 7 8 9 10
highest submerged height (m)
da
ma
ge
sta
te p
rob
ab
ilit
y (
%)
D4
D4+D3
D4+D3+D2

Inundation height (from models)
Statistical attribution of building typology to each building
Quantification of the agression for each building
Damages for each building
1
2
3
4
Example of Sri-Lanka: After validation by field visits, mapping is made through a GIS tool developped by
BRGM (Armageddom)

mardi 26 avril 2016
RIS/RIC
> 49
Garcin et al. 2008

mardi 26 avril 2016
RIS/RIC
> 50

Damages to people: example of Nice 1979
On the Mediterranean French coast : low to medium exposition to
tsunami
few damages expected on structures
Most of the work concerns people vulnerability, and damages in
harbors, distinguishing:
- Season (touristic zones)
- Location (inside/outside the buildings)
- For people inside buildings, the type of building (is it a refuge or a
trap ?)
People vulnerability is based on their ability to move and to resist to the
flooding
Knowledge from fluvial inundations
Based on inundation height / current

> 52
Limit of ability to move for persons located outside
For an affected population
unable to move and
situated outdoors, a
mortality rate or strong
injuries of 10% was
determined:
average fixed on the basis of
the tsunami of Indonesia and
Japan (Gusha-Sapir (2006),
Nishikiori et al.) (2007) &
Mimura et al. (2011)
Assessing vulnerability of the stakes
Population located outdoors:
Risks and Prevention Division

Typology of the
structure > Classification
in 4 levels of
exposure
mardi 26 avril 2016
RIS/RIC
> 53
multi-story building surmounting a
transparent ground floor (presence of
shops, bay-windows...)
A multi-story building surmounting a
closed ground floor
A transparent one-story building
(ground floor).
A one-story building (ground floor)
with walls
0 : building not flooded
1 : building flooded, but people on the
ground floor can move around.
1,5 : single-level building, flooded.
People can move around but they
have no place to take refuge.
2 : building flooded. People on the
ground floor are swept away or
trapped.

For a population trapped on the ground floor of buildings exposed to
level 2 conditions, based on work by Guha-Sapir (2006), a 4%
mortality rate is obtained.
Underground levels (basements and car parks) constitute a specific
type. The risk is considered to be level 2 once flooding reaches them.
For aggressions higher than those appertaining to levels 0 to 2, the
behavior of the structure can be estimated using vulnerability curves
derived from observations of the 2004 Indian Ocean tsunami or those
proposed by Guillande et al. (2009), Garcin et al. (2007), Peiris (2006),
and Léone et al. (2006).
Assessing vulnerability of the stakes
Risks and Prevention Division

> 55
people
Inside a building
Several floors
Transparent ground floor
Closed ground floor
Floors above ground floor
Single floor
Transparent ground floor
Closed ground floor
Outside a building
Basements
Car parks
Assessing vulnerability of the stakes
People vulnerability : in each case, a matrixe of exposure is used
Risks and Prevention Division

Caractérisation de la zone
> Milieu bâti (BD topo IGN ©) • Délimitation individuelle du bâti
• Nbe étages
> Secteurs extérieurs • Délimitation plages & promenades
• Caractérisation fréquentation manière
qualitative
• Estimation nb personnes par site été / hiver /
jour nuit
• Localisation fréquentation des campings, des
ports, des parkings…

Beach density population
> Density
estimation
during summer
> Google earth
> Tourism
observatories
> Some specific
works (Robert
et al. 2008 Nice)

Scenarii with:
-the current distribution and typology of the built environment,
-the population density in 2010, off-season and during tourist season.
tsunami type 1979 : Damage assessment
La Salis (Antibes) beach
Four time scenarios:
mid-January 2012 at 2 a.m. and 3 p.m.
mid-August 2012 at 2 a.m. and 3 p.m.
Risks and Prevention Division

Résultats : la Salis (Antibes)
> 42 bâtiments impactés
par le flot (population
RDC emportée)
> Dommages faibles du
bâti (sauf structures
très légères comme
terrasses, etc.)

68 buildings affected
by the inundation, with
-25 would undergo a run-
up height exceeding 0.75
m,
-34 would be subjected to
a current speed of over 1.5
m/s
42 would present an
exposure level of 2
(impossibility for persons
inside to escape)
tsunami type 1979 : Damage assessment
Risks and Prevention Division
Terrier et al., 2013

Human losses at La Salis (Antibes) People outside
People inside building with an exposure level of 2,
on August 15th :
•200 in the middle of the afternoon > 5 to 10 deaths or serious injuries
•300 at night > 5 to 15 deaths or serious injuries
On Juanary :
•90, in the middle of the afternoon > less than 4 deaths or serious injuries
•150 at night, > 3 to 6 deaths or serious injuries
tsunami type 1979 : Damage assessment
La Salis quarter,
tsunami type
1979, people
oudoors
People unable to
withstand the
flood
Number of deaths
or serious injuries
August 15th in
mid-afternoon
2000 to 4000
people
200 to 400
January in mid-
afternoon
60 to 80 people 5 to 10
Terrier et al., 2013

mardi 26 avril 2016
RIS/RIC
> 62
MERCI