
Tsunami Hazard Map of the Elliott Bay Area, Seattle ... Tsunami Inundation from a Seattle Fault...
1
Figure 3. Freeze frames of animation of modeled tsunami at 30-second intervals (from left to right). The wave crest is colored pale blue. Note that because Harbor Island is uplifted by the earthquake, the Duwamish Waterway initially drains rapidly before the wave reflects off the north side of the bay and then inundates the Harbor Island area. WASHINGTON DIVISION OF GEOLOGYAND EARTH RESOURCES OPEN FILE REPORT 2003-14 Figure 1. (left) Map showing Seattle fault and associated ground deformation model used in this study. Numbered locations are localities mentioned in text. 1, Restoration Point; 2, Newcastle Hills; 3, Alki Point; 4, West Point; 5, Cultus Bay; 6, Snohomish Delta. Lake Cushman Lake Washington Seattle Tacoma 1 3 4 Lake Sammamish Snohomish River Everett 5 6 Newcastle Hills 2 –2–0 0–2 2–4 4–6 6–8 Uplift (meters) Cedar River Green River White River Puyallup River Nisqually River Olympia U . S. D E P A R T M EN T O F C OM M E RC E N A T I O N A L OC E A NI C A N D A TM O S P H E R I C A D M I N I S T R A T I O N 1 2 Washington Division of Geology and Earth Resources, PO Box 47007, Olympia, WA 98504-7007, National Oceanic and Atmospheric Administration, Pacific Marine Environmental Laboratory, 7600 Sand Point Way NE, Seattle, WA 98115-6349 [email protected], [email protected] [email protected] [email protected], [email protected], SCALE 1:50,000 MAP LOCATION Tsunami Hazard Map of the Elliott BayArea, Seattle, Washington: Modeled Tsunami Inundation from a Seattle Fault Earthquake by Timothy J. Walsh , Vasily V. Titov ,Angie J. Venturato , Harold O. Mofjeld , and Frank I. Gonzalez 2003 1 2 2 2 2 The phenomenon we call “tsunami” (soo-NAH-mee) is a series of traveling ocean waves of extremely long length generated by disturbances associated primarily with earthquakes occurring below or near the ocean floor. Underwater volcanic eruptions and landslides can also generate tsunamis. In the deep ocean, their length from wave crest to wave crest may be a hundred miles or more but with a wave height of only a few feet or less. They cannot be felt aboard ships nor can they be seen from the air in the open ocean. In deep water, the waves may reach speeds exceeding 500 miles per hour. Tsunamis are a threat to life and property to anyone living near the ocean. For example, in 1992 and 1993 over 2,000 people were killed by tsunamis occurring in Nicaragua, Indonesia and Japan. Property damage was nearly one billion dollars. The 1960 Chile Earthquake generated a Pacific-wide tsunami that caused widespread death and destruction in Chile, Hawaii, Japan and other areas in the Pacific. Large tsunamis have been known to rise over 100 feet, while tsunamis 10 to 20 feet high can be very destructive and cause many deaths and injuries. From by the U.S. Department of Commerce, National Oceanic and Atmospheric Administration, National Weather Service, Intergovernmental Oceanographic Commission, and International Tsunami Information Center Accessed at http://www.nws.noaa.gov/om/brochures/tsunami.htm on 8/27/02 Tsunamis—The Great Waves Current velocity: none medium 1.5 m/s < high 1.5 m/s > Figure 2. Computed current velocity zones. Note that velocities are highest along the shoreline and in narrow channels. One meter/second is ~2.2 mph. shoreline 15000 FEET 10000 5000 0 5000 1 1 0 2 3 MILES 1 1 0 2 3 4 5 KILOMETERS INTRODUCTION THE SEATTLE FAULT MODELING LIMITATIONS OF THE MAP ACKNOWLEDGMENTS REFERENCES CITED I 1995, Congress directed the National Oceanic and Atmospheric Administration (NOAA) to develop a plan to prot ct the West Coast from tsunamis generated locally. A panel of representatives from NOAA, the Federal Emergency Management Agency (FEMA), the U.S. Geological Survey (USGS) and the five Pacific coast states wrote the plan and submitted it to Congress, which created the National Tsunami Hazard Mitigation Program (NTHMP) in October of 1996. The National Tsunami Hazard Mitigation Program is designed to reduce the impact of tsunamis through warning guidance, hazard assessment, and mitigation. A key component of the hazard assessment for tsunamis is delineation of areas subject to tsunami inundation. This map is part of a series of tsunami inundation maps produced by the Washington Department of Natural Resources, Division of Geology and Earth Resources, in cooperation with the Washington Emergency Management Division, as a contribution of the National Tsunami Hazard Mitigation Program (Walsh and others, 2003a,b; 2002a,b; 2000). These maps are produced using computer models of earthquake- generated tsunamis from nearby seismic sources. The modeling for this map was done by the Center for the Tsunami Inundation Mapping Efforts (TIME) at NOAA's Pacific Marine Environmental Laboratory in Seattle for a scenario earthquake on the Seattle fault. Geographic features now known to be associated with the Seattle fault have been noted for many years. Vancouver (1798) noted that the fault-uplifted bedrock wavecut platform at Restoration Point (Fig. 1, Location 1) on Bainbridge Island “did not possess that beautiful variety of landscape, being an almost impenetrable wilderness of lofty trees” that characterized the rest of his explorations in Puget Sound. Kimball (1897) described the Newcastle Hills (Fig. 1, Location 2), part of the hanging wall of the fault, as a “postglacial eruption”. Daneš and others (1965) interpreted the large gravity and magnetic anomalies through central Puget Sound and the associated abrupt change in the sedimentary section thickness as an active fault with about 11 km of displacement. Rogers (1970) collected additional gravity and magnetic data across the structure and named it the Seattle–Bremerton fault. Gower (1978) demonstrated that the uplift at Restoration Point (Fig. 1, Location 1) was Holocene in age and Bucknam and others (1992) showed that there was an uplift of 7 meters produced on the fault about 1,000 years ago. In 1996, the first of a series of lidar (Light Detection And Ranging) surveys was flown over Bainbridge Island. This and subsequent lidar missions have enabled scientists to locate splays of the fault in a number of places accurately enough to dig trenches (Bucknam and others, 1999; Nelson and others, 2002). Lidar mapping and trenching have enabled scientists to accurately map the amount of uplift on the fault in some places. Also in 1996, the U.S. Geological Survey began several large-scale geophysical studies. An aeromagnetic study of the Puget Sound (Blakely and others, 1999, 2002) enabled more accurate location of the fault along its entire length. Seismic reflection and tomographic studies, such as SHIPS (Seismic Hazards Investigations in Puget Sound) and other geophysical studies in Puget Sound have greatly increased the understanding of the fault characteristics at depth (Pratt and others, 1997; Johnson and others, 1999; Brocher and others, 2001; ten Brink and others, 2002; Van Wagoner and others, 2002), although considerable uncertainties and controversy remain. There also is substantial evidence that earthquakes on the Seattle fault can generate tsunamis. Atwater and Moore (1992) showed that tsunamis inundated part of Whidbey Island (Fig. 1, Location 5) and West Point (Fig. 1, Location 4) about 1000 years ago, and Jacoby and others (1992) showed that a tree in the tsunami deposit at West Point died in the same season of the same year as a drowned forest carried into Lake Washington by a huge landslide from Mercer Island, strongly implicating the A.D. 900–930 event. A discontinuous sand layer along Snohomish delta distributaries—Ebey Slough, Steamboat Slough, Union Slough, and Snohomish River (Fig. 1, Location 6)—also probably was deposited by the tsunami from the large A.D. 900–930 earthquake on the Seattle fault (Bourgeois and Johnson, 2001). Tsunami inundation shown on the map is based on a computer model of waves generated by the Seattle fault (Titov and others, in press). The model used is the finite difference model of Titov and Synolakis (1998), also known as the Method of Splitting Tsunami (MOST) model (Titov and González, 1997). It uses a grid of topographic and bathymetric elevations and calculates a wave elevation and velocity at each gridpoint at specified time intervals to simulate the generation, propagation and inundation of tsunamis in the Elliot Bay area. In this MOST model study, the tsunami is generated by a Seattle fault deformation model that simulates the A.D. 900–930 event as a credible worst-case scenario of magnitude 7.3. The magnitude was chosen to be consistent with the 2002 USGS update of the National Seismic Hazard Maps (Frankel and others, 2002). Parameter values are based on Brocher and others (2001), Calvert and Fisher (2001), and ten Brink and others (2002). 1 0.5 15.2 20 87.9 60 1 2 0.5 6.3 20 86.6 60 1 3 0.5 8.9 20 96.0 60 12 4 0.5 3.2 20 128.8 60 11 5 0.5 11.5 20 99.3 60 4 6 0.5 14.9 20 81.0 60 1 The slip distribution was constrained, through trial-and-error, to match available field estimates of vertical displacement at three sites—Alki Point (Fig. 1, Location 3; +4 m), Restoration Point (Fig. 1, Location 1; +7 m) and West Point (Fig. 1, Location 4; –1 ±0.5 m). Titov and others (in press) also modeled a M7.6 event, and the tsunami inundation values and patterns were essentially the same as for the M7.3 event. No doubt this is due to the fact that the deformation patterns and values were very similar for both events, since they were each constrained by field estimates at the three sites. Also, the smaller ground displacement zone of the M7.3 event forms a more concentrated tsunami source that compensates for its smaller overall displacement. The computed tsunami inundation is shown on the map in three color-coded depth ranges—0–0.5 m, 0.5–2 m, and greater than 2 m. These depth ranges were chosen because they are approximately knee-high or less, knee-high to head-high, and more than head-high. The limit of tsunami inundation is the landward edge of the green zone. In previous maps, we have shown only the edge of inundation, but for this map, much higher resolution bathymetric and topographic data were available. Figure 2 also shows current velocities in two zones—less than or greater than 1.5 meters/second (~3 miles/hour), which is the current speed at which it would be difficult to stand. Within this zone, computed velocities locally exceed 20 meters/second (~40 miles/hour). Computed wave heights in Elliott Bay were approximately 6 meters. Figure 3 shows a time progression of the wave across Elliott Bay at 30-second intervals. Note that because Harbor Island is uplifted by the earthquake, the Duwamish Waterway initially drains rapidly before the wave reflects off the north side of the bay and then inundates the Harbor Island area. Because the nature of the tsunami depends on the initial deformation of the earthquake, which is poorly understood, the largest source of uncertainty is the input earthquake. The earthquake scenario used in this modeling was selected to honor the paleoseismic constraints, but the next Seattle fault earthquake may be substantially different from these. Sherrod and others (2000) show that an uplift event at Restoration Point predating the A.D. 900–930 event was smaller. Trenching of subsidiary structures to the Seattle fault that are thought to be coseimic with the main fault trace (Nelson and others, 2002) indicate that there were at least two earthquakes in the 1500 years before the A.D. 900–930 event. These, however, did not produce prominent uplifted wavecut platforms similar to the one made by the A.D. 900–930 event, suggesting that significant earthquakes have occurred on the fault that had different and smaller uplifts in central Puget Sound. Another significant limitation is that the resolution of the modeling is no greater or more accurate than the bathymetric and topographic data used. This can be up to 50 meters horizontally, although high-resolution multibeam data (Gardner and others, 2001) is available for Elliott Bay and 2-foot contour topography is available for the city of Seattle. The model run does not include the influences of changes in tides and is referred to mean high water. The tide stage and tidal currents can amplify or reduce the impact of a tsunami on a specific community. In Elliott Bay, the mean spring tide range is about 11 feet and can be as much as about 16 feet (NOAA, accessed at http://co-ops.nos.noaa.gov/co-ops.html, June 25, 2003). This means that, while the modeling can be a useful tool to guide evacuation planning, it is not of sufficient resolution to be useful for land-use planning. This project was supported by the National Tsunami Hazards Mitigation Program (NTHMP) in cooperation with the city of Seattle and the Washington Emergency Management Division. Information about NTHMP is available at http://www.pmel.noaa.gov/tsunami- hazard/. Discussions with Tom Pratt, Brian Sherrod, and Craig Weaver (all USGS, Seattle) were invaluable for calibrating the fault source model. Karl Wegmann and Steve Palmer, both Washington Division of Geology and Earth Resources, provided helpful reviews. n e Table 1. Segment (west to east) parameters for magnitude 7.3 Seattle fault earthquake models. The vertical deformation pattern is shown in Figure 1. Segment Depth (km) Length (km) Width (km) Strike (°) Dip (°) Slip (m) Atwater, B. F.; Moore, A. L., 1992, A tsunami about 1000 years ago in Puget Sound, Washington: Science, v. 258, no. 5088, p. 1614-1617. Blakely, R. J.; Wells, R. E.; Weaver, C. S., 1999, Puget Sound aeromagnetic maps and data: U.S. Geological Survey Open-File Report 99-514, version 1.0. [Accessed Oct. 3, 2000, at http://geopubs.wr.usgs.gov/open-file/of99-514/] Blakely, R. J.; Wells, R. E.; Weaver, C. S.; Johnson, S.Y., 2002, Location, structure, and seismicity of the Seattle fault zone, Washington—Evidence from aeromagnetic anomalies, geologic mapping, and seismic-reflection data: Geological Society of America Bulletin, v. 114, no. 2, p. 169-177. Brocher, T. M.; Parsons, T. E.; Blakely, R. J.; Christensen, N. I.; Fisher, M.A.; Wells, R. E.; SHIPS Working Group, 2001, Upper crustal structure in Puget Lowland, Washington—Results from the 1998 Seismic Hazards Investigations in Puget Sound: Journal of Geophysical Research, v. 106, no. B7, p. 13,541-13,564. Bourgeois, Joanne; Johnson, S. Y., 2001, Geologic evidence of earthquakes at the Snohomish delta, Washington, in the past 1200 yr: Geological Society ofAmerica Bulletin, v. 113, no. 4, p. 482- 494. Bucknam, R. C.; Hemphill-Haley, Eileen; Leopold, E. B., 1992, Abrupt uplift within the past 1700 years at southern Puget Sound, Washington: Science, v. 258, no. 5088, p. 1611-1614. Bucknam, R. C.; Sherrod, B. L.; Elfendahl, G. W., 1999, A fault scarp of probable Holocene age in the Seattle fault zone, Bainbridge Island, Washington [abstract]: Seismological Research Letters, v. 70, no. 2, p. 233. Calvert, A. J.; Fisher, M. A.; SHIPS Working Group, 2001, Imaging the Seattle fault zone with high- resolution seismic tomography: Geophysical Research Letters, v. 28, no. 12, p. 2337-2340. Daneš, Z. F.; Bonno, M.; Brau, J. E.; Gilham, W. D.; Hoffman, T. F.; Johansen, D.; Jones, M. H.; Malfait, Bruce; Masten, J.; Teague, G. O., 1965, Geophysical investigation of the southern Puget Sound area, Washington: Journal of Geophysical Research, v. 70, no. 22, p. 5573-5580. Frankel,A. D.; Petersen, M. D.; Mueller, C. S.; Haller, K. M.; Wheeler, R. L.; Leyendecker, E. V.; Wesson, R. L.; Harmsen, S. C.; Cramer, C. H.; Perkins, D. M.; Rukstales, K. S., 2002, Documentation for the 2002 Update of the National Seismic Hazard Maps: U.S. Geological Survey Open-File Report 02-420. [Accessed June 25, 2003, at http://pubs.usgs.gov/of/2002/ofr- 02-420/] Gardner, J. V.; van denAmeele, E. J.; Dartnell, Peter, 2001, Multibeam mapping of the major deltas of southern Puget Sound, Washington: U.S. Geological Survey Open-File Report 01-266, 1 v. Gower, H. D., 1978, Tectonic map of the Puget Sound region, Washington, showing locations of faults, principal folds, and large-scale Quaternary deformation: U.S. Geological Survey Open-File Report 78-426, 22 p., 1 plate, scale 1:250,000. Jacoby, G. C.;Williams, P. L.; Buckley, B. M., 1992,Tree ring correlation between prehistoric landslides and abrupt tectonic events in Seattle, Washington: Science, v. 258, no. 5088, p. 1621- 1623. Johnson, S.Y.; Dadisman, S. V.; Childs, J. R.; Stanley, W. D., 1999,Active tectonics of the Seattle fault and central Puget Sound, Washington—Implications for earthquake hazards: Geological Society of America Bulletin, v. 111, no. 7, p. 1042-1053, 1 plate. Kimball, J. P., 1897, Physiographic geology of the Puget Sound basin [in 2 parts]: American Geologist, v. 19, no. 4, p. 225-237 [part 1]; v. 19, no. 5, p. 304-322 [part 2]. Nelson,A. R.; Johnson, S. Y.; Wells, R. E.; Pezzopane, S. K.; Kelsey, H. M.; Sherrod, B. L.; Bradley, L.-A.; Koehler, R. D., III; Bucknam, R. C.; Haugerud, R.A.; Laprade, W. T., 2002, Field and laboratory data from an earthquake history study of the Toe Jam Hill fault, Bainbridge Island, Washington: U.S. Geological Survey Open-File Report 02-60, 1 v., 2 plates. Pratt, T. L.; Johnson, S. Y.; Potter, C. J.; Stephenson, W. J.; Finn, C.A., 1997, Seismic reflection images beneath Puget Sound, western Washington State—The Puget Lowland thrust sheet hypothesis: Journal of Geophysical Research, v. 102, no. B12, p. 27,469-27,489. Rogers, W. P., 1970, A geological and geophysical study of the central Puget Sound lowland: University of Washington Doctor of Philosophy thesis, 123 p., 9 plates. Sherrod, B. L.; Bucknam, R. C.; Leopold, E. B., 2000, Holocene relative sea level changes along the Seattle fault at Restoration Point, Washington: Quaternary Research, v. 54, no. 3, p. 384-393. ten Brink, U. S.; Molzer, P. C.; Fisher, M.A.; Blakely, R. J.; Bucknam, R. C.; Parsons, T. E.; Crosson, R. S.; Creager, K. C., 2002, Subsurface geometry and evolution of the Seattle fault zone and the Seattle basin, Washington: Seismological Society of America Bulletin, v. 92, no. 5, p. 1737-1753. Titov, V. V.; Gonzalez, F. I., 1997, Implementation and testing of the Method of Splitting Tsunami (MOST) model: NOAATechnical Memorandum ERL PMEL-112 (PB98-122773), 11 p. Titov, V. V.; Gonzalez, F. I.; Mofjeld, H. O.; Venturato,A. J., (in press), NOAATIME Seattle tsunami mapping project—Procedures, data sources, and products: NOAA Technical Memorandum OAR PMEL-124, 15 p. Titov, V. V.; Synolakis, C. E., 1998, Numerical modeling of tidal wave runup: Journal of Waterway, Port, Coastal and Ocean Engineering, v. 124, no. 4, p. 157-171. Vancouver, George, 1798, repr. 1992, A voyage of discovery to the north Pacific Ocean, and round the world; in which the coast of north-west American has been carefully examined and accurately surveyed—Undertaken by His Majesty's command, principally with a view to ascertain the existence of any navigable communication between the north Pacific and north Atlantic Oceans; and performed in the years 1790, 1791, 1792, 1793, 1794, and 1795: G. G. and J. Robinson [London], 3 v. VanWagoner,T. M.; Crosson, R. S.; Creager, K. C.; Medema, G. F.; Preston, L.A.; Symons, N. P.; Brocher, T. M., 2002, Crustal structure and relocated earthquakes in the Puget Lowland, Washington, from high-resolution seismic tomography: Journal of Geophysical Research, v. 107, no. B12, 2381, DOI 10.1029/2001JB000710, p. ESE 22-1 - 22-23. Walsh, T. J.; Caruthers, C. G.; Heinitz,A. C.; Myers, E. P., III; Baptista,A. M.; Erdakos, G. B.; Kamphaus, R. A., 2000, Tsunami hazard map of the southern Washington coast—Modeled tsunami inundation from a Cascadia subduction zone earthquake: Washington Division of Geology and Earth Resources Geologic Map GM-49, 1 sheet, scale 1:100,000, with 12 p. text. Walsh, T. J.; Myers, E. P., III; Baptista,A. M., 2002a, Tsunami inundation map of the PortAngeles, Washington area: Washington Division of Geology and Earth Resources Open File Report 2002- 1, 1 sheet, scale 1:24,000. Walsh, T. J.; Myers, E. P., III; Baptista,A. M., 2002b, Tsunami inundation map of the Port Townsend, Washington area: Washington Division of Geology and Earth Resources Open File Report 2002- 2, 1 sheet, scale 1:24,000. Walsh, T. J.; Myers, E. P., III; Baptista,A. M., 2003a, Tsunami inundation map of the Neah Bay, Washington, area: Washington Division of Geology and Earth Resources Open File Report 2003- 2, 1 sheet, scale 1:24,000. Walsh, T. J.; Myers, E. P., III; Baptista,A. M., 2003b, Tsunami inundation map of the Quileute, Washington, area: Washington Division of Geology and Earth Resources Open File Report 2003- 1, 1 sheet, scale 1:24,000. Depth of inundation: 0–.5 meters .5–2 meters 2–5 meters NOAA TIME Center Pacific Marine Environmental Laboratory Seattle, Washington
Transcript of Tsunami Hazard Map of the Elliott Bay Area, Seattle ... Tsunami Inundation from a Seattle Fault...
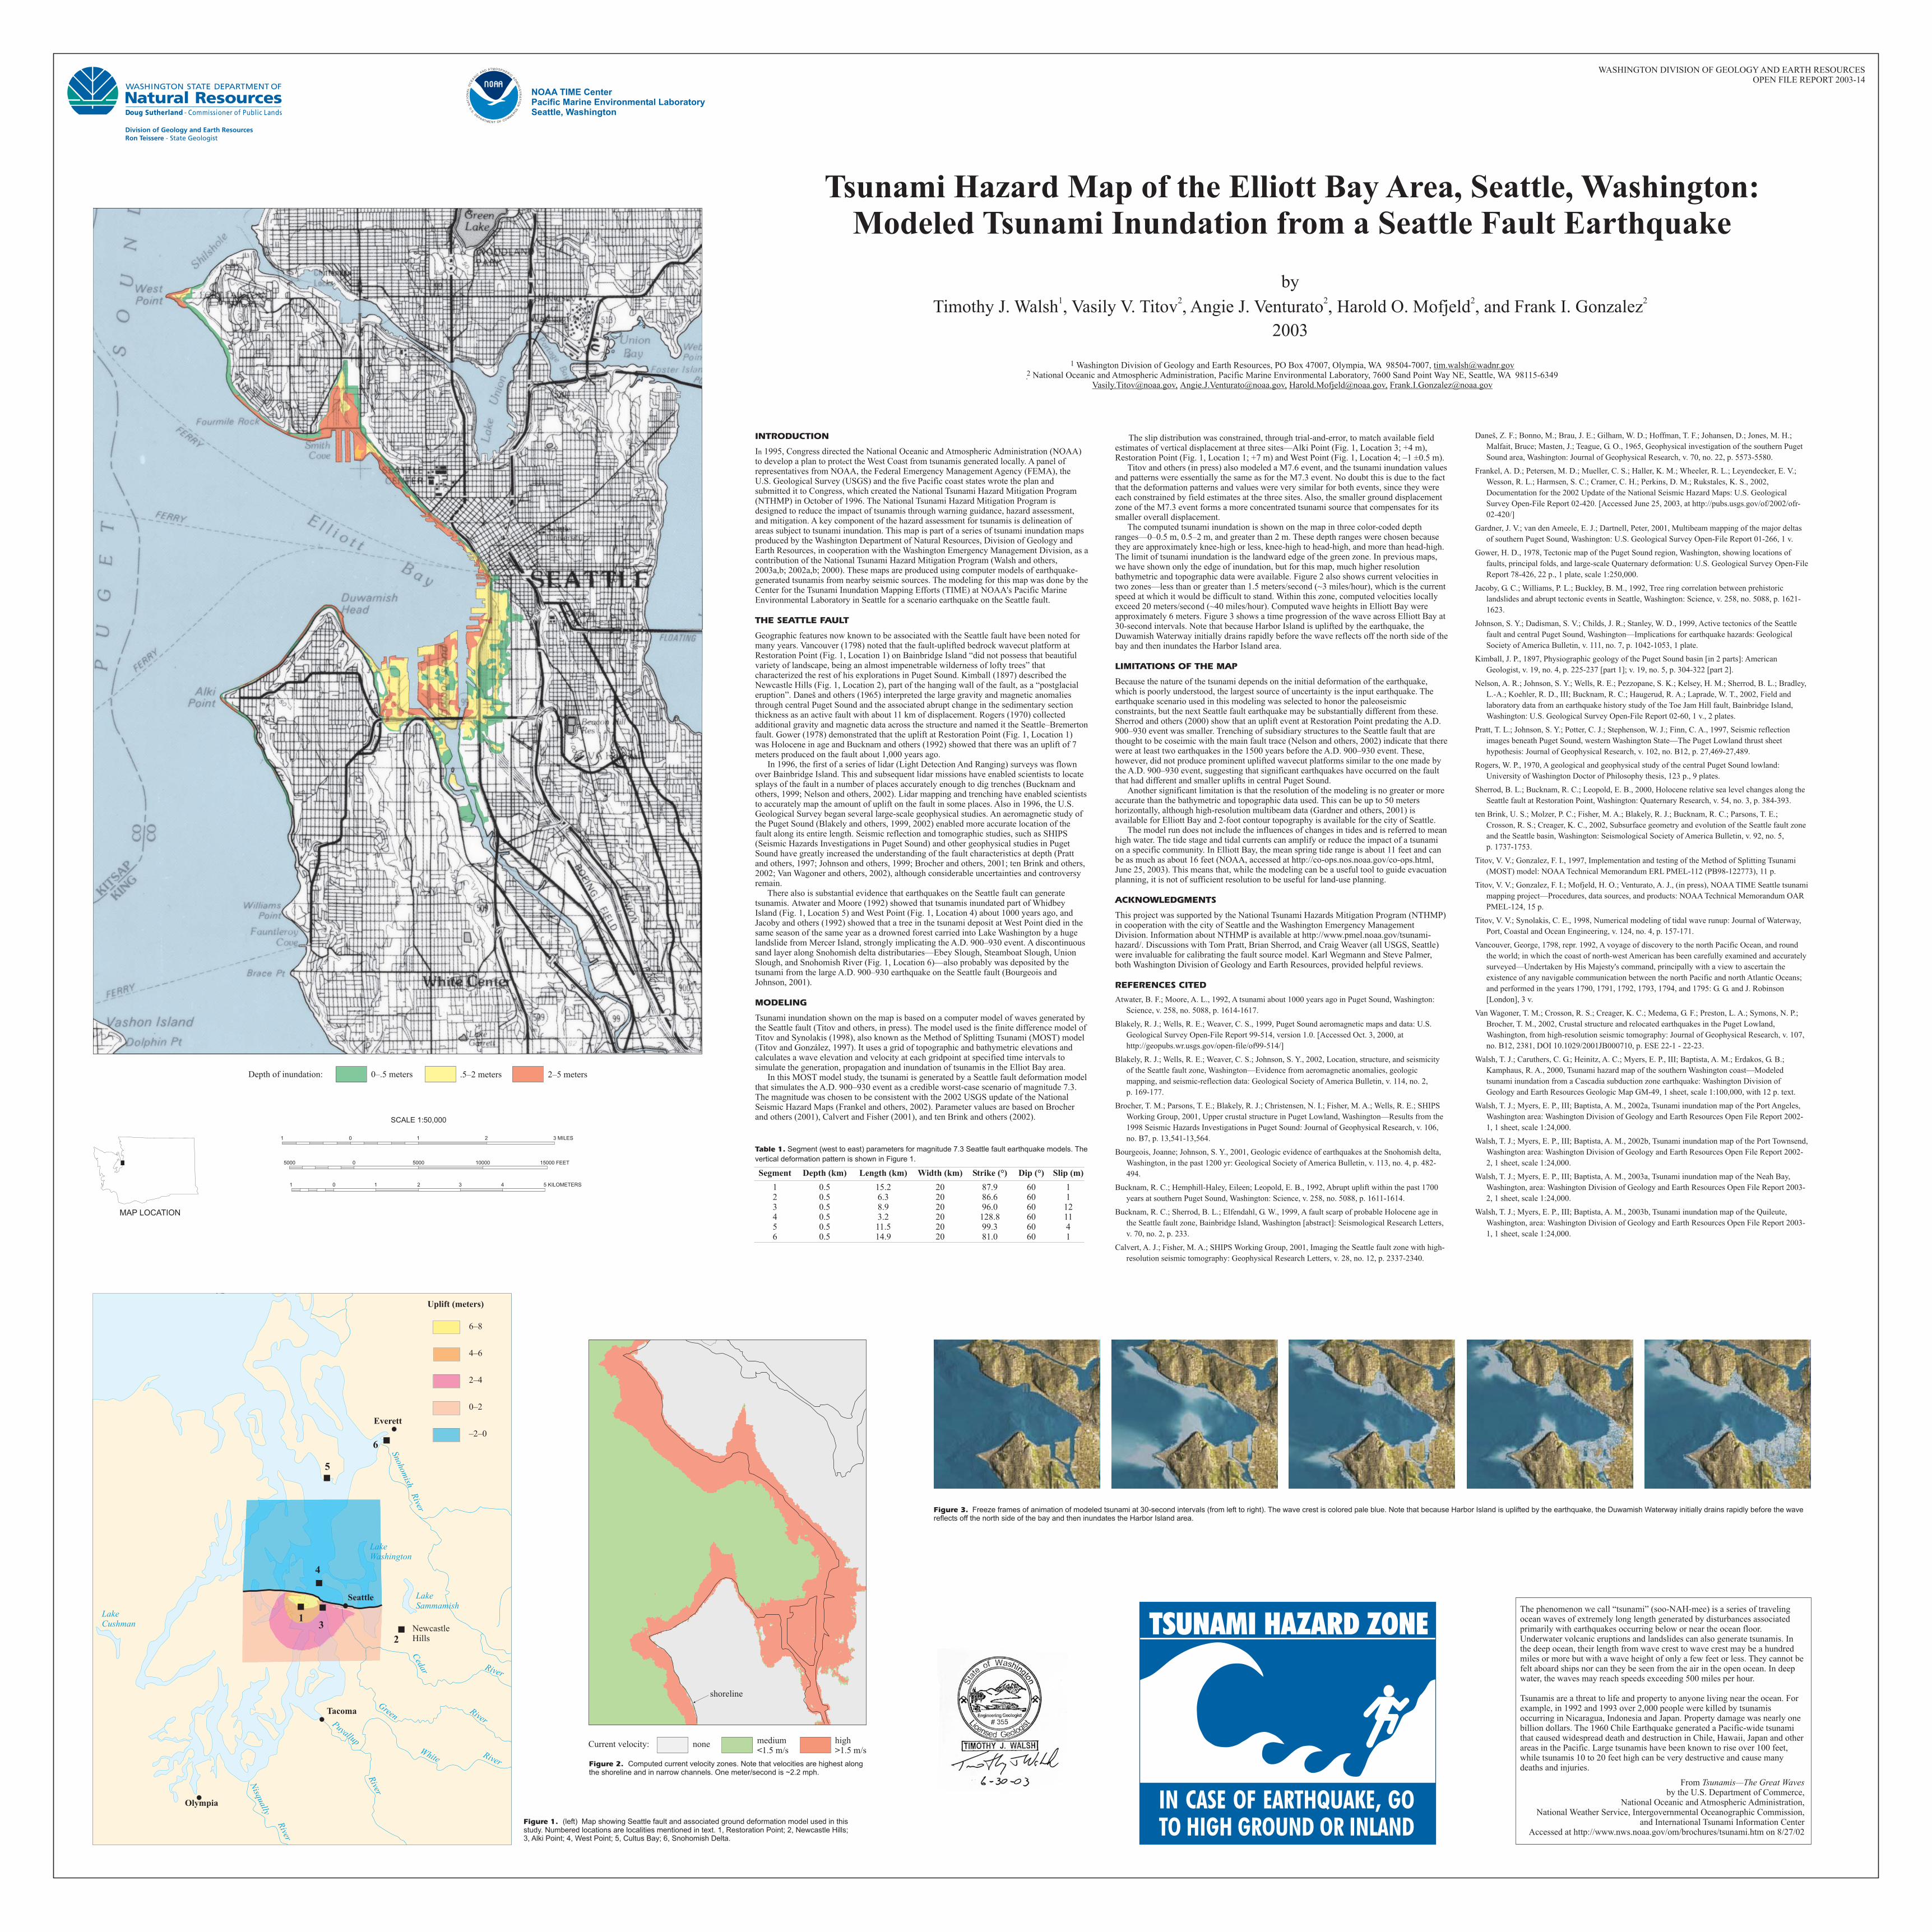
Figure 3. Freeze frames of animation of modeled tsunami at 30-second intervals (from left to right). The wave crest is colored pale blue. Note that because Harbor Island is uplifted by the earthquake, the Duwamish Waterway initially drains rapidly before the wavereflects off the north side of the bay and then inundates the Harbor Island area.
WASHINGTON DIVISION OF GEOLOGY AND EARTH RESOURCESOPEN FILE REPORT 2003-14
Figure 1. (left) Map showing Seattle fault and associated ground deformation model used in thisstudy. Numbered locations are localities mentioned in text. 1, Restoration Point; 2, Newcastle Hills;3, Alki Point; 4, West Point; 5, Cultus Bay; 6, Snohomish Delta.
LakeCushman
LakeWashington
Seattle
Tacoma
13
4
LakeSammamish
Snohomish
River
Everett
5
6
NewcastleHills2
–2–0
0–2
2–4
4–6
6–8
Uplift (meters)
Cedar River
GreenRiver
White River
Puyallup
River
Nisqually
River
Olympia
U.S
. DEPARTMENT O F COMM
ER
CE
NA
TIO
NA
L O
CE
A
N IC A
ND ATMOSPHERIC AD
MIN
I ST
RA
TIO
N
1
2Washington Division of Geology and Earth Resources, PO Box 47007, Olympia, WA 98504-7007,
National Oceanic and Atmospheric Administration, Pacific Marine Environmental Laboratory, 7600 Sand Point Way NE, Seattle, WA [email protected], [email protected]
[email protected], [email protected],
SCALE 1:50,000
MAP LOCATION
Tsunami Hazard Map of the Elliott Bay Area, Seattle, Washington:Modeled Tsunami Inundation from a Seattle Fault Earthquake
by
Timothy J. Walsh , Vasily V. Titov , Angie J. Venturato , Harold O. Mofjeld , and Frank I. Gonzalez
2003
1 2 2 2 2
The phenomenon we call “tsunami” (soo-NAH-mee) is a series of travelingocean waves of extremely long length generated by disturbances associatedprimarily with earthquakes occurring below or near the ocean floor.Underwater volcanic eruptions and landslides can also generate tsunamis. Inthe deep ocean, their length from wave crest to wave crest may be a hundredmiles or more but with a wave height of only a few feet or less. They cannot befelt aboard ships nor can they be seen from the air in the open ocean. In deepwater, the waves may reach speeds exceeding 500 miles per hour.
Tsunamis are a threat to life and property to anyone living near the ocean. Forexample, in 1992 and 1993 over 2,000 people were killed by tsunamisoccurring in Nicaragua, Indonesia and Japan. Property damage was nearly onebillion dollars. The 1960 Chile Earthquake generated a Pacific-wide tsunamithat caused widespread death and destruction in Chile, Hawaii, Japan and otherareas in the Pacific. Large tsunamis have been known to rise over 100 feet,while tsunamis 10 to 20 feet high can be very destructive and cause manydeaths and injuries.
Fromby the U.S. Department of Commerce,
National Oceanic and Atmospheric Administration,National Weather Service, Intergovernmental Oceanographic Commission,
and International Tsunami Information CenterAccessed at http://www.nws.noaa.gov/om/brochures/tsunami.htm on 8/27/02
Tsunamis—The Great Waves
Current velocity: none medium1.5 m/s<
high1.5 m/s>
Figure 2. Computed current velocity zones. Note that velocities are highest alongthe shoreline and in narrow channels. One meter/second is ~2.2 mph.
shoreline
15000 FEET10000500005000
11 0 2 3 MILES
11 0 2 3 4 5 KILOMETERS
INTRODUCTION
THE SEATTLE FAULT
MODELING
LIMITATIONS OF THE MAP
ACKNOWLEDGMENTS
REFERENCES CITED
I 1995, Congress directed the National Oceanic and Atmospheric Administration (NOAA)to develop a plan to prot ct the West Coast from tsunamis generated locally. A panel ofrepresentatives from NOAA, the Federal Emergency Management Agency (FEMA), theU.S. Geological Survey (USGS) and the five Pacific coast states wrote the plan andsubmitted it to Congress, which created the National Tsunami Hazard Mitigation Program(NTHMP) in October of 1996. The National Tsunami Hazard Mitigation Program isdesigned to reduce the impact of tsunamis through warning guidance, hazard assessment,and mitigation. A key component of the hazard assessment for tsunamis is delineation ofareas subject to tsunami inundation. This map is part of a series of tsunami inundation mapsproduced by the Washington Department of Natural Resources, Division of Geology andEarth Resources, in cooperation with the Washington Emergency Management Division, as acontribution of the National Tsunami Hazard Mitigation Program (Walsh and others,2003a,b; 2002a,b; 2000). These maps are produced using computer models of earthquake-generated tsunamis from nearby seismic sources. The modeling for this map was done by theCenter for the Tsunami Inundation Mapping Efforts (TIME) at NOAA's Pacific MarineEnvironmental Laboratory in Seattle for a scenario earthquake on the Seattle fault.
Geographic features now known to be associated with the Seattle fault have been noted formany years. Vancouver (1798) noted that the fault-uplifted bedrock wavecut platform atRestoration Point (Fig. 1, Location 1) on Bainbridge Island “did not possess that beautifulvariety of landscape, being an almost impenetrable wilderness of lofty trees” thatcharacterized the rest of his explorations in Puget Sound. Kimball (1897) described theNewcastle Hills (Fig. 1, Location 2), part of the hanging wall of the fault, as a “postglacialeruption”. Daneš and others (1965) interpreted the large gravity and magnetic anomaliesthrough central Puget Sound and the associated abrupt change in the sedimentary sectionthickness as an active fault with about 11 km of displacement. Rogers (1970) collectedadditional gravity and magnetic data across the structure and named it the Seattle–Bremertonfault. Gower (1978) demonstrated that the uplift at Restoration Point (Fig. 1, Location 1)was Holocene in age and Bucknam and others (1992) showed that there was an uplift of 7meters produced on the fault about 1,000 years ago.
In 1996, the first of a series of lidar (Light Detection And Ranging) surveys was flownover Bainbridge Island. This and subsequent lidar missions have enabled scientists to locatesplays of the fault in a number of places accurately enough to dig trenches (Bucknam andothers, 1999; Nelson and others, 2002). Lidar mapping and trenching have enabled scientiststo accurately map the amount of uplift on the fault in some places. Also in 1996, the U.S.Geological Survey began several large-scale geophysical studies. An aeromagnetic study ofthe Puget Sound (Blakely and others, 1999, 2002) enabled more accurate location of thefault along its entire length. Seismic reflection and tomographic studies, such as SHIPS(Seismic Hazards Investigations in Puget Sound) and other geophysical studies in PugetSound have greatly increased the understanding of the fault characteristics at depth (Prattand others, 1997; Johnson and others, 1999; Brocher and others, 2001; ten Brink and others,2002; Van Wagoner and others, 2002), although considerable uncertainties and controversyremain.
There also is substantial evidence that earthquakes on the Seattle fault can generatetsunamis. Atwater and Moore (1992) showed that tsunamis inundated part of WhidbeyIsland (Fig. 1, Location 5) and West Point (Fig. 1, Location 4) about 1000 years ago, andJacoby and others (1992) showed that a tree in the tsunami deposit at West Point died in thesame season of the same year as a drowned forest carried into Lake Washington by a hugelandslide from Mercer Island, strongly implicating the A.D. 900–930 event. A discontinuoussand layer along Snohomish delta distributaries—Ebey Slough, Steamboat Slough, UnionSlough, and Snohomish River (Fig. 1, Location 6)—also probably was deposited by thetsunami from the large A.D. 900–930 earthquake on the Seattle fault (Bourgeois andJohnson, 2001).
Tsunami inundation shown on the map is based on a computer model of waves generated bythe Seattle fault (Titov and others, in press). The model used is the finite difference model ofTitov and Synolakis (1998), also known as the Method of Splitting Tsunami (MOST) model(Titov and González, 1997). It uses a grid of topographic and bathymetric elevations andcalculates a wave elevation and velocity at each gridpoint at specified time intervals tosimulate the generation, propagation and inundation of tsunamis in the Elliot Bay area.
In this MOST model study, the tsunami is generated by a Seattle fault deformation modelthat simulates the A.D. 900–930 event as a credible worst-case scenario of magnitude 7.3.The magnitude was chosen to be consistent with the 2002 USGS update of the NationalSeismic Hazard Maps (Frankel and others, 2002). Parameter values are based on Brocherand others (2001), Calvert and Fisher (2001), and ten Brink and others (2002).
1 0.5 15.2 20 87.9 60 12 0.5 6.3 20 86.6 60 13 0.5 8.9 20 96.0 60 124 0.5 3.2 20 128.8 60 115 0.5 11.5 20 99.3 60 46 0.5 14.9 20 81.0 60 1
The slip distribution was constrained, through trial-and-error, to match available fieldestimates of vertical displacement at three sites—Alki Point (Fig. 1, Location 3; +4 m),Restoration Point (Fig. 1, Location 1; +7 m) and West Point (Fig. 1, Location 4; –1 ±0.5 m).
Titov and others (in press) also modeled a M7.6 event, and the tsunami inundation valuesand patterns were essentially the same as for the M7.3 event. No doubt this is due to the factthat the deformation patterns and values were very similar for both events, since they wereeach constrained by field estimates at the three sites. Also, the smaller ground displacementzone of the M7.3 event forms a more concentrated tsunami source that compensates for itssmaller overall displacement.
The computed tsunami inundation is shown on the map in three color-coded depthranges—0–0.5 m, 0.5–2 m, and greater than 2 m. These depth ranges were chosen becausethey are approximately knee-high or less, knee-high to head-high, and more than head-high.The limit of tsunami inundation is the landward edge of the green zone. In previous maps,we have shown only the edge of inundation, but for this map, much higher resolutionbathymetric and topographic data were available. Figure 2 also shows current velocities intwo zones—less than or greater than 1.5 meters/second (~3 miles/hour), which is the currentspeed at which it would be difficult to stand. Within this zone, computed velocities locallyexceed 20 meters/second (~40 miles/hour). Computed wave heights in Elliott Bay wereapproximately 6 meters. Figure 3 shows a time progression of the wave across Elliott Bay at30-second intervals. Note that because Harbor Island is uplifted by the earthquake, theDuwamish Waterway initially drains rapidly before the wave reflects off the north side of thebay and then inundates the Harbor Island area.
Because the nature of the tsunami depends on the initial deformation of the earthquake,which is poorly understood, the largest source of uncertainty is the input earthquake. Theearthquake scenario used in this modeling was selected to honor the paleoseismicconstraints, but the next Seattle fault earthquake may be substantially different from these.Sherrod and others (2000) show that an uplift event at Restoration Point predating the A.D.900–930 event was smaller. Trenching of subsidiary structures to the Seattle fault that arethought to be coseimic with the main fault trace (Nelson and others, 2002) indicate that therewere at least two earthquakes in the 1500 years before the A.D. 900–930 event. These,however, did not produce prominent uplifted wavecut platforms similar to the one made bythe A.D. 900–930 event, suggesting that significant earthquakes have occurred on the faultthat had different and smaller uplifts in central Puget Sound.
Another significant limitation is that the resolution of the modeling is no greater or moreaccurate than the bathymetric and topographic data used. This can be up to 50 metershorizontally, although high-resolution multibeam data (Gardner and others, 2001) isavailable for Elliott Bay and 2-foot contour topography is available for the city of Seattle.
The model run does not include the influences of changes in tides and is referred to meanhigh water. The tide stage and tidal currents can amplify or reduce the impact of a tsunamion a specific community. In Elliott Bay, the mean spring tide range is about 11 feet and canbe as much as about 16 feet (NOAA, accessed at http://co-ops.nos.noaa.gov/co-ops.html,June 25, 2003). This means that, while the modeling can be a useful tool to guide evacuationplanning, it is not of sufficient resolution to be useful for land-use planning.
This project was supported by the National Tsunami Hazards Mitigation Program (NTHMP)in cooperation with the city of Seattle and the Washington Emergency ManagementDivision. Information about NTHMP is available at http://www.pmel.noaa.gov/tsunami-hazard/. Discussions with Tom Pratt, Brian Sherrod, and Craig Weaver (all USGS, Seattle)were invaluable for calibrating the fault source model. Karl Wegmann and Steve Palmer,both Washington Division of Geology and Earth Resources, provided helpful reviews.
n
e
Table 1. Segment (west to east) parameters for magnitude 7.3 Seattle fault earthquake models. The
vertical deformation pattern is shown in Figure 1.
Segment Depth (km) Length (km) Width (km) Strike (°) Dip (°) Slip (m)
Atwater, B. F.; Moore, A. L., 1992, A tsunami about 1000 years ago in Puget Sound, Washington:
Science, v. 258, no. 5088, p. 1614-1617.
Blakely, R. J.; Wells, R. E.; Weaver, C. S., 1999, Puget Sound aeromagnetic maps and data: U.S.
Geological Survey Open-File Report 99-514, version 1.0. [Accessed Oct. 3, 2000, at
http://geopubs.wr.usgs.gov/open-file/of99-514/]
Blakely, R. J.; Wells, R. E.; Weaver, C. S.; Johnson, S. Y., 2002, Location, structure, and seismicity
of the Seattle fault zone, Washington—Evidence from aeromagnetic anomalies, geologic
mapping, and seismic-reflection data: Geological Society of America Bulletin, v. 114, no. 2,
p. 169-177.
Brocher, T. M.; Parsons, T. E.; Blakely, R. J.; Christensen, N. I.; Fisher, M. A.; Wells, R. E.; SHIPS
Working Group, 2001, Upper crustal structure in Puget Lowland, Washington—Results from the
1998 Seismic Hazards Investigations in Puget Sound: Journal of Geophysical Research, v. 106,
no. B7, p. 13,541-13,564.
Bourgeois, Joanne; Johnson, S. Y., 2001, Geologic evidence of earthquakes at the Snohomish delta,
Washington, in the past 1200 yr: Geological Society of America Bulletin, v. 113, no. 4, p. 482-
494.
Bucknam, R. C.; Hemphill-Haley, Eileen; Leopold, E. B., 1992, Abrupt uplift within the past 1700
years at southern Puget Sound, Washington: Science, v. 258, no. 5088, p. 1611-1614.
Bucknam, R. C.; Sherrod, B. L.; Elfendahl, G. W., 1999, A fault scarp of probable Holocene age in
the Seattle fault zone, Bainbridge Island, Washington [abstract]: Seismological Research Letters,
v. 70, no. 2, p. 233.
Calvert, A. J.; Fisher, M. A.; SHIPS Working Group, 2001, Imaging the Seattle fault zone with high-
resolution seismic tomography: Geophysical Research Letters, v. 28, no. 12, p. 2337-2340.
Daneš, Z. F.; Bonno, M.; Brau, J. E.; Gilham, W. D.; Hoffman, T. F.; Johansen, D.; Jones, M. H.;
Malfait, Bruce; Masten, J.; Teague, G. O., 1965, Geophysical investigation of the southern Puget
Sound area, Washington: Journal of Geophysical Research, v. 70, no. 22, p. 5573-5580.
Frankel, A. D.; Petersen, M. D.; Mueller, C. S.; Haller, K. M.; Wheeler, R. L.; Leyendecker, E. V.;
Wesson, R. L.; Harmsen, S. C.; Cramer, C. H.; Perkins, D. M.; Rukstales, K. S., 2002,
Documentation for the 2002 Update of the National Seismic Hazard Maps: U.S. Geological
Survey Open-File Report 02-420. [Accessed June 25, 2003, at http://pubs.usgs.gov/of/2002/ofr-
02-420/]
Gardner, J. V.; van den Ameele, E. J.; Dartnell, Peter, 2001, Multibeam mapping of the major deltas
of southern Puget Sound, Washington: U.S. Geological Survey Open-File Report 01-266, 1 v.
Gower, H. D., 1978, Tectonic map of the Puget Sound region, Washington, showing locations of
faults, principal folds, and large-scale Quaternary deformation: U.S. Geological Survey Open-File
Report 78-426, 22 p., 1 plate, scale 1:250,000.
Jacoby, G. C.; Williams, P. L.; Buckley, B. M., 1992, Tree ring correlation between prehistoric
landslides and abrupt tectonic events in Seattle, Washington: Science, v. 258, no. 5088, p. 1621-
1623.
Johnson, S. Y.; Dadisman, S. V.; Childs, J. R.; Stanley, W. D., 1999, Active tectonics of the Seattle
fault and central Puget Sound, Washington—Implications for earthquake hazards: Geological
Society of America Bulletin, v. 111, no. 7, p. 1042-1053, 1 plate.
Kimball, J. P., 1897, Physiographic geology of the Puget Sound basin [in 2 parts]: American
Geologist, v. 19, no. 4, p. 225-237 [part 1]; v. 19, no. 5, p. 304-322 [part 2].
Nelson, A. R.; Johnson, S. Y.; Wells, R. E.; Pezzopane, S. K.; Kelsey, H. M.; Sherrod, B. L.; Bradley,
L.-A.; Koehler, R. D., III; Bucknam, R. C.; Haugerud, R. A.; Laprade, W. T., 2002, Field and
laboratory data from an earthquake history study of the Toe Jam Hill fault, Bainbridge Island,
Washington: U.S. Geological Survey Open-File Report 02-60, 1 v., 2 plates.
Pratt, T. L.; Johnson, S. Y.; Potter, C. J.; Stephenson, W. J.; Finn, C. A., 1997, Seismic reflection
images beneath Puget Sound, western Washington State—The Puget Lowland thrust sheet
hypothesis: Journal of Geophysical Research, v. 102, no. B12, p. 27,469-27,489.
Rogers, W. P., 1970, A geological and geophysical study of the central Puget Sound lowland:
University of Washington Doctor of Philosophy thesis, 123 p., 9 plates.
Sherrod, B. L.; Bucknam, R. C.; Leopold, E. B., 2000, Holocene relative sea level changes along the
Seattle fault at Restoration Point, Washington: Quaternary Research, v. 54, no. 3, p. 384-393.
ten Brink, U. S.; Molzer, P. C.; Fisher, M. A.; Blakely, R. J.; Bucknam, R. C.; Parsons, T. E.;
Crosson, R. S.; Creager, K. C., 2002, Subsurface geometry and evolution of the Seattle fault zone
and the Seattle basin, Washington: Seismological Society of America Bulletin, v. 92, no. 5,
p. 1737-1753.
Titov, V. V.; Gonzalez, F. I., 1997, Implementation and testing of the Method of Splitting Tsunami
(MOST) model: NOAA Technical Memorandum ERL PMEL-112 (PB98-122773), 11 p.
Titov, V. V.; Gonzalez, F. I.; Mofjeld, H. O.; Venturato, A. J., (in press), NOAA TIME Seattle tsunami
mapping project—Procedures, data sources, and products: NOAA Technical Memorandum OAR
PMEL-124, 15 p.
Titov, V. V.; Synolakis, C. E., 1998, Numerical modeling of tidal wave runup: Journal of Waterway,
Port, Coastal and Ocean Engineering, v. 124, no. 4, p. 157-171.
Vancouver, George, 1798, repr. 1992, A voyage of discovery to the north Pacific Ocean, and round
the world; in which the coast of north-west American has been carefully examined and accurately
surveyed—Undertaken by His Majesty's command, principally with a view to ascertain the
existence of any navigable communication between the north Pacific and north Atlantic Oceans;
and performed in the years 1790, 1791, 1792, 1793, 1794, and 1795: G. G. and J. Robinson
[London], 3 v.
Van Wagoner, T. M.; Crosson, R. S.; Creager, K. C.; Medema, G. F.; Preston, L. A.; Symons, N. P.;
Brocher, T. M., 2002, Crustal structure and relocated earthquakes in the Puget Lowland,
Washington, from high-resolution seismic tomography: Journal of Geophysical Research, v. 107,
no. B12, 2381, DOI 10.1029/2001JB000710, p. ESE 22-1 - 22-23.
Walsh, T. J.; Caruthers, C. G.; Heinitz, A. C.; Myers, E. P., III; Baptista, A. M.; Erdakos, G. B.;
Kamphaus, R. A., 2000, Tsunami hazard map of the southern Washington coast—Modeled
tsunami inundation from a Cascadia subduction zone earthquake: Washington Division of
Geology and Earth Resources Geologic Map GM-49, 1 sheet, scale 1:100,000, with 12 p. text.
Walsh, T. J.; Myers, E. P., III; Baptista, A. M., 2002a, Tsunami inundation map of the Port Angeles,
Washington area: Washington Division of Geology and Earth Resources Open File Report 2002-
1, 1 sheet, scale 1:24,000.
Walsh, T. J.; Myers, E. P., III; Baptista, A. M., 2002b, Tsunami inundation map of the Port Townsend,
Washington area: Washington Division of Geology and Earth Resources Open File Report 2002-
2, 1 sheet, scale 1:24,000.
Walsh, T. J.; Myers, E. P., III; Baptista, A. M., 2003a, Tsunami inundation map of the Neah Bay,
Washington, area: Washington Division of Geology and Earth Resources Open File Report 2003-
2, 1 sheet, scale 1:24,000.
Walsh, T. J.; Myers, E. P., III; Baptista, A. M., 2003b, Tsunami inundation map of the Quileute,
Washington, area: Washington Division of Geology and Earth Resources Open File Report 2003-
1, 1 sheet, scale 1:24,000.
Depth of inundation: 0–.5 meters .5–2 meters 2–5 meters
NOAA TIME CenterPacific Marine Environmental LaboratorySeattle, Washington