TSTATS and PREFIX - Splunk
62
© 2020 SPLUNK INC. TSTATS and PREFIX How to get the most out of your lexicon, with walklex, tstats, indexed fields, PREFIX, TERM and CASE Richard Morgan Principal Architect | Splunk
Transcript of TSTATS and PREFIX - Splunk

© 2 0 2 0 S P L U N K I N C .
© 2 0 2 0 S P L U N K I N C .
TSTATS and PREFIXHow to get the most out of your lexicon, with walklex, tstats, indexed fields, PREFIX, TERM and CASE
Richard MorganPrincipal Architect | Splunk

© 2 0 2 0 S P L U N K I N C .
Principal Architect – Splunk
Richard Morgan

During the course of this presentation, we may make forward‐looking statements regarding future events or plans of the company. We caution you that such statements reflect our current expectations and estimates based on factors currently known to us and that actual events or results may differ materially. The forward-looking statements made in the this presentation are being made as of the time and date of its live presentation. If reviewed after its live presentation, it may not contain current or accurate information. We do not assume any obligation to update any forward‐looking statements made herein.
In addition, any information about our roadmap outlines our general product direction and is subject to change at any time without notice. It is for informational purposes only, and shall not be incorporated into any contract or other commitment. Splunk undertakes no obligation either to develop the features or functionalities described or to include any such feature or functionality in a future release.
Splunk, Splunk>, Data-to-Everything, D2E and Turn Data Into Doing are trademarks and registered trademarks of Splunk Inc. in the United States and other countries. All other brand names, product names or trademarks belong to their respective owners. © 2020 Splunk Inc. All rights reserved
Forward-LookingStatements

© 2 0 2 0 S P L U N K I N C .
Averaging one slide very 45s
=
=

© 2 0 2 0 S P L U N K I N C .
The Key to Productivity Is Work Avoidance
i.e. don’t do work you don’t have to do

© 2 0 2 0 S P L U N K I N C .
Search Performance Underpins Everything
Faster loading dashboards• User experience is improved with faster completing
searches• User productivity improves as run \ test cycles are
accelerated
Better performance enables more use cases• Improvements of x10 and x100 allow users to attack
new problems• Examine weeks and months of data, instead of just
hours and minutes
Reduces the need for precomputation (summaries)• Summaries should be used to reduce load, not
accelerate slow searches
Reduced server load • Support more users on less hardware• Improves ROI on hardware investment
Search load is the biggest factor in sizing Splunk (not ingestion)
Reduction in HW costs

© 2 0 2 0 S P L U N K I N C .
Minimize Work: Select indexesindex=search_demo* selects directories starting with search_demo
(base) rmorgan-mbp-4cb4b:splunk rmorgan$ ls -altotal 824drwx------ 252 rmorgan wheel 8064 31 Aug 11:33 .drwx--x--- 4 rmorgan wheel 128 24 Nov 2019 ..-rw-r--r--@ 1 rmorgan wheel 12292 22 Jul 11:09 .DS_Store-rw------- 1 rmorgan wheel 0 31 Aug 11:10 .dirty_database-rw------- 1 rmorgan wheel 3 31 Aug 11:10 _audit.dat-rw------- 1 rmorgan wheel 3 31 Aug 11:10 _internal.datdrwx------ 7 rmorgan wheel 224 24 Nov 2019 _internaldbdrwx------ 6 rmorgan wheel 192 18 Oct 2019 _introspection-rw------- 1 rmorgan wheel 3 31 Aug 11:11 _introspection.datdrwx------ 6 rmorgan wheel 192 20 Nov 2019 _metrics-rw------- 1 rmorgan wheel 3 31 Aug 11:10 _metrics.datdrwx------ 6 rmorgan wheel 192 22 Jul 10:34 _metrics_rollupdrwx------ 6 rmorgan wheel 192 18 Oct 2019 _telemetry-rw------- 1 rmorgan wheel 2 31 Aug 11:20 _telemetry.datdrwx------ 6 rmorgan wheel 192 18 Oct 2019 auditdrwx------ 2 rmorgan wheel 64 18 Oct 2019 authDbdrwx------ 6 rmorgan wheel 192 30 Aug 13:34 defaultdbdrwx------ 9 rmorgan wheel 288 31 Aug 11:42 fishbucketdrwx------ 2 rmorgan wheel 64 18 Oct 2019 hashDbdrwx------ 6 rmorgan wheel 192 31 Aug 11:10 search_demo_1-rw------- 1 rmorgan wheel 2 31 Aug 11:30 search_demo_1.datdrwx------ 6 rmorgan wheel 192 31 Aug 11:10 search_demo_2-rw------- 1 rmorgan wheel 2 31 Aug 11:33 search_demo_2.datdrwx------ 6 rmorgan wheel 192 18 Oct 2019 summarydb
When we specify indexes in our search we are narrowing the directories we wish to access.This is the highest level of exclusion in Splunk and it is minimal requirement for high performance search.index=* selects all indexes, expect for those that start with an underscore (_internal, _audit etc)

© 2 0 2 0 S P L U N K I N C .
(base) rmorgan-mbp-4cb4b:splunk rmorgan$ ls -al search_demo/db/total 16drwx------ 25 rmorgan wheel 800 30 Aug 21:04 .drwx------ 6 rmorgan wheel 192 30 Aug 19:52 ..-rw------- 1 rmorgan wheel 2904 30 Aug 20:14 .bucketManifest-rw------- 1 rmorgan wheel 10 30 Aug 19:52 CreationTimedrwx--x--- 2 rmorgan wheel 64 30 Aug 19:52 GlobalMetaDatadrwx--x--- 16 rmorgan wheel 512 30 Aug 19:54 db_1598984915_1598812143_60drwx--x--- 16 rmorgan wheel 512 30 Aug 19:55 db_1598984915_1598984915_61drwx--x--- 16 rmorgan wheel 512 30 Aug 19:56 db_1598984916_1598984915_62drwx--x--- 15 rmorgan wheel 480 30 Aug 19:57 db_1598984916_1598984916_63drwx--x--- 16 rmorgan wheel 512 30 Aug 19:59 db_1598984917_1598984916_64drwx--x--- 17 rmorgan wheel 544 30 Aug 20:00 db_1598984917_1598984917_65drwx--x--- 15 rmorgan wheel 480 30 Aug 20:01 db_1598984918_1598984917_66drwx--x--- 16 rmorgan wheel 512 30 Aug 20:02 db_1598984918_1598984918_67drwx--x--- 16 rmorgan wheel 512 30 Aug 20:03 db_1598984919_1598984918_68drwx--x--- 14 rmorgan wheel 448 30 Aug 20:04 db_1598984919_1598984919_69drwx--x--- 15 rmorgan wheel 480 30 Aug 20:05 db_1598984920_1598984919_70drwx--x--- 16 rmorgan wheel 512 30 Aug 20:06 db_1598984920_1598984920_71drwx--x--- 13 rmorgan wheel 416 30 Aug 20:07 db_1598984920_1598984920_72drwx--x--- 15 rmorgan wheel 480 30 Aug 20:08 db_1598984921_1598984920_73drwx--x--- 13 rmorgan wheel 416 30 Aug 20:09 db_1598984921_1598984921_74drwx--x--- 14 rmorgan wheel 448 30 Aug 20:10 db_1598984922_1598984921_75drwx--x--- 16 rmorgan wheel 512 30 Aug 20:11 db_1598984922_1598984922_76drwx--x--- 17 rmorgan wheel 544 30 Aug 20:12 db_1598984923_1598984922_77drwx--x--- 16 rmorgan wheel 512 30 Aug 20:13 db_1598984923_1598984923_78drwx--x--- 13 rmorgan wheel 416 30 Aug 21:08 hot_v1_79
Minimize Work: Select a timerangeApplying the filter earliest=-20d latest=-10d selects buckets to consider
Each bucket encodes the time range for the data it holds in EPOC time. Therefore when we only consider bucket that have timestamps that fall into the time range we have specified.Use “dbinpect” allows you understand this selection process without executing a full search.

© 2 0 2 0 S P L U N K I N C .
Output: A list of Buckets to considerTime range + indexes selects buckets that must be processed
considered_buckets

© 2 0 2 0 S P L U N K I N C .
1. Index and time ranges defines the considered buckets
buckets
bucketsbuckets
2. Metadata and bloom filters eliminate buckets
buckets
bucketsbuckets
3. LISPY queries the tsidx to identify slices to decompress
bucket
bucketbucket
5. Schema on the fly extracts and eliminates events
events
eventsevents
4. Extracts and parse events from slices
slices
slicesslices
6. Events are processed by SPL and returned to the SH
events
eventsevents
Six stages of indexer search processingThe first line of your search typically represents the greatest amount of computational effort required to execute your search.
Making efficient use of the first line in your search results the greatest gains and everything else barely matters
index=<indexes> <constraints>
| <everything else>

© 2 0 2 0 S P L U N K I N C .
Scan Count Vs. Event CountDuring execution you see the ratio between scan count and event count
False positive ratio 7 / 312,792 = 99.99%
false matches
😱😱Horror
Show
Try and eliminate events BEFORE they are extracted from the raw data, as this avoids the
CPU intensive decompression and parsing21 seconds to execute

© 2 0 2 0 S P L U N K I N C .
Early Elimination Improves PerformanceBy introducing the TERM parameter into our search we have eliminated all false positives
scan_count = event_count
😍😍 🥰🥰TERM is used in less the 1% of all customer searches executed on Splunk Cloud

© 2 0 2 0 S P L U N K I N C .
The difference is in the LISPY
BEFORE:• SPL = index=* average=0.9*• LISPY = [ AND 0 9* index::* ]
AFTER:• SPL = index=* TERM(average=0.9*)• LISPY = [ AND average=0.9* index::* ]
By introducing TERM we made changed the LISPY to be more precise
LISPY is the search language that we use to search the lexicon.
The first search looks for any event that includes all the of the minor terms 0 9* in any index.
The second looks for any major term that starts “average=0.9*” in any index.
MAJOR TERM

© 2 0 2 0 S P L U N K I N C .
Where to MAJOR TERMS Come From?
Splunk has a two-stage parsing process
Firstly, we break up _raw with major breakers
Secondly, we apply minor breakers to the major breakers
This is configurable in limits.conf (beware changing!!!)
Splunk uses a Universal indexing algorithm to tokenize events and write to index
[ ] < > ( ) { } | ! ; , ' " * \n \r \s \t & ? + %21 %26 %2526 %3B %7C %20 %2B %3D -- %2520 %5D %5B %3A %0A %2C %28 %29
Major breakers
/ : = @ . - $ % \\ _
Minor breakers
© 2 0 2 0 S P L U N K I N C .
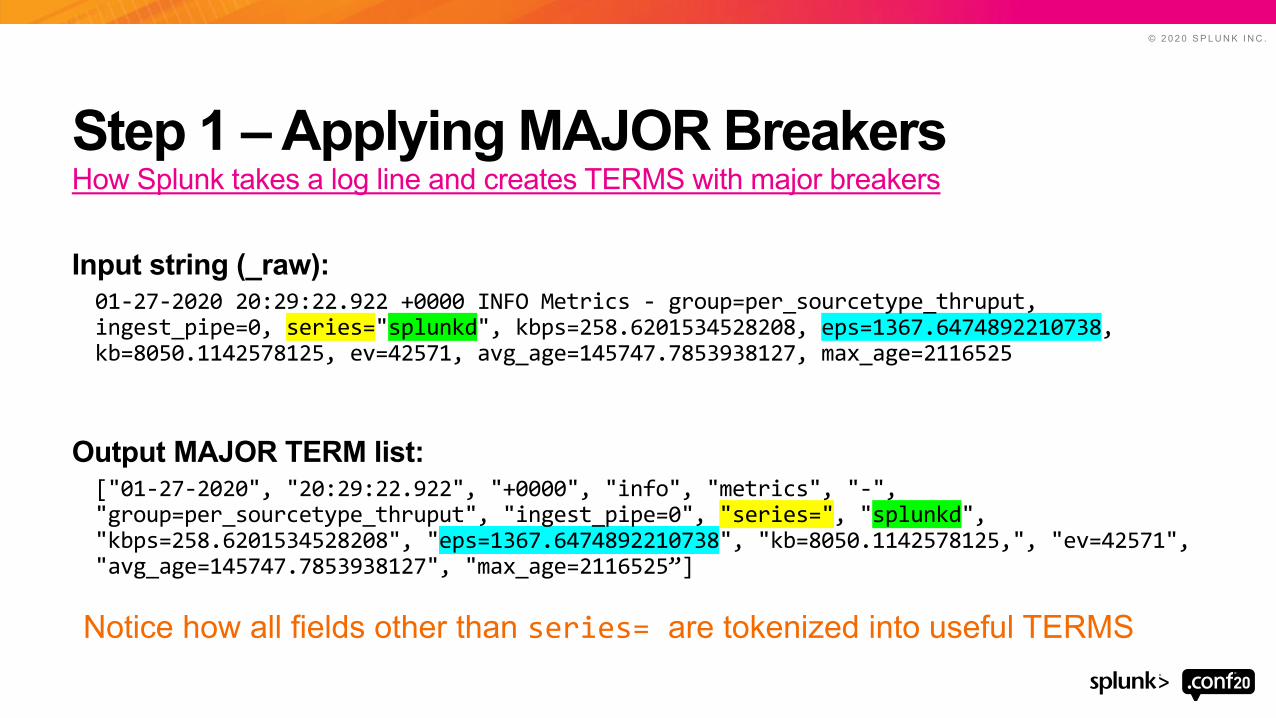
Step 1 – Applying MAJOR Breakers
Input string (_raw): 01-27-2020 20:29:22.922 +0000 INFO Metrics - group=per_sourcetype_thruput, ingest_pipe=0, series="splunkd", kbps=258.6201534528208, eps=1367.6474892210738, kb=8050.1142578125, ev=42571, avg_age=145747.7853938127, max_age=2116525
Output MAJOR TERM list:["01-27-2020", "20:29:22.922", "+0000", "info", "metrics", "-", "group=per_sourcetype_thruput", "ingest_pipe=0", "series=", "splunkd", "kbps=258.6201534528208", "eps=1367.6474892210738", "kb=8050.1142578125,", "ev=42571", "avg_age=145747.7853938127", "max_age=2116525”]
How Splunk takes a log line and creates TERMS with major breakers
Notice how all fields other than series= are tokenized into useful TERMS

© 2 0 2 0 S P L U N K I N C .
Step 2 – Applying MINOR Breakers
Input array (MAJOR BREAKERS): • ["01-27-2020", "20:41:20.355", "+0000", "info", ”metrics", "-",
"group=per_sourcetype_thruput", "ingest_pipe=0", "series=", "top", "kbps=23.83452969239664", "eps=155.64262209891208", "kb=743.4765625", "ev=4855", "avg_age=145747.7853938127", "max_age=2116525"]
Output TERMS (MINOR BREAKERS):• ["0000", ", "thruput","0", "01", "155", "20", "2020", "23", "27", "355",
"41", "4765625", "4855", "64262209891208", "743", "83452969239664", ”info", "metrics", "age", "avg", "eps", "ev", "group", "ingest", "kb", "kbps", "max", "per", "pipe", "series", "sourcetype”]
How Splunk takes a log line and creates TERMS with minor breakers
These terms are onlyaccessible with the TERM keyword
These terms are used for _raw search
SIDE NOTE: Over precision in numbers generates many unique TERMS and bloats the tsidx file

© 2 0 2 0 S P L U N K I N C .
Eyeballing a log for MAJOR TERMSIdentifying and testing for MAJOR TERMS in your events is easy
["01-27-2020", "20:41:20.355", "+0000", "info", ”metrics", "-", "group=per_sourcetype_thruput", "ingest_pipe=0", "series=", "top", "kbps=23.83452969239664", "eps=155.64262209891208", "kb=743.4765625", "ev=4855", "avg_age=145747.78539381270", "max_age=2116525”, "0000", ", "thruput","0", "01", "155", "20", "2020", "23", "27", "355", "41", "4765625", "4855", "64262209891208", "743", "83452969239664", ”info", "metrics", "age", "avg", "eps", "ev", "group", "ingest", "kb", "kbps", "max", "per", "pipe", "series", "sourcetype”]
01-27-2020 20:29:22.922 +0000 INFO Metrics - group=per_sourcetype_thruput, ingest_pipe=0, series="splunkd", kbps=258.6201534528208, eps=1367.6474892210738, kb=8050.1142578125, ev=42571, avg_age=145747.7853938127, max_age=2116525
Input event
Output token list MINOR + MAJOR

© 2 0 2 0 S P L U N K I N C .
Let’s Update Our Example
1. Tom. Rich and Harry
2. Bob loves Fred
3. Fred loves Susan
4. Harry loves Rich
5. Karen loves Susan
6. Loves. Susan Karen
Thanks to major breakers we have additional terms in our index
TERM Events with TERMtom 1tom. 1rich 1,4harry 1, 4susan 3, 5, 6bob 2
fred 2,3karen 5, 6loves 2,3,4,5,6loves. 6
Universal indexing
Major + minor breakers

© 2 0 2 0 S P L U N K I N C .
Search for Exact Match “Karen Loves Susan”LISPY search = [ AND karen loves susan ]
1
2
3
4
5
6
7The posting lists tells us that we have two slices that contain all the terms we need.We extract these slices from the bucket, decompress and run though schema on the fly to see if they match.
TSIDX journalTERM Events containing
TERMtom 1tom. 1rich 1,4harry 1, 4susan 3, 5, 6bob 2fred 2,3karen 5,6loves 2, 3, 4, 5, 6loves. 6

© 2 0 2 0 S P L U N K I N C .
Karen Loves Susan NOT TERM(loves.) LISPY search = [ AND karen loves susan [ NOT loves. ] ]
1
2
3
4
5
6
7
But excluding ”loves.” (with the comma) we have stopped the need to open and parse slice 6.This means only a single event is parsed onto index on the fly.
TSIDX journalTERM Events with TERM
tom 1
tom. 1
rich 1,4
harry 1, 4
susan 3, 5, 6bob 2
fred 2,3
karen 5,6loves 2, 3, 4, 5, 6loves. 6
The false positive ratio is now 0% - doubling
performance 🥳🥳

© 2 0 2 0 S P L U N K I N C .
“walklex” Lets to You Inspect the LexiconWe can see INDEXED FIELDS when type=fieldvalue
© 2 0 2 0 S P L U N K I N C .
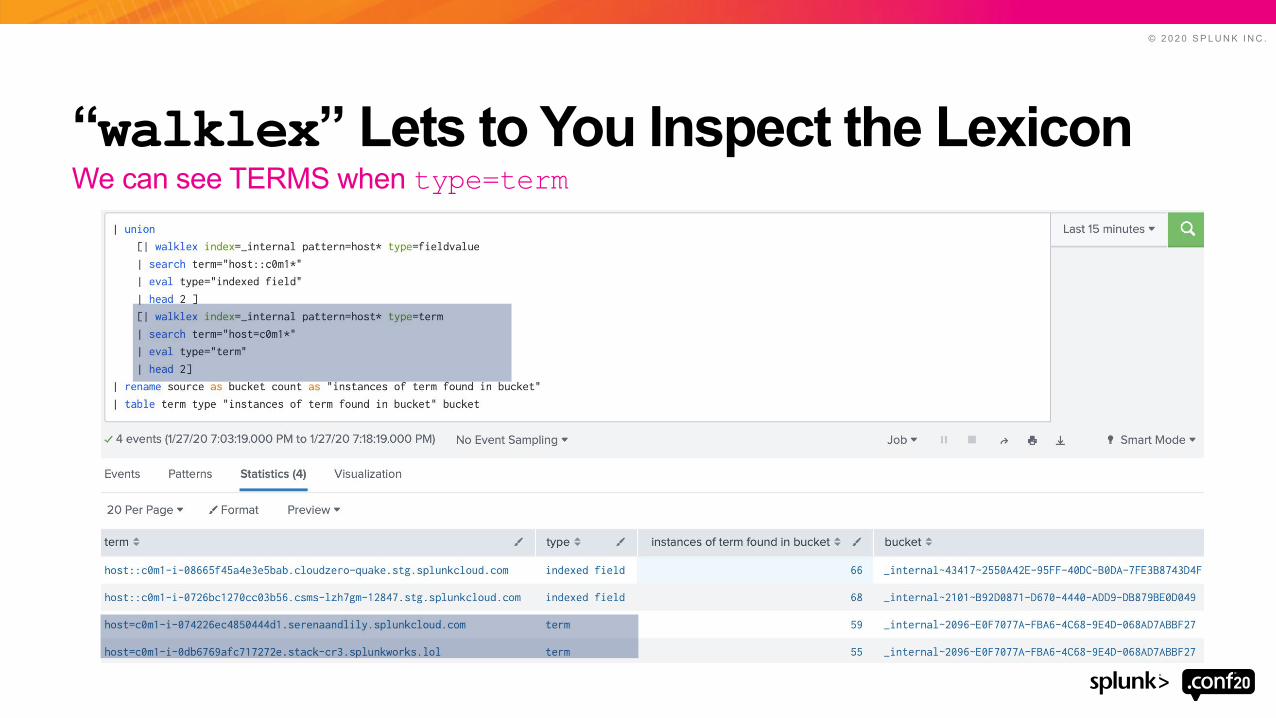
“walklex” Lets to You Inspect the LexiconWe can see TERMS when type=term

© 2 0 2 0 S P L U N K I N C .
Splunk Has Two Major Search Options _raw search has the most versatility, but advanced users use tstats
versatileFast

© 2 0 2 0 S P L U N K I N C .
Example: Splunk’s Hostwide Metrics (-31d)Hostwide metrics uses “INDEXED_JSON” and can be queried both ways
Raw search 134 secs
Equivalent tstats search3 secs
Improvement is x39 faster for the same result set

© 2 0 2 0 S P L U N K I N C .
The Need for Indexed Fields Limits tstatsAdoption
It is difficult to discover the existence of indexed fields when available• The walklex function introduced in 7.3 helps• The existence of TERMS can be inferred from
log data
Although barely undocumented tstats supports the TERM() directive
The prerequisite of indexed fields means its application is limited
raw search
tstats
Few searches can be converted to tstats

© 2 0 2 0 S P L U N K I N C .
Indexed Field CreationAt ingestion we can extract metadata from raw event and create indexed fields • Uses props and transforms, normally via REGEX,
sometimes INGEST_EVAL• This is discouraged in favor of search time extractions
HTTP Event collector has a “fields” section• Slightly dangerous as clients define indexed
fields and can bloat TSIDX
Some structured data sources can optionally create indexed fields automatically• INDEXED_EXTRACTIONS works with CSV and JSON data• This can bloat the TSIDX file, and is frequently disabled
Post ingestion we use an create a datamodel• Data models are based entirely on indexed fields, no raw
events, just TSIDX files• Building the data model requires a raw search, this can hide
the true cost
There are various ways to get indexed fields into Splunk

© 2 0 2 0 S P L U N K I N C .
How to Get the Most From Indexed FieldsIf review complex pipeline configurations is your bag, you’ll love this talk!
© 2 0 2 0 S P L U N K I N C .
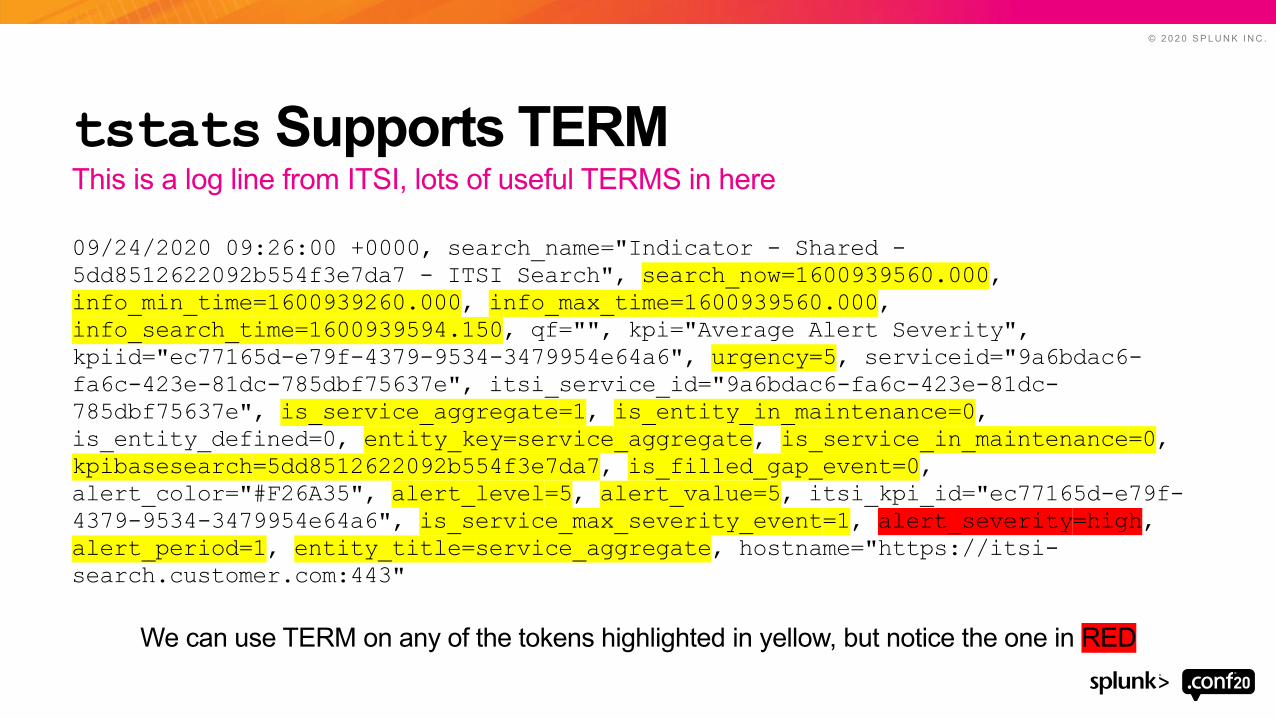
tstats Supports TERM
09/24/2020 09:26:00 +0000, search_name="Indicator - Shared -5dd8512622092b554f3e7da7 - ITSI Search", search_now=1600939560.000, info_min_time=1600939260.000, info_max_time=1600939560.000, info_search_time=1600939594.150, qf="", kpi="Average Alert Severity", kpiid="ec77165d-e79f-4379-9534-3479954e64a6", urgency=5, serviceid="9a6bdac6-fa6c-423e-81dc-785dbf75637e", itsi_service_id="9a6bdac6-fa6c-423e-81dc-785dbf75637e", is_service_aggregate=1, is_entity_in_maintenance=0, is_entity_defined=0, entity_key=service_aggregate, is_service_in_maintenance=0, kpibasesearch=5dd8512622092b554f3e7da7, is_filled_gap_event=0, alert_color="#F26A35", alert_level=5, alert_value=5, itsi_kpi_id="ec77165d-e79f-4379-9534-3479954e64a6", is_service_max_severity_event=1, alert_severity=high, alert_period=1, entity_title=service_aggregate, hostname="https://itsi-search.customer.com:443"
This is a log line from ITSI, lots of useful TERMS in here
We can use TERM on any of the tokens highlighted in yellow, but notice the one in RED

© 2 0 2 0 S P L U N K I N C .
tstats Supports TERM
| tstats prestats=t count where index=itsi_summary TERM(alert_severity=high) by _time span=1sec | fillnull "high" alert_severity| tstats prestats=t append=t count where index=itsi_summary TERM(alert_severity=low) by _time span=1sec | fillnull "low" alert_severity| tstats prestats=t append=t count where index=itsi_summary TERM(alert_severity=medium) by _time span=1sec | fillnull "medium" alert_severity| tstats prestats=t append=t count where index=itsi_summary TERM(alert_severity=normal) by _time span=1sec | fillnull "normal" alert_severity| tstats prestats=t append=t count where index=itsi_summary TERM(alert_severity=unknown) by _time span=1sec | fillnull "unknown" alert_severity| timechart limit=50 span=1sec count by alert_severity
Some simple searches can be expressed with TERM
index=itsi_summary TERM(alert_severity=*)| timechart span=1sec count by alert_severity
tstatsversion is
48x faster🚀🚀

© 2 0 2 0 S P L U N K I N C .
PREFIX Directive Added to tstats In v8
The extension massively increases the instances where tstats can be used
PREFIX allows TERMS to be processed as if they were indexed fields, for example:• Indexed field search: | tstats count by host• TERM search: | tstats count by PREFIX(host=)
PREFIX is also supported in aggregators:• Indexed field search: | tstats sum(PREFIX(value=))
With PREFIX indexed fields are not longer a prerequisite for tstats
Search
tstats
With PREFIX many more searchescan be converted to tstats in v8

© 2 0 2 0 S P L U N K I N C .
tstats Supports PREFIX()
| tstats count where index=itsi_summary TERM(alert_severity=*)by PREFIX(alert_severity=) _time span=1sec
| rename alert_severity= as alert_severity| xyseries _time alert_severity count
PREFIX greatly simplifies our search
prefix version is 3x faster again!
| tstats prestats=t count where index=itsi_summary TERM(alert_severity=high) by _time span=1sec | fillnull "high" alert_severity| tstats prestats=t append=t count where index=itsi_summary TERM(alert_severity=low) by _time span=1sec | fillnull "low" alert_severity| tstats prestats=t append=t count where index=itsi_summary TERM(alert_severity=medium) by _time span=1sec | fillnull "medium" alert_severity| tstats prestats=t append=t count where index=itsi_summary TERM(alert_severity=normal) by _time span=1sec | fillnull "normal" alert_severity| tstats prestats=t append=t count where index=itsi_summary TERM(alert_severity=unknown) by _time span=1sec | fillnull "unknown" alert_severity| timechart limit=50 span=1sec count by alert_severity
🚀🚀🚀🚀

© 2 0 2 0 S P L U N K I N C .
Q. What is the ingestion over 24 hours?
01-21-2020 12:25:44.311 +0000 INFO Metrics - group=thruput, ingest_pipe=1, name=thruput, instantaneous_kbps=3.366894499322308,
instantaneous_eps=12.163696322058637, average_kbps=47.777961955016565, total_k_processed=31355244, kb=104.6298828125, ev=378, load_average=2.42
Load average = how hard the server is workingKb = the data processed since the last reading
Instantaneous_kbps = the ingestion rate at point of measurementPipeline = the ingestion pipeline the reading is from
Every host generates metrics about its ingestion throughput very 30 seconds

© 2 0 2 0 S P L U N K I N C .
Search conversion raw -> tstats
index=_internal host IN (idx*) group=thruput name=thruput | bin span=1767s _time | stats
sum(kb) as indexer_kbavg(instantaneous_kbps) as instantaneous_kbpsavg(load_average) as load_avgby host _time
| tstatssum(PREFIX(kb=)) as indexer_kbavg(PREFIX(instantaneous_kbps=)) as instantaneous_kbpsavg(PREFIX(load_average=)) as load_avgwhere host IN (idx*) index=_internal
host=idx* TERM(group=thruput) TERM(name=thruput) by host _time span=1767s
Raw search PREFIX search
This search demonstrated a 10x performance improvement over 24 hours
prefix version is 30x faster!

© 2 0 2 0 S P L U N K I N C .
How did cachemgr behave over 24 hours?
09-21-2020 12:10:41.051 +0000 INFO Metrics - group=cachemgr_bucket, open=4557, close=4561, cache_hit=4557, open_buckets=4
09-21-2020 12:10:44.330 +0000 INFO Metrics - group=cachemgr_bucket, open=3550, close=3550, cache_hit=3550, open_buckets=4
09-21-2020 12:10:39.985 +0000 INFO Metrics - group=cachemgr_bucket, open=3412, close=3415, cache_hit=3412, open_buckets=4
09-21-2020 12:10:44.102 +0000 INFO Metrics - group=cachemgr_bucket, register_start=1, open=4096, close=4100, cache_hit=4096, open_buckets=6
09-21-2020 12:10:45.709 +0000 INFO Metrics - group=cachemgr_bucket, register_start=1, register_end=1, open=3162, close=3164, cache_hit=3162, open_buckets=5
09-21-2020 12:10:41.229 +0000 INFO Metrics - group=cachemgr_bucket, register_cancel=1, open=4794, close=4796, cache_hit=4794, open_buckets=7
09-21-2020 12:10:10.012 +0000 INFO Metrics - group=cachemgr_bucket, open=4783, close=4779, cache_hit=4783, open_buckets=8
09-21-2020 12:10:23.227 +0000 INFO Metrics - group=cachemgr_bucket, register_start=1, open=2896, close=2896, cache_hit=2896, open_buckets=4
Metrics.log group=cachemgr_bucket

© 2 0 2 0 S P L U N K I N C .
Search conversion raw -> tstats
index=_internal host IN (idx*) TERM(group=cachemgr_bucket) | bin span=1798s _time | stats
sum(absent_summary_skipped) as absent_summary_skippedsum(bootstrap_summary) as bootstrap_summarysum(cache_hit) as cache_hitsum(cache_miss) as cache_misssum(close) as close sum(close_all) as close_allby host _time
| tstatssum(PREFIX(absent_summary_skipped=)) as absent_summary_skippedsum(PREFIX(bootstrap_summary=)) as bootstrap_summarysum(PREFIX(cache_hit=)) as cache_hitsum(PREFIX(cache_miss=)) as cache_misssum(PREFIX(close=)) as closesum(PREFIX(close_all=)) as close_allwhereindex=_internal host IN (idx*) TERM(group=cachemgr_bucket)by host _time span=1798s
Raw search PREFIX search
How did cache behave over 24 hours?
prefix version is 25x faster!

© 2 0 2 0 S P L U N K I N C .
Other segmenters.conf Options
[full]
[indexing]# change INTERMEDIATE_MAJORS to "true" if you want an ip address to appear in typeahead as a, a.b, a.b.c, a.b.c.d# the typical performance hit by setting to "true" is 30% INTERMEDIATE_MAJORS = false
[search]MAJOR = [ ] < > ( ) { } | ! ; , ' " \n \r \s \t & ? + %21 %26 %2526 %3B %7C %20 %2B %3D -- %2520 %5D %5B %3A %0A %2C %28 %29 / : = @ . - $ # % \\ _MINOR =
[standard]MAJOR = [ ] < > ( ) { } | ! ; , ' " * \n \r \s \t / : = @ . ? - & $ # + % _ \\ %21 %26 %2526 %3B %7C %20 %2B %3D -- %2520MINOR =
[inner]MAJOR = [ ] < > ( ) { } | ! ; , ' " * \n \r \s \t / : = @ . ? - & $ # + % _ \\ %21 %26 %2526 %3B %7C %20 %2B %3D -- %2520MINOR =
[outer]MAJOR = [ ] < > ( ) { } | ! ; , ' " * \n \r \s \t & ? + %21 %26 %2526 %3B %7C %20 %2B %3D -- %2520MINOR =
You can disable major breakers per sourcetype by indexing with “search”

© 2 0 2 0 S P L U N K I N C .
Testing Segmentation Options on splunkd.logRemoving all major breakers drops bucket size by 20%
Using regex to extract all attribute value pairs, including quoted strings increased the size of the search segmentation by 50%
Switching from default to regex extraction caused an increase of 18%
Major breakers are very expensive on storage if you don’t use them

© 2 0 2 0 S P L U N K I N C .
Work Avoidance – LoadjobYou can execute a search in one location and then use the results it in another
When developing complex searches on large data sets, avoid repeatedly reloading event data from indexers as you iterate towards your solution
10 seconds to run10 minutes to run

© 2 0 2 0 S P L U N K I N C .
Work Avoidance – Dashboard Base SearchesRun base searches once, use child searches to modify the base data set<form><search id="run_once"><query>
index="search_demo_2" label average sum | timechart sum(sum) avg(sum)
</query></search><search base="run_once"><query>
| table _time $show_field$</query>
</search><fieldset><input type="dropdown" token="show_field">
<label>show field</label><choice value="avg(sum)">avg</choice><choice value="sum(sum)">sum</choice>
</input></fieldset>
</form>
The user can modify the $show_field$ token without causing the base search to
execute
Base search contains no tokens, it remains static
The child search contains the token and is reevaluated whenever it is updates
This is how you build is a high-performance interactive dashboards

© 2 0 2 0 S P L U N K I N C .
Free performance boost! 1/2Make your buckets smaller and your searches go slightly faster by updating the config
journalCompression = gzip|lz4|zstd
* The compression algorithm that splunkd should use for the rawdata journal
file of new index buckets.
* This setting does not have any effect on already created buckets. There is
no problem searching buckets that are compressed with different algorithms.
* "zstd" is only supported in Splunk Enterprise version 7.2.x and higher. Do
not enable that compression format if you have an indexer cluster where some
indexers run an earlier version of Splunk Enterprise.
* Default: gzip
We have been improving the compression on buckets, have you updated your configurations yet?
Use this one!

© 2 0 2 0 S P L U N K I N C .
Free performance boost 2/2The TSIDX files are normally bigger than the journal, so use latest compression
tsidxWritingLevel = [1|2|3]
* Enables various performance and space-saving improvements for tsidx files.
* For deployments that do not have multi-site index clustering enabled,
set this to the highest value possible for all your indexes.
* For deployments that have multi-site index clustering, only set
this to the highest level possible AFTER all your indexers in the
cluster have been upgraded to the latest code level.
* Do not configure indexers with different values for 'tsidxWritingLevel'
as downlevel indexers cannot read tsidx files created from uplevelpeers.
* The higher settings take advantage of newer tsidx file formats for
metrics and log events that decrease storage cost and increase performance
* Default: 1
Use level 3!
Who doesn’t want this for
free?

© 2 0 2 0 S P L U N K I N C .
Everybody Gets a Dashboardhttps://github.com/silkyrich/cluster_health_tools/blob/master/default/data/ui/views/search_
performance_evaluator.xml

© 2 0 2 0 S P L U N K I N C .
Bigger is better!
Enter your search here
Make faster!
Make smallerSPL to LISPY

SESSION SURVEYPlease provide feedback via the
© 2 0 2 0 S P L U N K I N C .

© 2 0 2 0 S P L U N K I N C .
1. Index and time defines the considered buckets
buckets
bucketsbuckets
2. Metadata and bloom filters eliminate buckets
buckets
bucketsbuckets
3. LISPY queries the tsidx to identify slices to decompress
bucket
bucketbucket
5. Schema on the fly extracts and eliminates events
events
eventsevents
4. Extracts and parse events from slices
slices
slicesslices
6. Events are processed by SPL and returned to the SH
events
eventsevents
1. Index and time defines considered buckets
All searches are executed with an index and a time range. This defines our list of buckets to consider.
The first performance tip is to make this as tight as possible.
Minimize indexes and narrow the time range
© 2 0 2 0 S P L U N K I N C .
1. Index and time defines the considered buckets
buckets
bucketsbuckets
2. Metadata and bloom filters eliminate buckets
buckets
bucketsbuckets
3. LISPY queries the tsidx to identify slices to decompress
bucket
bucketbucket
5. Schema on the fly extracts and eliminates events
events
eventsevents
4. Extracts and parse events from slices
slices
slicesslices
6. Events are processed by SPL and returned to the SH
events
eventsevents
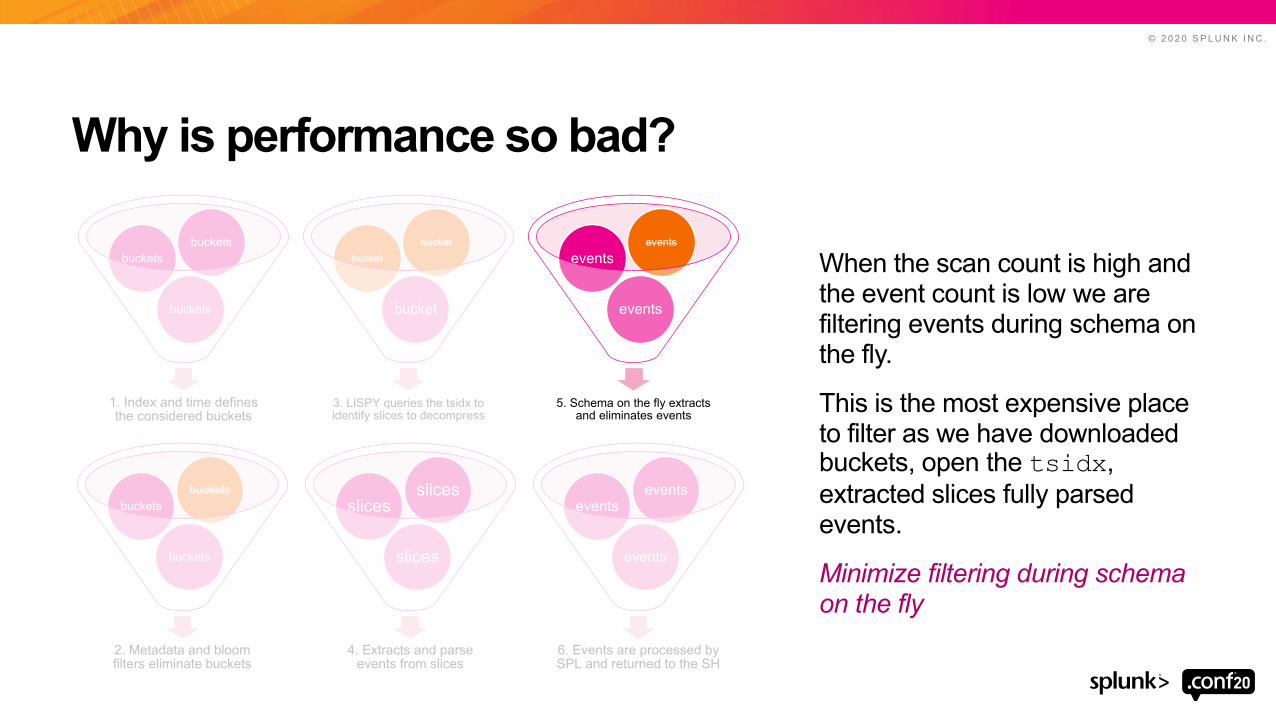
Why is performance so bad?
When the scan count is high and the event count is low we are filtering events during schema on the fly.
This is the most expensive place to filter as we have downloaded buckets, open the tsidx, extracted slices fully parsed events.
Minimize filtering during schema on the fly

© 2 0 2 0 S P L U N K I N C .
1. Index and time defines the considered buckets
buckets
bucketsbuckets
2. Metadata and bloom filters eliminate buckets
buckets
bucketsbuckets
3. LISPY queries the tsidx to identify slices to decompress
bucket
bucketbucket
5. Schema on the fly extracts and eliminates events
events
eventsevents
4. Extracts and parse events from slices
slices
slicesslices
6. Events are processed by SPL and returned to the SH
events
eventsevents
What happened?
By introducing TERM to our search we were able to improve elimination earlier in the pipeline.
Doing so saves downloading journal files from SmartStore, and reduces CPU required for decompression and parsing
Minimize filtering during schema on the fly stage

© 2 0 2 0 S P L U N K I N C .
1. Index and time defines the considered buckets
buckets
bucketsbuckets
2. Metadata and bloom filters eliminate buckets
buckets
bucketsbuckets
3. LISPY queries the tsidx to identify slices to decompress
bucket
bucketbucket
5. Schema on the fly extracts and eliminates events
events
eventsevents
4. Extracts and parse events from slices
slices
slicesslices
6. Events are processed by SPL and returned to the SH
events
eventsevents
Processing the considered buckets
After we have selected our range of buckets to search we must find and extract the data from them to do so.
Where the filtering is performed can have a dramatic impact to search performance.

© 2 0 2 0 S P L U N K I N C .
Agenda 1. IntroductionWhat this presentation is all about
2. Search and workload eliminationHow search works and where time is spent
3. How the index is builtHow universal indexing builds the lexicon
4. Bloomfilter eliminationHow bloomfilters accelerate _raw search
5. Advanced indexing with Major breakerHow major breakers and turbo charge elimination
6. Introducing tstatsHow tstats delivers further performance improvements
7. Other tricks and a performance dashboardloadjob, base searches and take away dashboard

© 2 0 2 0 S P L U N K I N C .
Explaining TSIDX and the Lexicon
1. Tom. Rich and Harry
2. Bob loves Fred
3. Fred loves Susan
4. Harry loves Rich
5. Karen loves Susan
6. Loves. Susan Karen
Universal indexing breaks down the log lines and extracts the tokens to build a map
TERM Events with TERMtom 1
rich 1,4
harry 1, 4
susan 3, 5, 6
bob 2
fred 2,3
karen 5, 6
loves 2,3,4,5,6
Universal indexing
The lexicon is composed of lowercase TERMS
Minor breakers

© 2 0 2 0 S P L U N K I N C .
“Karen Loves Susan” matched two events
5
6
“Loves. Susan Karen”
“Karen loves Susan”decompress
decompress
FALSE POSITIVE
We have extracted two slices, scanned two events and returned one event
scan_count=2, event_count=1
Implies a 50% event elimination during schema on the fly

© 2 0 2 0 S P L U N K I N C .
1. Index and time defines the considered buckets
buckets
bucketsbuckets
2. Metadata and bloom filters eliminate buckets
buckets
bucketsbuckets
3. LISPY queries the tsidx to identify slices to decompress
bucket
bucketbucket
5. Schema on the fly extracts and eliminates events
events
eventsevents
4. Extracts and parse events from slices
slices
slicesslices
6. Events are processed by SPL and returned to the SH
events
eventsevents
Bloomfilters and metadata eliminate bucketsBuckets that are eliminated to not have to be further processed, plus we don’t need to download tsidx or the journal
Dependent on search, data and event distribution Splunk can eliminate up to 99% of buckets.
Second performance tip maximize elimination
Use host, source and sourcetype plus spare terms to help bucket elimination.

© 2 0 2 0 S P L U N K I N C .
Agenda 1. IntroductionWhat this presentation is all about
2. Search and workload eliminationHow search works and where time is spent
3. How the index is builtHow universal indexing builds the lexicon
4. Bloomfilter eliminationHow bloomfilters accelerate _raw search
5. Advanced indexing with Major breakerHow major breakers and turbo charge elimination
6. Introducing tstatsHow tstats delivers further performance improvements
7. Other tricks and a performance dashboardloadjob, base searches and take away dashboard

© 2 0 2 0 S P L U N K I N C .
How Bloom Filters Eliminate Whole BucketsCredit to the interactive tool:
The list of terms held in the
lexicon
The output bit map for the list
of TERMS
Bloom filters are a useful acceleration technology for evaluating set membership.
They are able to 100% accuracy in testing for the existence of terms, but less so for the absence.
The likelihood of false positives decreases as the size of the array is increased.
In the example we have loaded in the terms from our example lexicon and how they are translated to setting bits in the array.
Splunk auto tunes the size of the bloom filter to maintain a good balance between size and accuracy (often above 99%).
https://www.jasondavies.com/bloomfilter/

© 2 0 2 0 S P L U N K I N C .
Looking Up Non-existent TermsA positive false, and a false negative
This is an example of the bloom filter clash. We need the bloom filter to be larger
We need to open the tsidx file and check the lexicon to see if it is really there.
This is an example of the bloom correctly assessing an absence test.
We don’t need to open the tsidx file, the term is definitely not there

© 2 0 2 0 S P L U N K I N C .
The Bucket \ Journal is Composed of SlicesThe Postings list maps TERMS to locations into its associated bucket
1
2
3
4
5
6
7The TSIDX file maps TERMS found in the lexicon to slices to decompress in the journal file. Given these locations we can decompress the slices required and inspect the _raw string.Note that the need to support slices is the reason bucket compression can use lz4, zstdand gzip, but will never support
TSIDXjournal
TERM Slices containing TERM
tom 1rich 1,4harry 1, 4susan 3, 5, 6bob 2fred 2,3karen 5, 6loves 2,3,4,5,6

© 2 0 2 0 S P L U N K I N C .
A “Bucket” is a DirectoryA bucket is a collection of files held in a directory structure; notable files highlighted
(base) rmorgan-mbp-4cb4b:splunk rmorgan$ ls -al search_demo/db/db_1596632603_1596618900_87/total 17936drwx--x--- 16 rmorgan wheel 512 7 Aug 20:03 .drwx------ 8 rmorgan wheel 256 28 Aug 10:14 ..-rw------- 1 rmorgan wheel 8 7 Aug 20:03 .rawSize-rw------- 1 rmorgan wheel 7 7 Aug 20:03 .sizeManifest4.1-rw------- 1 rmorgan wheel 503929 7 Aug 20:03 1596620994-1596618900-4712026901567338950.tsidx-rw------- 1 rmorgan wheel 3727073 7 Aug 20:02 1596632603-1596620225-4538014197027015779.tsidx-rw------- 1 rmorgan wheel 57894 7 Aug 20:02 Hosts.data-rw------- 1 rmorgan wheel 118 7 Aug 20:02 SourceTypes.data-rw------- 1 rmorgan wheel 669 7 Aug 20:02 Sources.data-rw------- 1 rmorgan wheel 1429857 7 Aug 20:02 Strings.data-rw------- 1 rmorgan wheel 208669 7 Aug 20:03 bloomfilter-rw------- 1 rmorgan wheel 75 7 Aug 20:03 bucket_info.csv-rw------- 1 rmorgan wheel 2545204 7 Aug 20:03 merged_lexicon.lex-rw------- 1 rmorgan wheel 49 7 Aug 20:03 optimize.resultdrwx------ 5 rmorgan wheel 160 7 Aug 20:03 rawdata-rw------- 1 rmorgan wheel 97 7 Aug 20:03 splunk-autogen-params.dat(base) rmorgan-mbp-4cb4b:splunk rmorgan$ ls -al search_demo/db/db_1596632603_1596618900_87/rawdata/total 1568drwx------ 5 rmorgan wheel 160 7 Aug 20:03 .drwx--x--- 16 rmorgan wheel 512 7 Aug 20:03 ..-rw------- 1 rmorgan wheel 773899 7 Aug 20:03 journal.zst-rw------- 1 rmorgan wheel 144 7 Aug 20:03 slicemin.dat-rw------- 1 rmorgan wheel 1200 7 Aug 20:03 slicesv2.dat
TSIDX files that point TERMS into slices found in the journal
A list of the hosts, sourcetypes and
sources found in this bucket
Bloomfilters are computed when
buckets are closed
The journal file that contains the actual raw data compressed together

© 2 0 2 0 S P L U N K I N C .
Eliminated bucketsBloomfilters and metadata allows us to eliminate buckets early, avoiding work
considered_buckets vs eliminated_buckets

© 2 0 2 0 S P L U N K I N C .
1. Index and time defines the considered buckets
buckets
bucketsbuckets
2. Metadata and bloom filters eliminate buckets
buckets
bucketsbuckets
3. LISPY queries the tsidx to identify slices to decompress
bucket
bucketbucket
5. Schema on the fly extracts and eliminates events
events
eventsevents
4. Extracts and parse events from slices
slices
slicesslices
6. Events are processed by SPL and returned to the SH
events
eventsevents
tstats Processes tsidx Files Only
The primary reason why tstats is so highly performant is that it works exclusively on the TSIDX files.
This means that it does no decompression or parsing, saving a huge amount of computation.
Unlike _raw search or mstats it doesn’t support any bucket elimination.
This is likely to feature in future releases.

© 2 0 2 0 S P L U N K I N C .
TSIDX reduction is destroyer of performanceDeletes the tsidx files but keeps the bloomfilters, disables almost all work load elimination
enableTsidxReduction = <boolean>
* Whether or not the tsidx reduction capability is enabled.
* By enabling this setting, you turn on the tsidx reduction capability.
This causes the indexer to reduce the tsidx files of buckets when the
buckets reach the age specified by 'timePeriodInSecBeforeTsidxReduction'.
* CAUTION: Do not set this setting to "true" on indexes that have been
configured to use remote storage with the "remotePath" setting.
* Default: false
😱😱🤮🤮
Just don’t do it!
😱😱🤮🤮

© 2 0 2 0 S P L U N K I N C .
Frozen Buckets Have No Metadata
The freezing process removes the metadata from a bucket.The journal file contains all the information required to rebuild the various metadata files.This is how buckets are unfrozen.
Don’t tell Elisa