
TSNA Sub-group Storage sub-committee Report Agronomy/Phytopathology Study Group Meeting - October...
24
TSNA Sub-group Storage sub-committee Report Agronomy/Phytopathology Study Group Meeting - October 2007 Krakow, Poland Selected data from two reports Presented by Dr. Lowell Bush University of Kentucky, USA
-
Upload
lambert-hines -
Category
Documents
-
view
215 -
download
1
Transcript of TSNA Sub-group Storage sub-committee Report Agronomy/Phytopathology Study Group Meeting - October...

TSNA Sub-group
Storage sub-committee ReportAgronomy/Phytopathology
Study Group Meeting - October 2007 Krakow, Poland
Selected data from two reports
Presented by Dr. Lowell BushUniversity of Kentucky, USA
2006 Coresta Air-Cured TSNA Storage Study
Dwayne Beeson – RJR
Steve Terrell – Swedish Match NA

Objective
• To determine TSNA change in burley and dark air-cured tobacco leaf from end-of-curing until initial processing (threshing and re-drying).
Background / Test Matrix
• Three burley producers and one dark air-cured producer participated in study. Burley producers were relatively new to burley production and were first and second year growers located in the Piedmont section of North Carolina and Virginia. The dark air-cured producer was located in Western Kentucky and is well experienced in growing both burley and dark air-cure.

Cured Leaf Storage
Producer Cured Leaf Storage Package
On-Farm Storage Location
Final Market Package
Poole ~125 lbs. per sheet Stored inside “pack house” on wooden
floor
Large Bale
(42” x 42” x 40”)
(~ 1 cubic meter)
Renegar ~ 200 lbs. per sheet Stored on chicken house floor on
spaced lumber, ~ 2 sheets high
Large Bale
Eaton None – stripped and sent to market within 1 week of stripping
NA Large Bale
Elliott ~ 80 lbs. traditional farmer bale
Stacked on pallets on concrete floor in
metal building
Farmer Bale

Warehouse Receiving / Core Sampling

Sampling• Lamina only – samples were freeze-dried within 24 hours• Composite samples were collected via combination of coring tool and
“grab” whole leaf – mid rib removed• All burley samples and related data are single submissions (N = 1)• All Dark Air-Cure (Elliott) samples are in triplicate (N=3)
Producer Sheet Sample Bale Sample
Poole Grab Core
Renegar Grab Core
Eaton NA Core
Elliott NA Core

Bale Weights / (%) Moisture / GradeProducer Low Stalk
lbs./Moisture/GradeMid Stalk
lbs./Moisture/Grade
Upper Stalk lbs./Moisture/Grade
Poole NA 454 / NA / B1 NA
Renegar 512 / 24.06% / X1 509 / 26.71% / B1 536 / 25.39% / BFR1
Eaton 606 / NA / X1 607 / NA / B1 601 / NA / BFR2
Elliott NA NA NA
•Receiving Station moisture equipment was only operable for Reneger delivery•Poole Lower & Upper stalk bales identity lost after delivery•Poole farm storage moisture ~ 22% by feel•Eaton bale moisture ~ 24% by feel
X1 – Premium quality tan, thin, over ripe, fluffyB1 – Premium quality tan uniform color and lengthBFR1 – Premium quality bodied, dark red, uniform color and lengthBFR2 – Very good quality bodied, dark red, uniform color and length

Average Storage Temp (F) / RH (%)
On-Farm Storage
Ambient Tobacco
Producer Temp (F) RH (%) Temp (F) RH (%) Weeks
Poole 54 66 57 72 ~4
Renegar 49 78 51 82 ~10
Eaton NA NA NA NA ~1
Elliott 48 67 48 79 ~4
Warehouse Storage
Ambient Tobacco
Producer Temp (F) RH (%) Temp (F) RH (%) Weeks
Poole 55 58 56 59 ~8
Renegar NA NA NA NA 0
Eaton 55 58 54 79 ~6
Elliott NA NA NA NA NA

Renegar Data
Sample Date
Stalk Position
Nitrogen (%)
Nitrate (%)
Total Alkaloids
(%)
2nd Total Alkaloids
(%)
Nicotine (%)
2nd / Total Ratio (%)
Percent Convert
(%)
11/06 Low 4.15 3.13 4.61 0.61 3.99 13.32 7.97
Mid 5.09 1.93 6.33 0.44 5.87 6.97 2.36
Upper 5.83 1.84 6.51 0.44 6.07 6.87 2.76
1/11 Low 4.07 3.70 3.76 0.30 3.46 7.95 2.84
Mid 5.08 3.40 5.02 0.34 4.67 6.74 2.38
Upper 5.51 1.93 6.13 0.42 5.71 6.82 2.78
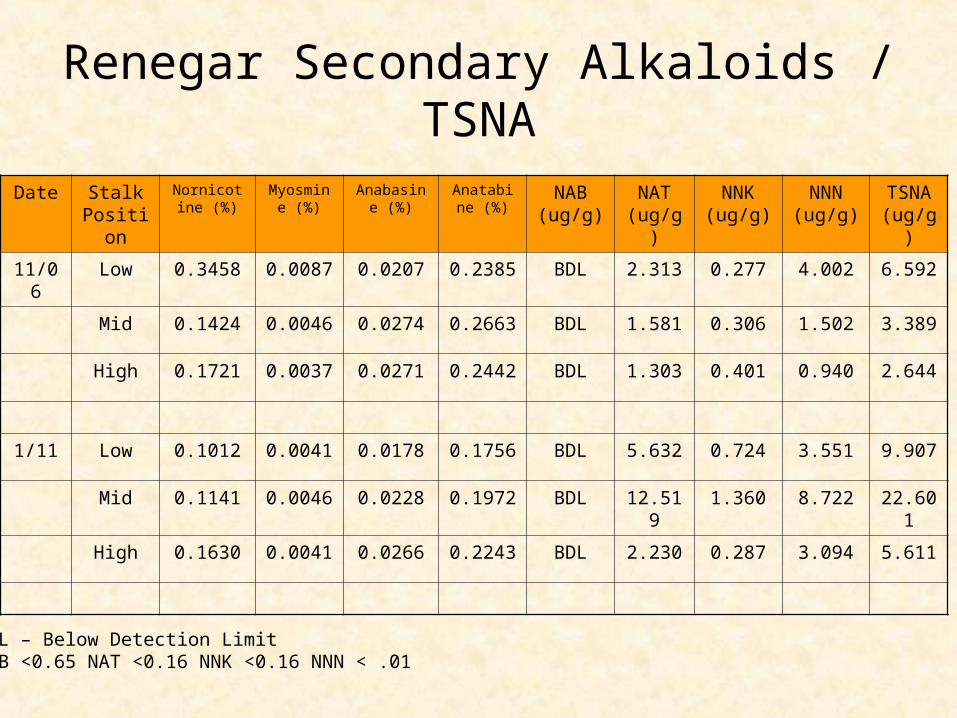
Renegar Secondary Alkaloids / TSNA
Date Stalk Position
Nornicotine (%)
Myosmine (%)
Anabasine (%)
Anatabine (%)
NAB (ug/g)
NAT (ug/g)
NNK (ug/g)
NNN (ug/g)
TSNA (ug/g)
11/06 Low 0.3458 0.0087 0.0207 0.2385 BDL 2.313 0.277 4.002 6.592
Mid 0.1424 0.0046 0.0274 0.2663 BDL 1.581 0.306 1.502 3.389
High 0.1721 0.0037 0.0271 0.2442 BDL 1.303 0.401 0.940 2.644
1/11 Low 0.1012 0.0041 0.0178 0.1756 BDL 5.632 0.724 3.551 9.907
Mid 0.1141 0.0046 0.0228 0.1972 BDL 12.519 1.360 8.722 22.601
High 0.1630 0.0041 0.0266 0.2243 BDL 2.230 0.287 3.094 5.611
BDL – Below Detection LimitNAB <0.65 NAT <0.16 NNK <0.16 NNN < .01
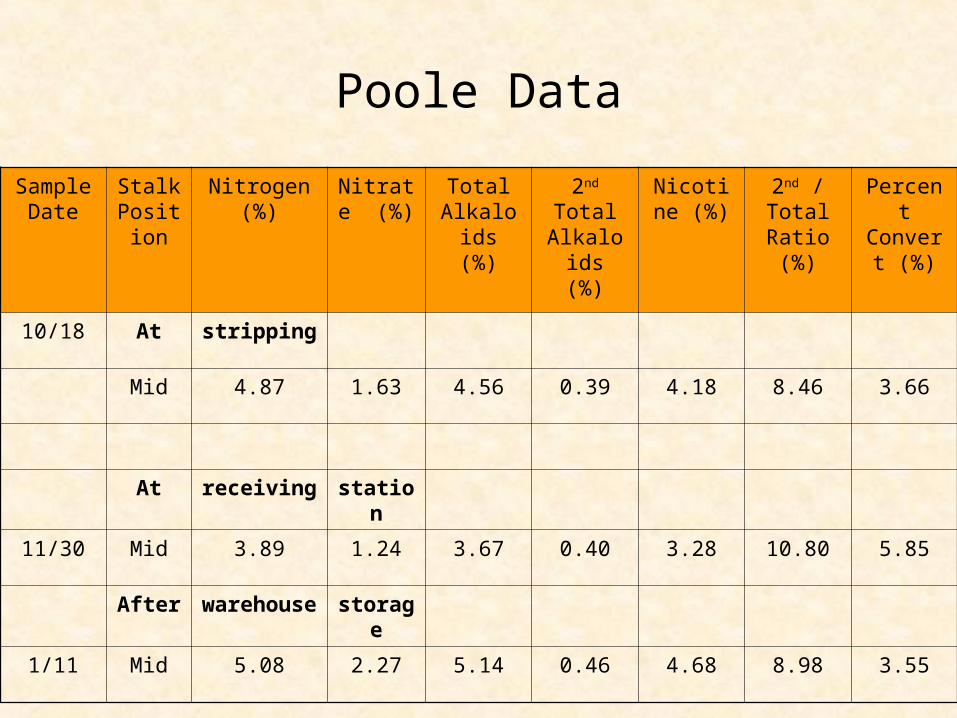
Poole Data
Sample Date
Stalk Positio
n
Nitrogen (%)
Nitrate (%)
Total Alkaloids
(%)
2nd Total Alkaloids
(%)
Nicotine (%)
2nd / Total Ratio (%)
Percent Convert
(%)
10/18 At stripping
Mid 4.87 1.63 4.56 0.39 4.18 8.46 3.66
At receiving station
11/30 Mid 3.89 1.24 3.67 0.40 3.28 10.80 5.85
After warehouse storage
1/11 Mid 5.08 2.27 5.14 0.46 4.68 8.98 3.55
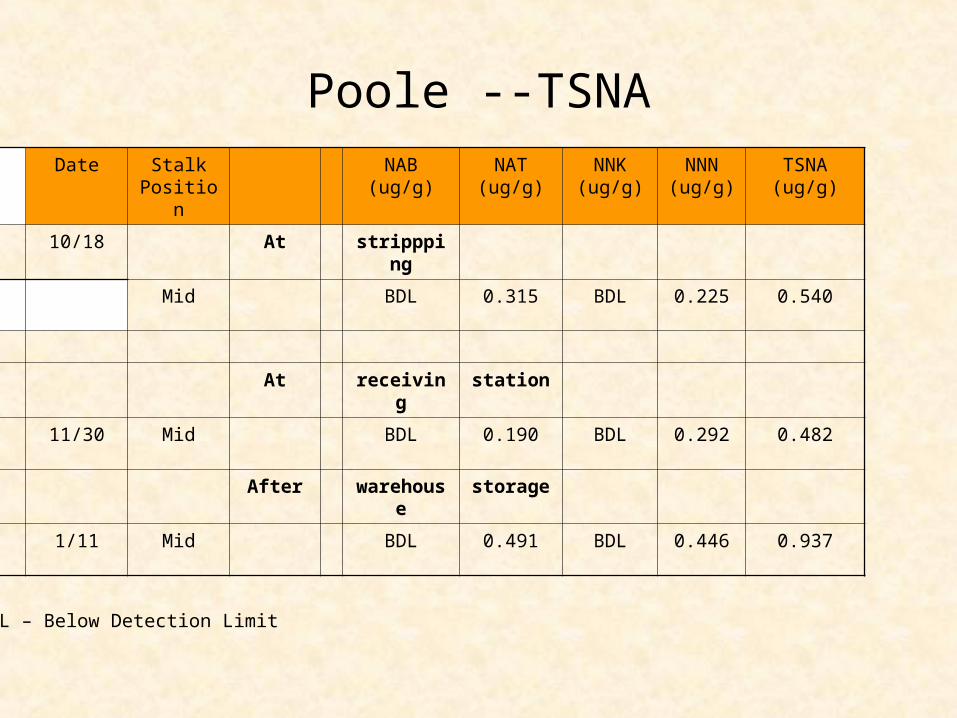
Poole --TSNADate Stalk
PositionNAB (ug/g) NAT
(ug/g)NNK (ug/g)
NNN (ug/g)
TSNA (ug/g)
10/18 At strippping
Mid BDL 0.315 BDL 0.225 0.540
At receiving station
11/30 Mid BDL 0.190 BDL 0.292 0.482
After warehouse storage
1/11 Mid BDL 0.491 BDL 0.446 0.937
BDL – Below Detection Limit

Elliott Data
Sample Date
Stalk Position
Nitrogen (%)
Nitrate (%)
Total Alkaloids
(%)
2nd Total Alkaloids
(%)
Nicotine (%)
2nd / Total Ratio (%)
Percent Convert
(%)
11/5 Low 4.22 3.65 3.773 0.292 3.481 7.85 2.23
Mid 4.21 2.61 3.859 0.271 3.588 7.02 2.36
Upper 4.41 1.50 5.042 0.351 4.691 7.06 2.03
12/07 Low 4.19 3.96 3.454 0.266 3.187 7.86 2.61
Mid 4.20 2.71 4.059 0.287 3.772 7.19 2.03
Upper 3.97 1.34 4.542 0.282 4.259 6.23 1.78
Average Results / N = 3

Elliott Secondary Alkaloids / TSNA
Date Stalk Position
Nornicotine (%)
Myosmine (%)
Anabasine (%)
Anatabine (%)
NAB (ug/g)
NAT (ug/g)
NNK (ug/g)
NNN (ug/g)
TSNA (ug/g)
11/5 Low 0.078 0.002 0.018 0.194 BDL 1.294 0.346 0.556 2.195
Mid 0.087 0.002 0.017 0.165 BDL 1.450 0.381 0.753 2.457
High 0.095 0.003 0.024 0.229 BDL 0.826 BDL 0.401 1.227
4 weeks
on farm storage
12/07 Low 0.083 0.003 0.016 0.164 BDL 1.477 0.189 0.831 2.434
Mid 0.077 0.003 0.0230 0.187 BDL 0.779 BDL 0.379 1.158
High 0.077 0.002 0.021 0.182 BDL 1.569 0.298 0.751 2.519
Average Results / N = 3
BDL – Below Detection Limit

Poole Temp/RH Data – Storage Shed
Poole Storage Shed (Pack House)
0
10
20
30
40
50
60
70
80
90
100
15-Oct 20-Oct 25-Oct 30-Oct 4-Nov 9-Nov 14-Nov 19-Nov
Temp
F - R
H (%)
Temp F - Storage ShedRH (%) - Storage Shed
Poole Mid Stalk (Sheet) - Storage
0
10
20
30
40
50
60
70
80
90
100
15-Oct 20-Oct 25-Oct 30-Oct 4-Nov 9-Nov 14-Nov 19-Nov
Temp
(F) -
RH (%
)
Temp F - Mid Stalk SheetRH (%) - Midstalk Sheet
Temp / RH recorder placed in center of sheet
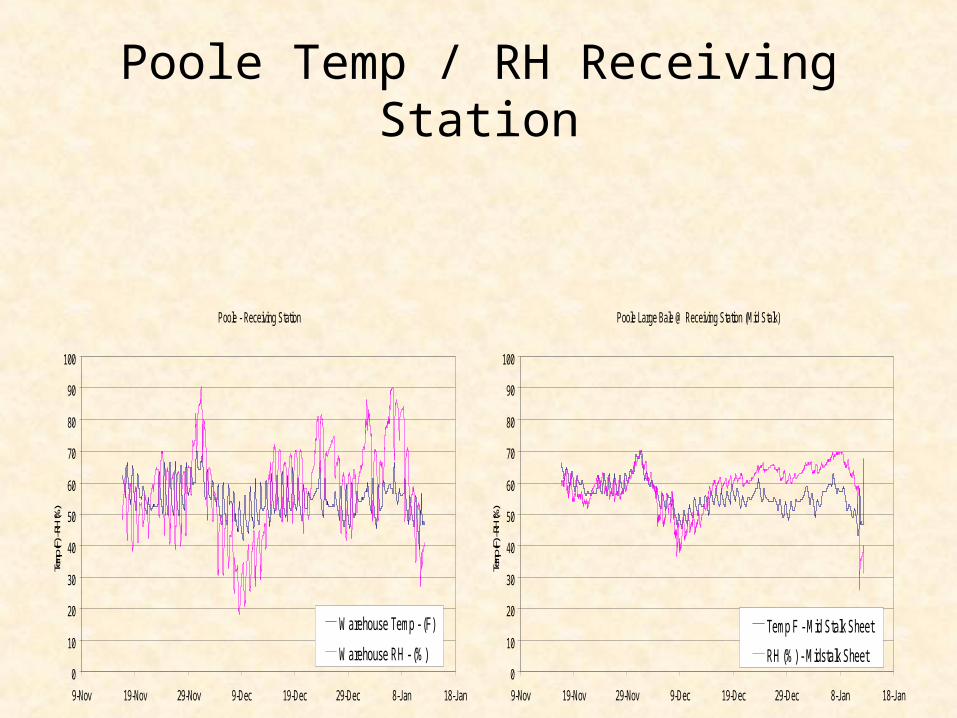
Poole Temp / RH Receiving Station
Poole - Receiving Station
0
10
20
30
40
50
60
70
80
90
100
9-Nov 19-Nov 29-Nov 9-Dec 19-Dec 29-Dec 8-Jan 18-Jan
Temp
(F) -
RH (%
)
Warehouse Temp - (F)
Warehouse RH - (%)
Poole Large Bale @ Receiving Station (Mid Stalk)
0
10
20
30
40
50
60
70
80
90
100
9-Nov 19-Nov 29-Nov 9-Dec 19-Dec 29-Dec 8-Jan 18-Jan
Temp
(F) -
RH (%
)
Temp F - Mid Stalk Sheet
RH (%) - Midstalk Sheet

Result Summary (TSNA ug/gm)
Producer Stalk Pos. Initial Sample
Final Sample
Time (Weeks)
(%) Change
Renegar
On-Farm Storage Only
High Density Sheets
Low 6.59 9.91 10 50%
Mid 3.39 22.60 “ 567%
Upper 2.64 5.61 “ 112%
Avg. 4.21 12.71 202%
Poole
On-Farm Storage
Low Density Sheets
(4 weeks)
Warehouse Storage
(8 weeks)
Mid 0.54 0.48 6 -11%
Mid 0.48 0.95 8 +48%
Avg.
BDL – Below Detection Limit
NA – Sample Not Available

Result Summary (TSNA ug/gm)
Producer Stalk Pos. Initial Sample
Final Sample
Time (Weeks)
(%) Change
Eaton
Warehouse Storage Only
Low 8.97 10.77 6 20%
Mid 6.90 3.48 “ -50%
Upper 2.36 3.46 “ 46%
Avg. 6.08 5.90 -3%
Elliott
On-Farm Storage Only
Low 2.20 2.43 4 11%
Mid 2.46 1.16 “ -53%
Upper 1.23 2.52 “ 105%
Avg. 1.96 2.04 4%

Post Curing Study 2005-2006
Altadis - Swedish Match

Trial I: Effect of storage mode
Variety: ITB 501 (Burley)
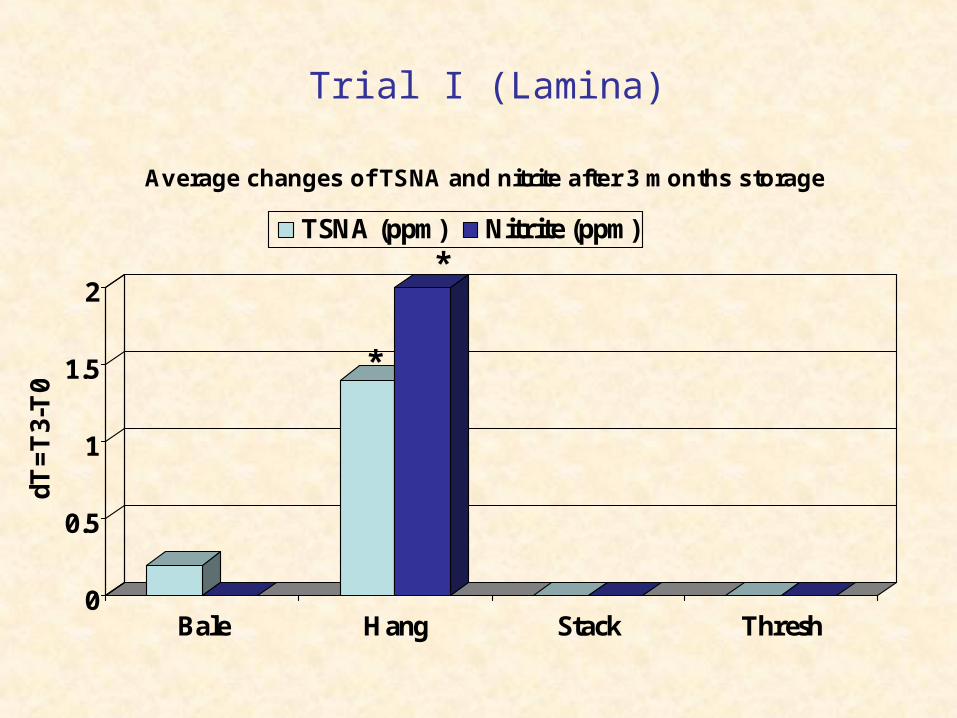
Trial I (Lamina)
0
0.5
1
1.5
2
dT=
T3-
T0
Bale Hang Stack Thresh
Average changes of TSNA and nitrite after 3 months storage
TSNA (ppm) Nitrite (ppm)
*
*

Trial I (Midrib)
-10
-5
0
5
10
15
20
25
dT=
T3-
T0
Bale Hang Stack Thresh C1 Thresh C2
Average changes of TSNA and nitrite after 3 months storage
TSNA (ppm) Nitrite (ppm)
*
*
* **

Trial II: Effect of pressure and moisture during3 months of bale storage
• Experiments performed on cutters and tips
• Baling pressure: normal and low pressure (-50 %)
• Baling moisture: normal and low humidity- Normal = 22 % for tips and 18-20 % for cutters- Low = 15 %
Variety: ITB 501 (Burley)

Trial II (Cutters-Lamina)
0
1
2
3
dT=
T3-
T0
Normal Low H Low P Low H/P
Average changes of TSNA and nitrite after 3 months storage
TSNA (ppm) Nitrite (ppm)


