Tsmf Methodology
21
Haimo Liu: [email protected] Evaluation of clinical Full Field Digital Mammography with the Task-Specific- System-Model-Based Fourier (TSMF) SNR Haimo Liu Fischell Department of Bioengineering University of Maryland-College Park FDA CDRH OSEL/DIAM
Transcript of Tsmf Methodology

Haimo Liu: [email protected]
Evaluation of clinical Full Field Digital
Mammography with the Task-Specific-
System-Model-Based Fourier (TSMF)
SNR
Haimo Liu
Fischell Department of Bioengineering
University of Maryland-College Park
FDA CDRH OSEL/DIAM

Haimo Liu: [email protected]
Task specific evaluation methodologyDevelopmentBenefits of using phantom for FFDM image quality assessment
Application on clinical systemsGE Senographe DS
Comparison between two image acquisition modesValidation of the method
Hologic Selenia
Conclusion
2
Outline
Haimo Liu: [email protected]
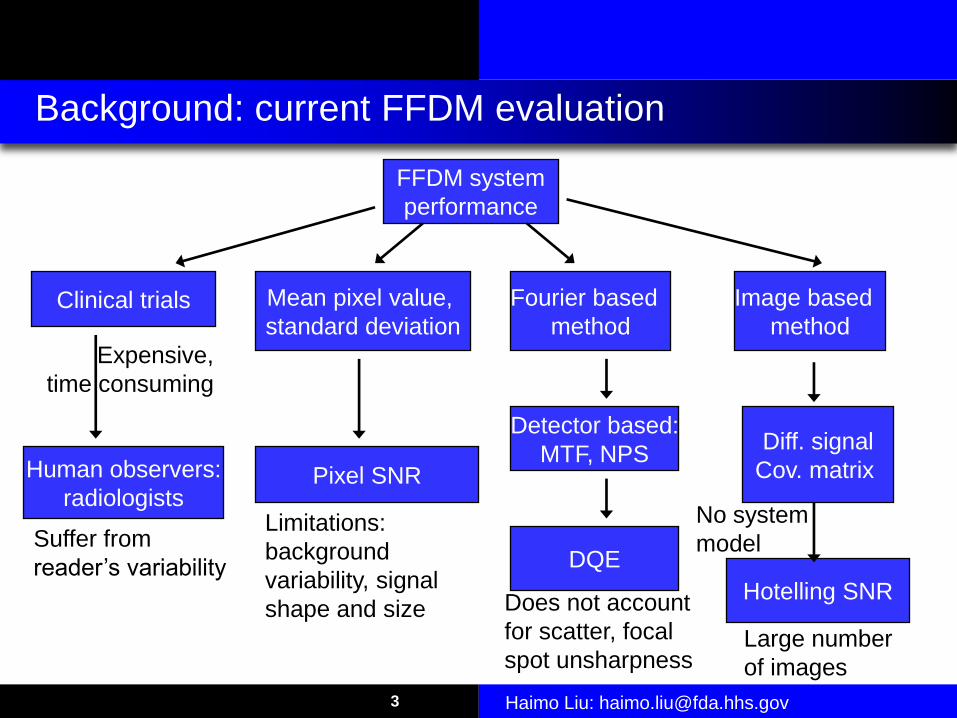
Background: current FFDM evaluation
FFDM system
performance
Mean pixel value,
standard deviationClinical trials
Human observers:
radiologists
Expensive,
time consuming
3
Suffer from
reader’s variability
Pixel SNR
Limitations:
background
variability, signal
shape and size
Fourier based
method
Does not account
for scatter, focal
spot unsharpness
Detector based:
MTF, NPS
DQE
Image based
method
Hotelling SNR
Large number
of images
Diff. signal
Cov. matrix
No system
model

Haimo Liu: [email protected]
Motivation
4
X-ray tube
Detector
Compression paddle
Computer console
Develop Fourier based evaluation methodology for clinical FFDM systems
Entire FFDM image acquisition
With phantom that models breast attenuation
Objective, task based
Practical, collection of limited number of images
Empirical model of the system, results not limited to specific settings

Haimo Liu: [email protected]
Linear system
No non-linear/adaptive image processing
Cyclostationary system
Stationary noise
Shift-invariant system transfer function
Infinite detector area
5
Assumptions

Haimo Liu: [email protected]
Phantom assembly
Inspired by the CDMAM phantom
Same uniform background
Same HVL
Simulated signals
Uniform PMMA plates
Four 1 cm plates
Aluminum plate
0.5 mm thick
Model the Aluminum base (where signals are attached to) of the CDMAM phantom

Haimo Liu: [email protected]
Clinical systems
7
System GE SenograheDS
Hologic Selenia
Detector Indirect Direct
Pixel size 0.1mm ×0.1mm 0.07mm ×0.07mm
Kvp 30 30
Target/Filter
Mo/Mo Mo/Mo
Image acquisitionmode
A:Fine View ModeB:Standard Mode
Phantom Mode
Grid Linear Cross-hatch grid

Haimo Liu: [email protected]
Generalized Modulation Transfer Function (GMTF)
GMTFThe modulus of the Fourier transformation of the line response function measured within the breast phantom
Five images of a copper edge placed between the PMMA plates
Three detector entrance exposuresConvert to mean glandular doses
2D GMTFSpline interpolation between 1D profiles along the two axesX direction: parallel to chest wall Y direction: perpendicular to chest wall

Haimo Liu: [email protected]
Evaluation of scatter removal method (GE)
MTF (x direction)100 mAs, x-direction
Without phantom
System without grid gives better performance
GMTF(x direction)100 mAs, x-direction
With phantom placed in
the FOV
System with grid gives
better performance

Haimo Liu: [email protected]
Generalized Normalized Noise Power Spectrum (GNNPS)
GNNPS
The square of the Fourier transformation of the system
noise measured at the center of the breast phantom
Five images of the background phantom
Three detector entrance exposures
Convert to mean glandular doses

Haimo Liu: [email protected]
Simulated gold
disc signals
inspired by the
CDMAM phantom
15
Hotelling observer SNR
SNR² =
2 2GMTF2
GNNPS
Difference signal2

Haimo Liu: [email protected]
Phantom Image based method
(image based signal: SI):
16
Methodology validation – comparison between methods
T -1
I ISNR = ΔS K ΔS
2 2
sFT[ ]SNR
GMTF ΔS=
GNNPS
2
I
19 19
FT[ ]SNR
ΔS=
GNNPS
2
I
256 256
FT[ ]SNR
ΔS=
GNNPS
Fourier based method with
simulated signals (Ss):
Fourier based method with
phantom image based signals,
GNNPS ROI size 19×19:
Fourier based method with
phantom image based signals,
GNNPS ROI size 256×256:
Haimo Liu: [email protected]
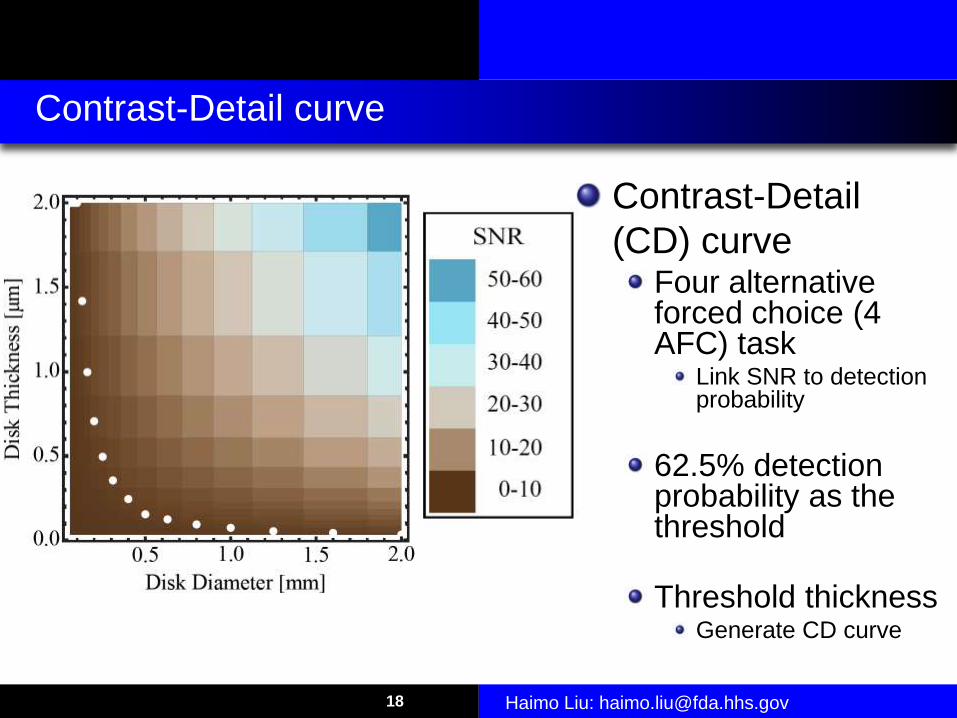
Contrast-Detail
(CD) curveFour alternative forced choice (4 AFC) task
Link SNR to detection probability
62.5% detection probability as the threshold
Threshold thicknessGenerate CD curve
18
Contrast-Detail curve

Haimo Liu: [email protected]
Contrast-Detail curve: system performance prediction
CD curve at unit doseSNR2 is linearly proportional to dose
Normalize SNR by dose
Normalize CD curve by dose
Can be used to predict system performance
Two clinical systemsDifferent noise and deterministic properties
Identical CD curves

Haimo Liu: [email protected]
Human performance prediction (GE Senographe DS)
TSMF CD curve at 51 μGy
TSMF CD curve (adjusted by human efficiency) at 51 μGy
Human CD curve at 70 μGy (GE Senographe 2000D)
Human CD curve at 140 μGy (GE Senographe 2000D)
20
Contrast-Detail curve: human performance prediction
2
HumanHuman 2
TSMF
SNRF 30% 5%
SNR
Haimo Liu: [email protected]
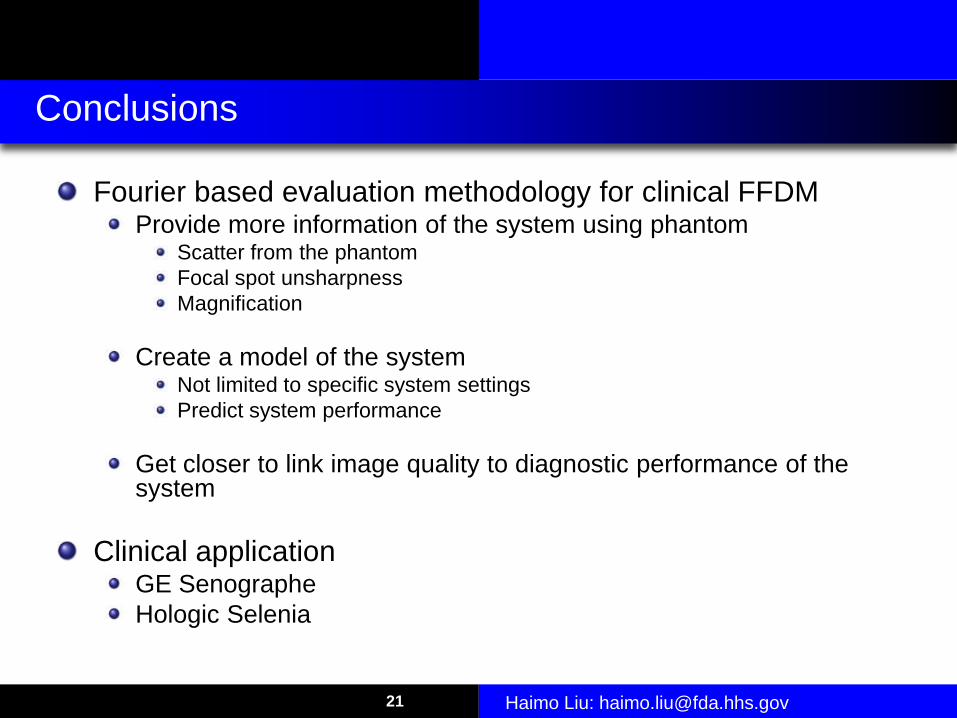
Fourier based evaluation methodology for clinical FFDMProvide more information of the system using phantom
Scatter from the phantom
Focal spot unsharpness
Magnification
Create a model of the systemNot limited to specific system settings
Predict system performance
Get closer to link image quality to diagnostic performance of the system
Clinical applicationGE Senographe
Hologic Selenia
21
Conclusions