TRUST BOARD 31ST March 2016 - NHS Foundation Trust · 1.1. This report details NEAS’ financial...
20
Page 1 of 20 CATEGORY OF PAPER Specific action required (decision / approval) For information / assurance only TRUST BOARD 31 ST March 2016 Agenda item: ITEM 12 Report title: Finance Performance Report Month 11 (February 2016) Incorporating Productivity Analysis to Feb 2016; Financial Outturn Scenarios Update. Purpose of report: The attached report details the financial position for NEAS, analysed by Service Line, at month 11. Key issues: The report gives an overview of our financial position at month 11, 2015-16 - detailing continued improvement of our forecast deficit position. Outlines contributions for ECS, PTS, Contact Centre and CBS service lines and Corporate Directorates. Details Trust and service line CIP performance for 2015-16. (Note: Detailed CIP analysis was presented to the Transformation Board on 30 th March 2016). Key movements from Plan are identified, as well as a forecast under-recovery on our CIP Plan. Key financial and associated risks are outlined, including risk rating impacts arising from our deficit position which raise the likelihood of involvement with the Trust from Monitor. The report includes Appendices on ECS productivity and a Forecast Outturn Scenario update. Issue previously considered by: N/A Recommendation/action required: Receive this update and seek clarity on the information reported. Seek assurance that service line and corporate management, with support from the Finance Directorate and others, progress any available plans to address the emerging financial gap. Require all areas of the Trust to support the Finance team in undertaking any detailed, critical reviews of spend with a view to committing to recurrent savings from 2016-17. Ask that the Transformation Board continues to prioritise, agree and implement any cost improvement scheme, currently residing on the Trust mitigation list to deliver additional CIP during 2015-16.
Transcript of TRUST BOARD 31ST March 2016 - NHS Foundation Trust · 1.1. This report details NEAS’ financial...

Page 1 of 20
CATEGORY OF PAPER
Specific action required (decision / approval)
For information / assurance only
TRUST BOARD 31ST March 2016
Agenda item: ITEM 12
Report title: Finance Performance Report Month 11 (February 2016)
Incorporating
Productivity Analysis to Feb 2016;
Financial Outturn Scenarios Update.
Purpose of report: The attached report details the financial position for NEAS, analysed by Service Line, at month 11.
Key issues: The report gives an overview of our financial position at
month 11, 2015-16 - detailing continued improvement of our forecast deficit position.
Outlines contributions for ECS, PTS, Contact Centre and CBS service lines and Corporate Directorates.
Details Trust and service line CIP performance for 2015-16. (Note: Detailed CIP analysis was presented to the Transformation Board on 30
th March 2016).
Key movements from Plan are identified, as well as a forecast under-recovery on our CIP Plan.
Key financial and associated risks are outlined, including risk rating impacts arising from our deficit position which raise the likelihood of involvement with the Trust from Monitor.
The report includes Appendices on ECS productivity and a Forecast Outturn Scenario update.
Issue previously considered by: N/A
Recommendation/action required: Receive this update and seek clarity on the information reported. Seek assurance that service line and corporate management, with support from the Finance Directorate and others, progress any available plans to address the emerging financial gap. Require all areas of the Trust to support the Finance team in undertaking any detailed, critical reviews of spend with a view to committing to recurrent savings from 2016-17. Ask that the Transformation Board continues to prioritise, agree and implement any cost improvement scheme, currently residing on the Trust mitigation list to deliver additional CIP during 2015-16.

Page 2 of 20
Sponsor/approving director: R French, Director of Finance & Resources
Report author: M Redhead, Head of Financial Management
Governance and assurance
Link to Trust corporate objectives*
(please tick)
1 2 3 4 5 6 7
Link to CQC KLOE:
(please tick)
Caring Responsive Effective
Well Led
Safe
Any relevant legal/statutory issues? No
Equality analysis completed?
(please tick)
If this is not relevant please explain why:
Yes No Not relevant
N/A
Statement of financial position only.
Key considerations Details
Confirm whether any risks that have been identified have been recognised on a risk register and provide the reference number:
Risks within the Plan and the reported financial position presented have been outlined in section 6 and must be taken into consideration.
Risks recorded on Financial and Organisational Risk Registers include failure to deliver against recurrent CIP targets and failure to manage the Trust financial position within Plan parameters.
Specify any financial implications: Explain whether there are any associated efficiency savings or increased productivity opportunities?
The financial implications of exceeding our planned deficit and non-achievement of our CIP are related within the report.
No additional CIP or opportunities for productivity have been identified here, though on-going action to identify such CIP opportunities continues across Directorates.
Are any additional resources required e.g. staff capacity? No
Is there any current or expected impact on patient outcomes/experience/quality?
The report identifies that failure to live within our planned budget and to deliver our CIP adversely affects the financial resources available for service delivery and future service investment. This can only have an adverse impact on patient outcome, experience and service quality.
Specify whether appropriate clinical and/or stakeholder engagement has been undertaken:
(stakeholders could include staff, other Trust departments, providers, CCGs, patients, carers or the general public)
Not relevant
Are there any aspects of this paper that need to be communicated to our stakeholders (internal or external)?
(Please tick – if ‘yes’ then please complete all boxes. Please briefly specify the key points for communication and ensure the Comms team are informed via mailto:[email protected])
Yes
No Positive
Negative
Proactive
Reactive
Internal
External
The financial position should only be communicated internally at this stage, with immediate action required to proactively manage the financial position and risks identified in this paper.
Page 3 of 20
TRUST BOARD Finance Performance Report Month 11, 2015-16
31st March 2016
1. Introduction 1.1. This report details NEAS’ financial performance against our approved
Financial Plan for 2015-16, for the period ended 29th February 2016. 1.2. The overall Trust position, Service Line and Corporate services contributions
at month 10 are given along with key variances affecting our current year to date (YTD) performance. Forecast outturn (FOT) financial position, compared with Plan, is presented with latest YTD and FOT cost improvement delivery.
1.3. The following Appendices are included to support this report:
Appendix 1 - Summary Corporate YTD & FOT contribution at month 11
Appendix 2 – Financial Dashboard for Feb. 2016, with graphical representation of key financial performance and incorporating FSRR metrics from Monitor’s Risk Assurance Framework (RAF)
Appendix 3 - A monthly update on EC productivity
Appendix 4 – FOT outturn scenarios based on current performance.
Appendix 5 - An abbreviation list and glossary, for reference.
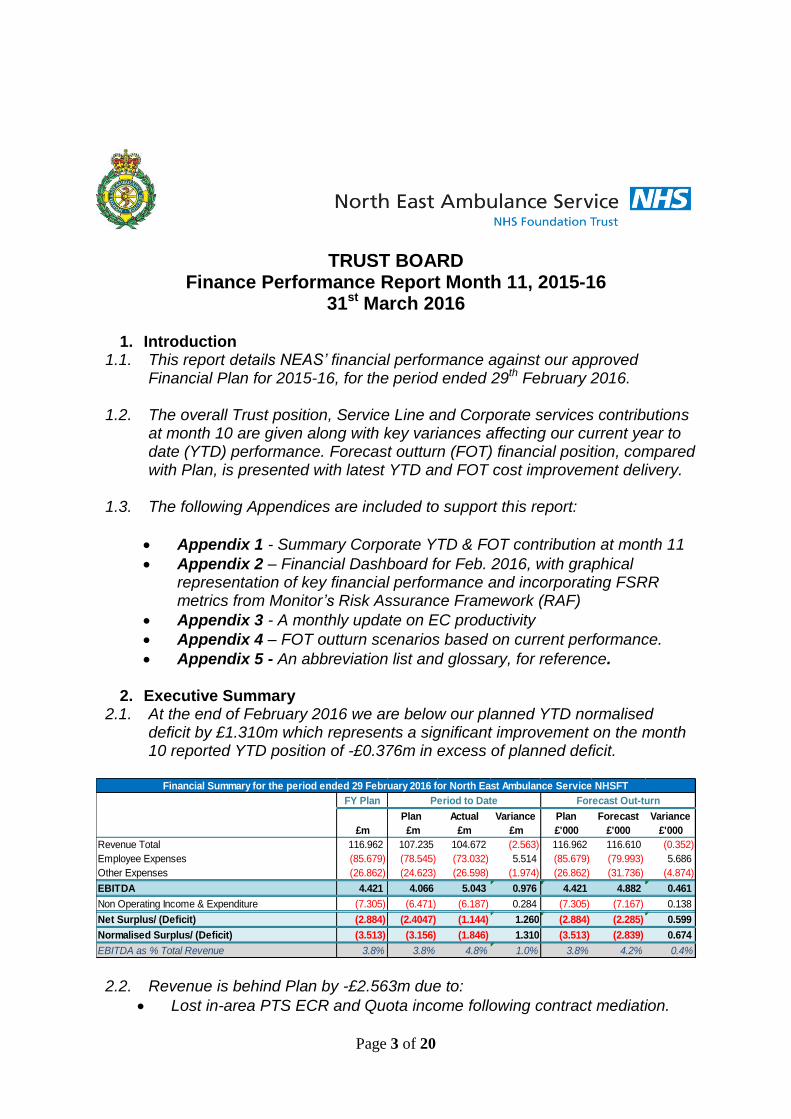
2. Executive Summary 2.1. At the end of February 2016 we are below our planned YTD normalised
deficit by £1.310m which represents a significant improvement on the month 10 reported YTD position of -£0.376m in excess of planned deficit.
2.2. Revenue is behind Plan by -£2.563m due to:
Lost in-area PTS ECR and Quota income following contract mediation.
FY Plan
Plan Actual Variance Plan Forecast Variance
£m £m £m £m £'000 £'000 £'000
Revenue Total 116.962 107.235 104.672 (2.563) 116.962 116.610 (0.352)
Employee Expenses (85.679) (78.545) (73.032) 5.514 (85.679) (79.993) 5.686
Other Expenses (26.862) (24.623) (26.598) (1.974) (26.862) (31.736) (4.874)
EBITDA 4.421 4.066 5.043 0.976 4.421 4.882 0.461
Non Operating Income & Expenditure (7.305) (6.471) (6.187) 0.284 (7.305) (7.167) 0.138
Net Surplus/ (Deficit) (2.884) (2.4047) (1.144) 1.260 (2.884) (2.285) 0.599
Normalised Surplus/ (Deficit) (3.513) (3.156) (1.846) 1.310 (3.513) (2.839) 0.674
EBITDA as % Total Revenue 3.8% 3.8% 4.8% 1.0% 3.8% 4.2% 0.4%
Financial Summary for the period ended 29 February 2016 for North East Ambulance Service NHSFT
Period to Date Forecast Out-turn

Page 4 of 20
Slow release of reserves for Resilience scheme use, with most also underspending. Matching income release to spend to date generates YTD income under-recovery against Plan of -£1.254m for Resilience reserves.
Non-release of the £1m Transformation Fund to date – although CCGs have now agreed to pay the full value this year. This generates an income shortfall against this reserve of -£0.889m YTD.
No Commercial Development income assumed in 2015-16, reducing income to date by -£0.781m compared to YTD Plan.
Some offset from ECS transfers to NSECH (£0.337m) and income for Sunderland PTS discharge resource (£0.064m) – both have now ceased.
2.3. Employee expense underspend is now £5.514m. Vacancies in ECS and Corporate functions, slippage in Commercial Development and delayed spend on Resilience schemes continue to account for most of this.
2.4. Pay savings are partly offset by YTD non-pay overspending of -£1.974m
(month 10, -£2.591m overspend). Within this:
£3.975m was spent on TPP across ECS, ICaT and PTS (a YTD overspend of -£2.929m)
Overspending on other lines include meal breaks (-£0.371m), ACS (-£0.224m) and vehicle maintenance (-£0.254m)
In month 11, spend on TPP was less than forecast, reducing budget overspend compared to month 10.
Also, YTD charges to the Contact Centre have been under-stated by £0.2m in-month, inflating the service line’s YTD non-pay underspend.
Non-pay spend includes VSS payments of -£0.215m YTD whilst unplanned ‘Payments In Lieu Of Notice’ paid to VSS staff total £0.040m to date, reported as pay costs.
The extension of the VSS scheme in Q4 is forecast to increase FOT spend to -£0.308m.
2.5. Net non-operating expenses are below YTD Plan by £0.284m (M10 £0.090m)
with under-recovery on asset sale profits from the sale of Fulbeck Grange more than offset by additional under-spend on depreciation and impairment costs.
2.6. At outturn we expect fewer asset impairments than originally planned with a higher revaluation reserve balance expected to be available against which they can be offset. This will see impairments of only -£0.147m compared to Plan of -£0.287m at year-end.
2.7. Our FOT normalised deficit is expected to improve on our planned position of
-£3.513m by £0.674m and to be -£2.839m at year-end with a surplus margin of -2.4% (an improvement of £0.730m compared to month 10).
2.8. At February 2016 our CIP shows YTD under-recovery of -£0.807m. Our latest
CIP outturn forecasts an under-recovery of -0.960m (or -14.0%) which is an improvement on month 10 CIP FOT of £0.048m. Full CIP performance analysis will be presented to the Transformation Board on 30th March 2016.

Page 5 of 20
2.9. The Table below identifies the Top 10 Cost Improvement Schemes, in terms of Plan value, and their relative performance to date and in terms of forecast outturn as reported for month 11, 2015-16:
2.10. Further analysis of the YTD financial position and FOT assumptions for all service lines, reserves and corporate functions follows in Section 3 below.
3. Service Line Analysis
3.1. Emergency Care Services (ECS) 3.1..1. YTD and FOT financial contribution performance of the ECS service line:
3.1..2. YTD overspend of -£1.427m is forecast to increase to –£1.746m by year-end (Month 10 -£1.624m). Key factors are:
ECS vacancies contribute to pay savings of £1.085m YTD (compared to a pay underspend of £0.957m last month). Overtime increased in month and is now expected to remain above pre-December 2015 levels until year-end. Four Polish Paramedics commenced with NEAS on 4th March 2016 and further international recruitment identified another 20 recruits for 2016-17.
TPP resources to support core ECS cost £3.189m YTD with a further £0.130m utilised for 2015-16 winter resilience, £0.314m on ICaT and £0.033m for 2014-15 winter scheme extensions.
Overspend on ECS meal payments of £0.363m to date
These items constitute most of ECS’ non-pay overspend of -£3.540m YTD.
In terms of FOT, assumed additional 400 hpw on TPP remains in place funded through Resilience slippage with some additional provision for a further 300 hours added in March to cover Easter, etc. increasing potential hours above the previously agreed to 1,046 hpw to year-end.
Monitor
Annual Plan
(Original)
Revised Plan Plan YTD Actual YTD YTD
Variance
YTD
Variance %
Forecast
Outturn
FOT
Variance
FOT
Variance %
ECS Unallocated recurrent CIP - unidentified 2,016,068 1,604,586 1,468,973 0 -1,468,973 -100.0% 0 -1,604,586 -79.6%
ECS 3rd Party resources 1,783,984 1,783,984 1,313,792 595,100 -718,692 -54.7% 961,668 -822,317 -46.1%
PTS DUCT Contract Renewal - 2015/16 395,026 395,026 362,107 471,139 109,031 30.1% 555,573 160,547 40.6%
PTS ACS - additional mileage reduction 307,584 307,584 269,852 289,693 19,841 7.4% 294,551 -13,033 -4.2%
CC Overtime Reductions - 999 Dispatch BC 269,834 269,834 247,348 131,369 -115,979 -46.9% 172,379 -97,455 -36.1%
CC Pay - Agency Reductions 206,036 206,036 158,114 0 -158,114 -100.0% 0 -206,036 -100.0%
CBS Commercial Training contribution gain 204,360 204,360 184,924 0 -184,924 -100.0% 0 -204,360 -100.0%
ECS ECCM - Reduce Meal Break payments 191,142 191,142 159,285 0 -159,285 -100.0% 0 -191,142 -100.0%
ECS EC - OT Reductions - ECCMs reduce late finish 179,564 179,564 149,636 0 -149,636 -100.0% 0 -179,564 -100.0%
ECS Vehicle Insurance Rebates 178,291 178,291 178,291 178,289 -2 0.0% 178,289 -2 0.0%
TOTAL TOP 10 SCHEMES (BY VALUE) PERFORMANCE 5,731,889 5,320,406 4,492,322 1,665,590 -2,826,731 -62.9% 2,162,460 -3,157,946 -55.1%
Scheme
TOP 10 CIP PERFORMANCE : February 2016
Annual
Budget Ytd Budget Actual
Ytd
Variance
Extrapol-
ated Forecast
Variance
Budget to
Forecast
ECS - Emergency Care Services (including ICAT & APP)
Income 67,870,791 62,218,566 63,245,997 1,027,431 68,995,634 69,030,251 1,159,460
Pay Expenditure -45,862,485 -41,848,451 -40,763,103 1,085,348 -44,468,840 -44,639,386 1,223,099
Non Pay Expense -5,886,156 -5,518,752 -9,058,389 -3,539,637 -9,881,879 -10,015,179 -4,129,023
Contribution to O/heads 16,122,150 14,851,363 13,424,505 -1,426,858 14,644,915 14,375,686 -1,746,464

Page 6 of 20
Non-pay outturn still includes assumed international recruitment spend of £0.045m against a planned £0.140m this year.
3.1..3. In terms of CIP delivery, the month 11 YTD and FOT positions for ECS – split between recurrent and non-recurrent schemes – is:
3.2. Patient Transport Services (PTS) 3.2..1. YTD and FOT financial contribution performance of the PTS service line:
3.2..2. YTD overspend of -£0.026m is reported with a FOT position of -£0.187m now projected (Month 10 -£0.407m). Key factors are:
Lost PTS ECR income following mediation contributing to an under-recovery on income to date of -£0.538m and -£0.650 at outturn.
Over-activity on the Cumbria CCG contract has reduced - now expected to exceed planned income by £0.062m by March 2016.
Reductions in overtime in recent months expected to continue and underspend at year-end of £0.071m (month 10 £0.021m).
Taxi underspend increased to £0.108m in month and taxi FOT spend is estimated at £0.064m less than plan, using a rate equivalent to average YTD spend as at month 11.
ACS overspend of -£0.223m to date and £0.257m FOT.
Unplanned PTS use of TPP transport accounts for -£0.095m of non-pay expense to date (excluding EOL resilience vehicles).
Fuel underspend in PTS is £0.359m YTD and based on this we can expect a £0.396m underspend at outturn.
3.2..3. Month 11 YTD and FOT CIP delivery for PTS – split between recurrent
and non-recurrent schemes – is shown below:
3.3. Contact Centre (CC) 3.3..1. YTD and FOT financial contribution performance of the CC service line:
Emergency Care Monitor Plan Revised Plan YTD Plan YTD Actual YTD Var YTD Var % FOT FOT Var FOT Var %
Recurrent Rec 4,110,262 4,110,262 3,443,974 1,596,831 -1,847,143 -53.6% 2,026,341 -2,083,921 -50.7%
Non-recurrent N/R 313,696 313,696 302,412 117,961 -184,451 -61.0% 131,116 -182,580 -58.2%
4,423,958 4,423,958 3,746,386 1,714,792 -2,031,594 -54.2% 2,157,457 -2,266,501 -51.2%
Annual
Budget Ytd Budget Actual
Ytd
Variance
Extrapol-
ated Forecast
Variance
Budget to
Forecast
Patient Transport Services
Income 21,636,712 19,833,657 19,295,610 -538,046 21,049,757 20,985,912 -650,799
Pay Expenditure -11,305,539 -10,361,511 -10,347,216 14,295 -11,287,872 -11,234,308 71,231
Non Pay Expense -5,220,841 -4,791,662 -4,293,588 498,074 -4,683,914 -4,828,206 392,635
Contribution to O/heads 5,110,332 4,680,484 4,654,807 -25,677 5,077,971 4,923,398 -186,934
PTS Monitor Plan Revised Plan YTD Plan YTD Actual YTD Var YTD Var % FOT FOT Var FOT Var %
Recurrent Rec 637,617 637,617 561,923 866,388 304,464 54.2% 862,127 224,510 35.2%
Non-recurrent N/R 485,153 485,153 445,919 572,889 126,970 28.5% 671,407 186,254 38.4%
1,122,770 1,122,770 1,007,842 1,439,277 431,435 42.8% 1,533,533 410,763 36.6%

Page 7 of 20
3.3..2. YTD reported underspend of £0.270m excludes £0.213m for Feb 2011 NDUC 111 contract fees - re-stated underspend being £0.057m. This is forecast to be £0.203m at year-end (M10 £0.239m). Key factors are:
Income is negatively affected by the loss of shared ECR income and the adverse impact of 111 performance penalties exceeding Plan – both combine to reduce overall income and create an under-recovery to Plan of -£0.349m YTD and -£0.181m FOT.
Some NHS 111 penalties are recovered through reduced fees payable to NDUC (to which £0.235m of forecast £0.242m charges relate).This contributes to the non-pay underspend forecast of £0.480m above.
Pay costs include unplanned agency spend of -£0.373m and only a small increase is forecast to bring agency FOT to £0.375m at year-end.
Pay spend also includes reduced dispatch and PTS planning overtime compared to 2015-16 (reflected in our CIP).
The beneficial impact of CC identifying CIPs above its 2015-16 target generates a non-pay underspend of £0.336m YTD (£0.367m FOT).
3.3..3. Month 11 YTD and FOT CIP delivery for Contact Centre – split between
recurrent and non-recurrent schemes – is shown below:
3.4. Commercial Business Services (CBS) 3.4..1. YTD and FOT financial contribution performance of the CBS service line:
3.4..2. Current YTD under-recovery is -£0.167m - a deterioration from previous reported position at month 10 (-£0.149m).
3.4..3. Performance is expected to worsen by year-end to an increased deficit of -£0.183m, reflecting current and future income and a significant under-recovery against CBS plans for the year.
Annual
Budget Ytd Budget Actual
Ytd
Variance
Extrapol-
ated Forecast
Variance
Budget to
Forecast
Contact Centre
Income 19,515,296 17,896,212 17,547,037 -349,174 19,142,223 19,334,046 -181,250
Pay Expenditure -12,044,328 -11,045,294 -11,129,800 -84,506 -12,141,601 -12,139,807 -95,479
Non Pay Expense -3,178,781 -2,914,107 -2,210,900 703,207 -2,411,891 -2,699,001 479,780
Contribution to O/heads 4,292,187 3,936,811 4,206,337 269,526 4,588,732 4,495,239 203,052
Contact Centre Monitor Plan Revised Plan YTD Plan YTD Actual YTD Var YTD Var % FOT FOT Var FOT Var %
Recurrent Rec 167,757 167,757 118,291 185,790 67,499 57.1% 230,549 62,792 37.4%
Non-recurrent N/R 67,990 67,990 62,324 37,125 -25,199 -40.4% 37,125 -30,865 -45.4%
235,747 235,747 180,616 222,915 42,300 23.4% 267,675 31,927 13.5%
Annual
Budget Ytd Budget Actual
Ytd
Variance
Extrapol-
ated Forecast
Variance
Budget to
Forecast
Commercial
Income 1,264,208 1,154,267 970,501 -183,766 1,058,728 1,061,437 -202,771
Pay Expenditure -444,459 -407,359 -405,841 1,518 -442,736 -438,884 5,575
Non Pay Expense -175,844 -159,928 -144,296 15,632 -157,414 -161,283 14,561
Contribution to O/heads 643,905 586,980 420,363 -166,617 458,578 461,270 -182,635

Page 8 of 20
3.4..4. In terms of CIP delivery, the month 11 YTD and FOT positions for CBS is shown below and reflects a more realistic position on CBS income plans to date and at year-end:
3.5. Corporate Directorates 3.5..1. YTD and FOT financial contribution performance of Corporate Services:
3.5..2. YTD underspend of £2.725m is forecast to be £1.152m at outturn. Key
factors are:
Commercial Development income removed - delivering a shortfall on YTD and FOT income of -£0.710m and -£0.852m respectively.
Pay savings of £1.878m to date reflect: o Finance & Resources underspend of £0.279m (£0.078m Informatics) o Workforce & OD underspends of £0.411m (excluding VSS costs) o Strategy & Contracting underspends of £0.678m (Commercial
Development slippage is £0.438m YTD) o Slipped recruitment to the new risk/claims structure (£0.184m)
Corporate pay underspend forecast to increase to £2.028m by year-end – inclusive of an assumed increase in leave accrual provision for the Trust at year-end of £0.084m.
Corporate non-pay savings of £1.254m to date becomes a -£0.445m overspend on outturn, reflecting the following adjustments: o Purchase of IT Hardware (£0.224m) and Data Line upgrades reduce
YTD underspend on IT, data lines/ telephony and licencing from £0.346m to only £0.030m at outturn
o Fleet maintenance overspend of -£0.254m increases to -£0.382m o YTD Estates and Premises cost underspend of £0.1930m becoming
a -£0.502m overspend at outturn. Outturn now includes £0.080m for HQ desk moves Provision for part-demolition of Fulbeck £0.030m Provision against Bernicia Heating case legal costs £0.4m
o IT purchases to support electronic patient care record (EPCR) replacement have reduced significantly to only £0.013m for the year.
3.5..3. Month 11 YTD and FOT CIP delivery for Corporate Services – split between recurrent and non-recurrent schemes – is shown below:
CBS Monitor Plan Revised Plan YTD Plan YTD Actual YTD Var YTD Var % FOT FOT Var FOT Var %
Recurrent Rec 161,569 161,569 145,422 1,587 -143,835 -98.9% 1,736 -159,833 -98.9%
Non-recurrent N/R 0 0 0 4,648 4,648 0.0% 4,648 4,648 0.0%
161,569 161,569 145,422 6,235 -139,186 -95.7% 6,384 -155,184 -96.0%
Annual
Budget Ytd Budget Actual
Ytd
Variance
Extrapol-
ated Forecast
Variance
Budget to
Forecast
Corporate (including 14/15 Winter Resilience c/f)
Income 2,836,509 2,603,104 2,196,071 -407,033 2,395,714 2,405,924 -430,585
Pay Expenditure -13,113,454 -12,018,408 -10,140,527 1,877,881 -11,062,393 -11,085,651 2,027,803
Non Pay Expenditure -12,792,485 -11,789,935 -10,535,661 1,254,275 -11,493,448 -13,237,597 -445,112
Contribution to O/heads -23,069,430 -21,205,239 -18,480,117 2,725,122 -20,160,127 -21,917,324 1,152,106

Page 9 of 20
3.6. Trust Reserves 3.6..1. 2015-16 financial plans provided for income and expenditure related to:
1. NHS 111 Green Validation development 2. Local (CCG) and National (NHS England) Resilience/ Winter funding 3. CCG Transformation Funding (part of the 2015-16 contract offer)
3.6..2. Additional contingency reserves were created for potential pressures:
4. Non-Pay inflation contingency reserve 5. Pay award reserves 6. A First Responder contingency reserve
3.6..3. After mediation - in part-mitigation for lost income - any uncommitted
spend against reserves 5 and 6 above was released, generating £0.150m from the pay award reserve and £0.024m from the First Responder to reduce our deficit.
3.6..4. Ongoing monitoring of the Clinical Hub and other resilience schemes has
led to adjustments to our FOT which reflect the latest delivery plan.
3.6..5. Slippage on clinical hub delivery in relation to recruitment of clinicians and the set-up of a specialist dispatch desk has generated significant underspend on this scheme, whilst other resilience projects such as HALO have not generated the levels of spend predicted out the outset.
3.6..6. CCGs have confirmed that there is no intention to claw-back resilience
underspends. Consequently, a provision for non-release of funds of £0.260m was removed in month 11 ensuring forecast income from these resilience reserves returns the maximum of £2.247m income at outturn.
3.6..7. Whilst discussions with CCGs on the use of the £1m Transformation Fund
to offset PTS activity pressures concluded with commissioners offsetting less than £0.4m of costs to PTS, it was confirmed that the full value of the fund would be paid this year. Consequently, the £0.5m contingency provided against this income in month 10 has been removed.
3.6..8. The table below summarises the YTD and FOT financial position of these
reserves against Plan after accounting for the above adjustments to FOT income and including carry forward of the 2014-15 resilience schemes:
Corporate Monitor Plan Revised Plan YTD Plan YTD Actual YTD Var YTD Var % FOT FOT Var FOT Var %
Recurrent Rec 767,434 767,434 663,871 1,072,847 408,976 61.6% 1,207,256 439,822 57.3%
Non-recurrent N/R 144,492 144,492 134,673 615,548 480,875 357.1% 724,081 579,590 401.1%
911,926 911,926 798,544 1,688,395 889,851 111.4% 1,931,337 1,019,411 111.8%
Annual
Budget
Ytd
Budget Actual
Ytd
Variance
Extrapol-
ated Forecast
Variance
Budget to
Forecast
RESERVES
Income 3,836,284 3,518,629 1,416,964 -2,101,665 1,545,779 3,792,861 -43,423
Pay Expenditure -1,799,830 -1,583,186 -245,287 1,337,899 -267,586 -454,505 1,345,325
Non Pay Expenditure -698,598 -610,220 -354,582 255,638 -386,817 -794,365 -95,767
Contribution to O/heads 1,337,856 1,325,223 817,095 -508,128 891,377 2,543,991 1,206,135

Page 10 of 20
3.6..9. Our YTD overspend of -£0.508m reflects income deferrals to match actual YTD expense incurred. Our FOT contribution has increased to £2.544m (from £1.537m in M11) – the over-recovery against Plan of £1.206m representing the gain to our plan from the Transformation Fund release.
3.7. Cash Position and Forecast 3.7..1. The Cash Flow summary below summarises YTD movement in cash
since 31st March 2015 and forecasts the cash balance held at year-end.
3.7..2. The key factors that have influenced our cash balance up to 29th February 2016 and that impact on the forecast cash held at 31st March 2016 are:
The cash balance at 29th February 2016 was £12.864m, an increase of £0.904m from 31st January 2016. This is £2.048m more than the Monitor Plan forecast at this date
The increase in cash of £0.904m from January is mainly due to Trade Creditors increasing by £0.528m due to a payment run crossing over into March. Also, capital expenditure was low in the month due to additional VAT recovery and again some payments being made in March
The year to date position is now £2.048m ahead of plan and this is due to a combination of 3 factors:
o YTD capital expenditure is £5.928m compared to the planned position of £8.208m, less the non-receipt of Fulbeck and Bellingham disposals, less movements in capital creditors gives a capital position of £1.322m of additional cash than planned
o The final costs for the reparation work at Scotswood House were £0.190m less than originally forecast
o An increase in trade creditors assisting the YTD position by £0.528m
There is again an improvement to the year-end forecast cash position from £9.554m at Month 10 to £10.914m at Month 11. This increase is due to a further downward revision to the year-end capital expenditure forecast, increasing the year-end cash forecast from M10 by £0.431m. The deficit position has also improved significantly from Month 10 and so this accounts for the remaining difference. There is still some uncertainty regarding the year-end position mainly due to the fact that although bills have been sent to the CCG’s for the £1m transformation funding, these
FY Plan
Plan Actual Variance Plan Actual Variance
£'m £'m £'m £'m £'m £'m £'m
Surplus/Deficit (from operations) (2.764) (2.103) (2.357) (0.254) (2.764) (2.779) (0.015)
Change in working capital 2.038 1.977 2.219 0.243 2.038 1.094 (0.944)
Non cash adjustments 7.185 5.728 5.427 (0.301) 7.185 6.879 (0.306)
Cashflow from operations 6.459 5.602 5.289 (0.313) 6.459 5.194 (1.265)
Cashflow from investing activities (7.984) (5.587) (5.168) 0.419 (7.984) (6.675) 1.309
Cashflow before financing (1.525) 0.015 0.122 0.107 (1.525) (1.481) 0.044
Cashflow from financing activities (1.436) (0.987) (0.687) 0.299 (1.436) (1.491) (0.055)
Net increase/(decrease) in cash (2.961) (0.972) (0.566) 0.406 (2.961) (2.972) (0.011)
Cash b/fwd 12.526 12.526 12.526 12.526 12.526
Cash c/fwd 9.565 11.554 11.960 0.406 9.565 9.554 (0.011)
Cashflow Summary - Jan'16
Period to Date Out-turn

Page 11 of 20
invoices do not fall due until after the last date for intra-NHS payments(22nd March) so they may not be settled by 31st March 2016.
4. Strategic impact
4.1. Ensuring we deliver or improve upon our Financial Plan deficit position for 2015-16 is the key to achieving the strategic intention ‘To have sound financial health’. Improved forecast financial performance has brought a recent beneficial impact, but failure to deliver will damage our ability to be financially sustainable and viable as an organisation.
4.2. Failure to deliver our Financial Plan will have a profound impact on our ability
to carry out all other strategic intentions identified by the Trust as follows:
To lead in the provision of Emergency Care
To transform Patient Transport Services
To be a key partner in Urgent Care
To be a first rate employer
To be well governed and accountable.
4.3. Furthermore, a lack of financial resources hinders our ability to provide safe and effective services and diminishes our ability to invest in future improvements and developments.
5. Assurances
5.1. This report provides assurance that the Trust’s financial position is appropriately monitored and reported in a timely manner. It also identifies areas of concern pertaining to the financial performance of the organisation and seeks to recommend appropriate remedial action to address these.
6. Risks
6.1. The key risks arising from the financial position and Forecast Outturn presented within this report are:
To the ongoing financial viability and ongoing sustainability of the organisation posed by our deficit and the outturn forecast which, in turn, reduces our cash balance and liquidity further.
That any deficit and cash deterioration has an adverse impact on the FSRR reported to Monitor. Reduced cash balance and liquidity has been a consequence of sustained deficit over the last two financial years.
Our capped FSRR score of 2 defines us as having a ‘material level of financial risk’. Appendix 2 shows our Capital Service Cover, Liquidity and variance in I&E Margin as a % of income are all strong. However, our overall I&E margin score of 1 caps our overall risk score at 2 under the new framework. Recent recovery in our I&E Variance from Plan has, however, pushed our weighted score to 3.3 for both YTD and FOT.
This places us at risk of scrutiny from Monitor and potential investigation to assess if we are breaching the financial conditions of our Continuity of Service licence.
Achievement of long-term CIP plans remains reliant on transformational programmes of service change bringing cost reductions. Savings will not materialise this year to materially affect our deficit position this year but are pivotal in returning the Trust to financial viability in 2016-17.

Page 12 of 20
That this Plan assumed receipt of £1m in income from a Transformation fund - this has been confirmed by Commissioners, fully-mitigating this risk in-year (see 3.6.7 above).
That the Plan assumed and CCGs confirmed in month 11 that clawback of funding would not be actioned. We therefore removed a provision of £0.260m against this possibility (see 3.6.6 above).
Costs of the EPCR replacement project in 2015-16 have slipped form original business case estimates. Whilst no additional costs will be incurred above those currently planned this year, there is a financial pressure being generated for 2016-17 due to slippage of supplier-related IT timelines which now need to be planned for in this context.
Our latest outturn assumes some budgets currently underspent will incur costs to budget level in the month of March. This assumption has been made following 2016-17 budget-setting and in-year budget meetings with nominated budget holders. There is a risk that not all expenditure will be delivered as expected – though this would provide a beneficial impact on our financial position for the year.
Although a number of additional provisions have been included in advance of 2015-16 year-end – for annual leave accrual and Bernicia heating dispute legal fees in particular – there remains a potential risk for further provisions increases in relation to employer liability and negligence, for which information at present is limited, which could have an adverse impact on our outturn position.
In managing our financial position, there is a risk of service delivery being affected as resource availability is impinged – with knock-on effects for service performance and the quality of services delivered.
7. Recommendations
7.1. The Board are recommended to:
Receive this update and seek clarity on the information reported.
Seek assurance that service line and corporate management, with support from the Finance Directorate and others, are progressing any available plans to address the emerging financial gap.
Require all areas of the Trust to support the Finance team in undertaking any detailed, critical reviews of spend with a view to committing to recurrent savings from 2016-17.
Ask that the Transformation Board continues to prioritise, agree and implement any cost improvement scheme, currently residing on the Trust mitigation list to deliver additional CIP during 2015-16.
Author and Sponsor Sponsor: R French Title Director of Finance & Resources Author: Mark Redhead Title: Head of Financial Management Date: 23rd March 2016

Page 13 of 20
Appendix 1: Corporate Directorates’ Financial Performance – February 2016
Annual
Budget Ytd Budget Actual
Ytd
Variance
Extrapolated
position Forecast
Variance
Budget to
Forecast
Chief Executive
Income 0 0 0 0 0 0 0
Pay Expenditure -812,795 -744,870 -726,018 18,852 -792,020 -790,819 21,976
Non Pay Expenditure -531,275 -487,020 -409,610 77,410 -446,847 -534,054 -2,779
-1,344,070 -1,231,890 -1,135,628 96,262 -1,238,867 -1,324,873 19,197
Finance
Income 57,429 52,647 127,295 74,648 138,867 134,410 76,981
Pay Expenditure -2,945,251 -2,700,170 -2,421,543 278,628 -2,641,683 -2,642,560 302,691
Non Pay Expenditure -6,510,842 -5,964,624 -5,064,783 899,841 -5,525,217 -6,736,786 -225,944
-9,398,665 -8,612,148 -7,359,030 1,253,117 -8,028,033 -9,244,936 153,728
Fleet
Income 77,523 71,062 65,990 -5,072 71,989 70,448 -7,075
Pay Expenditure -2,060,820 -1,888,453 -1,812,166 76,287 -1,976,909 -1,981,472 79,348
Non Pay Expenditure -2,206,960 -2,023,043 -2,315,480 -292,437 -2,525,978 -2,609,438 -402,478
-4,190,257 -3,840,434 -4,061,656 -221,222 -4,430,897 -4,520,462 -330,205
Worforce
Income 2,632 2,632 3,049 417 3,326 3,049 417
Pay Expenditure -1,694,836 -1,553,116 -1,357,851 195,265 -1,481,292 -1,488,453 206,383
Non Pay Expenditure -714,322 -656,854 -597,551 59,303 -651,873 -801,221 -86,899
-2,406,526 -2,207,338 -1,952,353 254,985 -2,129,839 -2,286,625 119,900
Training
Income 1,154,616 1,060,763 1,350,048 289,285 1,472,780 1,449,129 294,513
Pay Expenditure -946,688 -866,499 -672,637 193,862 -733,786 -726,852 219,836
Non Pay Expenditure -1,198,896 -1,122,685 -809,178 313,507 -882,740 -1,022,109 176,787
-990,968 -928,421 -131,767 796,653 -143,746 -299,832 691,136
Operations Management
Income 0 0 2,128 2,128 2,322 2,128 2,128
Pay Expenditure -789,032 -723,011 -591,278 131,733 -645,031 -645,114 143,918
Non Pay Expenditure -128,748 -118,019 -114,280 3,739 -124,669 -121,833 6,915
-917,780 -841,030 -703,430 137,600 -767,378 -764,819 152,961
Strategy
Income 855,684 784,676 5,307 -779,369 5,789 5,307 -850,377
Pay Expenditure -1,664,019 -1,524,562 -845,065 679,497 -921,889 -923,182 740,837
Non Pay Expenditure -267,405 -245,124 -104,589 140,535 -114,098 -148,823 118,582
-1,075,740 -985,010 -944,348 40,663 -1,030,198 -1,066,698 9,042
Clinical
Income 688,625 631,324 643,357 12,033 701,844 742,556 53,931
Pay Expenditure -2,182,474 -2,001,655 -1,695,201 306,453 -1,849,311 -1,867,055 315,419
Non Pay Expenditure -1,155,173 -1,100,274 -1,064,946 35,328 -1,161,760 -1,203,388 -48,215
-2,649,022 -2,470,605 -2,116,791 353,815 -2,309,226 -2,327,887 321,135
Medical
Income 0 0 -1,103 -1,103 -1,203 -1,103 -1,103
Pay Expenditure -17,539 -16,072 -18,768 -2,696 -20,474 -20,143 -2,604
Non Pay Expenditure -78,864 -72,292 -55,244 17,048 -60,266 -59,945 18,919
-96,403 -88,364 -75,114 13,250 -81,943 -81,192 15,211
Total Corporate (excl. Resilience) -23,069,430 -21,205,239 -18,480,117 2,725,122 -20,160,127 -21,917,324 1,152,106

Page 14 of 20
APPENDIX 2 - FINANCIAL PERFORMANCE DASHBOARD - FEBRUARY 2016 (Year-End 2015/16)
SOCI (Income & Expenditure) POSITION
YTD PLAN YTD ACT YTD VAR PLAN FOT VARIANCE
£'m £'m £'m £'m £'m £'m R A G
EBITDA 4.066 5.043 0.976 4.421 4.882 0.461 < -2.5% +2.5% to -2.5% > +2.5%
I&E Margin -3.156 -1.846 1.310 -3.513 -2.839 0.674 < -2.5% +2.5% to -2.5% > +2.5%
Capital Spend 8.208 5.928 -2.280 9.593 6.820 -2.773 <=-15% or >=15% < -10% or >10% -10% to 10%
CIP/ Efficiency Plan delivery 5.879 5.072 -0.807 6.856 5.896 -0.960 < -2.5% +2.5% to -2.5% > +2.5%
CONTRIBUTION BY SERVICE LINE (Pending completion of SLM Reports)
YTD PLAN YTD ACT YTD VAR PLAN OUTTURN VARIANCE
£'m £'m £'m £'m £'m £'m R G
Emergency Care 14.851 13.425 -1.427 16.122 14.376 -1.746 < £0 > £0
Patient Transport 4.680 4.655 -0.026 5.110 4.923 -0.187 < £0 > £0
Contact Centre 3.937 4.206 0.270 4.292 4.495 0.203 < £0 > £0
CBS 0.587 0.420 -0.167 0.644 0.461 -0.183 < £0 > £0
Corprate (inc Reserves) -21.205 -18.480 2.725 -23.069 -21.917 1.152 < £0 > £0
BALANCE SHEET
Key Indicators YTD PLAN YTD ACT PLAN OUTTURN R A G
Cash (£m) £10.815 £12.864 £9.565 £10.914 < £0 < £5m > £5m
Loans Drawn 0 0 0 0 n/a n/a n/a
Loans Available 0 0 0 0 n/a n/a n/a
Monitor Liquidity Metric (Days) 10.1 18.6 7.0 15.4 < -7 days -7 days to 0 > 0 days
Creditor Days 22.9 n/a > 60 days 30 to 60 days < 30 dyas
Current Ratio 1.7% n/a < 1.5% 1.5% to 2% >2%
BPPC - Value 95.0% 95.7% 95.0% 95.0% < 95% 95% to 96% >96%
BPPC - Volume 95.0% 96.7% 95.0% 95.0% < 95% 95% to 96% >96%
CONTINUITY OF SERVICE RISK RATING (COSRR)
COSRR YTD RR FOT RR R A G
COSRR - Capital Service Cover 4.44 4.0 3.43 4.0 < 1.75x cover 1.75x to 2.5x > 2.5x cover
COSRR - Liquidity 18.6 4.0 15.4 4.0 < or = -7 Days -7 to 0 days 4
3.5 4.0
NEW RAF: Financial Sustainability Risk Rating*
Capital Service Capacity 4.44 4.0 3.43 4.0 < 1.75x cover 1.75x to 2.5x > 2.5x cover
Liquidity (Days) 18.6 4.0 15.4 4.0 < or = -7 Days -7 to 0 days 4
I&E Margin (%) -1.8% 1.0 -2.4% 1.0 < or = -0% 0% to 1% >= 1%
Variance in I&E Margin as a % of income 1.9% 4.0 1.1% 4.0 < or = -1% -1% to 0% >= 0%
Weighted Score 3.3 3.3 Average of 2 Avge. of 2 to 3.49 Average > 3.5
CAPPED FINANCIAL SUSTAINABILITY RATING** 2.0 2.0 Average of 2 Avge. of 2 to 3.49 Average > 3.5
* NOTE: New Monitor RAF released 5th August 2015, to apply to reporting from month 5
** Financial Sustainability Rating score is capped at 2 where any contributing metric scores 1
CIP DELIVERY: Recurrent Vs. Non-Recurrent
YTD PLAN YTD ACT YTD VAR PLAN OUTTURN VARIANCE
£'m £'m £'m £'m £'m £'m R A G
Recurrent CIPs 4.933 3.723 -1.210 5.845 4.328 -1.517 to update < -2.5% +2.5% to -2.5% > +2.5%
Non-Recurrent CIPs 0.945 1.348 0.403 1.011 1.568 0.557 to update < -2.5% +2.5% to -2.5% > +2.5%
RAG score ranges
Variance RAG score ranges
Variance RAG score ranges
RAG score ranges
RAG score ranges

Page 15 of 20
APPENDIX 2 - FINANCIAL PERFORMANCE GRAPHS - FEBRUARY 2016 (Year-End 2015/16)
0.000
1.000
2.000
3.000
4.000
5.000
6.000
£'m
Delivery of EBIDTA
EBITDA YTD Plan EBITDA YTD Actual
-3.500
-3.000
-2.500
-2.000
-1.500
-1.000
-0.500
0.000
£'m
Deficit Against Plan
DEFICIT YTD Plan DEFICIT YTD Actual
7.5
12.5
17.5
Apr-15
May-15
Jun-15 Jul-15 Aug-15
Sep-15
Oct-15
Nov-15
Dec-15
Jan-16 Feb-16
Mar-16
Cash Balances Against Plan
YTD Plan YTD Actual
0
2,000,000
4,000,000
6,000,000
8,000,000
10,000,000
12,000,000
£
Capital Expenditure Against Plan
Original Plan Cum'tve Revised Plan Actual Cumulative
-150.0%
-100.0%
-50.0%
0.0%
50.0%
100.0%
150.0%
200.0%
Pe
rce
nta
ge %
Service Line
% Achievement of CIP - 2015/16 FOT

Page 16 of 20
Appendix 3: Part 1 - EC Productivity Resource Analysis EC Resource Analysis - Paid Hrs Comparison based on First 49 Weeks of 14/15 against 15/16
1.5 1.5 1.5
Financial Year Planned Hrs Actual Hrs Overtime Hrs ICaT ICaT Overtime PTS VAS Other 3rd Party Total Paid Hrs Coverage Incidents Paid Hrs / Incident
2014/15 1,456,435 1,189,574 233,417 9,548 96,902 3,442 1,532,883 105.25% 362,378 4.23
DCA 1,297,319 1,068,387 127,360
RRV 159,116 121,188 28,251
2015/16 1,503,755 1,222,316 221,595 31,987 1,336 3,514 105,629 16,684 1,603,061 106.60% 353,098 4.54
DCA 1,341,456 1,111,026 117,599 13,603 880
RRV 162,299 111,289 30,131 18,385 11
0.31
actual hrs
Rates: 28.02 60 60
DCA 33.71 33.71 35.73 21.18 28.02
RRV 19.75 19.75 20.95 22.91 30.42
Financial Year Planned £ Actual £ Overtime £ ICaT ICaT Overtime PTS £ VAS £ Other 3rd Party £ Total £ Incidents Cost / Incident
2014/15 46,874,516 38,408,215 5,142,788 178,327 5,814,120 206,520 49,749,971 362,378 137.29
2015/16 48,425,199 39,650,066 4,833,396 709,181 24,975 65,630 6,337,739 1,001,054 52,622,040 353,098 149.03
Variance 1,550,684 1,241,851 -309,393 709,181 24,975 -112,698 523,619 794,534 2,872,069 11.74
costed @ overtime rate RRV = APP (B7) costed @ overtime rate costed @ overtime, exc vehicle costs
DCA = PTS (1x B3, 1x B2)
staff costed at mid point, inc 25% unsocial

Page 17 of 20
Appendix 3: Part 2a - EC Resource Abstraction Analysis (2014-15 Data)
2014/15 to 2015/16 - EC Abstraction Analysis for First 49wks of Financial Year
WEEK ANNUAL LEAVE SICKNESS TRAININGCONTROLLED
ABSTRACTION
NON
CONTROLLED
ABSTRACTION
TOTAL WEEKTOTAL ROSTERED
HOURS
ANNUAL LEAVE
14/15SICKNESS 14/15 TRAINING 14/15
CONTROLLED
ABSTRACTION
14/15
NON
CONTROLLED
ABSTRACTION
14/15
2014/15 %
1 4,086 2,343 1,395 105 1,277 9,205 1 35,549 11.49% 6.59% 3.92% 0.29% 3.59% 25.89%
2 5,494 2,134 1,621 174 1,225 10,647 2 35,256 15.58% 6.05% 4.60% 0.49% 3.48% 30.20%
3 6,101 2,001 1,230 286 1,283 10,901 3 35,198 17.33% 5.69% 3.49% 0.81% 3.64% 30.97%
4 5,673 2,331 724 140 1,294 10,162 4 34,864 16.27% 6.69% 2.08% 0.40% 3.71% 29.15%
5 4,666 2,107 1,473 287 1,028 9,560 5 34,793 13.41% 6.05% 4.23% 0.82% 2.95% 27.48%
6 4,688 1,921 914 164 1,027 8,713 6 34,716 13.50% 5.53% 2.63% 0.47% 2.96% 25.10%
7 5,004 1,893 1,215 397 1,057 9,565 7 34,720 14.41% 5.45% 3.50% 1.14% 3.04% 27.55%
8 5,273 1,596 1,608 244 1,197 9,917 8 34,843 15.13% 4.58% 4.62% 0.70% 3.43% 28.46%
9 6,705 2,311 1,006 264 1,025 11,311 9 34,632 19.36% 6.67% 2.91% 0.76% 2.96% 32.66%
10 5,674 2,175 1,728 270 1,221 11,067 10 35,080 16.17% 6.20% 4.92% 0.77% 3.48% 31.55%
11 5,301 1,710 1,449 253 1,373 10,086 11 34,868 15.20% 4.90% 4.15% 0.73% 3.94% 28.93%
12 5,702 2,357 1,367 242 1,075 10,743 12 34,950 16.31% 6.74% 3.91% 0.69% 3.08% 30.74%
13 6,018 2,303 1,148 274 959 10,701 13 34,770 17.31% 6.62% 3.30% 0.79% 2.76% 30.78%
14 5,616 2,625 1,269 251 996 10,757 14 34,714 16.18% 7.56% 3.66% 0.72% 2.87% 30.99%
15 5,485 2,394 1,714 294 1,124 11,009 15 34,594 15.85% 6.92% 4.95% 0.85% 3.25% 31.82%
16 5,475 2,109 1,777 209 1,110 10,681 16 34,605 15.82% 6.10% 5.14% 0.60% 3.21% 30.87%
17 5,688 2,346 1,281 165 900 10,378 17 34,463 16.50% 6.81% 3.72% 0.48% 2.61% 30.11%
18 6,220 2,817 1,236 242 918 11,432 18 34,888 17.83% 8.07% 3.54% 0.69% 2.63% 32.77%
19 6,328 3,204 1,012 233 1,180 11,956 19 34,821 18.17% 9.20% 2.90% 0.67% 3.39% 34.34%
20 6,585 2,886 1,031 199 1,122 11,821 20 34,890 18.87% 8.27% 2.95% 0.57% 3.22% 33.88%
21 6,088 2,665 1,010 317 1,202 11,280 21 34,746 17.52% 7.67% 2.91% 0.91% 3.46% 32.47%
22 6,533 2,666 386 140 1,085 10,809 22 34,836 18.75% 7.65% 1.11% 0.40% 3.11% 31.03%
23 5,657 2,357 1,048 317 1,062 10,440 23 34,683 16.31% 6.80% 3.02% 0.91% 3.06% 30.10%
24 5,645 2,489 1,653 377 1,369 11,532 24 35,206 16.03% 7.07% 4.70% 1.07% 3.89% 32.76%
25 5,752 2,855 1,461 301 1,230 11,599 25 35,132 16.37% 8.13% 4.16% 0.86% 3.50% 33.01%
26 5,687 2,988 974 261 1,356 11,265 26 35,264 16.13% 8.47% 2.76% 0.74% 3.85% 31.94%
27 4,815 2,557 2,299 232 1,336 11,238 27 35,193 13.68% 7.27% 6.53% 0.66% 3.80% 31.93%
28 5,018 2,142 2,509 209 1,430 11,307 28 35,227 14.25% 6.08% 7.12% 0.59% 4.06% 32.10%
29 4,458 2,559 2,079 99 1,696 10,890 29 35,365 12.60% 7.24% 5.88% 0.28% 4.79% 30.79%
30 4,693 2,531 2,439 255 1,364 11,280 30 35,745 13.13% 7.08% 6.82% 0.71% 3.81% 31.56%
31 5,954 2,642 2,772 221 1,305 12,893 31 35,688 16.68% 7.40% 7.77% 0.62% 3.66% 36.13%
32 4,153 2,994 2,159 228 1,257 10,790 32 35,716 11.63% 8.38% 6.04% 0.64% 3.52% 30.21%
33 4,307 2,349 2,422 220 1,459 10,756 33 35,648 12.08% 6.59% 6.79% 0.62% 4.09% 30.17%
34 4,240 2,313 2,190 368 1,374 10,484 34 35,726 11.87% 6.47% 6.13% 1.03% 3.85% 29.34%
35 4,495 2,497 2,312 119 1,587 11,009 35 35,670 12.60% 7.00% 6.48% 0.33% 4.45% 30.86%
36 4,782 2,559 2,093 206 1,339 10,978 36 35,687 13.40% 7.17% 5.86% 0.58% 3.75% 30.76%
37 5,061 3,071 1,686 162 1,396 11,374 37 35,804 14.13% 8.58% 4.71% 0.45% 3.90% 31.77%
38 5,672 3,255 388 11 1,274 10,599 38 35,936 15.78% 9.06% 1.08% 0.03% 3.54% 29.49%
39 5,254 3,472 230 33 1,223 10,211 39 35,838 14.66% 9.69% 0.64% 0.09% 3.41% 28.49%
40 4,429 3,646 182 33 1,135 9,424 40 35,858 12.35% 10.17% 0.51% 0.09% 3.16% 26.28%
41 4,537 3,263 1,411 202 1,489 10,903 41 35,733 12.70% 9.13% 3.95% 0.57% 4.17% 30.51%
42 4,755 3,160 1,400 33 1,387 10,735 42 35,687 13.32% 8.85% 3.92% 0.09% 3.89% 30.08%
43 4,792 2,844 806 165 1,647 10,254 43 35,733 13.41% 7.96% 2.25% 0.46% 4.61% 28.70%
44 4,547 2,503 561 284 1,154 9,049 44 35,687 12.74% 7.01% 1.57% 0.80% 3.23% 25.36%
45 4,582 2,426 1,777 305 1,507 10,597 45 35,787 12.80% 6.78% 4.97% 0.85% 4.21% 29.61%
46 4,877 2,466 2,637 368 1,316 11,662 46 35,430 13.77% 6.96% 7.44% 1.04% 3.71% 32.92%
47 5,921 2,562 1,778 209 1,149 11,617 47 35,478 16.69% 7.22% 5.01% 0.59% 3.24% 32.75%
48 5,163 2,550 1,669 231 1,208 10,820 48 35,806 14.42% 7.12% 4.66% 0.65% 3.37% 30.22%
49 5,253 3,577 2,470 501 1,218 13,019 49 35,687 14.72% 10.02% 6.92% 1.40% 3.41% 36.48%
TOTAL 258,896 125,516 72,987 11,089 60,941 529,428 TOTAL 1,727,204 14.99% 7.27% 4.23% 0.64% 3.53% 30.65%
2014/15 ABSTRACTION HOURS % of ROSTERED HOURS

Page 18 of 20
Appendix 3: Part 2b - EC Resource Abstraction Analysis (2015-16 Data)
WEEK ANNUAL LEAVE SICKNESS TRAININGCONTROLLED
ABSTRACTION
NON
CONTROLLED
ABSTRACTION
TOTAL WEEKTOTAL ROSTERED
HOURS
ANNUAL LEAVE
15/16SICKNESS 15/16 TRAINING 15/16
CONTROLLED
ABSTRACTION
15/16
NON
CONTROLLED
ABSTRACTION
15/16
2015/16 %
1 3,984 2,699 1,472 66 1,668 9,889 1 36,357 10.96% 7.42% 4.05% 0.18% 4.59% 27.20%
2 3,800 2,612 1,230 89 1,660 9,389 2 36,146 10.51% 7.23% 3.40% 0.24% 4.59% 25.98%
3 4,394 2,422 1,589 613 1,619 10,635 3 36,508 12.03% 6.63% 4.35% 1.68% 4.43% 29.13%
4 4,885 2,740 1,915 571 1,639 11,750 4 37,082 13.17% 7.39% 5.16% 1.54% 4.42% 31.69%
5 5,438 2,640 1,732 651 1,725 12,186 5 37,045 14.68% 7.13% 4.67% 1.76% 4.66% 32.89%
6 5,839 2,855 1,360 635 1,608 12,296 6 37,169 15.71% 7.68% 3.66% 1.71% 4.33% 33.08%
7 4,996 2,615 2,710 603 1,152 12,075 7 37,089 13.47% 7.05% 7.31% 1.62% 3.11% 32.56%
8 5,831 2,909 2,636 670 1,268 13,314 8 36,925 15.79% 7.88% 7.14% 1.81% 3.43% 36.06%
9 6,821 2,910 990 539 1,134 12,394 9 36,823 18.52% 7.90% 2.69% 1.46% 3.08% 33.66%
10 6,166 3,270 2,604 547 1,040 13,627 10 36,577 16.86% 8.94% 7.12% 1.49% 2.84% 37.25%
11 6,225 3,483 2,563 747 1,354 14,372 11 37,037 16.81% 9.41% 6.92% 2.02% 3.66% 38.81%
12 6,092 3,365 2,343 544 917 13,260 12 37,051 16.44% 9.08% 6.32% 1.47% 2.48% 35.79%
13 6,483 3,114 1,935 662 1,269 13,462 13 37,047 17.50% 8.41% 5.22% 1.79% 3.43% 36.34%
14 5,613 3,380 1,669 565 1,396 12,622 14 36,847 15.23% 9.17% 4.53% 1.53% 3.79% 34.25%
15 5,858 3,120 1,428 666 1,318 12,390 15 37,785 15.50% 8.26% 3.78% 1.76% 3.49% 32.79%
16 6,074 3,223 1,909 557 1,276 13,038 16 37,641 16.14% 8.56% 5.07% 1.48% 3.39% 34.64%
17 6,840 2,893 1,749 462 1,523 13,466 17 37,610 18.19% 7.69% 4.65% 1.23% 4.05% 35.80%
18 6,869 2,836 1,329 435 1,563 13,031 18 37,655 18.24% 7.53% 3.53% 1.16% 4.15% 34.61%
19 7,608 3,325 1,227 597 1,268 14,025 19 37,839 20.11% 8.79% 3.24% 1.58% 3.35% 37.06%
20 7,071 3,399 1,214 463 1,344 13,491 20 37,677 18.77% 9.02% 3.22% 1.23% 3.57% 35.81%
21 6,744 3,450 1,607 632 1,471 13,903 21 37,427 18.02% 9.22% 4.29% 1.69% 3.93% 37.15%
22 7,269 4,624 1,390 401 1,295 14,978 22 37,718 19.27% 12.26% 3.69% 1.06% 3.43% 39.71%
23 6,522 3,471 716 557 1,211 12,476 23 37,960 17.18% 9.14% 1.88% 1.47% 3.19% 32.87%
24 6,312 3,470 1,701 500 1,495 13,477 24 37,766 16.71% 9.19% 4.50% 1.32% 3.96% 35.69%
25 6,633 3,527 1,800 548 1,402 13,909 25 37,818 17.54% 9.33% 4.76% 1.45% 3.71% 36.78%
26 6,942 3,414 1,637 548 1,494 14,034 26 37,621 18.45% 9.07% 4.35% 1.46% 3.97% 37.30%
27 5,752 3,742 2,647 548 1,403 14,091 27 37,810 15.21% 9.90% 7.00% 1.45% 3.71% 37.27%
28 5,950 3,591 2,068 545 1,380 13,534 28 37,817 15.73% 9.50% 5.47% 1.44% 3.65% 35.79%
29 5,856 3,233 2,495 630 1,285 13,498 29 37,664 15.55% 8.58% 6.62% 1.67% 3.41% 35.84%
30 5,322 3,629 2,158 700 1,531 13,340 30 37,638 14.14% 9.64% 5.73% 1.86% 4.07% 35.44%
31 7,020 3,661 2,198 442 1,305 14,625 31 37,967 18.49% 9.64% 5.79% 1.16% 3.44% 38.52%
32 4,862 3,774 2,899 577 1,407 13,518 32 37,978 12.80% 9.94% 7.63% 1.52% 3.70% 35.60%
33 4,919 3,847 2,006 626 1,487 12,884 33 39,209 12.54% 9.81% 5.11% 1.60% 3.79% 32.86%
34 5,038 3,884 1,690 452 1,282 12,344 34 39,121 12.88% 9.93% 4.32% 1.15% 3.28% 31.55%
35 5,462 4,144 2,608 506 1,091 13,812 35 39,202 13.93% 10.57% 6.65% 1.29% 2.78% 35.23%
36 5,497 4,404 2,094 524 1,309 13,827 36 38,991 14.10% 11.29% 5.37% 1.34% 3.36% 35.46%
37 6,241 4,468 1,249 197 1,935 14,089 37 38,841 16.07% 11.50% 3.21% 0.51% 4.98% 36.27%
38 6,268 4,692 44 121 1,635 12,760 38 39,306 15.95% 11.94% 0.11% 0.31% 4.16% 32.46%
39 5,741 4,608 33 203 1,393 11,978 39 39,250 14.63% 11.74% 0.08% 0.52% 3.55% 30.52%
40 4,987 5,428 77 82 1,235 11,808 40 39,232 12.71% 13.84% 0.20% 0.21% 3.15% 30.10%
41 5,347 4,849 919 22 1,469 12,606 41 38,980 13.72% 12.44% 2.36% 0.06% 3.77% 32.34%
42 5,864 4,374 1,316 46 1,687 13,286 42 38,816 15.11% 11.27% 3.39% 0.12% 4.35% 34.23%
43 5,690 4,217 697 2 1,967 12,572 43 38,999 14.59% 10.81% 1.79% 0.01% 5.04% 32.24%
44 6,344 4,168 625 33 1,735 12,904 44 39,070 16.24% 10.67% 1.60% 0.08% 4.44% 33.03%
45 6,070 4,293 929 55 1,973 13,320 45 39,319 15.44% 10.92% 2.36% 0.14% 5.02% 33.88%
46 6,668 3,869 1,199 59 2,185 13,979 46 39,334 16.95% 9.84% 3.05% 0.15% 5.56% 35.54%
47 7,407 3,808 1,138 99 1,750 14,202 47 39,534 18.74% 9.63% 2.88% 0.25% 4.43% 35.92%
48 6,556 3,662 1,794 33 1,763 13,807 48 39,918 16.42% 9.17% 4.49% 0.08% 4.42% 34.59%
49 6,986 3,113 3,265 62 1,591 15,017 49 39,926 17.50% 7.80% 8.18% 0.16% 3.98% 37.61%
TOTAL 293,153 175,220 80,591 20,422 71,902 641,288 TOTAL 1,862,139 15.74% 9.41% 4.33% 1.10% 3.86% 34.44%
2015/16 ABSTRACTION HOURS % of ROSTERED HOURS

Page 19 of 20
Appendix 4: Forecast Outturn Scenarios
£m £m £m £m Internal External
Deficit from Continuing Operations
M11 Finance Report FOT -2.285 -2.285
Normalised Deficit
M11 Finance Report FOT -2.839 -2.839
Potential Downsides
CCGs retain Transformation Funds - PAYMENT AGREED FEB 2016 0.000 Y
Dispatch Restructure not funded - NO CLAWBACK OF RESILIENCE 0.000 Y
EPCR - Potential IT set-up costs - INCLUDED IN FOT POSITION 0.000 Y
SEPSIS costs - INCLUDED IN FOT POSITION 0.000 Y
Commercial Dev't Contribution - REMOVED FROM FOT IN MONTH 9 0.000 Y
New VSS scheme approvals - 2 POTENTIAL NOW INCLUDED IN FOT 0.000 Y
Clawback of Resilience Underspend - Y/E AGREEMENT REACHED 0.000 Y
0.000
Potential Normalised Position Upsides
Proposed 'Capital to Revenue Transfer' - not approved by Monitor/DH 0.000 Y
Interim Head of HR leaves Dec 2015, saving now in FOT position 0.000 Y
Further pay expense reductions to year-end 0.083 Y
NSECH ECS income extended to Mar 2016, reported M7 but no longer assumed 0.000 Y
SEPSIS - training slippage into 2016-17 - NOW EXPECTED IN 15-16 0.000 Y
Successful Bernicia legal dispute outcome * - NOT ASSUMED IN 15-16 0.000 Y
* Assumed to be allowable normalised income, within 'Other Non-Operating Income' category 0.083
Adjusted Normalised Deficit Position -2.839 -2.756
Potential Asset Disposal Upside
Profit from sale of Fulbeck in 2015-16 reported M7, removed due to sale collapse 0.000 Y
Adjusted Deficit from Continuing Operations -2.285 -2.756
Cash:
Latest FOT Cash Balance, 31 March 2016 10.914 10.914
Cash impact of Scenarios* 0.000 0.083
Cash Balance carried forward 10.914 10.997
Memorandum Item:
Potential 2016-17 Downside Adjustment
Unfavourable Bernicia legal dispute outcome (worst case) -0.950
Finance Report Month 11, 2015-16 : Scenario-Adjusted FOT Position
Outturn
Worst Case
Outturn
Best Case
Primary Sphere
of Control

Page 20 of 20
Appendix 5: Report Abbreviations List & Glossary
Item First Appears
Description
NEAS par 1.1 North East Ambulance Service NHS Foundation Trust
YTD par 1.2 Year To Date
FOT par 1.3 Forecast Outturn
FSRR par 1.4 Financial Sustainability Risk Rating (from Monitor)
PTS par 2.2; bp 1 Patient Transport Service
ECR par 2.2; bp 1 Extra Contractual Referral – activity undertaken outside of contract
PTS Quotas par 2.2; bp 1 Activity quotas agreed with CCGs for new service locations, above which an ECR charge would have been levied prior to 2015-16
CCG par 2.2; bp 2 Clinical Commissioning Group
111 par 2.2; bp 2 Urgent telephone triage service managed within Contact Centre
ECS par 2.2; bp 5 Emergency Care Service
NSECH par 2.2; bp 5 Northumberland Specialist Emergency Care Hospital in Cramlington
TPP par 2.4 Third Party Providers – e.g. St. John, British Red Cross, commercial sector providers of transport resources
ICaT par 2.4 Integrated Care and Transport service development
VSS par 2.5 Voluntary Severance Scheme payments
CIP par 2.8 Cost Improvement Plans
EOL par 3.2..2 End Of Life
CC par 3.3..2 Contact Centre
CBS par 3.4..1 Commercial Business Services
EPCR par 3.5..2 Electronic Patient Care Record – replacement of current system
Hear & Treat par 3.7..2; bp 3 Calls to the 999 service that are triaged and do not lead to a disposition that requires an ambulance dispatch to an incident
MERIT par 3.7..2; bp 3 Medical Emergency Response & Intervention Team – a service since April 2015 providing physician support on scene at incidents of major trauma