Trust Board 30 January 2014 Public Section Paper ...€¦ · Public Section Paper Integrated...
50
Trust Board 30 th January 2014 Public Section Paper Integrated Quality & Performance Report Presented for: Information Presented by: Dr Mark Smith, Chief Operating Officer Author: Information Department Corporate objective: To achieve the best possible clinical outcomes for every patient, every time. To be the hospital of choice for patients and staff. To be a consistently high-performing and influential healthcare provider. To achieve academic excellence and expand the boundaries of healthcare. Key points This report is presented to ensure the Board remains up-to-date with the Trust‟s performance in light of national requirements and local developments. Information Agenda Item 24.1
Transcript of Trust Board 30 January 2014 Public Section Paper ...€¦ · Public Section Paper Integrated...

Trust Board 30th January 2014
Public Section Paper
Integrated Quality & Performance Report
Presented for: Information
Presented by: Dr Mark Smith, Chief Operating Officer
Author: Information Department
Corporate objective: To achieve the best possible clinical outcomes for every patient, every time. To be the hospital of choice for patients and staff. To be a consistently high-performing and influential healthcare provider. To achieve academic excellence and expand the boundaries of healthcare.
Key points
This report is presented to ensure the Board remains up-to-date
with the Trust‟s performance in light of national requirements and
local developments.
Information
Agenda Item 24.1

THE LEEDS TEACHING HOSPITALS NHS TRUST
TRUST BOARD MEETING – JANUARY 2014
INTEGRATED QUALITY &
PERFORMANCE REPORT
PERIOD – DECEMBER 2013
Contents
Overview of Performance ............................................................................................................. 1
Summary ...................................................................................................................................... 2
AF Quality and Governance Dashboard ............................................................................ 3
Shadow Monitor Risk Assessment Framework ................................................................. 5
Narrative ...................................................................................................................................... 6
Referral To Treatment (RTT) ............................................................................................. 6
RTT Clearance Times ....................................................................................................... 8
Diagnostic Waits ................................................................................................................ 9
Cancelled Operations ...................................................................................................... 10
A&E Waiting Times (4 Hours) .......................................................................................... 11
A&E Measures ................................................................................................................ 12
Ambulance Handovers .................................................................................................... 14
Cancer 62 Days ............................................................................................................... 15
Cancer 31 Days ............................................................................................................... 17
Cancer 2 Week Wait ........................................................................................................ 18
Stroke Care ..................................................................................................................... 19
30 Day Emergency Readmissions................................................................................... 20
Outpatient Activity - New and Review.............................................................................. 21
Inpatient Activity - Elective and Non-elective ................................................................... 22
Length of Stay ................................................................................................................. 23
Flu Vaccinations .............................................................................................................. 24
Incidence of MRSA .......................................................................................................... 25
MRSA Screening ............................................................................................................. 26
Incidence of CDI .............................................................................................................. 27
Summary Hospital Mortality Index (SHMI) ....................................................................... 28
Hospital Standardised Mortality Rate (HSMR) ................................................................ 29

VTE Risk Assessment ..................................................................................................... 30
Never Events ................................................................................................................... 31
Harm Free Care............................................................................................................... 32
Pressure Ulcers ............................................................................................................... 33
Complaints ...................................................................................................................... 34
Patient Satisfaction – Friends & Family ........................................................................... 35
Outpatient Measures ....................................................................................................... 36
Choose and Book (CAB) - ASIs ...................................................................................... 38
CAB - Utilisation .............................................................................................................. 39
Workforce ........................................................................................................................ 40
Finance ...................................................................................................................................... 41
AF Finance Dashboard .................................................................................................... 41
Finance - In-Year Financial Delivery Indicators ............................................................... 42
Finance - Progress Towards Foundation Trust Status .................................................... 42
Internal Indicators Dashboard .................................................................................................... 43
Appendix 1 - Updates................................................................................................................. 45
Appendix 2 - Peer Groups .......................................................................................................... 46
Appendix 3 - Glossary ................................................................................................................ 47

Page 1 of 47
Overview of Performance
Overview:
The IQPR has been developed to include all measures contained within the NHS Trust Development Authority‟s (TDA) Accountability Framework (AF) and Monitor‟s Risk Assessment Framework (RAF) Service Performance Score. The latest performance against national and local CQUIN (Commissioning for Quality & Innovation) requirements, local contract quality requirements and key internal measures are also reported where appropriate.
In time, Trusts will be rated monthly against the 3 domains within the AF‟s Oversight Model (Quality & Governance, Finance and Delivering Sustainability). The methodology for rating overall performance as well as the detail behind the definition and thresholds for acceptable performance for a number of these metrics has yet to be confirmed by the TDA. The TDA has, however, intimated it will soon begin publishing the Oversight Model.
Access:
Trust level performance against the target for non-admitted patients treated within 18 weeks of referral was restored in December, having dipped below standard the previous month. The recovery trajectory for patients admitted to hospital within 18 weeks projects through to January 2014.
Capacity constraints and late referrals from other providers continue to impact on the Trust‟s ability to maintain the 62 day standard for urgent GP referral to cancer treatment. Performance in November was below standard for three of the cancer standards: 2 week wait for suspected cancer, 2 week wait for breast symptoms and 62 days from urgent GP referral to cancer treatment.
Outcomes:
The Trust has not had an MRSA case since September 2013. In addition, Trust level performance against the requirement to screen 95% of eligible patients for MRSA was restored in November and December, having fallen below standard in the previous two months.
There were 13 cases of C. difficile Infections (CDIs) at the Trust in December. Year-to-December there were 114 CDIs against the goal of no more than 101 for the full year.
The Trust achieved the „Safety Thermometer‟ (snapshot) measure in December for the sixth consecutive month.
Quality Governance:
The response rate for patients completing the Friends and Family Test remains above target at 21.2% in December. However, there are considerable differences between responses from inpatients and maternity patients (34.1% and 36.9% respectively) and A&E patients (5.7%).
The Friends and Family Test was rolled out in text message format to A&E attenders on the 1st January in an effort to address the poor response rate in this area.

Page 2 of 47
Indicator Group Group Description
National Indicators / Quality Requirements Indicators are included from the AF, which is used by the TDA to monitor the performance of non-Foundation Trusts (FTs), as well as Monitor‟s RAF Service Performance Score (this will be in shadow form until the Trust becomes an FT). These are national targets Trusts must achieve and incorporate indicators measuring access, quality, outcomes and finance. These include the MRSA and C. difficile (CDI) objective, A&E waiting times, referral to treatment (RTT) and cancer waits, patient experience and risk assessments of venous thromboembolism (VTE).
CQUIN Indicators
National and local CQUINs indicators are incorporated; these include indicators around the Safety Thermometer, dementia and patient discharge. The CQUIN summary dashboard is included on a quarterly basis.
Local Contractual Indicators Data indicators that form part of the Trust‟s Contract agreement with the Clinical Commissioning Groups (CCG).
Internal Indicators Internal indicators are metrics that are key to the Trust‟s success, that have not been incorporated previously. These include further information around RTT on clearance times, stroke care, inpatient and outpatient activity, and research and innovation (R&I) indicators.
Leeds Teaching Hospitals Trust (LTHT) Summary
This report covers national performance measures from the Trust Development Authority‟s (TDA) Accountability Framework (AF) and Monitor‟s Service Performance Score (part of the RAF). Relevant CQUIN indicators which are not already incorporated within the National Indicators are also included on a quarterly basis, as well as selected local contractual indicators and additional internal metrics. Updates from regulators are included in Appendix 1. (Please note this report is a work in progress, and there is not therefore a section for all indicators).

Page 3 of 47
AF Quality and Governance Dashboard
Category Indicator Oct-13 Nov-13 Dec-13 YTD
Referral to treatment within 18 weeks - admitted > 90% 86.0% 85.0% 87.3% 85.0%
Referral to treatment within 18 weeks - non-admitted > 95% 96.6% 94.4% 95.4% 95.1%
Referral to treatment within 18 weeks - incomplete > 92% 94.9% 94.4% 94.1% n/app
Referral to treatment within 18 weeks - over 52 week waiters (incomplete waits) 0 0 0 n/app
Diagnostic waits within 6 weeks > 99% 99.5% 99.5% 99.6% n/app
Last minute cancelled operations not re-booked within 28 days
Urgent operations cancelled for the second time 0 0Reported a month
in arrears0
A&E 4 hour > 95% 97.8% 97.2% 97.1% 96.6%
Cancer 62 days - GP referral > 85% 85.6% 77.9% 84.3%
Cancer 62 days - referral from screening service > 90% 91.8% 96.7% 95.9%
Cancer 31 days - first treatment > 96% 98.0% 97.7% 97.4%
Cancer 31 days - second or subsequent surgery > 94% 98.3% 97.8% 97.4%
Cancer 31 days - second or subsequent drug treatment > 98% 100.0% 100.0% 100.0%
Cancer 31 days - second or subsequent radiotherapy > 94% 99.6% 95.1% 98.9%
Cancer 2 week wait - suspected cancer > 93% 92.6% 92.3% 93.9%
Cancer 2 week wait - breast symptoms > 93% 95.0% 86.6% 91.9%
30 day emergency readmissions (Elective & non-elective) < 10.9% 6.6% 6.5%Reported a month
in arrears6.8%
Incidence of MRSA 0 0 0 5YTD: < 79
13/14: < 101
Medication errors causing serious harm - Number 0 0Reported a month
in arrears2
Harm free care (pressure sores, falls, CUTI and VTE) - Safety Thermometer (Snapshot) > 92% 92.5% 92.3% 93.2% n/app
Serious incidents - Number 3 3 4 26
Serious incidents - Rate per 1,000 bed days < 1.23 0.06 0.06 0.08 0.06
Never events 0 1 0 5
E. Coli cases 46 45 48 435
E. Coli cases - Rate per 100,000 bed days 3 < 94.9 87.2 87.7 93.4 94.0
MSSA cases - Rate per 100,000 bed days 3 < 9.02 3.8 17.5 1.9 9.9
Maternal deaths 0 0Reported a month
in arrears1
Summary Hospital-level Mortality Indicator (SHMI)
Hospital Standardised Mortality Ratio (HSMR) (2012/13 rebased)
Venous thromboembolism (VTE) risk assessment > 95% 96.2% 95.5%Reported a month
in arrears95.7%
Q1 > 15%
By Q4 > 20%
Nurse: bed ratio 5 1.90 : 1 1.94 : 1 - n/app
% of nurses registered nurses > 60% 69.6% 70.9% 71.1% -
Mixed sex accommodation 0 0 0 0
Apr 12-Mar 13: 92.8
National Indicators / Quality Requirements - AF Quality and Governance
TDA Thresholds
Acce
ss M
etr
ics
0
0
Reported a month
in arrears
18.2%
Ou
tco
me
s M
etr
ics
National Ave: 100
0
Incidence of C. Difficile
0
0
13/14: < 1
13 11414 14
n/app
n/app
20.8% 19.6%
National Ave: 100
Apr 12-Mar 13: 94 (Published Oct 13)
0.1 : 1 to 4.4 : 1
Q2: 7.4%0%
0
Qu
ality
Go
ve
rna
nce
Ind
ica
tors Patient satisfaction (friends and family) - Response rate¹ 20.6%
6

Page 4 of 47
Indicators Awaiting Clarification:
Category Indicator Oct-13 Nov-13 Dec-13 YTD
Warning notice None None None None
Civil and/or criminal action None None None None
Admissions of fullterm babies to neonatal care 2.2% 2.3% 2.7% 3.2%
YTD: < 42
13/14: < 60
C-section rates (Emergency and Elective LSCS) 18.1% 20.6%Reported a month
in arrears20.2%
Open CAS Alerts (Exceeding the deadline for action) 4 7 5 6 n/app
WHO surgical checklist compliance 95.5% 97.5% 97.6% n/app
3rd
Pa
rty
Re
po
rts
Any relevant report including safeguarding alerts, serious case reviews, ad hoc reports from MPs,
GMS, Ombudsman, Commissioners, litigation etc.
Patient satisfaction (friends and family) - Net Promoter Score (DH) ¹ 67.5 70.3 70.0 70.0
Patient and carer voice
Board turnover (12 months rolling average) 50.2% 50.5% 50.5% n/app
Sickness/absence rate (12 months rolling average) 4.3% 4.2% 4.2% n/app
Proportion temporary staff – clinical and non-clinical 8.3% 7.5% 7.4% n/app
Staff turnover (12 months rolling average) 10.4% 10.6% 10.8% n/app
Complaints - Rate per 10,000 occupied bed days 3 15.7 15.4 12.1 17.3
% staff appraised 47.7% 44.0% 49.9% n/app
1
2 Trajectory agreed with Clinical Commissioning Group (CCG).3
4
5
6
7
National Indicators / Quality Requirements - AF Quality and Governance
TDA Thresholds
CQ
C
Co
nce
rns
TBC
TBC
Meticillin Sensitive Staphylococcus Aureus (MSSA) cases
n/app
469 1
These figures show the number of full time equivalent (FTE) registered nurses (including midwives) as a proportion of all FTE nurses employed by the Trust at the end of each month.
TBC
For adult inpatients, A&E attenders and, from October 13, Maternity services.
Rate based on internal monthly overnight bed occupancy data.
Threshold not yet published by the TDA (although anticipated to be 0).
Figures shown for are based on snapshots of number of registered nurses (FTE) (excluding midwives) against the average number of available overnight General & Acute beds as reported in the
latest KH03 quarterly return.
n/app
TBC
Qu
ality
Go
ve
rna
nce
Ind
ica
tors
TBC
TBC
TBC
TBC
TBC
TBC
TBC
TBC
TBC
2
TBC
Percentage of staff who have an in date appraisal at month end.
Ou
tco
me
s M
etr
ics
2
7

Page 5 of 47
Shadow Monitor Risk Assessment Framework
Qrt 1 Qrt 2 Qrt 3
A&E Waiting Times (4 hours) - LTHT (including Wharfedale) *1 94.6% 97.9% 97.4%
Patients treated within 18 weeks - admitted (%) *2 84.5% 84.4% 86.1%
Patients treated within 18 weeks - non-admitted (%) *2 95.0% 94.7% 95.5%
Patients awaiting treatment on the 18 weeks pathway - incomplete (%) *2 94.4% 94.9% 94.1%
Cancer 2 week wait - suspected cancer 95.9% 93.0% 92.5%
Cancer 2 week wait - breast symptoms (cancer not initially suspected) 94.4% 89.9% 90.9%
Cancer 31 Day Waits - first definitive treatment 97.8% 96.7% 97.9%
Cancer 31 Day Waits - subsequent surgery treatment 96.6% 97.9% 98.0%
Cancer 31 Day Waits - subsequent anti-cancer drug regime treatment 99.8% 100% 100%
Cancer 31 Day Waits - subsequent radiotherapy treatment course 99.0% 99.6% 97.7%
Cancer 62 Day Waits - GP/Dentist referrals 85.1% 85.2% 81.8%
Cancer 62 Day Waits - cancer screening service referrals 98.0% 95.3% 94.3%
Q1 < 25 *3
51
76
Full year < 101
Compliance with requirements regarding access to healthcare for people with
learning disabilities (6 criteria)
Compliant on all 6
criteria
Compliant on all 6
criteria
Compliant on all 6
criteria
3.0 3.0 4.0 4.0 4.0 4.0 4.0 4.0
*1
*2
*3
Weighted
score
A&E: 1 Jul to 29 Sep-13
CDI: Apr to Sep-13
RTT Incomplete:
As at 30 Sep-13
Other: Jul to Sep-13
0.0
1.0
1.0
0.0
1.0
0.0
0.0
Projected
Weighted
score
Qrt 4
95%
Weighted
score
A&E: 30 Sep to 29 Dec-13
CDI: Apr to Dec-13
RTT Incomplete:
As at 31 Dec-13
Cancer: Oct to Nov-13
Other: Oct to Dec-13
1.0 0.0
Performance Indicator
National Indicators / Quality Requirements - Shadow Monitor Risk Assessment Framework (RAF) - Service Performance ScoreA
cce
ss M
etr
ics
92% 0.0
0.0
1.0
0.0
0.0
1.0
0.0
0.0
1.0
0.0
1.0
0.0
0.0
0.0
1.0
1.0
0.0
1.0
0.0
0.0
4.0
1.0
3.0
0.01.0
114 1.0 1.073
0.0
1.0
0.0
4.0
94%
90%1.0
0.0
Green
Risk Rating
93%1.0
93%
96%
Self certification
85%
94%
98%
0.0
General Notes
Failure to achieve any of the indicators with a weighting of 1 for three or more consecutive quarters may result in Monitor applying a governance concern and escalating the Trust for consideration as to whether it is in significant breach of its
Foundation Trust authorisation.
The CDI threshold used by Monitor is the greater of either: (a) a simple proportioning of the annual threshold (i.e. 25% of annual threshold at Q1, 50% at Q2 and 75% at Q3) or (b) 12 CDI cases.
A&E performance is derived from the weekly SITREP return figures. It should therefore be noted that the monthly and quarterly figures reported do not map directly to calendar months or quarters. Failure to meet this standard for any two quarters during the previous 12
month period and failing the indicator again during the subsequent 9 month period or full year may trigger a governance concern.
Whilst the RAF monitors performance quarterly, any monthly failure of the RTT standards must be reported to Monitor and represents a failure of that indicator for the quarter.
Weighted
score
2013/14
Thresholds
Red
0.095%
90%
Weighting
A&E: 1 Apr to 30 Jun-13
RTT Incomplete:
As at 30 Jun-13
Other: Apr to Jun-13
1.0
0.0
4.0
1.0
1.0
1.0
1.0
Ou
tco
me
s
Ma
tric
s
Rating Criteria
Service Performance Score
< 4.0
> 4.0
CDI 1.0 41 1.0YTD (@ Q2) <
YTD (@ Q3) <

Page 6 of 47
Narrative
Referral To Treatment (RTT) Admitted Non-Admitted Incomplete Admitted Non-Admitted
> 90% > 95% > 92% > 90% > 95%
99.1% 99.9% 100.0% 98.5% 99.4%
97.6% 96.4% 98.1% 85.4% 95.0%
91.4% 84.5% 84.8% 59.8% 94.0%
79.3% 95.6% 97.2% 76.2% 94.1%
0.0% 100.0% 100.0% 100.0% 100.0%
95.3% 91.1% 81.7% 94.7% 94.5%
0.0% 100.0% 100.0% 100.0% 100.0%
84.9% 97.1% 94.7% 86.4% 95.0%
92.5% 98.2% 99.5% 89.6% 98.8%
100.0% 99.0% 100.0% 98.4% 98.0%
81.8% 92.5% 98.1% 66.8% 83.0%
98.5% 98.1% 99.6% 96.0% 96.1%
94.7% 95.3% 97.7% 96.2% 96.2%
81.0% 78.8% 79.2% 82.7% 84.1%
100.0% 99.2% 100.0% 100.0% 99.9%
100.0% 97.5% 99.4% 100.0% 99.6%
89.6% 81.2% 91.8% 84.2% 85.0%
85.6% 97.0% 94.8% 79.7% 91.7%
74.1% 96.1% 93.9% 72.6% 94.1%
87.3% 95.4% 94.1% 85.0% 95.1%Trust
Target
Oral Surgery
Other Specialties
Plastic Surgery
Respiratory Medicine
Rheumatology
Trauma & Orthopaedic
Gastroenterology
General Medicine
Gynaecology
Neurology
Neurosurgery
Ophthalmology
General Surgery
Urology
Cardiology
Cardiothoracic Surgery
Dermatology
Ear Nose & Throat
Elderly Medicine
Dec-13RTT Reporting Specialties
YTD
National Indicator / Quality Requirement
Aims:
Ensure at least 90% of admitted patients are treated within 18 weeks of referral.
Ensure at least 95% of non-admitted patients are treated within 18 weeks of referral.
Ensure a minimum of 92% of patients on an incomplete pathway have been waiting no more than 18 weeks.
Ensure no patients wait over 52 weeks from referral to treatment. Owner: Chief Operating Officer and Clinical Directors. Consequence of failure: Patient experience, timely access to treatment, quality of care, reputation & financial penalty.
Appendix 2 lists the peer Trusts included in the benchmarking graphs. Four additional providers have been added to the Trust‟s RTT peer group.
Actions:
Admitted: The Trust remains non-compliant with the admitted RTT target due to the focus on over 18 week admitted backlog clearance, as agreed with the TDA. Although the Trust has slipped against this agreed trajectory, recovery plans have been put in place to ensure the trsut gets back on to a sustainable trajectory. Further modelling work is underway to to confirm a new trajectory.Non-admitted: The non-admitted target was failed in November due to the cancellation of a number of Dermatology clinics to accommodate registrar training. Performance is now back on to the expected trajectory.
70%
75%
80%
85%
90%
95%
100%
Ap
r-12
Ma
y-1
2
Ju
n-1
2
Ju
l-1
2
Au
g-1
2
Se
p-1
2
Oct-
12
Nov
-12
Dec
-12
Ja
n-1
3
Fe
b-1
3
Ma
r-13
Ap
r-13
Ma
y-1
3
Ju
n-1
3
Ju
l-1
3
Au
g-1
3
Se
p-1
3
Oct-
13
Nov-1
3
Dec
-13
Ja
n-1
4
Fe
b-1
4
Ma
r-14
% o
f pa
tien
ts m
ee
ting
targ
et
% of Admitted Patients Seen within 18 Weeks
% Admitted Achieve Fail Trajectory
65%
70%
75%
80%
85%
90%
95%
100%
% o
f p
atie
nts
me
etin
g ta
rge
t
Trusts
% of Admitted Patients Seen Within 18 Weeks - April to November 2013
LTHT Peers Other Trusts Target
Source: NHS England

Page 7 of 47
Referral To Treatment (RTT) (Continued)
70%
75%
80%
85%
90%
95%
100%
Ap
r-12
Ma
y-1
2
Ju
n-1
2
Ju
l-1
2
Au
g-1
2
Se
p-1
2
Oct-
12
Nov-1
2
Dec-1
2
Ja
n-1
3
Fe
b-1
3
Ma
r-13
Ap
r-13
Ma
y-1
3
Ju
n-1
3
Ju
l-1
3
Au
g-1
3
Se
p-1
3
Oct-
13
Nov-1
3
Dec-1
3
% o
f p
atie
nts
me
etin
g ta
rge
t
% of Non-Admitted Patients Seen within 18 weeks
% Non-Admitted Achieve Fail
70%
75%
80%
85%
90%
95%
100%
Ap
r-12
Ma
y-1
2
Ju
n-1
2
Ju
l-1
2
Au
g-1
2
Se
p-1
2
Oct-
12
Nov-1
2
Dec-1
2
Ja
n-1
3
Fe
b-1
3
Ma
r-13
Ap
r-13
Ma
y-1
3
Ju
n-1
3
Ju
l-1
3
Au
g-1
3
Se
p-1
3
Oct-
13
Nov-1
3
Dec-1
3
% o
f p
atie
nts
me
etin
g ta
rge
t
% Incomplete Achieve Fail
% of Patients on an Incomplete Pathway Waiting no more than 18 Weeks
0
5
10
15
20
25
Ap
r-12
Ma
y-1
2
Ju
n-1
2
Ju
l-1
2
Au
g-1
2
Se
p-1
2
Oct-
12
Nov-1
2
Dec-1
2
Ja
n-1
3
Fe
b-1
3
Ma
r-13
Ap
r-13
Ma
y-1
3
Ju
n-1
3
Ju
l-1
3
Au
g-1
3
Se
p-1
3
Oct-
13
Nov-1
3
Dec-1
3
No
. o
f p
atie
nts
Number of Patients Waiting Over 52 Weeks - Incomplete(As at month end)
70%
75%
80%
85%
90%
95%
100%
% o
f p
atie
nts
me
etin
g ta
rge
t
Trusts
LTHT Peers Other Trusts Target
Source: NHS England
% of Non-Admitted Patients Seen Within 18 Weeks - April to November 2013
70%
75%
80%
85%
90%
95%
100%
% o
f p
atie
nts
me
etin
g ta
rge
t
Trusts
LTHT Peers Other Trusts Target
% of Patients on an Incomplete Pathway Waiting no More Than 18 Weeks - November 2013
Source: NHS England

Page 8 of 47
RTT Clearance Times Total Clearance
Times
>18 wk
Clearance times
Incompletes
>18wks
8 Wks 0.5 Wks -
16.6 0.0 0.0%
8.2 0.2 3.0%
10.3 1.0 9.6%
6.8 0.6 9.4%
- - -
24.1 2.1 8.9%
- - 0.0%
10.1 1.0 10.1%
9.8 0.3 2.9%
4.3 0.0 0.0%
7.4 0.7 9.3%
7.4 0.1 1.0%
8.3 0.7 8.2%
7.8 2.6 33.2%
1.2 0.0 0.0%
9.6 0.0 0.0%
10.8 0.8 7.2%
15.2 1.4 9.0%
11.0 1.7 15.5%
10.2 1.0 9.9%
General Medicine
Target
General Surgery
Cardiology
Cardiothoracic Surgery
Dermatology
Ear Nose & Throat
Elderly Medicine
Gastroenterology
RTT Reporting Specialties
Dec-13
Trust
Gynaecology
Neurology
Neurosurgery
Ophthalmology
Oral Surgery
Other Specialties
Plastic Surgery
Respiratory Medicine
Rheumatology
Trauma & Orthopaedic Surgery
Urology
Internal Indicator
Aims:
RTT clearance times aim to indicate how long, in weeks, it would take to clear current patients on incomplete pathways assuming that no new patients are added to the list. Although this is not a national target, a total clearance time of 8 weeks and an over 18 weeks clearance time of 0.5 weeks is deemed to indicate a sustainable waiting list according to the Department of Health (DH).
Reduce the number of patients waiting over 18 weeks at month-end (incomplete admitted) to 714 by the end of March 2014.
Owner: Chief Operating Officer and Clinical Directors. Consequence of failure: Patient experience, timely access to treatment, quality of care, reputation & financial penalty.
Actions:
Total: Total clearance times for RTT have been reduced from 12.3 weeks in September to 10.2 weeks in December, but are not yet at the 8 week target. Recovery plans are in place with teams to accelerate the RTT backlog removal and waiting times to support delivery of this internal standard. Over 18 weeks: The Trust continues to clear the patient backlog of those waiting over 18 weeks (917 at the end of December against a trajectory of 986). Slippage against agreed trajectories has been reviewed and formal recovery plans put in place in key areas. There were 11 failing specialties in November (not 8 as planned); however, this has been reduced to 7 for December.
0
2
4
6
8
10
12
14
16
18
Ap
r-12
Ma
y-1
2
Ju
n-1
2
Ju
l-1
2
Au
g-1
2
Se
p-1
2
Oct-
12
Nov-1
2
Dec-1
2
Ja
n-1
3
Fe
b-1
3
Ma
r-13
Ap
r-13
Ma
y-1
3
Ju
n-1
3
Ju
l-1
3
Au
g-1
3
Se
p-1
3
Oct-
13
Nov-1
3
Dec-1
3
Cle
ara
nce
Tim
es
Referral to Treatment - Clearance Times
Total Clearance Times >18 wk Clearance Times
Total Clearance Times Target >18 wk Clearance Times Target
0
200
400
600
800
1,000
1,200
1,400
1,600
1,800
2,000
Ma
y-1
2
Ju
n-1
2
Ju
l-1
2
Au
g-1
2
Se
p-1
2
Oct-
12
Nov-1
2
Dec-1
2
Ja
n-1
3
Fe
b-1
3
Ma
r-13
Ap
r-13
Ma
y-1
3
Ju
n-1
3
Ju
l-1
3
Au
g-1
3
Se
p-1
3
Oct-
13
Nov-1
3
Dec-1
3
Ja
n-1
4
Fe
b-1
4
Ma
r-14
No
. o
f P
atie
nts
Patients Waiting Over 18 Weeks at Month-End (Incomplete) - Admitted
No. of Patients Trajectory
0
500
1,000
1,500
2,000
2,500
3,000
3,500
4,000
4,500
5,000
0 3 6 9 12 15 18 21 24 27 30 33 36 39 42 45 48 51
No
. o
f P
atie
nts
Weeks Waiting
Number of Patients Waiting on an Incomplete Pathway - By Timeband December 2013 (As at month end)

Page 9 of 47
Diagnostic Waits Number of
Patients on
Waiting List
Number
Waiting over 6
Weeks
% Waiting
Less Than 6
Weeks
Target - - 99%
Audiology - Audiology Assessments 5 1 80.0%
Barium Enema 2 0 100.0%
Cardiology - echocardiography 761 0 100.0%
Cardiology - electrophysiology 2 0 100.0%
Colonoscopy 557 18 96.8%
Computed Tomography 1,131 0 100.0%
Cystoscopy 297 0 100.0%
DEXA Scan 515 0 100.0%
Flexi sigmoidoscopy 301 3 99.0%
Gastroscopy 587 16 97.3%
Magnetic Resonance Imaging 1,944 1 99.9%
Neurophysiology - peripheral neurophysiology 1 0 100.0%
Non-obstetric ultrasound 4,751 0 100.0%
Respiratory physiology - sleep studies 122 0 100.0%
Urodynamics - pressures & flows 0 0 -
Trust 10,976 39 99.6%
Diagnostic Test
Waiting List Position As at 31/12/2013
National Indicator / Quality Requirement
Aim: Ensure at least 99% of patients wait no more than 6 weeks for a diagnostic test. Owner: Chief Operating Officer and CSU Clinical Directors. Consequence of failure: Patient experience, timely access to treatment, quality of care, reputation & financial penalty.
Appendix 2 lists the peer Trusts included in the benchmarking graphs.
Actions:
Additional in-house capacity available 6th January 2014.
Identify additional capacity from the independent sector.
90%
92%
94%
96%
98%
100%
Ap
r-12
Ma
y-1
2
Ju
n-1
2
Ju
l-1
2
Au
g-1
2
Se
p-1
2
Oct-
12
Nov-1
2
Dec-1
2
Ja
n-1
3
Fe
b-1
3
Ma
r-13
Ap
r-13
Ma
y-1
3
Ju
n-1
3
Ju
l-1
3
Au
g-1
3
Se
p-1
3
Oct-
13
Nov-1
3
Dec-1
3
% P
atie
nts
Wa
itin
g L
ess T
ha
n 6
we
eks
% Within 6 Weeks Target
Diagnostic Waits - % Patients Waiting Less Than 6 Weeks at Month-End
0
2,000
4,000
6,000
8,000
10,000
12,000
14,000A
pr-
12
Ma
y-1
2
Ju
n-1
2
Ju
l-1
2
Au
g-1
2
Se
p-1
2
Oct-
12
Nov-1
2
Dec-1
2
Ja
n-1
3
Fe
b-1
3
Ma
r-13
Ap
r-13
Ma
y-1
3
Ju
n-1
3
Ju
l-1
3
Au
g-1
3
Se
p-1
3
Oct-
13
Nov-1
3
Dec-1
3
No
. o
f p
atie
nts
wa
itin
g
Diagnostic Waits - Number of Patients Waiting for a Diagnostic Test at Month-End
70%
75%
80%
85%
90%
95%
100%
% P
atie
nts
Wa
itin
g L
ess T
ha
n 6
we
eks
Trusts
LTHT Peers Other Trusts Target
Source: NHS England
Diagnostic Waits - % Patients Waiting Less Than 6 Weeks at Month-EndNovember 2013

Page 10 of 47
Cancelled Operations
0%
2%
4%
6%
8%
10%
12%
14%
16%
Q1 Q2 Q3 Q4 Q1 Q2
% la
st m
inu
te c
an
ce
lla
tio
ns
% of Last Minute Cancelled Operations for Non-Clinical Reasons
2012/13 2013/14
National Indicator / Quality Requirement
Internal Indicator
Aims:
Ensure all patients who have operations cancelled at the last minute, for non-clinical reasons are offered another binding date to be treated within a maximum of 28 days.
Ensure no patient has their urgent operation cancelled for a second time. Owner: Chief Operating Officer and CSU Clinical Directors. Consequence of failure: Patient experience, clinical outcomes, timely access to treatment, reputation & financial penalties.
Appendix 2 lists the peer Trusts included in the benchmarking graph. Actions:
Focus continues on removing this type of breach, although critical care bed issues have continued into Q3. Processes have been put in place to enhance planning of critical care capacity and timely escalation.
Cancelled operations breaches undergo a root cause analysis investigation at CSU level, with formally reported performance against this measure expected to improve in Q3 against the Q2 position (data currently not yet formally reported).
0%
2%
4%
6%
8%
10%
12%
14%
16%
Q1 Q2 Q3 Q4 Q1 Q2
% p
atie
nts
bre
ach
ing
targ
et
Patients Cancelled at Last Minute for Non-Clinical Reasons: % Not Treated Within 28 Days
% 28 Day Breaches Achieve Fail
2012/13 2013/14
0%
10%
20%
30%
40%
50%
60%
70%
80%
90%
% p
atie
nts
bre
ach
ing
targ
et
Trusts
% Patients Not Treated Within 28 Days of Last Minute Cancellation for Non-Clinical Reasons - Q2 2013-14
LTHT Peers Other Trusts
Source: NHS England(NB: 74 Trusts reported no breaches, including 4 peer Trusts)
Page 11 of 47
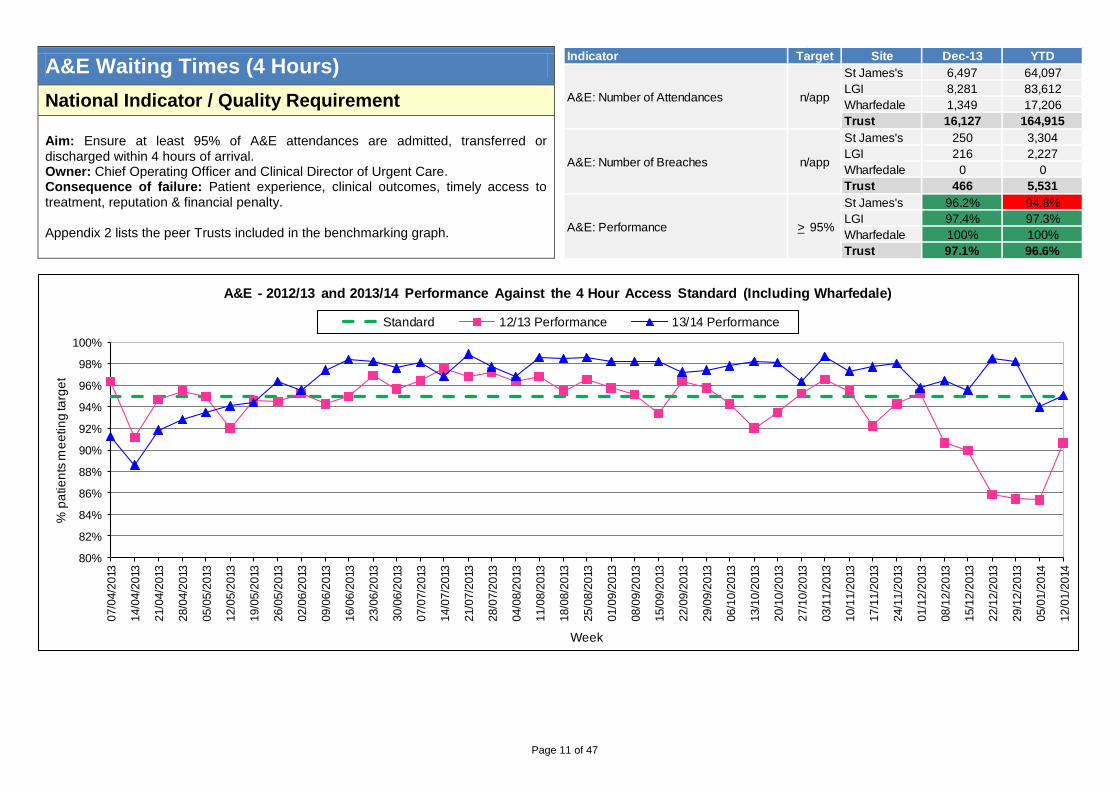
A&E Waiting Times (4 Hours) Indicator Site Dec-13 YTD
St James's 6,497 64,097
LGI 8,281 83,612
Wharfedale 1,349 17,206
Trust 16,127 164,915
St James's 250 3,304
LGI 216 2,227
Wharfedale 0 0
Trust 466 5,531
St James's 96.2% 94.8%
LGI 97.4% 97.3%
Wharfedale 100% 100%
Trust 97.1% 96.6%
Target
A&E: Number of Attendances n/app
A&E: Performance > 95%
A&E: Number of Breaches n/app
National Indicator / Quality Requirement
Aim: Ensure at least 95% of A&E attendances are admitted, transferred or discharged within 4 hours of arrival. Owner: Chief Operating Officer and Clinical Director of Urgent Care. Consequence of failure: Patient experience, clinical outcomes, timely access to treatment, reputation & financial penalty.
Appendix 2 lists the peer Trusts included in the benchmarking graph.
80%
82%
84%
86%
88%
90%
92%
94%
96%
98%
100%
07/0
4/2
013
14/0
4/2
013
21/0
4/2
013
28/0
4/2
013
05/0
5/2
013
12/0
5/2
013
19/0
5/2
013
26/0
5/2
013
02/0
6/2
013
09/0
6/2
013
16/0
6/2
013
23/0
6/2
013
30/0
6/2
013
07/0
7/2
013
14/0
7/2
013
21/0
7/2
013
28/0
7/2
013
04/0
8/2
013
11/0
8/2
013
18/0
8/2
013
25/0
8/2
013
01/0
9/2
013
08/0
9/2
013
15/0
9/2
013
22/0
9/2
013
29/0
9/2
013
06/1
0/2
013
13/1
0/2
013
20/1
0/2
013
27/1
0/2
013
03/1
1/2
013
10/1
1/2
013
17/1
1/2
013
24/1
1/2
013
01/1
2/2
013
08/1
2/2
013
15/1
2/2
013
22/1
2/2
013
29/1
2/2
013
05/0
1/2
014
12/0
1/2
014
% p
atie
nts
me
etin
g ta
rge
t
Week
A&E - 2012/13 and 2013/14 Performance Against the 4 Hour Access Standard (Including Wharfedale)
Standard 12/13 Performance 13/14 Performance

Page 12 of 47
A&E Measures Indicator Site Dec-13 YTD
St James's 0 0
LGI 0 0
Trust 0 0
St James's 14 14
LGI 17 17
Trust 16 16
St James's 92 87
LGI 68 71
Trust 78 78
St James's 9.3% 9.9%
LGI 7.2% 6.4%
Trust 8.1% 7.9%
St James's 3.6% 4.2%
LGI 2.6% 2.7%
Trust 3.0% 3.4%
0
Target
A&E: % Unplanned Re-
Attendances Within 7 Days
A&E: % Patients Leaving A&E
Unseen
< 15
< 60
A&E: Time to Assessment
(95th Percentile)
A&E: Time to Treatment
(median)
< 5%
< 5%
A&E: Number of Trolley Waits
Greater Than 12 HoursLocal Contractual Indicator
Internal Indicator
Aims:
Ensure there are no A&E trolley waits greater than 12 hours.
Ensure 95th percentile for time of arrival at A&E to initial full assessment is no more than 15 minutes.
Ensure the median time spent from arrival at A&E to treatment is no more than 60 minutes.
Ensure the percentage of unplanned re-attendances within 7 days of discharge from A&E is no more than 5%.
Ensure percentage of patients who leave A&E without being seen is no more than 5%.
Owner: Chief Operating Officer and Clinical Director of Urgent Care. Consequence of failure: Patient experience, clinical outcomes, timely access to treatment, reputation & financial penalty.
0
5
10
15
20
25
Ap
r-12
Ma
y-1
2
Ju
n-1
2
Ju
l-1
2
Au
g-1
2
Se
p-1
2
Oct-
12
Nov-1
2
Dec-1
2
Ja
n-1
3
Fe
b-1
3
Ma
r-13
Ap
r-13
Ma
y-1
3
Ju
n-1
3
Ju
l-1
3
Au
g-1
3
Se
p-1
3
Oct-
13
Nov-1
3
Dec-1
3
Tim
e to
Asse
ssm
en
t (m
ins)
A&E - Time To Assessment - 95th Percentile
Time To Assessment - 95th Percentile Target
0
20
40
60
80
100
120
Ap
r-12
Ma
y-1
2
Ju
n-1
2
Ju
l-1
2
Au
g-1
2
Se
p-1
2
Oct-
12
Nov-1
2
Dec-1
2
Ja
n-1
3
Fe
b-1
3
Ma
r-13
Ap
r-13
Ma
y-1
3
Ju
n-1
3
Ju
l-1
3
Au
g-1
3
Se
p-1
3
Oct-
13
Nov-1
3
Dec-1
3
Tim
e to
Tre
atm
en
t (m
ins)
A&E - Time to Treatment - Median
Time To Treatment - Median Target

Page 13 of 47
A&E Measures (Continued)
0%
1%
2%
3%
4%
5%
6%
7%
8%
9%
Ap
r-12
Ma
y-1
2
Ju
n-1
2
Ju
l-1
2
Au
g-1
2
Se
p-1
2
Oct-
12
Nov-1
2
Dec-1
2
Ja
n-1
3
Fe
b-1
3
Ma
r-13
Ap
r-13
Ma
y-1
3
Ju
n-1
3
Ju
l-1
3
Au
g-1
3
Se
p-1
3
Oct-
13
Nov-1
3
Dec-1
3
% U
np
lan
ne
d R
ea
tte
nd
an
ce
s
A&E - Unplanned Re-Attendances Within 7 Days
Unplanned Re-Attendances Within 7 days Target
0%
1%
2%
3%
4%
5%
6%
7%
8%
9%
Ap
r-12
Ma
y-1
2
Ju
n-1
2
Ju
l-1
2
Au
g-1
2
Se
p-1
2
Oct-
12
Nov-1
2
Dec-1
2
Ja
n-1
3
Fe
b-1
3
Ma
r-13
Ap
r-13
Ma
y-1
3
Ju
n-1
3
Ju
l-1
3
Au
g-1
3
Se
p-1
3
Oct-
13
Nov-1
3
Dec-1
3
% P
atie
nts
Le
avin
g A
&E
Un
se
en
A&E - Patients Leaving A&E Unseen
Patients Leaving A&E Unseen Target

Page 14 of 47
Ambulance Handovers
Indicator Site Dec-13 YTD
St James's 2,731 21,771
LGI 2,009 14,555
Trust 4,740 36,326
St James's 599 4,140
LGI 181 1,894
Trust 780 6,034
St James's 21 197
LGI 25 206
Trust 46 403
St James's 0 11
LGI 1 14
Trust 1 25
St James's 3,330 25,911
LGI 2,190 16,449
Trust 5,520 42,360
Target
Patient handovers taking longer than 15
minutes between ambulance and A&E0
Patient handovers taking longer than 30
minutes between ambulance and A&E
Patient handovers taking 15 minutes or
less between ambulance and A&E-
Total patient handovers between
ambulance and A&E-
0
0Patient handovers taking longer than 60
minutes between ambulance and A&E
Local Contractual Indicator
Aim: Ensure patient handovers between ambulance and A&E take no longer than 15 minutes. Owner: Chief Operating Officer and Clinical Director of Urgent Care. Consequence of failure: Patient safety, clinical outcomes, timely access to treatment, reputation & financial penalty.
Actions:
YAS are to visit the Trust on the 29th January to review the revised handover
process and agree improvements.
The Trust has requested that YAS review the current process for correcting errors identified in performance data.
0
100
200
300
400
500
600
700
800
900
Apr-13 May-13 Jun-13 Jul-13 Aug-13 Sep-13 Oct-13 Nov-13 Dec-13
No
. o
f h
an
do
ve
rs
Ambulance Handovers Taking Longer Than 15 Minutes
0
20
40
60
80
100
120
140
160
180
200
Apr-13 May-13 Jun-13 Jul-13 Aug-13 Sep-13 Oct-13 Nov-13 Dec-13
No
. o
f h
an
do
ve
rs
Ambulance Handovers Taking Longer Than 30 Minutes
0
2
4
6
8
10
12
14
16
18
20
Apr-13 May-13 Jun-13 Jul-13 Aug-13 Sep-13 Oct-13 Nov-13 Dec-13
No
. o
f h
an
do
ve
rs
Ambulance Handovers Taking Longer Than 60 Minutes

Page 15 of 47
Cancer 62 Days Tumour Type Nov-13 (%)
Breast 89.5%
Gynaecological 57.9%
Haematological (Excluding Acute Leukaemia) 76.5%
Head & Neck 85.0%
Lower Gastrointestinal 86.2%
Lung 59.5%
Other 75.0%
Skin 87.5%
Upper Gastrointestinal 66.7%
Urological (Excluding Testicular) 89.0%
Trust 77.9%
Cancer 62 Day Waits - Screening Referrals 96.7%
Cancer 62 Day Waits - Consultant Upgrades (local contractual indicator) 50.0%
Cancer 62 Day Waits - GP Referral
National Indicator / Quality Requirement
Local Contractual Indicator
Aims:
Ensure at least 85% of patients receive their first definitive treatment for cancer within 62 days following an urgent GP (GDP or GMP) referral for suspected cancer.
Ensure at least 90% of patients receive their first definitive treatment for cancer within 62 days following referral from an NHS cancer screening service.
Ensure at least 85% of patients receive their first definitive treatment for cancer within 62 days of a consultant decision to upgrade their priority status (local contractual indicator).
Owner: Chief Operating Officer and Clinical Director of Leeds Cancer Centre. Consequence of failure: Timely access to treatment, patient experience, clinical outcomes, reputation & financial penalty.
Appendix 2 lists the peer Trusts included in the benchmarking graphs.
The cancer indicators are monitored a month in arrears due to the timing of the national reporting deadline. Performance against the 62 day standard for referrals from consultant upgrade are liable to fluctuate due to the small numbers involved.
Actions:
This target was achieved for Q1, Q2 and October, but not for November. Internal capacity issues have arisen in Urology robotic surgery which are being addressed via recovery actions. Late referrals of patients past day 38 on a 62 day pathway from other providers to the Trust continue to worsen. A refreshed transfer process is in place, with improved performance by referring units having been requested via the Chief Operating Officer and commissioners. Due to these on-going internal issues and late referrals, it is unlikely that this target will be achieved for Q3.
40%
50%
60%
70%
80%
90%
100%
Ap
r-12
Ma
y-1
2
Ju
n-1
2
Ju
l-1
2
Au
g-1
2
Se
p-1
2
Oct-
12
Nov-1
2
Dec-1
2
Ja
n-1
3
Fe
b-1
3
Ma
r-13
Ap
r-13
Ma
y-1
3
Ju
n-1
3
Ju
l-1
3
Au
g-1
3
Se
p-1
3
Oct-
13
Nov-1
3
% p
atie
nts
me
etin
g ta
rge
t
Performance Against the 62 Day Cancer Standard for GP/Dentist Referrals
% Within 62 Days - GP/Dentist Target
40%
60%
80%
100%
Bre
ast
Gynaec
olo
gic
al
Haem
ato
logic
al (
Exc
ludin
gA
cute
Leuka
em
ia)
Head &
Neck
Low
er G
astroin
testin
al
Lung
Oth
er
Ski
n
Upper G
astroin
testin
al
Uro
logic
al (
Exc
ludin
gT
estic
ula
r)
% p
atie
nts
me
etin
g ta
rge
t
Cancer 62 Day Waits for GP Referrals by Tumour Type - Nov 2013
Performance Target

Page 16 of 47
Cancer 62 Days (Continued)
40%
50%
60%
70%
80%
90%
100%
Ap
r-12
Ma
y-1
2
Ju
n-1
2
Ju
l-1
2
Au
g-1
2
Se
p-1
2
Oct-
12
Nov-1
2
Dec-1
2
Ja
n-1
3
Fe
b-1
3
Ma
r-13
Ap
r-13
Ma
y-1
3
Ju
n-1
3
Ju
l-1
3
Au
g-1
3
Se
p-1
3
Oct-
13
Nov-1
3
% p
atie
nts
me
etin
g ta
rge
t
62 Day Upgrade 62 Day Upgrade Target
Performance Against the 62 Day Cancer Standard for Referrals from Consultant Upgrade
NB. Due to the small numbers involved, the above data are liable to fluctuate. In November 2013, for instance, 3.5 of just 7 accountable cases were treated within 62 days.
40%
50%
60%
70%
80%
90%
100%
Ap
r-12
Ma
y-1
2
Ju
n-1
2
Ju
l-1
2
Au
g-1
2
Se
p-1
2
Oct-
12
Nov-1
2
Dec-1
2
Ja
n-1
3
Fe
b-1
3
Ma
r-13
Ap
r-13
Ma
y-1
3
Ju
n-1
3
Ju
l-1
3
Au
g-1
3
Se
p-1
3
Oct-
13
Nov-1
3
% p
atie
nts
me
etin
g ta
rge
t
62 Day Screening 62 Day Screening Target
Performance Against the 62 Day Cancer Standard for Referrals from Screening Service
0%
10%
20%
30%
40%
50%
60%
70%
80%
90%
100%
% W
ith
in 6
2 D
ays
Trusts
Performance Against the 62 Day Cancer Standard for GP/Dentist Referrals - 2013-14 Q2
LTHT Peers Other Trusts Target
Source: NHS England
0%
10%
20%
30%
40%
50%
60%
70%
80%
90%
100%
% W
ith
in 6
2 D
ays
Trusts
Performance Against the 62 Day Cancer Standard for Referrals from Screening Service - 2013-14 Q2
LTHT Peers Other Trusts Target
Source: NHS England

Page 17 of 47
Cancer 31 Days Tumour Type Nov-13 (%)
Brain/Central Nervous System 100.0%
Breast 98.1%
Children's 100.0%
Gynaecological 93.9%
Haematological 100.0%
Head & Neck 100.0%
Lower Gastrointestinal 100.0%
Lung 94.5%
Sarcoma 100.0%
Skin 92.1%
Upper Gastrointestinal 100.0%
Urological 100.0%
Other 100.0%
Trust 97.7%
Cancer 31 Day Waits - Subsequent Surgery 97.8%
Cancer 31 Day Waits - Subsequent Drug Treatment 100.0%
Cancer 31 Day Waits - Subsequent Radiotherapy 95.1%
Cancer 31 Day Waits - First Definitive Treatment
National Indicator / Quality Requirement
Aims:
Ensure at least 96% of patients receiving their first definitive treatment are treated within 31 days.
Ensure at least 94% of patients receiving subsequent surgery are treated within 31 days.
Ensure at least 98% of patients receiving a subsequent anti-cancer drug regimen are treated within 31 days.
Ensure at least 94% of patients receiving subsequent radiotherapy are treated within 31 days.
Owner: Chief Operating Officer and Clinical Director of Leeds Cancer Centre. Consequence of failure: Timely access to treatment, patient experience, clinical outcomes, reputation & financial penalty.
The cancer indicators are monitored a month in arrears due to the timing of the national reporting deadline.
80%
85%
90%
95%
100%
Ap
r-12
Ma
y-1
2
Ju
n-1
2
Ju
l-1
2
Au
g-1
2
Se
p-1
2
Oct-
12
Nov-1
2
Dec-1
2
Ja
n-1
3
Fe
b-1
3
Ma
r-13
Ap
r-13
Ma
y-1
3
Ju
n-1
3
Ju
l-1
3
Au
g-1
3
Se
p-1
3
Oct-
13
Nov-1
3
% p
atie
nts
me
etin
g ta
rge
t
% Within 31 Days - First Treatments Target
Performance Against the 31 Day Cancer Standard for First Treatments
80%
85%
90%
95%
100%
Bra
in/C
ent
ral N
erv
ous
Sys
tem
Bre
ast
Child
ren's
Gynaec
olo
gic
al
Haem
ato
logic
al
Head &
Neck
Low
er G
astroin
testin
al
Lung
Sarc
om
a
Ski
n
Upper G
astroin
testin
al
Uro
logic
al
Oth
er
% p
atie
nts
me
etin
g ta
rge
t
Performance Target
Cancer 31 Day Waits for First Definitive Treatment by Tumour Type - Nov 2013
80%
85%
90%
95%
100%
Ap
r-12
Ma
y-1
2
Ju
n-1
2
Ju
l-1
2
Au
g-1
2
Se
p-1
2
Oct-
12
Nov-1
2
Dec-1
2
Ja
n-1
3
Fe
b-1
3
Ma
r-13
Ap
r-13
Ma
y-1
3
Ju
n-1
3
Ju
l-1
3
Au
g-1
3
Se
p-1
3
Oct-
13
Nov-1
3
% p
atie
nts
me
etin
g ta
rge
t
Drug Drug Target
Surgery Surgery and Radiotherapy Target
Radiotherapy
Performance Against the 31 Day Cancer Standard for Second or Subsequent Treatment

Page 18 of 47
Cancer 2 Week Wait
Tumour Type Nov-13 (%)
Suspected brain/central nervous system tumours 100.0%
Suspected breast cancer 76.3%
Suspected children's cancer 42.9%
Suspected gynaecological cancer 97.6%
Suspected haematological malignancies (excluding acute leukaemia) 100.0%
Suspected head & neck cancer 95.9%
Suspected lower gastrointestinal cancer 95.8%
Suspected lung cancer 97.4%
Suspected sarcoma 100.0%
Suspected skin cancer 97.0%
Suspected testicular cancer 100.0%
Suspected upper gastrointestinal cancer 96.2%
Suspected urological malignancies (excluding testicular) 93.5%
Trust 92.3%
Cancer 2 Week Waits - Breast Symptoms 86.6%
Cancer 2 Week Waits - Suspected
National Indicator / Quality Requirement
Aims:
Ensure at least 93% of patients urgently referred with suspected cancer by their GP (GMP or GDP) are seen within 14 days.
Ensure at least 93% of patients urgently referred for evaluation/investigation of “breast symptoms” by a primary or secondary care professional are seen within 14 days.
Owner: Chief Operating Officer and Clinical Director of Leeds Cancer Centre. Consequence of failure: Timely access to treatment, patient experience, clinical outcomes, reputation & financial penalty.
The cancer indicators are monitored a month in arrears due to the timing of the national reporting deadline.
Actions:
The 2 week wait target was achieved for Q2 but not September or October, due mainly to breast capacity issues and the large number of cancelled Dermatology clinics in November. Provisional data suggests that performance has been restored for December.
Breast symptoms: The Trust failed this target in Q2, and will fail for November and likely Q3 due to on-going capacity issues in both breast surgical capacity, demand, and supporting radiology slots. Additional surgical capacity is however now in place and the Trust is expecting to achieve this target for January 2014.
80%
85%
90%
95%
100%
Ap
r-12
Ma
y-1
2
Ju
n-1
2
Ju
l-1
2
Au
g-1
2
Se
p-1
2
Oct-
12
Nov-1
2
Dec-1
2
Ja
n-1
3
Fe
b-1
3
Ma
r-13
Ap
r-13
Ma
y-1
3
Ju
n-1
3
Ju
l-1
3
Au
g-1
3
Se
p-1
3
Oct-
13
Nov-1
3
% p
atie
nts
me
etin
g ta
rge
t
% Within 14 Days - Suspected Cancer Target
Performance Against the 2 Week Cancer Standard for Suspected Cancer
80%
85%
90%
95%
100%
Susp
ecte
d b
rain
/centr
al
nerv
ous
syst
em
tum
ours
Susp
ecte
d b
reast
cancer
Susp
ecte
d c
hild
ren's
cancer
Susp
ecte
d g
ynaec
olo
gic
al
cancer
Susp
ecte
d h
aem
ato
logic
al
malig
nancie
s (e
xclu
din
g
acu
te le
ukaem
ia)
Susp
ecte
d h
ead &
neck
cancer
Susp
ecte
d low
er
gast
roin
test
inal ca
nce
r
Susp
ecte
d lung c
ance
r
Susp
ecte
d s
arc
oma
Susp
ecte
d s
kin c
ance
r
Susp
ecte
d testic
ula
rca
ncer
Susp
ecte
d u
pper
gast
roin
test
inal ca
nce
r
Susp
ecte
d u
rolo
gic
al
malig
nancie
s (e
xclu
din
g
test
icula
r)
% p
atie
nts
me
etin
g ta
rge
t
Cancer 2 Week Waits for Suspected Cancer by Tumour Type - Nov 2013
Performance Target
80%
85%
90%
95%
100%
Ap
r-12
Ma
y-1
2
Ju
n-1
2
Ju
l-1
2
Au
g-1
2
Se
p-1
2
Oct-
12
Nov-1
2
Dec-1
2
Ja
n-1
3
Fe
b-1
3
Ma
r-13
Ap
r-13
Ma
y-1
3
Ju
n-1
3
Ju
l-1
3
Au
g-1
3
Se
p-1
3
Oct-
13
Nov-1
3
% p
atie
nts
me
etin
g ta
rge
t
% Within 14 Days - Breast Symptoms Target
Performance Against the 2 Week Cancer Standard for Breast Symptoms

Page 19 of 47
Stroke Care
0%
10%
20%
30%
40%
50%
60%
70%
80%
90%
100%
Ap
r-13
Ma
y-1
3
Ju
n-1
3
Ju
l-1
3
Au
g-1
3
Se
p-1
3
Oct-
13
Nov-1
3
% w
ith
in 2
4 h
ou
rs
Proportion of High-Risk TIA Patients Investigated and Treated within 24 Hours of First Contact with a Health Professional
Internal Indicator
Aims:
Ensure at least 80% of patients who have had a stroke spend at least 90% of their time in hospital on a stroke unit.
Ensure high-risk TIA patients are investigated and treated within 24 hours of first contact with a health professional.
Owner: Chief Operating Officer and Clinical Director of the Centre for Neurosciences Consequence of failure: Timely access to treatment, patient experience, clinical outcomes & financial penalty.
The stroke care indicator is monitored a month in arrears.
Actions:
Stroke coding is now being regularly reviewed by clinicians in order to reduce the incidence of non-stroke patients being assigned the stroke code.
0%
10%
20%
30%
40%
50%
60%
70%
80%
90%
100%
Ap
r-12
Ma
y-1
2
Ju
n-1
2
Ju
l-1
2
Au
g-1
2
Se
p-1
2
Oct-
12
Nov-1
2
Dec-1
2
Ja
n-1
3
Fe
b-1
3
Ma
r-13
Ap
r-13
Ma
y-1
3
Ju
n-1
3
Ju
l-1
3
Au
g-1
3
Se
p-1
3
Oct-
13
Nov-1
3
% m
ee
tin
g ta
rge
t
Stroke Discharges Spending at Least 90% of Spell on a Stroke Unit
90% of spell on stroke unit Target

Page 20 of 47
30 Day Emergency Readmissions ElectiveNon-
ElectiveTotal Elective
Non-
ElectiveTotal Elective Non-Elective Total
Acute Medicine 2.7% 18.1% 16.1% 2.1% 19.0% 16.9% 4.0% 14.2% 12.7%
Adult Critical Care - 0.0% 0.0% - 7.1% 7.1% 2.0% 4.4% 2.2%
Adult Theatres & Anaesthesia 0.0% - 0.0% 0.0% - 0.0% 3.6% 8.6% 4.9%
Cardio-Respiratory 3.7% 12.8% 8.8% 3.7% 14.6% 10.0% 5.5% 15.5% 10.4%
Centre for Neurosciences 2.9% 8.8% 4.7% 2.6% 8.4% 4.4% 3.8% 10.7% 6.2%
Chapel Allerton Hospital 2.1% 14.3% 2.3% 1.7% 15.3% 1.9% 2.3% 11.2% 2.4%
Childrens 5.0% 6.7% 6.0% 4.4% 5.7% 5.2% 6.4% 9.7% 7.9%
Digestive Diseases 3.4% 15.5% 6.5% 3.5% 15.7% 7.1% 4.1% 14.5% 7.0%
Head & Neck 2.1% 6.3% 2.6% 2.2% 6.2% 2.7% 2.9% 6.8% 3.6%
Hepatorenal 3.2% 18.2% 7.4% 4.3% 15.7% 7.3% 5.9% 17.8% 8.6%
Leeds Cancer Centre - - - - - - 7.7% 19.3% 9.1%
Leeds Dental Institute 0.0% 0.0% 0.0% 0.4% 0.0% 0.4% 0.9% 1.6% 1.0%
Pathology - - - 0.0% - 0.0% 0.0% 0.0% 0.0%
Radiology - - - - - - 5.2% 10.6% 5.4%
Trauma and Related Services 2.6% 8.7% 4.9% 3.1% 8.2% 5.3% 3.7% 8.1% 5.7%
Urgent Care - 10.3% 10.3% - 10.9% 10.9% 3.0% 11.4% 11.4%
Womens 1.4% 1.1% 1.1% 2.0% 1.1% 1.3% 2.7% 2.3% 2.4%
Trust 3.7% 10.4% 6.5% 3.8% 10.9% 6.8% 4.7% 11.0% 7.2%
(NB: RAG ratings are based on thresholds set by the TDA)
CSU
Nov-13 YTD Total Peer - Feb-12 to Jan-13
National Indicator / Quality Requirement
Aim: Ensure no more than 10.9% of patients are readmitted as an emergency within 30 days of discharge, following elective or non-elective treatment. Owner: Chief Operating Officer and CSU Clinical Directors. Consequence of failure: Patient safety, clinical outcomes, quality of care, reputation & financial penalty.
Appendix 2 lists the peer Trusts included in the benchmarking graphs.
0%
2%
4%
6%
8%
10%
12%
14%
Ap
r-12
Ma
y-1
2
Ju
n-1
2
Ju
l-1
2
Au
g-1
2
Se
p-1
2
Oct-
12
Nov-1
2
Dec-1
2
Ja
n-1
3
Fe
b-1
3
Ma
r-13
Ap
r-13
Ma
y-1
3
Ju
n-1
3
Ju
l-1
3
Au
g-1
3
Se
p-1
3
Oct-
13
Nov-1
3
% R
ea
dm
issio
ns
Readmissions - Elective
% Readmissions Peer % Readmissions
0%
2%
4%
6%
8%
10%
12%
14%
Ap
r-12
Ma
y-1
2
Ju
n-1
2
Ju
l-1
2
Au
g-1
2
Se
p-1
2
Oct-
12
Nov-1
2
Dec-1
2
Ja
n-1
3
Fe
b-1
3
Ma
r-13
Ap
r-13
Ma
y-1
3
Ju
n-1
3
Ju
l-1
3
Au
g-1
3
Se
p-1
3
Oct-
13
Nov-1
3
% R
ea
dm
issio
ns
Readmissions - Non-Elective
% Readmissions Peer % Readmissions
0%
2%
4%
6%
8%
10%
12%
14%
Ap
r-12
Ma
y-1
2
Ju
n-1
2
Ju
l-1
2
Au
g-1
2
Se
p-1
2
Oct-
12
Nov-1
2
Dec-1
2
Ja
n-1
3
Fe
b-1
3
Ma
r-13
Ap
r-13
Ma
y-1
3
Ju
n-1
3
Ju
l-1
3
Au
g-1
3
Se
p-1
3
Oct-
13
Nov-1
3
% R
ea
dm
issio
ns
Readmissions - Total (Elective and Non-Elective)
% Readmissions Peer % Readmissions

Page 21 of 47
Outpatient Activity - New and Review Plan Activity Variance Plan Activity Variance
Acute Medicine 1,908 1,554 -354 18,223 16,610 -1,613
Adult Critical Care 0 0 0 0 1 1
Adult Theatres & Anaesthesia 21 76 55 202 1,123 921
Adult Therapies 3,556 2,682 -874 33,958 35,148 1,190
Cardio-Respiratory 3,131 3,037 -94 29,904 31,382 1,478
Centre for Neurosciences 1,831 1,832 1 17,439 19,438 1,999
Chapel Allerton Hospital 6,359 6,429 70 60,155 59,824 -331
Childrens 2,853 2,913 60 26,797 28,570 1,773
Digestive Diseases 3,147 2,185 -962 27,953 24,047 -3,906
Head & Neck 7,260 7,611 351 68,082 68,872 790
Hepatorenal 4,140 4,159 19 39,535 38,080 -1,455
Leeds Cancer Centre 0 0 0 0 0 0
Leeds Dental Institute 3,238 2,834 -404 30,735 28,222 -2,513
Pathology 1 0 -1 7 8 1
Radiology 850 1,643 793 8,119 17,551 9,432
Trauma and Related Services 4,179 3,969 -210 39,839 38,166 -1,673
Urgent Care 2,138 0 -2,138 20,421 16,466 -3,955
Womens 1,702 2,113 411 16,250 15,907 -343
Trust 46,313 43,037 -3,276 437,619 439,415 1,796
CSUDec-13 YTD
Outpatient Activity - Review Attendances
Internal Indicator
Aim: Maintain financial viability through delivery of planned activity. Owner: Chief Operating Officer and CSU Clinical Directors. Consequence of failure: Patient experience, clinical outcomes & financial penalty.
New: Overall Trust activity year to-December was 1.5% below plan. Year-to-December, the following CSUs were more than 10% below their plan: Adult Critical Care, Digestive Diseases and Urgent Care (this list excludes any CSU where the plan was for less than 100 attendances and the CSU variance from plan was only small numbers). Again the position shows marked variation against the plan which has previously been acknowledged to the board.
Review:
Overall Trust activity year to-December was 0.4% above plan.
Year-to-December, the following CSUs were more than 10% below their plan: Digestive Diseases and Urgent Care (this list excludes any CSU where the plan was for less than 100 attendances and the CSU variance from plan was only small numbers).
Plan Activity Variance Plan Activity Variance
Acute Medicine 380 417 37 3,629 4,232 603
Adult Critical Care 4 0 -4 38 29 -9
Adult Theatres & Anaesthesia 0 1 1 0 2 2
Adult Therapies 1,376 1,170 -206 13,145 14,433 1,288
Cardio-Respiratory 1,844 1,706 -138 17,611 17,371 -240
Centre for Neurosciences 1,538 1,189 -349 14,589 13,961 -628
Chapel Allerton Hospital 1,935 1,832 -103 18,188 17,637 -551
Childrens 1,184 1,104 -80 11,061 11,262 201
Digestive Diseases 1,447 856 -591 13,226 10,457 -2,769
Head & Neck 2,734 4,087 1,353 25,552 25,691 139
Hepatorenal 887 1,008 121 8,470 9,315 845
Leeds Cancer Centre 0 0 0 0 0 0
Leeds Dental Institute 1,085 1,158 73 10,681 10,711 30
Pathology 3 6 3 25 23 -2
Radiology 260 323 63 2,481 3,552 1,071
Trauma and Related Services 2,111 1,934 -177 20,034 19,912 -122
Urgent Care 1,785 0 -1,785 17,047 13,757 -3,290
Womens 1,094 1,320 226 10,444 11,008 564
Trust 19,667 18,111 -1,556 186,220 183,353 -2,867
Outpatient Activity - New Attendances
CSUDec-13 YTD

Page 22 of 47
Inpatient Activity - Elective and Non-elective Plan Activity Variance Plan Activity Variance
Acute Medicine 1,615 1,471 -144 14,324 12,844 -1,480
Adult Critical Care 6 7 1 51 56 5
Adult Theatres & Anaesthesia 0 0 0 0 0 0
Adult Therapies 0 0 0 0 0 0
Cardio-Respiratory 795 804 9 7,055 6,870 -185
Centre for Neurosciences 350 256 -94 3,101 2,259 -842
Chapel Allerton Hospital 18 11 -7 163 131 -32
Childrens 721 771 50 6,398 6,233 -165
Digestive Diseases 672 667 -5 5,965 6,208 243
Head & Neck 152 164 12 1,348 1,427 79
Hepatorenal 364 323 -41 3,228 3,233 5
Leeds Cancer Centre 0 0 0 0 0 0
Leeds Dental Institute 0 1 1 2 5 3
Pathology 0 0 0 0 1 1
Radiology 14 18 4 124 163 39
Trauma and Related Services 473 449 -24 4,197 4,451 254
Urgent Care 1,077 737 -340 9,549 7,111 -2,438
Womens 138 89 -49 1,221 1,077 -144
Awaiting CSU Allocation 0 0 0 0 5 5
Trust 6,395 5,768 -627 56,726 52,074 -4,652
CSUDec-13 YTD
Inpatient Activity - Non-Elective (Spells)
Internal Indicator
Aim: Maintain financial viability through delivery of planned activity Owner: Chief Operating Officer and CSU Clinical Directors. Consequence of failure: Patient experience, clinical outcomes & financial penalty.
Elective:
Overall Trust activity year to-December was 1% below plan.
Year-to-December, only the Radiology CSU was more than 10% below its plan (with the exception of Adult Critical Care and Urgent Care, which involve very small numbers).
Non-elective:
Overall Trust activity year to-December was 8.2% below plan.
Year-to-December, the following CSUs were more than 10% below their plan: Acute Medicine, Centre for Neurosciences, Chapel Allerton Hospital, Urgent Care and Women‟s (this list excludes any CSU where the plan was for less than 100 attendances and the CSU variance from plan was only small numbers).
Plan Activity Variance Plan Activity Variance
Acute Medicine 185 121 -64 1,768 1,665 -103
Adult Critical Care 0 0 0 2 0 -2
Adult Theatres & Anaesthesia 1 9 8 6 85 79
Adult Therapies 0 0 0 0 0 0
Cardio-Respiratory 505 432 -73 4,819 4,832 13
Centre for Neurosciences 561 494 -67 5,148 4,863 -285
Chapel Allerton Hospital 939 843 -96 8,941 8,382 -559
Childrens 846 885 39 7,860 8,677 817
Digestive Diseases 1,934 1,434 -500 15,956 14,947 -1,009
Head & Neck 1,090 1,096 6 10,217 10,267 50
Hepatorenal 879 856 -23 8,147 8,958 811
Leeds Cancer Centre 0 0 0 0 0 0
Leeds Dental Institute 130 100 -30 1,254 1,178 -76
Pathology 0 0 0 0 1 1
Radiology 13 6 -7 129 112 -17
Trauma and Related Services 691 598 -93 6,257 5,991 -266
Urgent Care 0 0 0 2 0 -2
Womens 281 219 -62 2,691 2,525 -166
Trust 8,055 7,093 -962 73,204 72,483 -721
Inpatient Activity - Elective (Spells)
CSUDec-13 YTD

Page 23 of 47
Length of Stay
0
2
4
6
8
10
12
14
16
Card
iolo
gy
Derm
ato
logy
Ear
Nose
& T
hro
at
Eld
erly M
edic
ine
Gastroente
rolo
gy
Genera
l Medic
ine
Genera
l Surg
ery
Gynaec
olo
gy
Neuro
logy
Neuro
surg
ery
Ophth
alm
olo
gy
Ora
l Surg
ery
Pla
stic
Surg
ery
Resp
irato
ry M
edic
ine
Rheum
ato
logy
Tra
um
a &
Ort
hop
aedic
Surg
ery U
rolo
gy
Le
ng
th o
f S
tay
LTHT Peer Average
For peer listing, please see Appendix 2 Source: Dr Foster
Length of Stay: Selected Specialties - Nov-12 to Oct-13
Internal Indicator
Aim: To reduce the length of stay in order to release capacity for other patients and provide an improved patient experience. Owner: Chief Operating Officer and CSU Clinical Directors. Consequence of failure: Patient experience, financial and clinical outcomes.
\
Specialty LTHT Peer Avg
Cardiology 3.2 4.4
Dermatology 5.1 6.4
Ear Nose & Throat 2.4 2.6
Elderly Medicine 11.5 13.5
Gastroenterology 7.4 7.9
General Medicine 6.6 6.1
General Surgery 4.9 4.6
Gynaecology 1.6 1.5
Neurology 10.8 9.4
Neurosurgery 10.6 8.1
Ophthalmology 0.9 1.6
Oral Surgery 2.0 2.3
Plastic Surgery 2.6 2.7
Respiratory Medicine 10.5 7.3
Rheumatology 4.4 5.8
Trauma & Orthopaedic Surgery 7.6 6.7
Urology 3.7 3.2
All Specialties 5.1 4.8
NB: For Length of Stay, Specialty level peer data is only available on Dr Foster for the
period Nov-12 to Oct-13. Please note that the Trust level (as shown in the ‘Other Key
Indicators’ dashboard) provides more up to date data: Dec-12 to Nov-13.
Length of Stay: Selected Specialties
Nov-12 to Oct-13

Page 24 of 47
Flu Vaccinations Employees Vaccinated %
Acute Medicine 561 274 48.8%
Adult Critical Care 475 249 52.4%
Adult Theatres & Anaesthesia 714 351 49.2%
Adult Therapies 469 220 46.9%
Cardio-Respiratory 557 279 50.1%
Chapel Allerton 276 160 58.0%
Childrens 1,199 633 52.8%
Digestive Diseases 439 224 51.0%
Head Neck & Ophthalmology 208 104 50.0%
Hepatorenal 487 279 57.3%
Institute for Oncology/Leeds Cancer Centre 1,097 546 49.8%
Institute of Neurosciences 385 179 46.5%
Leeds Dental Institute 285 178 62.5%
Medicines Management and Pharmacy Services 521 359 68.9%
Outpatients 119 75 63.0%
Pathology 841 349 41.5%
Radiology 705 327 46.4%
Trauma and Related Services 364 172 47.3%
Urgent Care 412 264 64.1%
Womens 689 411 59.7%
Non Training Grade Doctors (Supporting Rotas) 59 19 32.2%
Training Grade Doctors 986 482 48.9%
Corporate Services 3,311 1,365 41.2%
Unknown - 1,733 -
Trust (including Unknown) 15,055 9,232 61.3%
Attainment by CSUDec-13
National Indicator
Aims:
To provide 75% of healthcare workers with a flu vaccination by January 2014. Owner: Chief Operating Officer, Chief Nurse, CSU Clinical Directors. Consequence of failure: Patient experience, patient safety, quality of care & financial penalty.
As at the 20th December 2013, 69.9% of healthcare workers had received a flu
vaccination.
Actions:
Managers of clinical areas are to encourage/challenge their staff to be vaccinated and to make best use of their peer vaccinators.
Peer vaccinators to return their completed forms immediately to OHS post each vaccine.
Staff who have been vaccinated at the GP surgery are being encouraged to tell OHS so their records can be updated.
Employees Vaccinated %
Add Prof Scientific and Technic 798 445 55.8%
Additional Clinical Services 2,368 1,233 52.1%
Administrative and Clerical 2,437 1,205 49.4%
Allied Health Professionals 821 423 51.5%
Estates and Ancillary 1,979 747 37.7%
Healthcare Scientists 737 318 43.1%
Medical and Dental 2,048 954 46.6%
Nursing and Midwifery Registered 3,959 2,170 54.8%
Students 12 4 33.3%
Unknown - 1,733 -
Trust (including Unknown) 15,055 9,232 61.3%
Attainment by staff groupDec-13

Page 25 of 47
Incidence of MRSA By month
MRSA Cases
(Trust-
Apportioned)
Achieve
Trajectory
( < )
Apr-13 1 0
May-13 2 0
Jun-13 0 0
Jul-13 0 0
Aug-13 1 0
Sep-13 1 0
Oct-13 0 0
Nov-13 0 0
Dec-13 0 0
By CSU Dec-13 YTD
Acute Medicine 0 1
Centre for Neurosciences 0 1
Digestive Diseases 0 2
Leeds Cancer Centre 0 1
All other CSU's 0 0
Trust 0 5
National Indicator / Quality Requirement
Aim: Eliminate Trust-apportioned MRSA bacteraemia cases in 2013/14. Owner: Chief Medical Officer, Infection Control Team, CSU Clinical Directors Consequence of failure: Patient safety, patient experience, quality of care, clinical outcomes, reputation & financial penalty.
Appendix 2 lists the peer Trusts included in the benchmarking graph.
As at 17 January, no MRSA bacteraemias have been provisionally recorded for January 2014.
Actions:
Continue to assess MRSA acquisition to ensure the appropriate Infection Control practices are in place.
0
1
2
3
4
5
6
7
8
9
Ca
se
s P
er
10
0,0
00
Occu
pie
d B
ed
Da
ys
Trusts
Number of MRSA Bacteraemia Cases Per 100,000 Occupied Bed Days (Trust Apportioned) - April to November 2013
LTHT Peers Other Trusts
Source: HPA(NB: 42 Trusts reported no MRSA cases for the period, including 3 peer Trusts)

Page 26 of 47
MRSA Screening Target > 95% > 95%
CSU Dec-13 YTD
Acute Medicine 97.4% 96.8%
Adult Critical Care 97.9% 95.6%
Adult Theatres & Anaesthesia 98.2% 96.8%
Cardio-Respiratory 95.5% 95.5%
Centre for Neurosciences 98.5% 97.3%
Chapel Allerton Hospital 99.2% 98.4%
Children's 86.7% 90.2%
Digestive Diseases 98.4% 96.1%
Head & Neck 92.9% 91.9%
Hepatorenal 98.4% 97.1%
Leeds Cancer Centre 96.4% 96.0%
Leeds Dental Institute* 0.0% 11.1%
Trauma & Related Services 92.0% 91.3%
Urgent Care 98.0% 91.9%
Women's 97.0% 95.4%
Trust 96.5% 95.6%
* Low numbers of eligible patients
MRSA Screening - % of Eligible Patients Screened
Local Contractual Indicator
Aim: Ensure that at least 95% of eligible admitted patients are screened for MRSA. Owner: Chief Medical Officer, CSU Clinical Directors Consequence of failure: Patient safety, patient experience, quality of care, clinical outcomes & financial penalty.
Actions:
The MRSA Screening process was reinforced in October 2013. The Trust achieved the screening target in both November and December 2013.
80%
85%
90%
95%
100%
Ap
r-12
Ma
y-1
2
Ju
n-1
2
Ju
l-1
2
Au
g-1
2
Se
p-1
2
Oct-
12
Nov-1
2
Dec-1
2
Ja
n-1
3
Fe
b-1
3
Ma
r-13
Ap
r-13
Ma
y-1
3
Ju
n-1
3
Ju
l-1
3
Au
g-1
3
Se
p-1
3
Oct-
13
Nov-1
3
Dec-1
3
% o
f e
lig
ible
pa
tie
nts
scre
en
ed
MRSA Screening (Elective and Non Elective Admissions)
% Screened Target

Page 27 of 47
Incidence of CDI
CSU Dec-13 YTD
Acute Medicine 3 25
Adult Critical Care 2 10
Cardio-Respiratory 0 11
Centre for Neurosciences 1 8
Children's 0 15
Digestive Diseases 4 13
Head & Neck 0 1
Hepatorenal 3 12
Leeds Cancer Centre 0 11
Trauma & Related Services 0 7
Women's 0 1
All other CSU's 0 0
Trust 13 114
CDI Rate per 100,000 Bed Days 25.3 24.6
CDI
National Indicator / Quality Requirement
Local Contractual Indicator
Aims:
Reduce the number of Trust-attributed CDIs in 2013/14 to no more than 101.
Reduce the CDI rate per 100,000 occupied bed days in line with the NHS Standard Contract.
Owner: Chief Medical Officer, CSU Clinical Directors Consequence of failure: Patient safety, patient experience, quality of care, clinical outcomes, reputation & financial penalty.
Appendix 2 lists the peer Trusts included in the benchmarking graph.
As at 17 January, 4 CDIs have been recorded for January 2014. Actions:
CDI polymerase chain reaction testing introduced to allow better management of patients in source isolation and reduce the impact on bed capacity.
5 Clinical Service Units have attended an Executive-led CDI review meeting to discuss the root causes identified and the relevant actions that have taken place.
0
20
40
60
80
100
120
Ap
r-13
Ma
y-1
3
Ju
n-1
3
Ju
l-1
3
Au
g-1
3
Se
p-1
3
Oct-
13
Nov-1
3
Dec-1
3
No
. C
DI ca
se
s
Progress Against the CDI Target (Cumulative)
CDI Cases Achieve Trajectory
0
5
10
15
20
25
30
35
40
Ap
r-12
Ma
y-1
2
Ju
n-1
2
Ju
l-1
2
Au
g-1
2
Se
p-1
2
Oct-
12
Nov-1
2
Dec-1
2
Ja
n-1
3
Fe
b-1
3
Ma
r-13
Ap
r-13
Ma
y-1
3
Ju
n-1
3
Ju
l-1
3
Au
g-1
3
Se
p-1
3
Oct-
13
Nov-1
3
Dec-1
3
CD
I R
ate
Pe
r 1
00
,00
0 O
ccu
pie
d B
ed
Da
ys
CDI Rate Per 100,000 Occupied Bed Days
NB: Denominator taken from internal Midnight Bed State data
0
5
10
15
20
25
30
35
40
Ca
se
s p
er
10
0,0
00
Occu
pie
d B
ed
Da
ys
Trusts
Number of C.Difficile Cases Per 100,000 Occupied Bed Days for Patients Aged > 2 Years (Trust Apportioned) - April to November 2013
LTHT Peers Other Trusts
Source: HPA(NB: 7 Trusts reported no CDI cases for the period)

Page 28 of 47
Summary Hospital Mortality Index (SHMI) SHMI Measure Spells SHMI
Observed
Deaths
Expected
Deaths
95%
Confidence
Interval
SHMI 127237 93.95 4003 4261 91.06-96.91
SHMI (adjusted for palliative care) 127237 96.15 4003 4163 93.20-99.18
SHMI (in hospital deaths) 127237 93.09 2868 3081 89.71-96.56
LTHT SHMI for Apr 12 to Mar 2013
National Indicator / Quality Requirement
The SHMI reports mortality at Trust level across the NHS in England using standard and transparent methodology. SHMI is the nationally recognised hospital level indicator of mortality.
Aim: Improve SHMI rate. Owner: Chief Medical Officer and CSU Clinical Directors. Consequence of failure: Patient safety, patient outcomes & reputation.
The Trust SHMI (source: Dr Foster) for the latest available period, April 2012 to March 2013 was 93.95 - better than expected. The Trust Relative Risk mortality for all CCS (Clinical Classification System) groups during the same period, were all either within or better than the expected range. The Trust has consistently maintained an overall SHMI within or better than the expected range over the latest available 3 year period.

Page 29 of 47
Hospital Standardised Mortality Rate (HSMR)
Measure Spells HSMRObserved
Deaths
Expected
Deaths
95%
Confidence
Interval
HSMR 58790 92.78 2459 2650 89.15-96.52
LTHT HSMR for Apr 12 to Mar 2013
National Indicator / Quality Requirement
The HSMR reports mortality at Trust level across the NHS in England using standard and transparent methodology.
Aim: Improve HSMR rate. Owner: Chief Medical Officer and CSU Clinical Directors. Consequence of failure: Patient safety, patient outcomes & reputation.
The Trust HSMR (source: Dr Foster) for April 2012 to March 2013 was 92.78 – better than expected. The Trust has consistently maintained an overall HSMR within or better than the expected range over the latest available 4 year period.
80
85
90
95
100
105
2009/10 2010/11 2011/12 2012/13
HS
MR
(1
00
x O
bs
erv
ed
/Ex
pe
cte
d d
ea
ths
)
Financial Year
HSMR Trend
LTHT LTHT (rebased) England England (rebased)
Acute Trust HSMRs Apr-13 to Aug-13 (re-based)

Page 30 of 47
VTE Risk Assessment CSU Nov-13 YTD
Acute Medicine 93.4% 96.2%
Adult Critical Care 100.0% 95.2%
Adult Theatres & Anaesthesia 90.4% 89.9%
Cardio-Respiratory 95.0% 94.9%
Centre for Neurosciences 94.2% 91.9%
Chapel Allerton 99.8% 99.4%
Children's 94.4% 90.7%
Digestive Diseases 95.4% 96.3%
Head & Neck 97.8% 96.8%
Hepatorenal 95.8% 94.8%
Leeds Cancer Centre 97.2% 98.5%
Leeds Dental Institute 100.0% 99.7%
Trauma & Related Services 90.3% 89.0%
Urgent Care 97.8% 96.9%
Women's 96.5% 95.8%
Trust 95.5% 95.7%
% VTE Risk Assessment
National Indicator / Quality Requirement
Aim: Ensure at least 95% of adult inpatients have a VTE risk assessment on admission to hospital. Owner: Chief Medical Officer and CSU Clinical Directors. Consequence of failure: Patient safety, clinical outcomes, CQUIN & financial penalty.
Appendix 2 lists the peer Trusts included in the benchmarking graph.
The VTE risk assessment indicator is monitored a month in arrears due to the timing of the national reporting deadline.
Provisional Trust performance for December as at 17th January is 94%.
70%
75%
80%
85%
90%
95%
100%
Ap
r-12
Ma
y-1
2
Ju
n-1
2
Ju
l-1
2
Au
g-1
2
Se
p-1
2
Oct-
12
Nov-1
2
Dec-1
2
Ja
n-1
3
Fe
b-1
3
Ma
r-13
Ap
r-13
Ma
y-1
3
Ju
n-1
3
Ju
l-1
3
Au
g-1
3
Se
p-1
3
Oct-
13
Nov-1
3
% p
atie
nts
me
etin
g ta
rge
t
Venous Thromboembolism (VTE) Risk Assessments
% Patients Risk Assessed for VTE Target
70%
75%
80%
85%
90%
95%
100%
% P
atie
nts
Me
etin
g T
arg
et
Trusts
LTHT Peers Other Trusts Target
Source: NHS England
Venous Thromboembolism (VTE) Risk Assessments- April to October 2013
RRK University Hospitals Birmingham NHS Foundation Trust 99.2%
RGT Cambridge University Hospitals NHS Foundation Trust 98.8%
RA7 University Hospitals Bristol NHS Foundation Trust 97.5%
RTD The Newcastle Upon Tyne Hospitals NHS Foundation Trust 96.4%
RM2 University Hospital Of South Manchester NHS Foundation Trust 96.2%
Top 5 Performing Peer Trusts - April to October 2013:
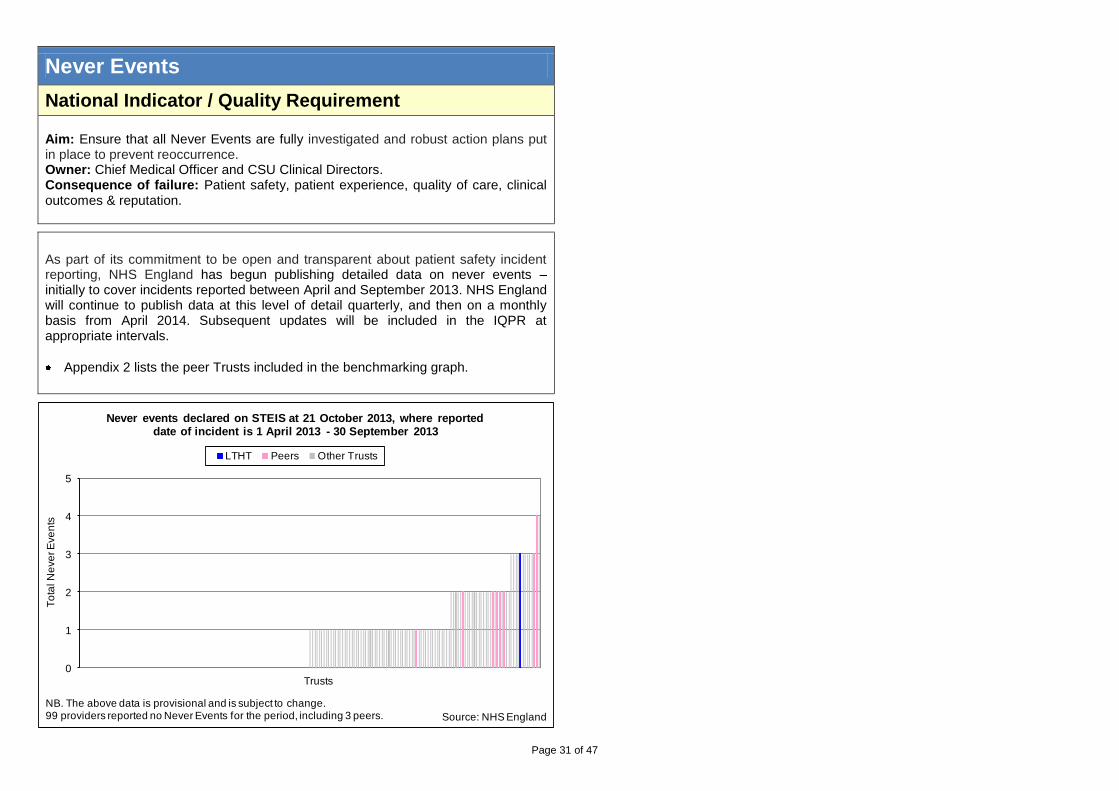
Page 31 of 47
Never Events
National Indicator / Quality Requirement
Aim: Ensure that all Never Events are fully investigated and robust action plans put in place to prevent reoccurrence. Owner: Chief Medical Officer and CSU Clinical Directors. Consequence of failure: Patient safety, patient experience, quality of care, clinical outcomes & reputation.
As part of its commitment to be open and transparent about patient safety incident reporting, NHS England has begun publishing detailed data on never events – initially to cover incidents reported between April and September 2013. NHS England will continue to publish data at this level of detail quarterly, and then on a monthly basis from April 2014. Subsequent updates will be included in the IQPR at appropriate intervals.
Appendix 2 lists the peer Trusts included in the benchmarking graph.
0
1
2
3
4
5
To
tal N
eve
r E
ve
nts
Trusts
Never events declared on STEIS at 21 October 2013, where reported date of incident is 1 April 2013 - 30 September 2013
LTHT Peers Other Trusts
Source: NHS England
NB. The above data is provisional and is subject to change.99 providers reported no Never Events for the period, including 3 peers.

Page 32 of 47
Harm Free Care
87
.8%
90
.0%
90
.8%
92
.9%
93
.2%
92
.9%
92
.5%
92
.3%
93
.2%
0%
10%
20%
30%
40%
50%
60%
70%
80%
90%
100%
Ju
n-1
2
Ju
l-1
2
Au
g-1
2
Se
p-1
2
Oct-
12
Nov-1
2
Dec-1
2
Ja
n-1
3
Fe
b-1
3
Ma
r-13
Ap
r-13
Ma
y-1
3
Ju
n-1
3
Ju
l-1
3
Au
g-1
3
Se
p-1
3
Oct-
13
Nov-1
3
Dec-1
3
% o
f P
atie
nts
With
Ha
rm F
ree
Ca
re
% of Patients With Harm Free Care
% of Patients With Harm Free Care Target
Source: Safety Thermometer
National Indicator / Quality Requirement
CQUIN Indicator
Internal Indicator
Aims:
Ensure at least 92% of patients receive harm free care in relation to pressure ulcers, falls, CUTIs & VTE).
Ensure that for the period October 2013 to March 2014 no more than 6.4% of patients have a pressure ulcer (between April and September 2013 this target stood at 7.2%, but was recently renegotiated with the CCG).
Owner: Chief Nurse, CSU Clinical Directors. Consequence of failure: Patient safety, patient experience, clinical outcomes, quality of care, reputation and financial penalty.
Actions:
Data continues to be collected and entered at the point of care; this is reducing variation and improving data robustness.
Safety Thermometer data has been added to the developing internal “Ward Healthcheck” tool and is now displayed on every ward notice board to improve understanding and knowledge of harm free care.
0%
2%
4%
6%
8%
10%
12%
14%
Ju
n-1
2
Ju
l-1
2
Au
g-1
2
Se
p-1
2
Oct-
12
Nov-1
2
Dec-1
2
Ja
n-1
3
Fe
b-1
3
Ma
r-13
Ap
r-13
Ma
y-1
3
Ju
n-1
3
Ju
l-1
3
Au
g-1
3
Se
p-1
3
Oct-
13
Nov-1
3
Dec-1
3
% o
f P
atie
nts
With
Fa
lls R
esu
ltin
g i
n H
arm
% of Patients With Falls Resulting in Harm
% Falls With Harm (LTHT) % Falls With Harm (National Acute Average)
Source: Safety Thermometer
0%
2%
4%
6%
8%
10%
12%
14%
Ju
n-1
2
Ju
l-1
2
Au
g-1
2
Se
p-1
2
Oct-
12
Nov-1
2
Dec-1
2
Ja
n-1
3
Fe
b-1
3
Ma
r-13
Ap
r-13
Ma
y-1
3
Ju
n-1
3
Ju
l-1
3
Au
g-1
3
Se
p-1
3
Oct-
13
Nov-1
3
Dec-1
3
% o
f P
atie
nts
With
a P
ressu
re U
lce
r (n
ew
an
d
old
)
% of Patients With a Pressure Ulcer (New and Old)
% of Patients With a Pressure Ulcer (new and old) Target
Source: Safety Thermometer
0%
2%
4%
6%
8%
10%
12%
14%
Oct-
12
Nov-1
2
Dec-1
2
Ja
n-1
3
Fe
b-1
3
Ma
r-13
Ap
r-13
Ma
y-1
3
Ju
n-1
3
Ju
l-1
3
Au
g-1
3
Se
p-1
3
Oct-
13
Nov-1
3
Dec-1
3% o
f P
atie
nts
With
UIT
s (
Ne
w a
nd
Old
)
% of Patients With UTIs (New and Old)
% With UTIs (LTHT) % With UTIs (National Acute Average)
Source: Safety Thermometer

Page 33 of 47
Pressure Ulcers
CSU Dec-13 YTD
Acute Medicine 2 9
Adult Critical Care 0 2
Cardio-Respiratory 1 3
Centre for Neurosciences 0 6
Hepatorenal 0 0
Trauma and Related Services 2 8
All other CSUs 2 8
Grade III Trust Total 7 36
Grade IV Trust Total 0 0
Pressure Ulcers - Grade III
Pressure Ulcers - Grade IV
CQUIN Indicator
Aims:
Reduce the number of grade III pressure ulcers developed in the Trust to no more than 36 for 2013/14.
Reduce the number of grade IV pressure ulcers developed in the Trust to no more than 2 for 2013/14.
Owner: Chief Nurse, CSU Clinical Directors. Consequence of failure: Patient experience, patient safety, clinical outcomes, quality of care, CQUIN & financial penalty.
Actions:
From January 2014, all Category 2 pressure ulcers will be subject to a „mini‟ Root Cause Analysis with subsequent improvement action plans.
The Nursing directorate team are currently undertaking independent assurance checks to review compliance against the required clinical standards for risk assessment, intervention and documentation.
0
1
2
3
4
5
6
7
8
9
Ap
r-12
Ma
y-1
2
Ju
n-1
2
Ju
l-1
2
Au
g-1
2
Se
p-1
2
Oct-
12
Nov-1
2
Dec-1
2
Ja
n-1
3
Fe
b-1
3
Ma
r-13
Ap
r-13
Ma
y-1
3
Ju
n-1
3
Ju
l-1
3
Au
g-1
3
Se
p-1
3
Oct-
13
Nov-1
3
Dec-1
3
No
. o
f p
ressu
re u
lce
rs
Number of Grade III Pressure Ulcers
Grade III Target
0
1
2
3
4
5
6
7
8
9
Ap
r-12
Ma
y-1
2
Ju
n-1
2
Ju
l-1
2
Au
g-1
2
Se
p-1
2
Oct-
12
Nov-1
2
Dec-1
2
Ja
n-1
3
Fe
b-1
3
Ma
r-13
Ap
r-13
Ma
y-1
3
Ju
n-1
3
Ju
l-1
3
Au
g-1
3
Se
p-1
3
Oct-
13
Nov-1
3
Dec-1
3
No
. o
f p
ressu
re u
lce
rs
Number of Grade IV Pressure Ulcers
No. Grade IV Target (<= 2 for 2013/14)

Page 34 of 47
Complaints
Complaints by CSU YTD
Acute Medicine 55
Adult Critical Care 6
Adult Theatres & Anaesthesia 14
Adult Therapies 7
Cardio-Respiratory 46
Centre for Neurosciences 78
Chapel Allerton Hospital 41
Children's 48
Digestive Diseases 71
Head & Neck 43
Hepatorenal 53
Leeds Cancer Centre 0
Leeds Dental Institute 9
Pathology 7
Radiology 11
Trauma & Related Services 61
Urgent Care 48
Women's 73
All Other CSU's 131
Trust 802
Top Complaints Subjects YTD
Medical Care 317
Communication 101
Nursing care 74
Waiting Lists 62
Attitude 61
Administration 45
Waiting Times 21
Discharge Planning 8
Equipment related issues 7
Policy and Procedural Issues 7
Sub Total 703
Trust 802
National Indicator / Quality Requirement
Internal Indicator
Aim: Improve patient experience and satisfaction through better understanding of the complaints received. Owner: Chief Nurse, CSU Clinical Directors. Consequence of failure: Patient experience, quality of care & financial penalty.
Actions:
A task and finish group has been established to implement the Trust‟s new Complaints Policy.
A new process has been put in place lead by the Deputy Chief Nurse and Director of Nursing Operations to review and initiate resolution for all complaints that have been open for over 6 months.
0
20
40
60
80
100
120
140
Ap
r-12
Ma
y-1
2
Ju
n-1
2
Ju
l-1
2
Au
g-1
2
Se
p-1
2
Oct-
12
Nov-1
2
Dec-1
2
Ja
n-1
3
Fe
b-1
3
Ma
r-13
Ap
r-13
Ma
y-1
3
Ju
n-1
3
Ju
l-1
3
Au
g-1
3
Se
p-1
3
Oct-
13
Nov-1
3
Dec-1
3Nu
mb
er o
f C
om
pla
ints
Re
ce
ive
d
Complaints - Number of Complaints Received
0
5
10
15
20
25
30
Ap
r-12
Ma
y-1
2
Ju
n-1
2
Ju
l-1
2
Au
g-1
2
Se
p-1
2
Oct-
12
Nov-1
2
Dec-1
2
Ja
n-1
3
Fe
b-1
3
Ma
r-13
Ap
r-13
Ma
y-1
3
Ju
n-1
3
Ju
l-1
3
Au
g-1
3
Se
p-1
3
Oct-
13
Nov-1
3
Dec-1
3Ra
te p
er 1
0,0
00
Occu
pie
d B
ed
D
ays
Complaints - Rate per 10,000 Occupied Bed Days

Page 35 of 47
Patient Satisfaction – Friends & Family
Response
Rate
Net Promoter
Score
Response
Rate
Net Promoter
Score
Acute Medicine 27.7% 48.3 33.3% 52.9
Cardio-Respiratory 25.7% 76.7 32.9% 78.4
Centre for Neurosciences 36.0% 80.0 27.9% 75.0
Chapel Allerton Hospital 55.6% 83.9 52.0% 87.3
Children's 0.0% - 15.8% 91.7
Digestive Diseases 52.4% 69.5 42.0% 70.1
Head & Neck 66.0% 64.1 21.8% 65.6
Hepatorenal 37.2% 69.7 37.0% 72.6
Leeds Cancer Centre 38.4% 82.2 34.4% 81.9
Trauma & Related Services 34.7% 72.2 22.2% 70.9
Urgent Care 1.0% 66.7 54.0% 68.9
Women's 10.1% 60.0 19.8% 66.1
All other CSUs - - - -
Inpatient Total 34.1% 70.4 30.7% 70.9
Maternity Total 36.9% 74.1 31.5% 73.0
A&E LGI 3.4% 34.2 7.0% 57.3
A&E SJUH 8.1% 71.7 8.5% 64.0
A&E Total 5.7% 60.0 7.7% 60.8
Combined Total 20.8% 70.0 49.4% 81.2
NB YTD Response Rate is not RAG rated as there is no YTD threshold.
Dec-13 YTD
CSU
National Indicator / Quality Requirement
Aims:
Ensure at least 15% of eligible patients respond to the Friends and Family test (FFT) question, with the aim to increase this to 20% by Quarter 4 in 2013/14.
Improve the number of positive recommendations to friends and family (Net Promoter Score) by people receiving NHS Treatment for the place where they received care.
Owner: Chief Nurse, Director of External Affairs & Communication Consequence of failure: Patient experience, reputation, CQUIN & financial penalty. Appendix 2 lists the peer Trusts included in the benchmarking graph.
As of 1 October 2013, figures included Maternity services. The FFT will be extended to all NHS services in England, including Outpatient appointments, by the end of March 2015. The A&E return rate (for both the LGI and SJUH) is to be compliant (>20%) by 31 January 2013. Actions:
The Trust has signed up to the 'iWantGreatCare' gold package both to provide the FFT service and develop it to include the Staff FFT. Workshop meetings to plan implementation are to commence in January 2014.
A FFT text messaging service has been implemented in both of the Trust‟s A&E departments. The service went live on 1
st January 2014.
0%
10%
20%
30%
40%
50%
60%
70%
80%
90%
100%
Ja
n-1
3
Fe
b-1
3
Ma
r-13
Ap
r-13
Ma
y-1
3
Ju
n-1
3
Ju
l-1
3
Au
g-1
3
Se
p-1
3
Oct-
13
Nov-1
3
Dec-1
3
% R
esp
on
se
Ra
te
Friends and Family Test - % Response Rate
Response Rate (%) Target
0%
10%
20%
30%
40%
50%
60%
70%
80%
90%
100%
Re
sp
on
se
Ra
te
Trusts
LTHT Peers Other Trusts
Source: NHS England
Friends and Family Test Response Rates (A&E and inpatient)November 2013
0
10
20
30
40
50
60
70
80
Ja
n-1
3
Fe
b-1
3
Ma
r-13
Ap
r-13
Ma
y-1
3
Ju
n-1
3
Ju
l-1
3
Au
g-1
3
Se
p-1
3
Oct-
13
Nov-1
3
Dec-1
3
Ne
t P
rom
ote
r S
co
re
Friends and Family Test - Net Promoter Score
Net Promoter Score (LTHT) Net Promoter Score (Peer Avg)

Page 36 of 47
Outpatient Measures
CSU
Dec-13 YTD Dec-13 YTD
Radiology 201 3,032 9.0% 11.9%
Leeds Cancer Centre 1,543 20,183 14.7% 15.8%
Trauma and Related Services 1,243 14,460 17.7% 18.0%
Womens 1,303 15,310 17.3% 18.7%
Leeds Dental Institute 957 11,471 18.3% 20.7%
Adult Theatres & Anaesthesia 11 359 14.9% 22.2%
Head & Neck 3,853 36,899 25.3% 22.6%
Childrens 1,067 14,087 19.3% 22.9%
Cardio-Respiratory 1,363 16,541 20.1% 23.0%
Chapel Allerton Hospital 2,542 26,070 23.8% 23.5%
Hepatorenal 1,246 17,166 18.8% 23.8%
Digestive Diseases 985 13,635 22.4% 25.8%
Centre for Neurosciences 1,249 12,901 26.6% 25.8%
Acute Medicine 542 9,176 19.7% 26.7%
Pathology 0 18 0.0% 27.7%
Adult Therapies 84 1,149 25.8% 28.2%
Adult Critical Care - 25 - 30.5%
All other CSUs - 1 - 100.0%
Trust 18,189 212,483 20.3% 21.4%
Total Number of OP Appointment
Cancellations (By Patient and Hospital)
OP Appointment Cancellations (as a %
of Total Bookings)
Outpatients: Total Appointment Cancellations
Internal Indicator
Aims:
Ensure the Trust‟s Did Not Attend (DNA) rate is below the peer average.
Reduce the number of appointments cancelled by hospital within 6 weeks of appointment.
Reduce the number of appointments cancelled by patient within 6 weeks of appointment.
Owner: Director of Informatics and CSU Clinical Directors. Consequence of failure: Patient experience, clinical outcomes & financial penalty.
Actions:
To support improvements to RTT performance there will be a review of clinic templates and best practice in scheduling to enable the prioritisation of service improvement by the CSUs.
To identify patient pathways with more than one outpatient appointment before the decision to treat, and to review the referral triage process, outpatient to procedure ratio and Directory of Services.
Radiology 192 8.6% 2,887 11.4% 7 0.3% 138 0.5%
Leeds Dental Institute 504 9.6% 7,087 12.8% 190 3.6% 2,119 3.8%
Womens 713 9.5% 8,637 10.6% 418 5.6% 5,321 6.5%
Acute Medicine 277 10.1% 4,317 12.6% 121 4.4% 2,298 6.7%
Trauma and Related Services 518 7.4% 6,595 8.2% 506 7.2% 5,688 7.1%
Leeds Cancer Centre 732 7.0% 9,239 7.2% 672 6.4% 9,091 7.1%
Cardio-Respiratory 669 9.9% 8,750 12.2% 439 6.5% 5,476 7.6%
Childrens 445 8.1% 6,365 10.3% 387 7.0% 5,114 8.3%
Adult Therapies 52 16.0% 748 18.4% 29 8.9% 346 8.5%
Adult Theatres & Anaesthesia 5 6.8% 219 13.6% 6 8.1% 140 8.7%
Head & Neck 1,361 8.9% 16,318 10.0% 1,662 10.9% 14,330 8.8%
Chapel Allerton Hospital 1,068 10.0% 12,207 11.0% 1,192 11.1% 9,942 9.0%
Hepatorenal 633 9.5% 8,446 11.7% 477 7.2% 6,728 9.3%
Centre for Neurosciences 494 10.5% 6,179 12.4% 528 11.2% 4,763 9.5%
Adult Critical Care - - 16 19.5% - - 8 9.8%
Digestive Diseases 440 10.0% 6,786 12.8% 382 8.7% 5,453 10.3%
Pathology 0 0.0% 6 9.2% 0 0.0% 11 16.9%
All other CSUs - - - - - - - -
Trust 8,103 9.0% 104,802 10.5% 7,016 7.8% 76,966 7.7%
Outpatients: Appointments Cancelled Within 6 Weeks of Appointment
CSU
Cancelled by Patient (Number and as a
% of Total Bookings)
Cancelled by Hospital (Number and as a
% of Total Bookings)
Dec-13 YTD Dec-13 YTD
Specialty LTHT Peer Avg
General Medicine 1.0% 5.7%
General Surgery 8.4% 8.0%
Neurosurgery 8.4% 7.5%
Gynaecology 9.2% 7.1%
Cardiology 9.4% 8.8%
Elderly Medicine 9.5% 8.8%
Rheumatology 9.7% 9.3%
Urology 10.1% 8.6%
Ophthalmology 10.3% 9.1%
Respiratory Medicine 10.5% 10.4%
Dermatology 11.2% 8.3%
Trauma & Orthopaedic Surgery 11.3% 9.3%
Neurology 11.4% 9.9%
Gastroenterology 12.0% 10.7%
Ear Nose & Throat 12.1% 8.6%
Plastic Surgery 12.4% 9.8%
Oral Surgery 15.6% 11.7%
All Specialties 9.5% 8.6%
Outpatient Appointment DNA (%)
Selected Specialties - Nov-12 to Oct-13
0% 5% 10% 15% 20%
Cardiology
Dermatology
Ear Nose & Throat
Elderly Medicine
Gastroenterology
General Medicine
General Surgery
Gynaecology
Neurology
Neurosurgery
Ophthalmology
Oral Surgery
Plastic Surgery
Respiratory Medicine
Rheumatology
Trauma & Orthopaedic…
Urology
Ou
tpa
tie
nt A
pp
oin
tme
nt
DN
A (%
)
LTHT Peer Average
For peer listing, please seeAppendix 2 Source: Dr Foster
Outpatient AppointmentDNA (%)Selected Specialties - Nov-12 to Oct-13

Page 37 of 47
Outpatient Measures (Continued)
Selected Specialties LTHT Peer Average
Cardiology 1.6 1.5
Dermatology 2.9 2.4
Ear Nose & Throat 1.1 1.4
Elderly Medicine 1.7 1.8
Gastroenterology 3.0 2.3
General Medicine 0.4 0.6
General Surgery 0.9 1.6
Gynaecology 1.1 1.1
Neurology 1.8 1.9
Neurosurgery 1.3 1.7
Ophthalmology 3.4 3.2
Oral Surgery 1.5 1.1
Plastic Surgery 1.8 2.7
Respiratory Medicine 1.9 2.5
Rheumatology 4.1 4.4
Trauma & Orthopaedic Surgery 1.9 2.0
Urology 3.2 2.4
All Specialties 2.0 2.3
New to Review Ratio: Selected Specialties
Nov-12 to Oct-13
0
1
2
3
4
5
Card
iolo
gy
Derm
ato
logy
Ear
Nose
& T
hro
at
Eld
erly M
edic
ine
Gastroente
rolo
gy
Genera
l Medic
ine
Genera
l Surg
ery
Gynaec
olo
gy
Neuro
logy
Neuro
surg
ery
Ophth
alm
olo
gy
Ora
l Surg
ery
Pla
stic
Surg
ery
Resp
irato
ry M
edic
ine
Rheum
ato
logy
Tra
um
a &
Ort
hop
aedic
Surg
ery U
rolo
gy
Ne
w to
Re
vie
w R
atio
LTHT Peer Average
For peer listing, please see Appendix 2 Source: Dr Foster
Outpatient New to Review Ratio: Selected Specialties - Nov-12 to Oct-13
NB: For DNA Rate and New to Review Ratio, Specialty level peer data is only available on Dr
Foster for the period Nov-12 to Oct-13. Please note that the Trust level (as shown in the
‘Other Key Indicators’ dashboard) provides more up to date data: Dec-12 to Nov-13.
Actions:
At the end of December, there were 4,842 patients waiting more than 3 months over their due date for a review appointment; over half of these were waiting for appointments within the Digestive Diseases CSU. However, the number waiting more than 3 months over their due date has reduced from 1,895 at the end of August to 1,438 at the end of December in Colorectal Surgery.
0
1000
2000
3000
4000
5000
6000
7000
Ap
r-12
Ma
y-1
2
Ju
n-1
2
Ju
l-1
2
Au
g-1
2
Se
p-1
2
Oct-
12
Nov-1
2
Dec-1
2
Ja
n-1
3
Fe
b-1
3
Ma
r-13
Ap
r-13
Ma
y-1
3
Ju
n-1
3
Ju
l-1
3
Au
g-1
3
Se
p-1
3
Oct-
13
Nov-1
3
Dec-1
3
Pa
tie
nts
Ove
rdu
e
No of Patients Waiting >3 Months Past their Due Date for a Review Appointment
0
500
1000
1500
2000
2500
Ap
r-12
Ma
y-1
2
Ju
n-1
2
Ju
l-1
2
Au
g-1
2
Se
p-1
2
Oct-
12
Nov-1
2
Dec-1
2
Ja
n-1
3
Fe
b-1
3
Ma
r-13
Ap
r-13
Ma
y-1
3
Ju
n-1
3
Ju
l-1
3
Au
g-1
3
Se
p-1
3
Oct-
13
Nov-1
3
Dec-1
3
Pa
tie
nts
Ove
rdu
e
Number of Colorectal Patients Waiting >3 Months Past their Due Date for a Review Appointment
No of Colorectal Patients Waiting Over 3 Months Achieve Trajectory

Page 38 of 47
Choose and Book (CAB) – ASIs
Specialty Name ASIs
2 Week Wait Suspected Cancer 111
Cardiology 18
Children's & Adolescent Services 29
Dermatology 21
Diabetic Medicine 1
Diagnostic Physiological Measurement 41
Ear, Nose & Throat 22
Endocrinology and Metabolic Medicine 74
Geriatric Medicine 3
GI and Liver (Medicine and Surgery) 46
Gynaecology 9
Infectious Diseases 1
Neurology 53
Ophthalmology 11
Orthopaedics 8
Respiratory Medicine 5
Rheumatology 9
Surgery - Breast 70
Surgery - Not Otherwise Specified 5
Surgery - Plastic 3
Surgery - Vascular 13
Grand Total 553
ASIs - December 2013
Local Contractual Indicator
Aim: Reduce the number of appointment slot issues (ASIs) to no worse than 2% above the national average. Owner: Director of Informatics, CSU Business Managers, CSU Clinical Directors Consequence of failure: Reputation, timely access to treatment, patient experience, clinical outcomes & financial penalty.
CAB ASIs is a percentage of ASIs generated from within Choose and Book out of all Directly Bookable Service (DBS) bookings.
0%
2%
4%
6%
8%
10%
12%
14%
16%
18%
20%
Ap
r-12
Ma
y-1
2
Ju
n-1
2
Ju
l-1
2
Au
g-1
2
Se
p-1
2
Oct-
12
Nov-1
2
Dec-1
2
Ja
n-1
3
Fe
b-1
3
Ma
r-13
Ap
r-13
Ma
y-1
3
Ju
n-1
3
Ju
l-1
3
Au
g-1
3
Se
p-1
3
Oct-
13
Nov-1
3
Dec-1
3
% A
SIs
Choose and Book - Appointment Slot Issues (ASIs)
LTHT National Penalty Threshold

Page 39 of 47
CAB - Utilisation
Internal Indicator
Aim: Improve the percentage of appointments booked via CAB out of all first GP referrals to the target level of 90%. Owner: Director of Informatics, CSU Business Managers, CSU Clinical Directors Consequence of failure: Reputation, timely access to treatment, patient experience, clinical outcomes.
CAB utilisation is a national measure based on bookings made via the CAB system out of the estimated total number of GP referrals to first outpatient appointments.
0%
10%
20%
30%
40%
50%
60%
70%
80%
90%
100%
Ap
r-12
Ma
y-1
2
Ju
n-1
2
Ju
l-1
2
Au
g-1
2
Se
p-1
2
Oct-
12
Nov-1
2
Dec-1
2
Ja
n-1
3
Fe
b-1
3
Ma
r-13
Ap
r-13
Ma
y-1
3
Ju
n-1
3
Ju
l-1
3
Au
g-1
3
Se
p-1
3
Oct-
13
Nov-1
3
Dec-1
3
% U
tilisa
tio
n
Choose and Book - % Utilisation
% Utilisation Target

Page 40 of 47
Workforce
CSU Dec-13
Medicines Management and Pharmacy Services 82.3%
Radiology 82.2%
Urgent Care 65.0%
Adult Therapies 62.5%
Leeds Dental Institute 61.0%
Cardio-Respiratory 57.0%
Digestive Diseases 54.5%
Hepatorenal 52.2%
Women's 50.8%
Adult Theatres & Anaesthesia 49.3%
Pathology 49.2%
Acute Medicine 45.2%
Head & Neck 44.8%
Leeds Cancer Centre 44.6%
Centre for Neurosciences 42.8%
Trauma & Related Services 42.7%
Adult Critical Care 42.3%
Children's 40.1%
Chapel Allerton 39.3%
Outpatients 38.1%
Trust 49.9%1 Percentage of staff who have an in date appraisal at month end.
Staff Appraised (Ranked by Attainment) 1
National Indicator / Quality Requirement
Aims:
Reduce sickness absence rates to be in line with the internally agreed trajectory. Current local target is 3.86%.
Meet local target: to ensure 95% of staff have a high quality annual appraisal. Owner: Director of Human Resources and CSU Clinical Directors Consequence of failure:
Sickness absence reduces productivity, places a greater reliance on variable staffing and adversely affects quality.
A failure to appraise staff has a negative impact on staff engagement, productivity and quality.
Actions:
Appraisals: Targeted interventions will be undertaken to ensure appraisals are completed by year end. In addition, the Trust‟s Appraisal Policy will be re-launched for 2014/15 as part of the on-going staff engagement work.
Sickness: Focused interventions will be undertaken by a dedicated Attendance Management Team, and a review of health and wellbeing activities completed in order to improve attendance. A review of the Firstcare solution will also take place to ensure that the Trust continues to achieves maximum benefits from the system.
CSU Dec-13Jan-13 to Dec-13
(12 Month Rolling Average)
Adult Therapies 3.0% 2.2%
Head & Neck 3.0% 3.5%
Leeds Cancer Centre 4.3% 3.7%
Trauma & Related Services 2.4% 3.8%
Leeds Dental Institute 4.1% 3.9%
Centre for Neurosciences 3.7% 4.1%
Radiology 6.9% 4.1%
Children's 4.2% 4.1%
Cardio-Respiratory 4.5% 4.2%
Medicines Management and Pharmacy Services 5.0% 4.2%
Adult Critical Care 5.0% 4.3%
Pathology 4.5% 4.3%
Digestive Diseases 6.5% 4.4%
Urgent Care 5.3% 4.6%
Acute Medicine 5.5% 4.7%
Women's 3.4% 5.2%
Chapel Allerton 6.5% 5.3%
Hepatorenal 6.0% 5.5%
Adult Theatres & Anaesthesia 4.7% 5.6%
Outpatients 4.7% 5.7%
Trust 4.7% 4.2%
Sickness Absence Rate (Ranked by 12 Month Rolling Average)
CSU Dec-13Jan-13 to Dec-13
(12 Month Rolling Average)
Adult Critical Care 0.4% 6.5%
Radiology 0.3% 7.2%
Hepatorenal 0.5% 7.5%
Chapel Allerton 0.4% 7.6%
Medicines Management and Pharmacy Services 0.6% 8.0%
Adult Theatres & Anaesthesia 0.1% 8.0%
Leeds Cancer Centre 0.9% 8.0%
Pathology 1.0% 9.0%
Outpatients 0.0% 9.3%
Head & Neck 0.8% 9.8%
Cardio-Respiratory 0.5% 9.9%
Women's 0.6% 11.0%
Digestive Diseases 0.5% 11.3%
Urgent Care 0.7% 11.4%
Children's 0.9% 11.6%
Centre for Neurosciences 0.8% 12.9%
Adult Therapies 0.5% 15.1%
Acute Medicine 1.9% 15.4%
Trauma & Related Services 1.5% 18.3%
Leeds Dental Institute 10.2% 26.2%
Trust 1.0% 10.8%2 Excluding Training Grade Doctors
Staff Turnover (Ranked by 12 Month Rolling Average) 2

Page 41 of 47
Finance
AF Finance D ashboard
In-Year Financial Delivery Indicators - December 2013
Category Indicator Plan £'000 Actual £'000 Variance £'000
NHS Financial Performance
Year to Date, Actual compared to Plan 12,412 (1,488) (13,900)
Forecast Outturn, Compared to Plan 1,418 609 (809)
Financial Efficiency
Actual Efficiency for Year to Date compared to Plan 24,698 22,021 (2,677)
Recurrent Efficiencies for Year to Date compared to Plan 11,991 10,163 (1,828)
Forecast Outturn Efficiency Compared to Plan 40,242 37,479 (2,763)
Recurrent Efficiencies for Forecast Outturn compared to Plan 20,448 18,604 (1,844)
Underlying Revenue Position
Forecast Outturn Underlying Revenue Position compared to plan (18,376) (6,074) 12,302
Cash and Capital
Forecast Year End Charge to Capital Resource Limit 27,312 22,262 5,050
Temporary PDC for Liquidity Purposes (cumulative sum) 0 0 0
Funding Accessed (cumulative sum) 0 0 0
Progress Towards Foundation Trust Status - December 2013
Category Indicator Plan £'000 Actual £'000 Variance £'000
Progress Towards FT Status
EBITDA Margin Achieved: Year to Date 3 2 (1)
EBITDA Margin Achieved: Forecast Outturn 3 3 0
EBITDA Percentage of Plan: Year to Date 3 3 0
EBITDA Percentage of Plan: Forecast Outturn 3 3 0
Net Return After Financing: Year to Date 4 2 (2)
Net Return After Financing: Forecast Outturn 3 3 0
I&E Surplus Margin net of Dividend: Year to Date 3 2 (1)
I&E Surplus Margin net of Dividend: Forecast Outturn 2 2 0
Liquidity Ratio Days (including NWCF): Year to Date 3 3 0
Liquidity Ratio Days (including NWCF): Forecast Outturn 3 3 0
Combined Financial Risk Rating: Year to Date 3 2 (1)
Combined Financial Risk Rating: Forecast Outturn 3 3 0
Category Indicator Plan £'000 Actual £'000 Variance £'000
Progress Towards FT Status
Liquidity Days 3 2 (1)
Capital Services Capacity 3 2 (1)
Combined Risk Rating
Co
ntin
uity o
f
Se
rvic
es R
isk
Ra
tin
gs
Fin
an
cia
l R
isk R
atin
gs
In-Y
ea
r F
ina
ncia
l D
elive
ry
National Indicators / Quality Requirements - AF Finance
National Indicators / Quality Requirements - AF Finance
National Indicators / Quality Requirements - AF Finance

Page 42 of 47
Finance - In-Year Financial Delivery Indicators
Finance - Progress Towards Foundation Trust Status
National Indicator / Quality Requirement National Indicator / Quality Requirement
Income and Expenditure (I&E) is currently showing a significant adverse variance, but this is against the TDA submitted plan which is now phased differently to the Board reported plan. The actual reported I&E variance currently stands at £2.6 million adverse, and is primarily the result of under-trading against activity plans, and expenditure incurred in the independent sector. The Trust still has a forecast out-turn of £99k surplus as reported to the TDA as part of the 2014/15 annual financial plan submission on 13th January. The outturn included in this return is that reported after technical adjustments relating to income received from the Charitable Trustees. CIP performance is behind plan on a number of specific schemes, but is not forecast to significantly worsen between now and the end of the financial year. Forecast Capital Resource Limit (CRL) is showing an undershoot of £5 million as a result of the receipt from the Seacroft land sale. Capital receipts are a credit to the CRL charge. Accountability Framework Summary Performance
The Trust reported a year to date I&E deficit of £1,488k against a TDA planned surplus of £12,412k, resulting in an adverse variance of £13,900k.
The I&E variance is forecast to achieve a £99k surplus by the end of the year before technical adjustments which will result in a £809k deficit. CIPs are forecast to under achieve by £2,763k
Although there is an under-achievement against CIP plans of £2,677k year-to-date, a regular monthly process of reporting and managing savings plans should ensure that this does not get significantly worse by year-end.
The Trust is reporting an overall Financial Risk Rating of 2 for the end of December which will increase to 3 at the year end with I&E break even. The new Continuity of Service ratings are discussed individually below but the overall score is 2. Aspirant Trusts should aim for 3.
Indicator Comment
Monitor Combined - Liquidity
Liquidity at the month end was -13 days which equates to a rating of 2. Liquidity has improved from -16 days at the end of October but is forecast to remain at 2 at the year end.
Total Capital servicing capacity is 1.7 at the end of December compared to 1.56 at the end of October. This equates to a score of 2 where it is forecast to remain at the year end.

Page 43 of 47
Internal Indicators Dashboard
Indicator Oct-13 Nov-13 Dec-13 YTD
RTT clearance time: total (weeks) < 8 10.8 10.6 10.2 n/app
RTT clearance time: over 18 weeks (weeks) < 0.5 0.6 0.6 1.0 n/app
RTT: Patients Waiting Over 18 Weeks at Month-End (Incomplete) - Admitted 1,120 968 912 n/app
Cancelled Operations: Last Minute Cancellations for Non-Clinical Reasons
A&E: Time from arrival to initial full assessment (mins) - 95th percentile < 15 15 17 16 16
A&E: Time from arrival to treatment (mins) - median < 60 77 79 78 78
A&E: % Unplanned follow-up re-attendances within 7 days < 5% 7.9% 6.8% 8.1% 7.9%
A&E: % Patients leaving A&E unseen < 5% 3.1% 3.1% 3.0% 3.4%
A&E: Number of trolley waits greater than 12 hours 0 0 0 0
Patient handovers taking longer than 15 minutes between ambulance and A&E 790 709 780 6034
Patient handovers taking longer than 30 minutes between ambulance and A&E 57 36 46 403
Patient handovers taking longer than 60 minutes between ambulance and A&E 10 3 1 25
Cancer 62 days: referrals following consultant upgrade > 85% 87.9% 50.0%Reported a month
in arrears82.3%
Stroke patients spending at least 90% of their time in hospital on a stroke unit > 80% 79.4% 72.3%Reported a month
in arrears82.3%
Proportion of high-risk TIA patients investigated and treated within 24 hours of first contact with a health professional 70.6% 82.1%Reported a month
in arrears76.2%
MRSA Screening > 95% 92.9% 97.0% 96.5% 95.6%
CDI cases: Rate per 100,000 Occupied Bed Days 26.5 27.3 25.3 24.6
Harm Free Care: % of Patients With Falls Resulting in Harm (Snapshot) 1.2% 1.2% 0.5% n/app
Harm Free Care: % of Patients With UTIs (new and old) (Snapshot) 3.1% 3.9% 4.1% n/app
Number of complaints 83 79 62 802
OP Measure: DNA rate Peer ave: 8.6%
12,093 12,026 8,103 104,802
9.8% 10.5% 9.0% 10.5%
9,891 8,600 7,016 76,966
8.0% 7.5% 7.8% 7.7%
OP Measure: New to Review ratio Peer ave: 2.3 2.0
Dec-12 to Nov-13
Dec-12 to Nov-13
0
OP Measure: Number of OP Appointment Cancellations By Patient Within 6 Weeks of Appointment (and as % of Total
Bookings)
OP Measure: Number of OP Appointment Cancellations By Hospital Within 6 Weeks of Appointment (and as % of Total
Bookings)
Thresholds
As per NHS Standard
Contract
0
0
0
Q2: 1.2%
As per agreed trajectory
9.5%
Key Indicators (not in other dashboards)

Page 44 of 47
Indicator Oct-13 Nov-13 Dec-13 YTD
OP Activity: New (Attendances) 25,033 23,697 18,111 183,353
OP Activity: Review (Attendances) 61,702 59,002 43,037 439,415
IP Activity: Elective (Spells) 11,371 10,529 7,093 72,483
IP Activity: Non-elective (Spells) 6,256 5,773 5,768 52,074
Length of Stay Peer ave: 4.9
Choose and Book: Appointment Slot Issues 10.7% 11.6% 10.8% 10.9%
Choose & Book utilisation > 90% 59.2% 60.6% 55.8% 59.4%
Research & Innovation (R&I): Activity - Research studies in NIHR portfolio (number) Q2: 343 (2nd) n/app
R&I: Participation - Participants recruited to NIHR Portfolio Studies (number) Q2: 6114 (6th) n/app
R&I: Initiation – all clinical trials should take 70 Days or less from receipt of a valid research application to 1st patient visit
(median) < 70 Q2: 75 days n/app
R&I: Delivery – all commercial clinical trials should recruit the agreed target number of patients within the agreed recruitment
period (%)> 80% Q2: 70% n/app
Dementia Stage 1: Find - % of all patients aged 75 and above admitted as emergency inpatients who are asked the
dementia case finding question within 72 hours of admission or who have a clinical diagnosis of delirium on initial
assessment or known diagnosis of dementia.
94.7% 94.3% 93.7%
Dementia Stage 2: Assess - % of all patients aged 75 and above admitted as emergency inpatients who have scored
positively on the case finding question, or who have a clinical diagnosis of delirium and who do not fall into the exemption
categories reported as having had a dementia diagnostic assessment including investigations.
96.2% 92.0% 94.4%
Dementia Stage 3: Refer - % of all patients aged 75 and above, admitted as an emergency inpatient who have had a
diagnostic assessment (in whom the outcome is either “positive” or “inconclusive”) who are referred for further diagnostic
advice/follow up.
100.0% 94.1% 96.3%
No worse than 2%
above the national
average
Thresholds
Dec-12 to Nov-13 : 5.1
Reported a month
in arrears
Within top 5 Trusts in
England
> 90%
Within top 5 Trusts in
England
Reported quarterly
Key Indicators (not in other dashboards) (continued)

Page 45 of 47
Appendix 1 - Updates
Updates from Regulators
Everyone Counts: Planning for Patients 2014/15 to 2018/191
NHS England has published its planning guidance based on a five-year planning cycle. The focus is intended to be less on what is done for patients and more on the results of what is done. The report outlines the ambitions and outcomes expected, the planning process and the plans to be produced. Delivering the NHS Outcomes Framework and the following five offers remain the focus of the planning guidance:
• NHS Services, seven days a week. • More transparency, more choice. • Listening to patients and increasing their participation. • Better data, informed commissioning, driving improved outcomes. • Higher standards, safer care.
Securing Sustainability: Planning Guidance for Trust Boards 2014/15 to 2018/19
2
The NHS Trust Development Authority (TDA) has also published its planning guidance for Trusts. This guidance sets out, for the first time, a framework to enable NHS Trusts to look in more depth at how they plan to continue to deliver high quality services in a sustainable way over the next five years. In assessing the plans of NHS Trusts, the NHS TDA will consider the credibility of the assumptions made by NHS Trusts before determining whether to support their plan. Where the plan requires significant service change which has not yet been agreed with commissioners, the NHS TDA will support NHS Trusts to take those discussions forward.
Maternity Survey 20133
The Care Quality Commission‟s (CQC) latest survey into women‟s experiences of maternity care shows that improvements have been made over the last 3 years but further progress is needed in some areas. The survey received responses from more than 23,000 women who had a baby in February 2013. 286 women who had a baby at the Trust in February responded to the survey. The results showed that LTHT‟s results were “about the same” as other trusts for “labour and birth” and “staff” but that the Trust did not perform as well as other providers for “care in hospital after birth”.
NHS Waiting Times for Elective Care4
The National Audit Office (NAO) has published a study into the performance, recording and management of elective care waiting times in England. The NAO audited a sample of case files to look for errors in recording or processes. LTHT is mentioned in this report. The pathway that was reviewed by the NAO is one that is shared across provider units. As a result of this report, the Trust is investigating the related administration processes to ensure appropriate reporting is taking place across provider units.
1 Everyone Counts: Planning for Patients 2014/15 to 2018/19
2 Securing Sustainability: Planning Guidance for Trust Boards 2014/15 to 2018/19
3 CQC Maternity Survey 2013
4 NHS Waiting Times for Elective Care

Page 46 of 47
Appendix 2 - Peer Groups
Peer Groups FFT, Complaints, Never Events, OP DNA, OP New to Review and LoS: - Cambridge University Hospitals NHS Foundation Trust - Central Manchester University Hospitals NHS Foundation Trust - Nottingham University Hospitals NHS Trust - Oxford University Hospitals NHS Trust - Royal Liverpool and Broadgreen University Hospitals NHS Trust - Sheffield Teaching Hospitals NHS Foundation Trust - The Newcastle Upon Tyne Hospitals NHS Foundation Trust - University Hospital Of South Manchester NHS Foundation Trust - University Hospital Southampton NHS Foundation Trust - University Hospitals Birmingham NHS Foundation Trust - University Hospitals Bristol NHS Foundation Trust - University Hospitals Of Leicester NHS Trust RTT: As above, plus the following providers: - Guy‟s and St Thomas‟ NHS Foundation Trust - Imperial College Healthcare NHS Trust - King‟s College Hospital NHS Foundation Trust - University College London Hospitals NHS Foundation Trust A&E: - Cambridge University Hospitals NHS Foundation Trust - Central Manchester University Hospitals NHS Foundation Trust - Nottingham University Hospitals NHS Trust - Oxford University Hospitals NHS Trust - Royal Liverpool And Broadgreen University Hospitals NHS Trust - Sandwell And West Birmingham Hospitals NHS Trust - Sheffield Teaching Hospitals NHS Foundation Trust - The Newcastle Upon Tyne Hospitals NHS Foundation Trust - University Hospital Of South Manchester NHS Foundation Trust - University Hospitals Of Leicester NHS Trust
Listed below are the Trusts used to benchmark performance. HCAI: - Brighton & Sussex University Hospitals - Cambridge University Hospitals - Central Manchester University Hospitals - Chelsea & Westminster Hospital - Guy's & St. Thomas' - Imperial College Healthcare - King's College Hospital - Nottingham University Hospitals - Oxford University Hospitals - Plymouth Hospitals - Royal Free Hampstead - Royal Liverpool & Broadgreen University Hospitals - Salford Royal - Sheffield Teaching Hospitals - South Tees Hospitals - St. George's Healthcare - The Newcastle upon Tyne Hospitals - University College London Hospitals - University Hospital Birmingham - University Hospital of South Manchester - University Hospital Southampton - University Hospitals Bristol - University Hospitals Coventry & Warwickshire - University Hospitals of Leicester Cancer: - Cambridge University Hospitals NHS Foundation Trust - Central Manchester University Hospitals NHS Foundation Trust - Nottingham University Hospitals NHS Trust - Sheffield Teaching Hospitals NHS Foundation Trust - The Christie NHS Foundation Trust - The Newcastle Upon Tyne Hospitals NHS Foundation Trust - The Royal Marsden NHS Foundation Trust - University Hospitals Bristol NHS Foundation Trust - University Hospitals of Leicester NHS Trust

Page 47 of 47
Appendix 3 - Glossary
Glossary SJUH - St James's University Hospital TBC - To Be Confirmed TDA - Trust Development Authority VTE - Venous Thromboembolism WHO - World Health Organisation YAS - Yorkshire Ambulance Service YTD - Year to Date
AF - Accountability Framework ASI - Appointment Slot Issue CAB - Choose and Book CAS - Central Alerting System CCG - Clinical Commissioning Group CDI - Clostridium Difficile Infections CIP - Cost Improvement Programme CQC - Care Quality Commission CQUIN - Commissioning for Quality & Innovation CSU - Clinical Service Unit CUTI - Catheter-associated Urinary Tract Infection DBS - Directly Bookable Services DH - Department of Health DNA - Did Not Attend EBITDA - Earnings Before Interest, Tax, Depreciation and Amortisation ED - Emergency Department FFT - Friends and Family Test FT - Foundation Trust GDP - General Dental Practitioners GMP - General Medical Practitioners HCAI - Healthcare Associated Infection HSMR - Hospital Standardised Mortality Ratio I&E - Income & Expenditure IQPR - Integrated Quality & Performance Report KPI - Key Performance Indicator LGI - Leeds General Infirmary LoS - Length of Stay MRSA - Meticillin Resistant Staphylococcus Aureus MSSA - Meticillin Sensitive Staphylococcus Aureus NIHR - National Institute for Health Research R&I - Research & Innovation RAF - Risk Assessment Framework RAG - Red Amber Green RTT - Referral to Treatment SHMI - Summary Hospital-level Mortality Indicator