Truck Rollover Warning Systems Evaluation - … Rollover Warning Systems Evaluation ... • Road...
27
Truck Rollover Warning Systems Evaluation Transportation Research Conference Thursday, November 3, 2016 Tom Sohrweide, PE, PTOE SEH Inc.
Transcript of Truck Rollover Warning Systems Evaluation - … Rollover Warning Systems Evaluation ... • Road...

Truck Rollover Warning Systems Evaluation
Transportation Research Conference
Thursday, November 3, 2016
Tom Sohrweide, PE, PTOE
SEH Inc.

Acknowledgements
• MnDOT
– Dan Rowe
– Terry Haukom
• Contributors
– Image Sensing Systems (ISS), Inc.
– International Road Dynamics (IRD) Corp.
– American Transportation Research Institute (ATRI)

Agenda
• Project Purpose
• Problem Definition
• System Descriptions
• System Data
• System Comparisons
• Summary
• Questions

Project Purpose
Evaluation of two different systems aimed at preventing commercial truck rollover accidents.

The Problem
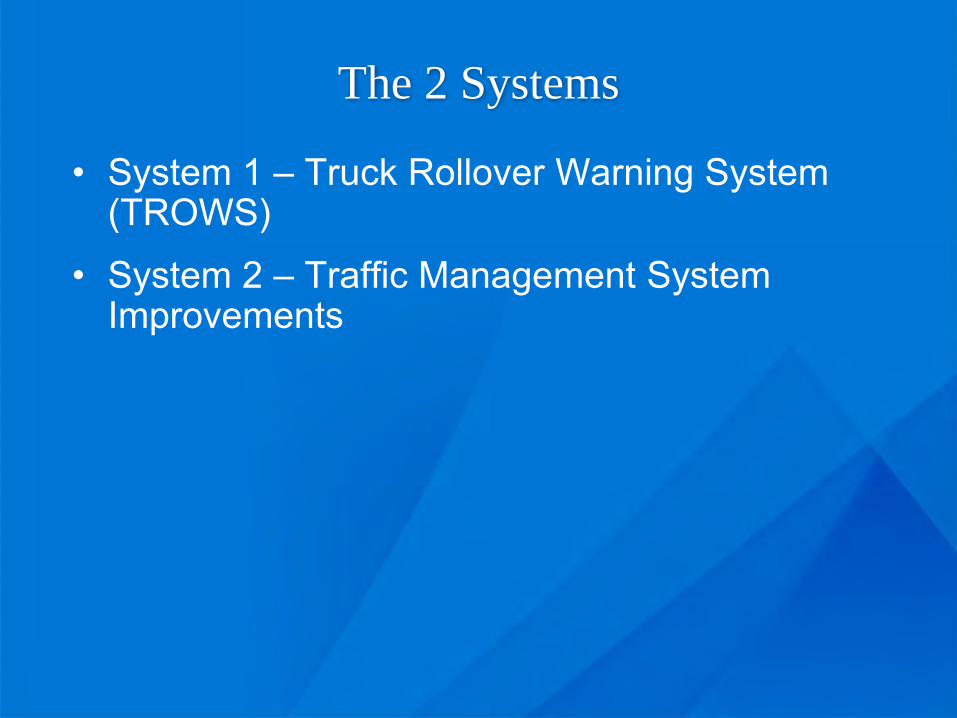
The 2 Systems
• System 1 – Truck Rollover Warning System (TROWS)
• System 2 – Traffic Management System Improvements

System 1
• Ramp from Sbd I-694 to Ebd I-94– Frequency of truck rollovers – one / year
• MnDOT Innovative Idea Project
• Weigh-in-motion sensors and inductive loops– Vehicle classification– Speed/deceleration
• Road surface condition detector
• Warning signs and flashers

System 1 Location

System 1
• September 2012 – MnDOT upgraded signing
• August 2014 – Shadow testing
• September 2014 – Began operation
• July 2015 – Turned over to MnDOT

Signing

Function
Activation Point
Shut Off Point
Sign
Entry/Classification


Speed Measurement Areas
Section 2
Section 3
Section 1

TROWS Speed Comparison
20
22
24
26
28
30
32
34
36
Sect 1 Avg 85th Sect 2 Avg 85th Sect 3 Avg 85th
ATRI Speed Data (mph)
Aug-12 Aug-13 Sep-14 Oct-14 May-15
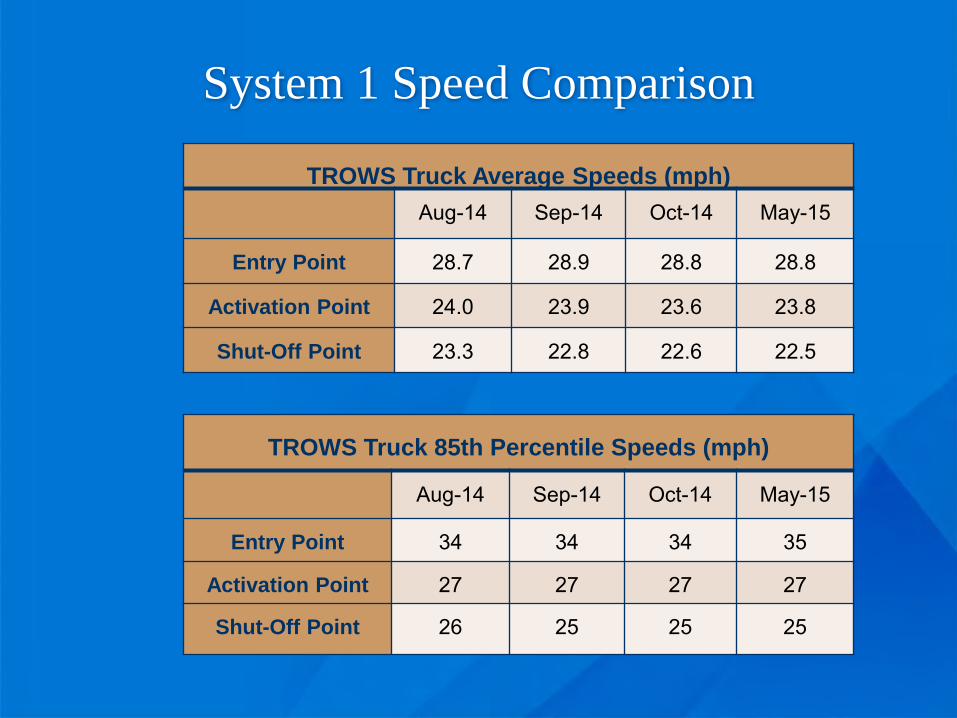
System 1 Speed Comparison
TROWS Truck Average Speeds (mph)
Aug-14 Sep-14 Oct-14 May-15
Entry Point 28.7 28.9 28.8 28.8
Activation Point 24.0 23.9 23.6 23.8
Shut-Off Point 23.3 22.8 22.6 22.5
TROWS Truck 85th Percentile Speeds (mph)
Aug-14 Sep-14 Oct-14 May-15
Entry Point 34 34 34 35
Activation Point 27 27 27 27
Shut-Off Point 26 25 25 25

System 1 Sign Activations
TROWS Sign Activation Data
30 Day
Time Period
# of Trucks
# of Sign Activations
% Trucks Activating Sign
Shadow Test 64,211 50,407 79%
Sept. 2014 70,280 52,371 75%
Oct. 2014 71,237 52,270 73%
May 2015 62,729 48,224 77%

System 2
• Wbd I-94 prior to the Lowry Tunnel– Frequency of truck rollovers – 3 in the past 5 years
• RTMC design which included a micro surface overlay
• Vehicle classification by height and speed by lane
• Warning signs and LED flashing borders
• July 2015 – Began operation

System 2 Location

Signing


System 2 Speed Comparison
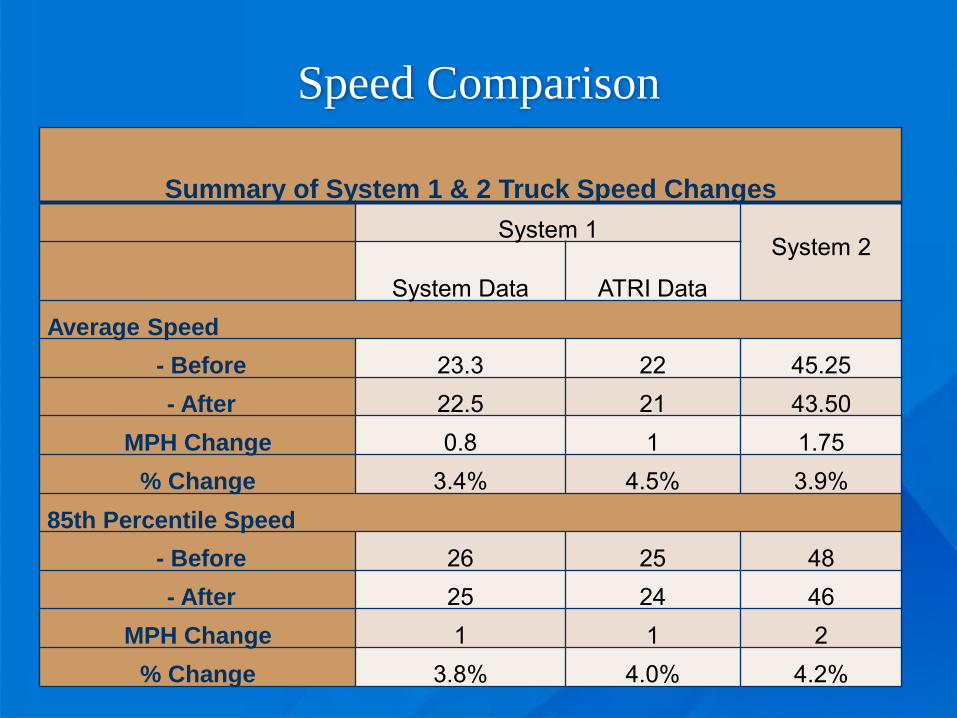
Speed Comparison
Summary of System 1 & 2 Truck Speed Changes
System 1System 2
System Data ATRI DataAverage Speed
- Before 23.3 22 45.25- After 22.5 21 43.50
MPH Change 0.8 1 1.75% Change 3.4% 4.5% 3.9%
85th Percentile Speed
- Before 26 25 48- After 25 24 46
MPH Change 1 1 2% Change 3.8% 4.0% 4.2%

Costs
• System 1 = $257,153– Design, installation, 11 months monitoring,
maintenance, operation, and training
• System 2 = $197,500– Did not include cost of the existing overhead
structures

Summary
• Similar goals with different conditions
• Similar reduction in truck speeds – Statistically significant
• System 2 also showed a reduction in small vehicle speeds
• No rollovers

Questions?