Troubleshooting vSAN Monitoring and · Troubleshooting vSAN Monitoring and Troubleshooting...
52
vSAN Monitoring and Troubleshooting Update 1 Modified 22 FEB 2019 VMware vSphere 6.7 VMware vSAN 6.7
Transcript of Troubleshooting vSAN Monitoring and · Troubleshooting vSAN Monitoring and Troubleshooting...
vSAN Monitoring andTroubleshootingUpdate 1Modified 22 FEB 2019VMware vSphere 6.7VMware vSAN 6.7

vSAN Monitoring and Troubleshooting
VMware, Inc. 2
You can find the most up-to-date technical documentation on the VMware website at:
https://docs.vmware.com/
If you have comments about this documentation, submit your feedback to
Copyright © 2019 VMware, Inc. All rights reserved. Copyright and trademark information.
VMware, Inc.3401 Hillview Ave.Palo Alto, CA 94304www.vmware.com

Contents
About vSAN Monitoring and Troubleshooting 5
Updated Information 6
1 Introduction to vSAN 7
2 Monitoring the vSAN Cluster 8
Monitor vSAN Capacity 8
Monitor Physical Devices 10
Monitor Devices that Participate in vSAN Datastores 10
Monitor Virtual Objects in the vSAN Cluster 11
About vSAN Cluster Resynchronization 11
About vSAN Cluster Rebalancing 13
Using the vSAN Default Alarms 15
Using the VMkernel Observations for Creating Alarms 16
3 Monitoring vSAN Health 18
About the vSAN Health Service 18
Check vSAN Health 20
Monitor vSAN from ESXi Host Client 21
Proactive Tests 21
4 Monitoring vSAN Performance 22
About the vSAN Performance Service 22
Configure vSAN Performance Service 23
Use Saved Time Range 24
View vSAN Cluster Performance 25
View vSAN Host Performance 26
View vSAN VM Performance 28
Using vSAN Performance Diagnostics 29
5 Handling Failures and Troubleshooting vSAN 31
Uploading a vSAN Support Bundle 31
Using Esxcli Commands with vSAN 32
vSAN Configuration on an ESXi Host Might Fail 34
Not Compliant Virtual Machine Objects Do Not Become Compliant Instantly 35
vSAN Cluster Configuration Issues 35
Handling Failures in vSAN 36
VMware, Inc. 3

Shutting Down and Restarting the vSAN Cluster 51
vSAN Monitoring and Troubleshooting
VMware, Inc. 4
About vSAN Monitoring andTroubleshooting
vSAN Monitoring and Troubleshooting describes how to monitor and troubleshoot VMware vSAN® byusing the vSphere Client, esxcli and RVC commands, and other tools.
Intended AudienceThis manual is intended for anyone who wants to monitor vSAN operation and performance, ortroubleshoot problems with a vSAN cluster. The information in this manual is written for experiencedsystem administrators who are familiar with virtual machine technology and virtual datacenter operations.This manual assumes familiarity with VMware vSphere, including VMware ESXi, vCenter Server, and thevSphere Client.
For more information about vSAN and how to create a vSAN cluster, see the vSAN Planning andDeployment Guide.
For more information about vSAN features and how to configure a vSAN cluster, see AdministeringVMware vSAN.
vSphere Client and vSphere Web ClientInstructions in this guide reflect the vSphere Client (an HTML5-based GUI). You can also use theinstructions to perform the tasks by using the vSphere Web Client (a Flex-based GUI).
Tasks for which the workflow differs significantly between the vSphere Client and the vSphere Web Clienthave duplicate procedures that provide steps according to the respective client interface. The proceduresthat relate to the vSphere Web Client, contain vSphere Web Client in the title.
Note In vSphere 6.7 Update 1, almost all of the vSphere Web Client functionality is implemented in thevSphere Client. For an up-to-date list of any remaining unsupported functionality, see FunctionalityUpdates for the vSphere Client.
VMware, Inc. 5

Updated Information
This vSAN Monitoring and Troubleshooting guide is updated with each release of the product or whennecessary.
This table provides the update history of the vSAN Monitoring and Troubleshooting guide.
Revision Description
22 Feb 2019 Clarified verbose mode and the network diagnostic mode. See Configure vSAN Performance Service.
18 April 2018 Initial release.
VMware, Inc. 6

Introduction to vSAN 1VMware vSAN is a distributed layer of software that runs natively as a part of the ESXi hypervisor. vSANaggregates local or direct-attached capacity devices of a host cluster and creates a single storage poolshared across all hosts in the vSAN cluster.
While supporting VMware features that require shared storage, such as HA, vMotion, and DRS, vSANeliminates the need for external shared storage and simplifies storage configuration and virtual machineprovisioning activities.
VMware, Inc. 7
Monitoring the vSAN Cluster 2You can monitor the vSAN cluster and all the objects related to it.
You can monitor all of the objects in a vSAN environment, including hosts that participate in a vSANcluster and the vSAN datastore. For more information about monitoring objects and storage resources ina vSAN cluster, see the vSphere Monitoring and Performance documentation.
This chapter includes the following topics:n Monitor vSAN Capacity
n Monitor Physical Devices
n Monitor Devices that Participate in vSAN Datastores
n Monitor Virtual Objects in the vSAN Cluster
n About vSAN Cluster Resynchronization
n About vSAN Cluster Rebalancing
n Using the vSAN Default Alarms
n Using the VMkernel Observations for Creating Alarms
Monitor vSAN CapacityYou can monitor the capacity of the vSAN datastore, deduplication and compression efficiency, and abreakdown of capacity use.
The cluster Summary page includes a summary of vSAN capacity. You also can view more detailedinformation in the Capacity monitor.
VMware, Inc. 8

Procedure
1 Navigate to the vSAN cluster.
2 Click the Monitor tab.
Option Description
vSphere Client Under vSAN, click Capacity to view vSAN capacity information.
vSphere Web Client a Click vSAN.
b Click Capacity to view vSAN capacity information.
The Capacity Overview displays the storage capacity of the vSAN datastore, including used space andfree space. The Used Capacity Breakdown displays the percentage of capacity used by different objecttypes or data types. If you select Data types, vSAN displays the percentage of capacity used by primaryVM data, vSAN overhead, and temporary overhead. If you select Object types, vSAN displays thepercentage of capacity used by the following object types:
n Virtual disks
n VM home objects
n Swap objects
n Performance management objects
n Vmem objects
n File system overhead
vSAN Monitoring and Troubleshooting
VMware, Inc. 9

n Checksum overhead
n Deduplication and compression overhead
n Space under deduplication engine consideration
n iSCSI home and target objects, and iSCSI LUNs
n Other, such as user-created files, VM templates, and so on
You can check the history of capacity usage in the vSAN datastore. Click Capacity History, select a timerange, and click Show Results.
If you enable deduplication and compression on the cluster, the Deduplication and CompressionOverview displays capacity information related to that feature. When you enable deduplication andcompression, it might take several minutes for capacity updates to be reflected in the Capacity monitor,as disk space is reclaimed and reallocated. For more information about deduplication and compression,see "Using Deduplication and Compression" in Administering VMware vSAN.
Monitor Physical DevicesYou can monitor hosts, cache devices, and capacity devices used in the vSAN cluster.
Procedure
1 Navigate to the vSAN cluster.
2 Click the Monitor tab.
3 Click Physical Disks to review all hosts, cache devices, and capacity devices in the cluster. vSANdisplays information about capacity devices, such as total capacity, used capacity, reserved capacity,functional status, physical location, and so on. The physical location is based on the hardwarelocation of cache and capacity and devices on vSAN hosts.
Monitor Devices that Participate in vSAN DatastoresVerify the status of the devices that back up the vSAN datastore. You can check whether the devicesexperience any problems.
Procedure
1 Navigate to Storage.
2 Select the vSAN datastore.
3 Click the Configure tab.
You can view general information about the vSAN datastore, including capacity, capabilities, and thedefault storage policy.
vSAN Monitoring and Troubleshooting
VMware, Inc. 10

4 Display information about local devices.
a Click Disk Management and select the disk group to display local devices in the table at thebottom of the page.
b Click Capacity to review information about the amount of capacity provisioned and used in thecluster, and also to review a breakdown of the used capacity by object type or by data type.
Monitor Virtual Objects in the vSAN ClusterYou can view the status of virtual objects in the vSAN cluster.
When one or more hosts are unable to communicate with the vSAN datastore, the information aboutvirtual objects might not displayed.
Procedure
1 Navigate to the vSAN cluster.
2 Click the Monitor tab.
3 Under vSAN, select Virtual Objects to view the corresponding virtual objects in the vSAN cluster.
a Select an object type in the Affected inventory objects area at the top of the page to displayinformation about each object, such as health and availability, storage policy, and vSAN UUID.
b Select the check box on one of the virtual objects and click View Placement details to open thePhysical Placement dialog. You can view device information, such as name, identifier or UUID,number of devices used for each virtual machine, and how they are mirrored across hosts.
c On the Physical Placement dialog, check the Group components by host placement check boxto organize the objects by host and by disk.
About vSAN Cluster ResynchronizationYou can monitor the status of virtual machine objects that are being resynchronized in the vSAN cluster.
When a hardware device, host, or network fails, or if a host is placed into maintenance mode, vSANinitiates resynchronization in the vSAN cluster. However, vSAN might briefly wait for the failedcomponents to come back online before initiating resynchronization tasks.
The following events trigger resynchronization in the cluster:
n Editing a virtual machine (VM) storage policy. When you change VM storage policy settings, vSANmight initiate object recreation and subsequent resynchronization of the objects.
Certain policy changes might cause vSAN to create another version of an object and synchronize itwith the previous version. When the synchronization is complete, the original object is discarded.
vSAN ensures that VMs continue to run, and resynchronization does not interrupt their operation.This process might require additional temporary capacity.
n Restarting a host after a failure.
vSAN Monitoring and Troubleshooting
VMware, Inc. 11

n Recovering hosts from a permanent or long-term failure. If a host is unavailable for more than 60minutes (by default), vSAN creates copies of data to recover the full policy compliance.
n Evacuating data by using the Full data migration mode before you place a host in maintenance mode.
n Exceeding the capacity threshold of a capacity device. Resynchronization is triggered when acapacity device in the vSAN cluster approaches or exceeds the threshold level of 80 percent.
If a VM is not responding due to latency caused by resynchronization, you can throttle the IOPS used forresynchronization.
Monitor the Resynchronization Tasks in the vSAN ClusterTo evaluate the status of objects that are being resynchronized, you can monitor the resynchronizationtasks that are currently in progress.
Prerequisites
Verify that hosts in your vSAN cluster are running ESXi 6.5 or later.
Procedure
1 Navigate to the vSAN cluster.
2 Select the Monitor tab.
3 (Optional) On the vSphere Web Client, click vSAN.
4 Select Resyncing Objects.
5 Track the progress of resynchronization of virtual machine objects. You can view the number of bytesthat are remaining before the resynchronization is complete.
You can also view information about the number of objects that are currently being synchronized inthe cluster, the estimated time to finish the resynchronization, the time remaining for the storageobjects to fully comply with the assigned storage policy, and so on.
The Object Repair Time defines the time vSAN waits before repairing a non-compliant object afterplacing a host in a failed state or maintenance mode. The default setting is 60 minutes. To change thesetting, edit the Object Repair Timer (Configure > vSAN > Services > Advanced Options).
If your cluster has connectivity issues, the data on the Resyncing Objects page might not getrefreshed as expected. The fields might reflect inaccurate information.
Throttle Resynchronization Activity in the vSAN ClusterYou can reduce the number of IOPS used to perform resynchronization on disk groups in the vSANcluster. Resynchronization throttling is a cluster-wide setting, and it is applied on a per disk group basis.
If VMs are not responding due to latency caused by resynchronization, you can throttle the number ofIOPS used for resynchronization. Consider resynchronization throttling only if latencies are rising in thecluster due to resynchronization, or if resynchronization traffic is too high on a host.
vSAN Monitoring and Troubleshooting
VMware, Inc. 12

Resynchronization throttling can increase the time required to complete resynchronization. Reprotectionof non-compliant VMs might be delayed.
Procedure
1 Navigate to the vSAN cluster.
2 Select the Monitor tab.
3 (Optional) On the vSphere Web Client, click vSAN.
4 Select Resyncing Objects and click Resync Throttling.
5 (Optional) Click Show current resync traffic per host to view resynchronization activity.
6 Select the Enable throttling for resyncing objects traffic check box.
7 Move the slider to set the throttle, as follows:
n Move the slider to the right to increase the amount of IOPS allowed for resynchronization.
n Move the slider to the left to decrease the amount of IOPS allowed for resynchronization.
A general rule is to throttle the IOPS by half and allow some time for the cluster to adapt. If furtheraction is needed, throttle the IOPS by half again until the cluster stabilizes.
8 Click Apply or OK.
About vSAN Cluster RebalancingWhen any capacity device in your cluster reaches 80 percent full, vSAN automatically rebalances thecluster, until the space available on all capacity devices is below the threshold.
Cluster rebalancing evenly distributes resources across the cluster to maintain consistent performanceand availability.
The following operations can cause disk capacity to reach 80% and initiate cluster rebalancing:
n Hardware failures occur on the cluster.
n vSAN hosts are placed in maintenance mode with the Evacuate all data option.
n vSAN hosts are placed in maintenance mode with Ensure data accessibility when objects assignedPFTT=0 reside on the host.
Note To provide enough space for maintenance and reprotection, and to minimize automaticrebalancing events in the vSAN cluster, consider keeping 30-percent capacity available at all times.
You can manually rebalance the vSAN cluster by using the Ruby vSphere Console (RVC). See ManualRebalance.
Automatic RebalanceBy default, vSAN automatically rebalances the vSAN cluster when a capacity device reaches 80 percentfull. Rebalancing also occurs when you place a vSAN host in maintenance mode.
vSAN Monitoring and Troubleshooting
VMware, Inc. 13

Run the following RVC commands to monitor the rebalance operation in the cluster:
n vsan.check_limits. Verifies whether the disk space use is balanced in the cluster.
n vsan.whatif_host_failures. Analyzes the current capacity use per host, interprets whether asingle host failure can force the cluster to run out of space for reprotection, and analyzes how a hostfailure might impact cluster capacity, cache reservation, and cluster components.
The physical capacity use shown as the command output is the average use of all devices in thevSAN cluster.
n vsan.resync_dashboard. Monitors any rebuild tasks in the cluster.
For information about the RVC command options, see the RVC Command Reference Guide.
Manual RebalanceYou can manually rebalance through the cluster health check, or by using RVC commands.
If the vSAN disk balance health check fails, you can initiate a manual rebalance. Under Cluster health,access the vSAN Disk Balance health check, and click the Rebalance Disks button.
Use the following RVC commands to manually rebalance the cluster:
n vsan.check_limits. Verifies whether any capacity device in the vSAN cluster is approaching the 80percent threshold limit.
n vsan.health.cluster_rebalance <cluster>. Manually starts the rebalance operation. When yourun the command, vSAN scans the cluster for the current distribution of components, and begins tobalance the distribution of components in the cluster. Use the command options to specify how longto run the rebalance operation in the cluster, and how much data to move each hour for each vSANhost. For more information about the command options for managing the rebalance operation in thevSAN cluster, see the RVC Command Reference Guide.
Because cluster rebalancing generates substantial I/O operations, it can be time-consuming and canaffect the performance of virtual machines.
Note When you manually rebalance the disks, the operation runs for the selected time period, until nomore data needs to be moved. The default time period is 24 hours. If no data is being moved, vSAN endsthe rebalancing task.
You can configure an alarm that notifies you when the provisioned space reaches a certain threshold. See Creating a vCenter Server Alarm for a vSAN Event.
Balance the Disk Use in the vSAN ClusterIf your vSAN cluster becomes unbalanced, you can rebalance the disk use.
If you remove capacity devices from the vSAN cluster, the disk groups might become unbalanced. If youadd hosts or capacity devices to the vSAN cluster, the disk groups might become unbalanced.
When vSAN health service warns you about any unbalances, you can rebalance your cluster.
vSAN Monitoring and Troubleshooting
VMware, Inc. 14

Prerequisites
Perform the rebalance operation during non-production hours to avoid excessive impact on the cluster.
Procedure
1 Navigate to the vSAN cluster.
2 Click the Monitor tab.
Option Description
vSphere Client a Under vSAN, select Health.
b Expand the Cluster health category, and select vSAN Disk Balance. You canreview the disk balance of the hosts.
c In the vSAN Disk Balance page, click Disk Balance.
vSphere Web Client a Click vSAN.
b Under vSAN, click Health.
c Expand the Cluster health category, and select vSAN Disk Balance. You canreview the disk balance of the hosts.
3 Click the Proactive Rebalance Disks button to rebalance your cluster.
This operation moves components from the over-utilized disks to the under-utilized disks.
Using the vSAN Default AlarmsYou can use the default vSAN alarms to monitor the cluster, hosts, and existing vSAN licenses.
The default alarms are automatically triggered when the events corresponding to the alarms are activatedor if one or all the conditions specified in the alarms are met. You cannot edit the conditions or delete thedefault alarms. To configure alarms that are specific to your requirements, create custom alarms forvSAN. See Creating a vCenter Server Alarm for a vSAN Event.
For information about monitoring alarms, events, and editing existing alarm settings, see the vSphereMonitoring and Performance documentation.
View vSAN Default AlarmsUse the default vSAN alarms to monitor your cluster, hosts, analyze any new events, and assess theoverall cluster health.
Procedure
1 Navigate to the vSAN cluster.
2 Click Configure and then click Alarm Definitions.
3 In the search box, type vSAN as the search term to display the alarms that are specific to vSAN.
Type vSAN Health Service Alarm to search for vSAN health service alarms.
The default vSAN alarms are displayed.
4 From the list of alarms, click each alarm to view the alarm definition.
vSAN Monitoring and Troubleshooting
VMware, Inc. 15

Using the VMkernel Observations for Creating AlarmsVMkernel Observations (VOBs) are system events that you can use to set up vSAN alarms for monitoringand troubleshooting performance and networking issues in the vSAN cluster. In vSAN, these events areknown as observations.
VMware ESXi Observation IDs for vSANEach VOB event is associated with an identifier (ID). Before you create a vSAN alarm in the vCenterServer, you must identify an appropriate VOB ID for the vSAN event for which you want to create an alert.You can create alerts in the VMware ESXi Observation Log file (vobd.log). For example, use thefollowing VOB IDs to create alerts for any device failures in the cluster.
n esx.problem.vob.vsan.lsom.diskerror
n esx.problem.vob.vsan.pdl.offline
To review the list of VOB IDs for vSAN, open the vobd.log file located on your ESXi host inthe /var/log directory. The log file contains the following VOB IDs that you can use for creating vSANalarms.
Table 2‑1. VOB IDs for vSAN
VOB ID Description
esx.audit.vsan.clustering.enabled The vSAN clustering service is enabled.
esx.clear.vob.vsan.pdl.online The vSAN device has come online.
esx.clear.vsan.clustering.enabled The vSAN clustering service is enabled.
esx.clear.vsan.vsan.network.available vSAN has one active network configuration.
esx.clear.vsan.vsan.vmknic.ready A previously reported vmknic has acquired a valid IP.
esx.problem.vob.vsan.lsom.componentthreshold vSAN reaches the near node component count limit.
esx.problem.vob.vsan.lsom.diskerror A vSAN device is in a permanent error state.
esx.problem.vob.vsan.lsom.diskgrouplimit vSAN fails to create a disk group.
esx.problem.vob.vsan.lsom.disklimit vSAN fails to add devices to a disk group.
esx.problem.vob.vsan.lsom.diskunhealthy vSAN disk is unhealthy.
esx.problem.vob.vsan.pdl.offline A vSAN device is offline.
esx.problem.vsan.clustering.disabled vSAN clustering services are disabled.
esx.problem.vsan.lsom.congestionthreshold vSAN device memory or SSD congestion has been updated.
esx.problem.vsan.net.not.ready A vmknic is added to vSAN network configuration without a valid IP address.This happens when the vSAN network is not ready.
esx.problem.vsan.net.redundancy.lost The vSAN network configuration does not have the required redundancy.
esx.problem.vsan.no.network.connectivity vSAN does not have existing networking configuration, which is in use.
esx.problem.vsan.vmknic.not.ready A vmknic is added to the vSAN network configuration without a valid IPaddress.
vSAN Monitoring and Troubleshooting
VMware, Inc. 16

Creating a vCenter Server Alarm for a vSAN EventYou can create alarms to monitor events on the selected vSAN object, including the cluster, hosts,datastores, networks, and virtual machines.
Prerequisites
You must have the required privilege level of Alarms.Create Alarm or Alarm.Modify Alarm
Procedure
1 Select the vCenter Server object in the inventory that you want to monitor.
2 Click the Configure tab > Alarm Definitions > click the icon.
3 Type a name and description for the new alarm.
4 From the Monitor drop-down menu, select the object on which you want to configure an alarm.
5 Click the specific event occurring on this object for example VM Power On and click Next.
6 Click Triggers to add a vSAN event that will trigger the alarm. The options on the Triggers pagechange depending on the type of activity you plan to monitor.
7 Click the Add icon ( ).
8 Click in the Event column, and select an option from the drop-down menu.
9 Click in the Status column, and select an option from the drop-down menu.
10 (Optional) Configure additional conditions to be met before the alarm triggers.
a Click the Add icon to add an argument.
b Click in the Argument column, and select an option from the drop-down menu.
c Click in the Operator column, and select an option from the drop-down menu.
d Click in the Value column, and enter a value in the text field.
You can add more than one argument.
11 Click Next.
You selected and configured alarm triggers.
vSAN Monitoring and Troubleshooting
VMware, Inc. 17

Monitoring vSAN Health 3You can check the overall health of the vSAN cluster, including hardware compatibility, networkingconfiguration and operations, advanced vSAN configuration options, storage device health and virtualmachine object health.
This chapter includes the following topics:n About the vSAN Health Service
n Check vSAN Health
n Monitor vSAN from ESXi Host Client
n Proactive Tests
About the vSAN Health ServiceUse the vSAN health service to monitor the health your vSAN cluster.
You can use the vSAN health checks to monitor the status of cluster components, diagnose issues, andtroubleshoot problems. The health checks cover hardware compatibility, network configuration andoperation, advanced vSAN configuration options, storage device health, and virtual machine objects.
VMware, Inc. 18

The vSAN health checks are divided into categories. Each category contains individual health checks.
Table 3‑1. vSAN Health Check Categories
Health Check Category Description
Hardware Compatibility Monitor the cluster components to ensure that they are using supported hardware,software, and drivers.
Performance Service Monitor the health of a vSAN performance service.
Network Monitor vSAN network health.
Physical disk Monitor the health of physical devices in the vSAN cluster.
Data Monitor vSAN data health.
Cluster Monitor vSAN cluster health.
Limits Monitor vSAN cluster limits.
Online health Monitor vSAN cluster health and send to VMware’s analytics backend system foradvanced analysis. You must participate in the Customer ExperienceImprovement Program to use online health checks.
vSAN Build Recommendation Monitor vSAN build recommendations for vSphere Update Manager.
vSAN iSCSI target service Monitor the iSCSI target service, including the network configuration and runtimestatus.
Encryption Monitor vSAN encryption health.
Stretched cluster Monitor the health of a stretched cluster, if applicable.
Hyperconverged cluster configurationcompliance
Monitor the status of hosts and settings configured through the Quickstartworkflow.
vSAN Monitoring and Troubleshooting
VMware, Inc. 19

vSAN periodically retests each health check and updates the results. To run the health checks andupdate the results immediately, click the Retest button.
If you participate in the Customer Experience Improvement Program, you can run health checks and sendthe data to VMware for advanced analysis. Click the Retest with Online health button.
For more information about vSAN health checks, see VMware Virtual SAN Health Check Plugin Guide.
Monitoring vSAN Health on a HostThe ESXi host client is a browser-based interface for managing a single ESXi host. It enables you tomanage the host when vCenter Server is not available. The host client provides tabs for managing andmonitoring vSAN at the host level.
n The vSAN tab displays basic vSAN configuration.
n The Hosts tab displays the hosts participating in the vSAN cluster.
n The Health tab displays host-level health checks.
Check vSAN HealthYou can view the status of vSAN health checks to verify the configuration and operation of your vSANcluster.
Prerequisites
Procedure
1 Navigate to the vSAN cluster.
2 Click the Monitor tab.
Option Description
vSphere Client Under vSAN, select Health to review the vSAN health check categories.n If the Test Result column displays a Warning (yellow) or Failed (red) icon,
expand the category to review the results of individual health checks.n Select an individual health check to view the detailed information.n In the Info section, you can click the Ask VMware button to open a
knowledge base article that describes the health check and providesinformation about how to resolve the issue.
n You can click Silence Alert on a health check, so it does not display anywarnings or failures.
vSphere Web Client a click vSAN.
b Select Health to review the vSAN health check categories.n If the Test Result column displays Warning or Failed, expand the category
to review the results of individual health checks.n Select an individual health check to view the detailed information at the
bottom of the page.n You can click the Ask VMware button to open a knowledge base article
that describes the health check and provides information about how toresolve the issue.
vSAN Monitoring and Troubleshooting
VMware, Inc. 20

Monitor vSAN from ESXi Host ClientYou can monitor vSAN health and basic configuration through the ESXi host client.
Procedure
1 Open a browser and enter the IP address of the host.
The browser redirects to the login page for the host client.
2 Enter the username and password for the host, and click Login.
3 In the host client navigator, click Storage.
4 In the main page, click the vSAN datastore to display the Monitor link in the navigator.
5 Click the tabs to view vSAN information for the host.
a Click the vSAN tab to display basic vSAN configuration.
b Click the Hosts tab to display the hosts participating in the vSAN cluster.
c Click the Health tab to display host-level health checks.
6 (Optional) On the vSAN tab, click Edit Settings to correct configuration issues at the host level.Select the values that match the configuration of your vSAN cluster.
Select the values that match the configuration of your vSAN cluster, and click Save.
Proactive TestsYou can initiate a health test on your vSAN cluster to verify that the cluster components are working asexpected.
Run the VM creation test to verify the vSAN cluster health. Running the test creates a virtual machine oneach host in the cluster. The test creates a VM and deletes it. If the VM creation and deletion tasks aresuccessful, assume that the cluster components are working as expected and the cluster is functional.
Run the Network performance test to detect and diagnose connectivity issues, and to make sure thenetwork bandwidth between the hosts supports the requirements of vSAN. The test is performed betweenthe hosts in the cluster. It verifies that the network bandwidth between hosts, and reports a warning if thebandwidth is less than 850Mbps.
To access a proactive test, select your vSAN cluster in the vSphere Client, and click the Monitor tab. ClickvSAN > Proactive Tests.
vSAN Monitoring and Troubleshooting
VMware, Inc. 21

Monitoring vSAN Performance 4You can monitor the performance of your vSAN cluster. Performance charts are available for clusters,hosts, physical disks, virtual machines, and virtual disks.
This chapter includes the following topics:n About the vSAN Performance Service
n Configure vSAN Performance Service
n Use Saved Time Range
n View vSAN Cluster Performance
n View vSAN Host Performance
n View vSAN VM Performance
n Using vSAN Performance Diagnostics
About the vSAN Performance ServiceYou can use vSAN performance service to monitor the performance of your vSAN environment, andinvestigate potential problems.
The performance service collects and analyzes performance statistics and displays the data in agraphical format. You can use the performance charts to manage your workload and determine the rootcause of problems.
VMware, Inc. 22

When the vSAN performance service is turned on, the cluster summary displays an overview of vSANperformance statistics, including IOPS, throughput, and latency. You can view detailed performancestatistics for the cluster, and for each host, disk group, and disk in the vSAN cluster. You also can viewperformance charts for virtual machines and virtual disks.
Configure vSAN Performance ServiceUse the vSAN Performance Service to monitor the performance of vSAN clusters, hosts, disks, and VMs.
Note When you create a vSAN cluster in the vSphere Web Client, the Performance Service is disabled.You can enable and configure the Performance Service.
To support the Performance Service, vSAN uses a Stats database object to collect statistical data. TheStats database is a namespace object in the cluster's vSAN datastore.
Prerequisites
n All hosts in the vSAN cluster must be running ESXi 6.5 or later.
n Before you configure the vSAN Performance Service, make sure that the cluster is properlyconfigured and has no unresolved health problems.
Procedure
1 Navigate to the vSAN cluster.
vSAN Monitoring and Troubleshooting
VMware, Inc. 23

2 Click the Configure tab.
Option Description
vSphere Client a Under vSAN, select Services.
b Click the Performance Service Edit button.
c Click to enable vSAN Performance Service.
d Select a storage policy for the Stats database object.
e (Optional) Click to enable the verbose mode. When enabled, vSAN collectsand saves the additional performance metrics to a Stats DB object. If youenable the verbose mode for more than 5 days, a warning message appearsindicating that the verbose mode can be resource-intensive. Ensure that youdo not enable it for a longer duration.
f (Optional) Click to enable the network diagnostic mode. When enabled, vSANcollects and saves the additional network performance metrics to a RAM diskstats object. If you enable the network diagnostic mode for more than a day, awarning message appears indicating that the network diagnostic mode canbe resource-intensive. Ensure that you do not enable it for a longer duration.
g Click Apply.
vSphere Web Client a Under vSAN, select Health and Performance.
b Click the Performance Service Turn On button and click OK.
c Click the Performance Service Edit Settings button.n Select a storage policy for the Stats database object.n (Optional) Click to enable the verbose mode. When enabled, vSAN
collects and saves the additional performance metrics to a Stats DBobject. If you enable the verbose mode for more than 5 days, a warningmessage appears indicating that the verbose mode can be resource-intensive. Ensure that you do not enable it for a longer duration.
d Click OK.
Use Saved Time RangeYou can select saved time ranges from the time range picker in performance views.
You can manually save a time range with customized name. When you run a storage performance test,the selected time range is saved automatically. You can save a time range for any of the performanceviews.
Prerequisites
n The vSAN performance service must be turned on.
n All hosts in the vSAN cluster must be running ESXi 6.5 or later.
Procedure
1 Navigate to the vSAN cluster.
2 Click the Monitor tab and click Performance.
3 Select any tab, such as vSAN - Backend. In the time range drop-down, select Save.
4 Enter a name for the selected time range.
vSAN Monitoring and Troubleshooting
VMware, Inc. 24
5 Confirm your changes.
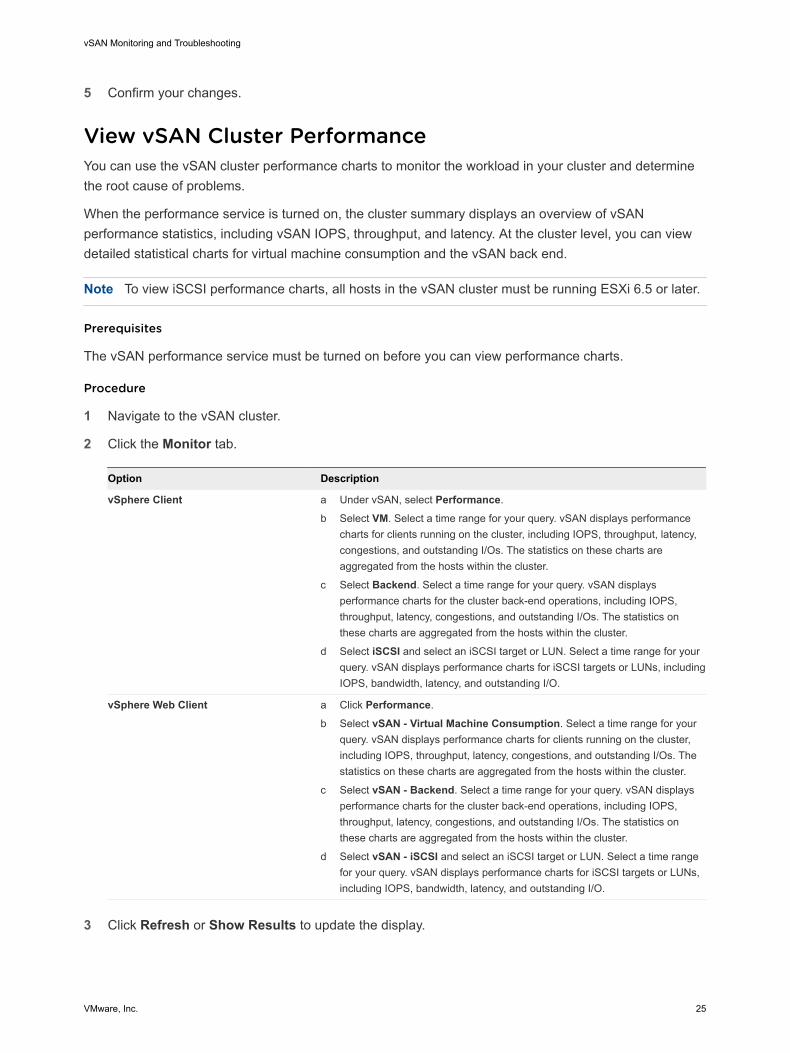
View vSAN Cluster PerformanceYou can use the vSAN cluster performance charts to monitor the workload in your cluster and determinethe root cause of problems.
When the performance service is turned on, the cluster summary displays an overview of vSANperformance statistics, including vSAN IOPS, throughput, and latency. At the cluster level, you can viewdetailed statistical charts for virtual machine consumption and the vSAN back end.
Note To view iSCSI performance charts, all hosts in the vSAN cluster must be running ESXi 6.5 or later.
Prerequisites
The vSAN performance service must be turned on before you can view performance charts.
Procedure
1 Navigate to the vSAN cluster.
2 Click the Monitor tab.
Option Description
vSphere Client a Under vSAN, select Performance.
b Select VM. Select a time range for your query. vSAN displays performancecharts for clients running on the cluster, including IOPS, throughput, latency,congestions, and outstanding I/Os. The statistics on these charts areaggregated from the hosts within the cluster.
c Select Backend. Select a time range for your query. vSAN displaysperformance charts for the cluster back-end operations, including IOPS,throughput, latency, congestions, and outstanding I/Os. The statistics onthese charts are aggregated from the hosts within the cluster.
d Select iSCSI and select an iSCSI target or LUN. Select a time range for yourquery. vSAN displays performance charts for iSCSI targets or LUNs, includingIOPS, bandwidth, latency, and outstanding I/O.
vSphere Web Client a Click Performance.
b Select vSAN - Virtual Machine Consumption. Select a time range for yourquery. vSAN displays performance charts for clients running on the cluster,including IOPS, throughput, latency, congestions, and outstanding I/Os. Thestatistics on these charts are aggregated from the hosts within the cluster.
c Select vSAN - Backend. Select a time range for your query. vSAN displaysperformance charts for the cluster back-end operations, including IOPS,throughput, latency, congestions, and outstanding I/Os. The statistics onthese charts are aggregated from the hosts within the cluster.
d Select vSAN - iSCSI and select an iSCSI target or LUN. Select a time rangefor your query. vSAN displays performance charts for iSCSI targets or LUNs,including IOPS, bandwidth, latency, and outstanding I/O.
3 Click Refresh or Show Results to update the display.
vSAN Monitoring and Troubleshooting
VMware, Inc. 25

View vSAN Host PerformanceYou can use the vSAN host performance charts to monitor the workload on your hosts and determine theroot cause of problems. You can view vSAN performance charts for hosts, disk groups, and individualstorage devices.
When the performance service is turned on, the host summary displays performance statistics for eachhost and its attached disks. At the host level, you can view detailed statistical charts for virtual machineconsumption and the vSAN back end, including IOPS, throughput, latency, and congestion. Additionalcharts are available to view the local client cache read IOPS and hit rate. At the disk group level, you canview statistics for the disk group. At the disk level, you can view statistics for an individual storage device.
Prerequisites
The vSAN performance service must be turned on before you can view performance charts.
To view the following performance charts, hosts in the vSAN cluster must be running ESXi 6.5 or later:Physical Adapters, VMkernal Adapters, VMkernal Adapters Aggregation, iSCSI, vSAN - Backend resyncI/Os, resync IOPS, resync throughput, Disk Group resync latency.
Procedure
1 Navigate to the vSAN cluster, and select a host.
vSAN Monitoring and Troubleshooting
VMware, Inc. 26
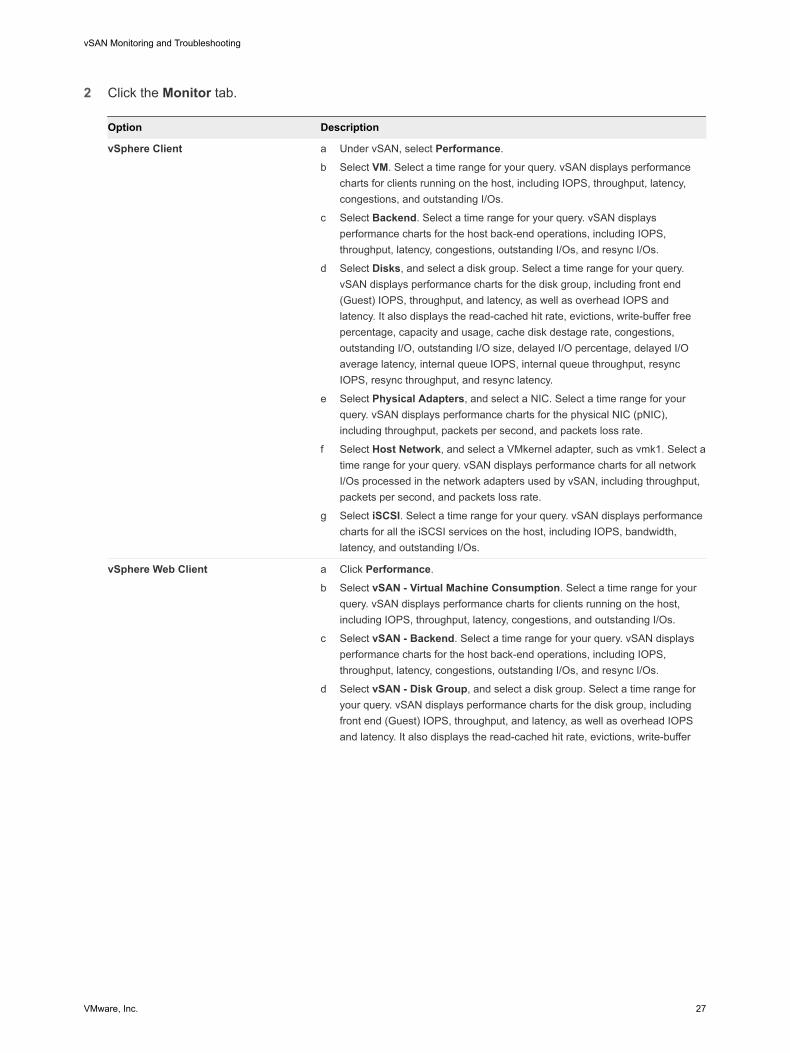
2 Click the Monitor tab.
Option Description
vSphere Client a Under vSAN, select Performance.
b Select VM. Select a time range for your query. vSAN displays performancecharts for clients running on the host, including IOPS, throughput, latency,congestions, and outstanding I/Os.
c Select Backend. Select a time range for your query. vSAN displaysperformance charts for the host back-end operations, including IOPS,throughput, latency, congestions, outstanding I/Os, and resync I/Os.
d Select Disks, and select a disk group. Select a time range for your query.vSAN displays performance charts for the disk group, including front end(Guest) IOPS, throughput, and latency, as well as overhead IOPS andlatency. It also displays the read-cached hit rate, evictions, write-buffer freepercentage, capacity and usage, cache disk destage rate, congestions,outstanding I/O, outstanding I/O size, delayed I/O percentage, delayed I/Oaverage latency, internal queue IOPS, internal queue throughput, resyncIOPS, resync throughput, and resync latency.
e Select Physical Adapters, and select a NIC. Select a time range for yourquery. vSAN displays performance charts for the physical NIC (pNIC),including throughput, packets per second, and packets loss rate.
f Select Host Network, and select a VMkernel adapter, such as vmk1. Select atime range for your query. vSAN displays performance charts for all networkI/Os processed in the network adapters used by vSAN, including throughput,packets per second, and packets loss rate.
g Select iSCSI. Select a time range for your query. vSAN displays performancecharts for all the iSCSI services on the host, including IOPS, bandwidth,latency, and outstanding I/Os.
vSphere Web Client a Click Performance.
b Select vSAN - Virtual Machine Consumption. Select a time range for yourquery. vSAN displays performance charts for clients running on the host,including IOPS, throughput, latency, congestions, and outstanding I/Os.
c Select vSAN - Backend. Select a time range for your query. vSAN displaysperformance charts for the host back-end operations, including IOPS,throughput, latency, congestions, outstanding I/Os, and resync I/Os.
d Select vSAN - Disk Group, and select a disk group. Select a time range foryour query. vSAN displays performance charts for the disk group, includingfront end (Guest) IOPS, throughput, and latency, as well as overhead IOPSand latency. It also displays the read-cached hit rate, evictions, write-buffer
vSAN Monitoring and Troubleshooting
VMware, Inc. 27
Option Description
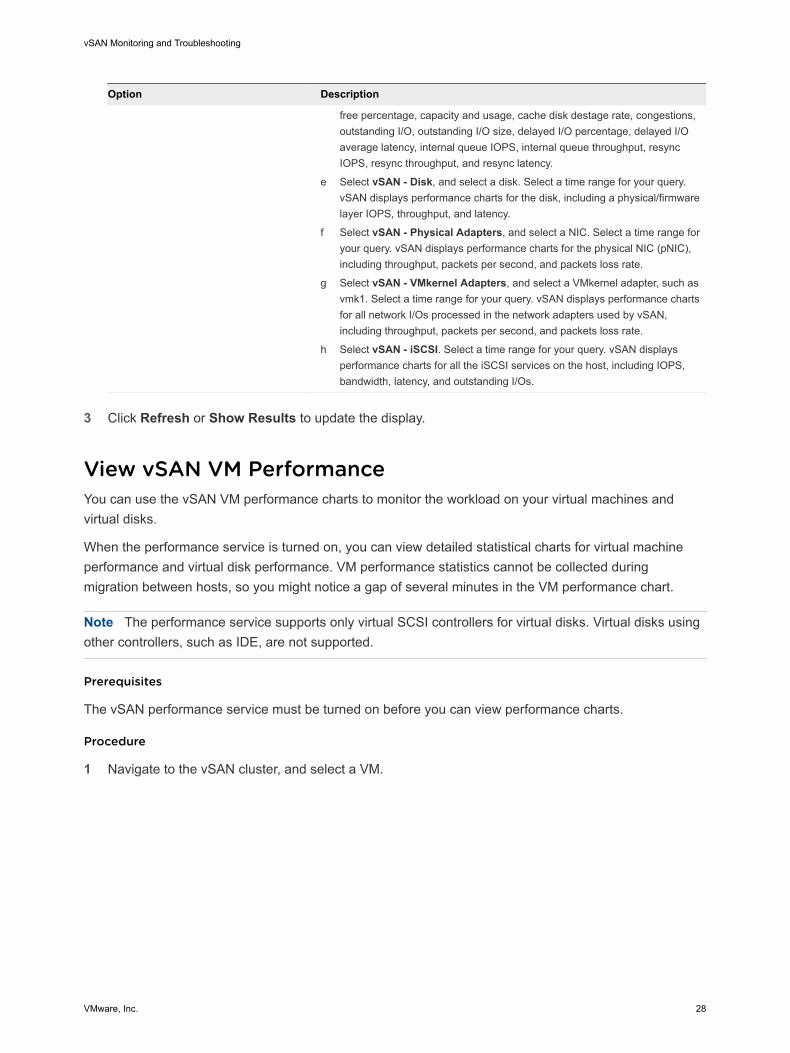
free percentage, capacity and usage, cache disk destage rate, congestions,outstanding I/O, outstanding I/O size, delayed I/O percentage, delayed I/Oaverage latency, internal queue IOPS, internal queue throughput, resyncIOPS, resync throughput, and resync latency.
e Select vSAN - Disk, and select a disk. Select a time range for your query.vSAN displays performance charts for the disk, including a physical/firmwarelayer IOPS, throughput, and latency.
f Select vSAN - Physical Adapters, and select a NIC. Select a time range foryour query. vSAN displays performance charts for the physical NIC (pNIC),including throughput, packets per second, and packets loss rate.
g Select vSAN - VMkernel Adapters, and select a VMkernel adapter, such asvmk1. Select a time range for your query. vSAN displays performance chartsfor all network I/Os processed in the network adapters used by vSAN,including throughput, packets per second, and packets loss rate.
h Select vSAN - iSCSI. Select a time range for your query. vSAN displaysperformance charts for all the iSCSI services on the host, including IOPS,bandwidth, latency, and outstanding I/Os.
3 Click Refresh or Show Results to update the display.
View vSAN VM PerformanceYou can use the vSAN VM performance charts to monitor the workload on your virtual machines andvirtual disks.
When the performance service is turned on, you can view detailed statistical charts for virtual machineperformance and virtual disk performance. VM performance statistics cannot be collected duringmigration between hosts, so you might notice a gap of several minutes in the VM performance chart.
Note The performance service supports only virtual SCSI controllers for virtual disks. Virtual disks usingother controllers, such as IDE, are not supported.
Prerequisites
The vSAN performance service must be turned on before you can view performance charts.
Procedure
1 Navigate to the vSAN cluster, and select a VM.
vSAN Monitoring and Troubleshooting
VMware, Inc. 28

2 Click the Monitor tab.
Option Description
vSphere Client a Under vSAN, select Performance.
b Select VM. Choose a time range for your query. vSAN displays performancecharts for the VM, including IOPS, throughput, and latency.
c Select Virtual Disk. Choose a time range for your query. vSAN displaysperformance charts for the virtual disks, including IOPS, delayed normalizedIOPS, virtual SCSI IOPS, virtual SCSI throughput, and virtual SCSI latency.
vSphere Web Client a Click Performance.
b Select vSAN - Virtual Machine Consumption. Select a time range for yourquery. Choose a time range for your query. vSAN displays performancecharts for the VM, including IOPS, throughput, and latency.
c Select vSAN - Virtual Disk. Choose a time range for your query. vSANdisplays performance charts for the virtual disks, including IOPS, delayednormalized IOPS, virtual SCSI IOPS, virtual SCSI throughput, and virtualSCSI latency.
3 Click Refresh or Show Results to update the display.
Using vSAN Performance DiagnosticsYou can use vSAN performance diagnostics to improve the performance of your vSAN cluster, andresolve performance issues.
The vSAN performance diagnostics tool analyzes previously run benchmarks gathered from the vSANperformance service. It can detect issues, suggest remediation steps, and provide supportingperformance graphs for further insight.
The vSAN performance service provides the data used to analyze vSAN performance diagnostics. vSANuses CEIP to send data to VMware for analysis.
Note Do not use vSAN performance diagnostics for general evaluation of performance on a productionvSAN cluster.
Prerequisites
n The vSAN performance service must be turned on.
n vCenter Server requires Internet access to download ISO images and patches.
n You must participate in the Customer Experience Improvement Program (CEIP).
Procedure
1 Navigate to the vSAN cluster.
vSAN Monitoring and Troubleshooting
VMware, Inc. 29

2 Click the Monitor tab.
Option Description
vSphere Client Under vSAN, select Performance Diagnostics.
vSphere Web Client a Click vSAN.
b Click Performance Diagnostics.
3 Select a benchmark goal from the drop-down menu.
You can select a goal based on the performance improvement that you want to achieve, such asmaximum IOPS, maximum throughput, or minimum latency.
4 Select a time range for your query.
The default time range is the most recent hour. You can increase the range to include the last 24hours, or define a custom time range within the last 90 days. If you used the HCIbench tool to runperformance benchmark tests on the vSAN cluster, the time ranges of those tests appear in the drop-down menu.
5 Click Show Results.
When you click Show Results, vSAN transmits performance data to the vSphere backend analyticsserver. After analyzing the data, the vSAN performance diagnostics tool displays a list of issues that mighthave affected the benchmark performance for the chosen goal.
You can click to expand each issue to view more details about each issue, such as a list of affected items.You also can click See More or Ask VMware to display a Knowledge Base article that describesrecommendations to address the issue and achieve your performance goal.
vSAN Monitoring and Troubleshooting
VMware, Inc. 30

Handling Failures andTroubleshooting vSAN 5If you encounter problems when using vSAN, you can use troubleshooting topics. The topics help youunderstand the problem and offer you a workaround, when it is available.
This chapter includes the following topics:
n Uploading a vSAN Support Bundle
n Using Esxcli Commands with vSAN
n vSAN Configuration on an ESXi Host Might Fail
n Not Compliant Virtual Machine Objects Do Not Become Compliant Instantly
n vSAN Cluster Configuration Issues
n Handling Failures in vSAN
n Shutting Down and Restarting the vSAN Cluster
Uploading a vSAN Support BundleYou can upload a vSAN support bundle so VMware service personnel can analyze the diagnosticinformation.
VMware Technical Support routinely requests diagnostic information from your vSAN cluster when asupport request is addressed. The support bundle is an archive that contains diagnostic informationrelated to the environment, such as product specific logs, configuration files, and so on.
vSAN performs an automated upload of the support bundle, and does not allow you to review, obfuscate,or otherwise edit the contents of your support data prior to it being sent to VMware.
Note Data collected in the support bundle may be considered sensitive. If your support data containsregulated data, such as personal, health care, or financial data, you may want to avoid uploading thesupport bundle.
Procedure
1 Right-click the vSAN cluster in the vSphere Client.
2 Choose menu vSAN > Upload support bundle...
3 Enter your service request ID and a description of your issue.
VMware, Inc. 31

4 Click Upload.
Using Esxcli Commands with vSANUse Esxcli commands to obtain information about vSAN and to troubleshoot your vSAN environment.
The following commands are available:
Command Description
esxcli vsan network list Verify which VMkernel adapters are used for vSAN communication.
esxcli vsan storage list List storage disks claimed by vSAN.
esxcli vsan cluster get Get vSAN cluster information.
esxcli vsan health Get vSAN cluster health status.
esxcli vsan debug Get vSAN cluster debug information.
The esxcli vsan debug commands can help you debug and troubleshoot the vSAN cluster, especiallywhen vCenter Server is not available.
Use: esxcli vsan debug {cmd} [cmd options]
Debug commands:
Command Description
esxcli vsan debug disk Debug vSAN physical disks.
esxcli vsan debug object Debug vSAN objects.
esxcli vsan debug resync Debug vSAN resyncing objects.
esxcli vsan debug controller Debug vSAN disk controllers.
esxcli vsan debug limit Debug vSAN limits.
esxcli vsan debug vmdk Debug vSAN VMDKs.
Example esxcli vsan debug commands:
esxcli vsan debug disk summary get
Overall Health: green
Component Metadata Health: green
Memory Pools (heaps): green
Memory Pools (slabs): green
esxcli vsan debug disk list
UUID: 52e1d1fa-af0e-0c6c-f219-e5e1d224b469
Name: mpx.vmhba1:C0:T1:L0
SSD: False
Overall Health: green
Congestion Health:
State: green
Congestion Value: 0
Congestion Area: none
In Cmmds: true
vSAN Monitoring and Troubleshooting
VMware, Inc. 32

In Vsi: true
Metadata Health: green
Operational Health: green
Space Health:
State: green
Capacity: 107365793792 bytes
Used: 1434451968 bytes
Reserved: 150994944 bytes
esxcli vsan debug object health summary get
Health Status Number Of Objects
------------------------------------------------ -----------------
reduced-availability-with-no-rebuild-delay-timer 0
reduced-availability-with-active-rebuild 0
inaccessible 0
data-move 0
healthy 1
nonavailability-related-incompliance 0
nonavailability-related-reconfig 0
reduced-availability-with-no-rebuild 0
esxcli vsan debug object list
Object UUID: 47cbdc58-e01c-9e33-dada-020010d5dfa3
Version: 5
Health: healthy
Owner:
Policy:
stripeWidth: 1
CSN: 1
spbmProfileName: vSAN Default Storage Policy
spbmProfileId: aa6d5a82-1c88-45da-85d3-3d74b91a5bad
forceProvisioning: 0
cacheReservation: 0
proportionalCapacity: [0, 100]
spbmProfileGenerationNumber: 0
hostFailuresToTolerate: 1
Configuration:
RAID_1
Component: 47cbdc58-6928-333f-0c51-020010d5dfa3
Component State: ACTIVE, Address Space(B): 273804165120 (255.00GB),
Disk UUID: 52e95956-42cf-4d30-9cbe-763c616614d5, Disk Name: mpx.vmhba1..
Votes: 1, Capacity Used(B): 373293056 (0.35GB),
Physical Capacity Used(B): 369098752 (0.34GB), Host Name: sc-rdops...
Component: 47cbdc58-eebf-363f-cf2b-020010d5dfa3
Component State: ACTIVE, Address Space(B): 273804165120 (255.00GB),
Disk UUID: 52d11301-1720-9901-eb0a-157d68b3e4fc, Disk Name: mpx.vmh...
Votes: 1, Capacity Used(B): 373293056 (0.35GB),
Physical Capacity Used(B): 369098752 (0.34GB), Host Name: sc-rdops-vm..
Witness: 47cbdc58-21d2-383f-e45a-020010d5dfa3
Component State: ACTIVE, Address Space(B): 0 (0.00GB),
Disk UUID: 52bfd405-160b-96ba-cf42-09da8c2d7023, Disk Name: mpx.vmh...
Votes: 1, Capacity Used(B): 12582912 (0.01GB),
vSAN Monitoring and Troubleshooting
VMware, Inc. 33

Physical Capacity Used(B): 4194304 (0.00GB), Host Name: sc-rdops-vm...
Type: vmnamespace
Path: /vmfs/volumes/vsan:52134fafd48ad6d6-bf03cb6af0f21b8d/New Virtual Machine
Group UUID: 00000000-0000-0000-0000-000000000000
Directory Name: New Virtual Machine
esxcli vsan debug controller list
Device Name: vmhba1
Device Display Name: LSI Logic/Symbios Logic 53c1030 PCI-X Fusion-MPT Dual Ult..
Used By VSAN: true
PCI ID: 1000/0030/15ad/1976
Driver Name: mptspi
Driver Version: 4.23.01.00-10vmw
Max Supported Queue Depth: 127
esxcli vsan debug limit get
Component Limit Health: green
Max Components: 750
Free Components: 748
Disk Free Space Health: green
Lowest Free Disk Space: 99 %
Used Disk Space: 1807745024 bytes
Used Disk Space (GB): 1.68 GB
Total Disk Space: 107365793792 bytes
Total Disk Space (GB): 99.99 GB
Read Cache Free Reservation Health: green
Reserved Read Cache Size: 0 bytes
Reserved Read Cache Size (GB): 0.00 GB
Total Read Cache Size: 0 bytes
Total Read Cache Size (GB): 0.00 GB
esxcli vsan debug vmdk list
Object: 50cbdc58-506f-c4c2-0bde-020010d5dfa3
Health: healthy
Type: vdisk
Path: /vmfs/volumes/vsan:52134fafd48ad6d6-bf03cb6af0f21b8d/47cbdc58-e01c-9e33-
dada-020010d5dfa3/New Virtual Machine.vmdk
Directory Name: N/A
esxcli vsan debug resync list
Object Component Bytes Left To Resync GB Left To Resync
---------------- --------------------- -------------------- -----------------
31cfdc58-e68d... Component:23d1dc58... 536870912 0.50
31cfdc58-e68d... Component:23d1dc58... 1073741824 1.00
31cfdc58-e68d... Component:23d1dc58... 1073741824 1.00
vSAN Configuration on an ESXi Host Might FailIn certain circumstances, the task of configuring vSAN on a particular host might fail.
vSAN Monitoring and Troubleshooting
VMware, Inc. 34

Problem
An ESXi host that joins a vSAN cluster fails to have vSAN configured.
Cause
If a host does not meet hardware requirements or experiences other problems, vSAN might fail toconfigure the host. For example, insufficient memory on the host might prevent vSAN from beingconfigured.
Solution
1 Place the host that causes the failure in Maintenance Mode.
2 Move the host out of the vSAN cluster.
3 Resolve the problem that prevents the host to have vSAN configured.
4 Exit Maintenance Mode.
5 Move the host back into the vSAN cluster.
Not Compliant Virtual Machine Objects Do Not BecomeCompliant InstantlyWhen you use the Check Compliance button, a virtual machine object does not change its status fromNot Compliant to Compliant even though vSAN resources have become available and satisfy the virtualmachine profile.
Problem
When you use force provisioning, you can provision a virtual machine object even when the policyspecified in the virtual machine profile cannot be satisfied with the resources available in the vSANcluster. The object is created, but remains in the non-compliant status.
vSAN is expected to bring the object into compliance when storage resources in the cluster becomeavailable, for example, when you add a host. However, the object's status does not change to compliantimmediately after you add resources.
Cause
This occurs because vSAN regulates the pace of the reconfiguration to avoid overloading the system.The amount of time it takes for compliance to be achieved depends on the number of objects in thecluster, the I/O load on the cluster and the size of the object in question. In most cases, compliance isachieved within a reasonable time.
vSAN Cluster Configuration IssuesAfter you change the vSAN configuration, vCenter Server performs validation checks for vSANconfiguration. Validation checks are also performed as a part of a host synchronization process. IfvCenter Server detects any configuration problems, it displays error messages.
vSAN Monitoring and Troubleshooting
VMware, Inc. 35

Problem
Error messages indicate that vCenter Server has detected a problem with vSAN configuration.
Solution
Use the following methods to fix vSAN configuration problems.
Table 5‑1. vSAN Configuration Errors and Solutions
vSAN Configuration Error Solution
Host with the vSAN service enabled is not in the vCentercluster
Add the host to the vSAN cluster.
1 Right-click the host, and select Move To.
2 Select the vSAN cluster and click OK.
Host is in a vSAN enabled cluster but does not have VSANservice enabled
Verify whether vSAN network is properly configured andenabled on the host. See vSAN Planning and Deployment.
vSAN network is not configured Configure vSAN network. See vSAN Planning andDeployment.
Host cannot communicate with all other nodes in the vSANenabled cluster
Might be caused by network isolation. See the vSAN Planningand Deployment documentation.
Found another host participating in the vSAN service which isnot a member of this host's vCenter cluster.
Make sure that the vSAN cluster configuration is correct and allvSAN hosts are in the same subnet. See vSAN Planning andDeployment.
Handling Failures in vSANvSAN handles failures of the storage devices, hosts and network in the cluster according to the severity ofthe failure. You can diagnose problems in vSAN by observing the performance of the vSAN datastore andnetwork.
Failure Handling in vSANvSAN implements mechanisms for indicating failures and rebuilding unavailable data for data protection.
Failure States of vSAN ComponentsIn vSAN, components that have failed can be in absent or degraded state. According to the componentstate, vSAN uses different approaches for recovering virtual machine data.
vSAN also provides alerts about the type of component failure. See Using the VMkernel Observations forCreating Alarms and Using the vSAN Default Alarms.
vSAN supports two types of failure states for components:
vSAN Monitoring and Troubleshooting
VMware, Inc. 36

Table 5‑2. Failure States of Components in vSAN
ComponentFailure State Description Recovery Cause
Degraded A component is in degraded state ifvSAN detects a permanentcomponent failure and assumesthat the component is not going torecover to working state.
vSAN starts rebuilding theaffected componentsimmediately.
n Failure of a flash cachingdevice
n Magnetic or flash capacitydevice failure
n Storage controller failure
Absent A component is in absent state ifvSAN detects a temporarycomponent failure where thecomponent might recover andrestore its working state.
vSAN starts rebuilding absentcomponents if they are notavailable within a certain timeinterval. By default, vSAN startsrebuilding absent componentsafter 60 minutes.
n Lost network connectivityn Failure of a physical network
adaptern ESXi host failuren Unplugged flash caching
devicen Unplugged magnetic disk or
flash capacity device
Examine the Failure State of a Component
You can determine whether a component is in the absent or degraded failure state.
If a failure occurs in the cluster, vSAN marks the components for an object as absent or degraded basedon the failure severity.
Procedure
1 Navigate to the vSAN cluster.
2 On the Monitor tab, click vSAN and select Virtual Disks.
The home directories and virtual disks of the virtual machines in the cluster appear.
3 Select a virtual machine object.
4 On the Physical Disk Placement tab, examine the Component State property of the components forthe selected object.
If a failure has occurred in the vSAN cluster, the Component State property is equal to Absent orDegraded.
Object States That Indicate Problems in vSANExamine the compliance status and the operational state of a virtual machine object to determine how afailure in the cluster affects the virtual machine.
vSAN Monitoring and Troubleshooting
VMware, Inc. 37

Table 5‑3. Object State
Object State Type Description
Compliance Status The compliance status of a virtual machine object indicates whether it meets therequirements of the assigned VM storage policy.
Operational State The operational state of an object can be healthy or unhealthy. It indicates thetype and number of failures in the cluster.
An object is healthy if an intact replica is available and more than 50 percent ofthe object's votes are still available.
An object is unhealthy if an entire replica is not available or less than 50 percentof the object's votes are unavailable. For example, an object might becomeunhealthy if a network failure occurs in the cluster and a host becomes isolated.
To determine the overall influence of a failure on a virtual machine, examine the compliance status andthe operational state. If the operational state remains healthy although the object is noncompliant, thevirtual machine can continue using the vSAN datastore. If the operational state is unhealthy, the virtualmachine cannot use the datastore.
Examine the Health of an Object in vSAN
Use the vSphere Web Client to examine whether a virtual machine is healthy. A virtual machine isconsidered as healthy when a replica of the VM object and more than 50 percent of the votes for anobject are available.
Procedure
1 Navigate to the vSAN cluster.
2 On the Monitor tab, click vSAN and select Virtual Disks.
The home directories and virtual disks of the virtual machines in the cluster appear.
3 For a virtual machine object, examine the value of the Operational State property.
If the Operational State is Unhealthy, the vSphere Web Client indicates the reason for the unhealthystate in brackets.
Examine the Compliance of a Virtual Machine in vSAN
Use the vSphere Web Client to examine whether a virtual machine object is compliant with the assignedVM storage policy.
Procedure
1 Examine the compliance status of a virtual machine.
a Browse to the virtual machine in the vSphere Web Client navigator.
b On the Summary tab, examine the value of the VM Storage Policy Compliance property underVM Storage Policies.
vSAN Monitoring and Troubleshooting
VMware, Inc. 38

2 Examine the compliance status of the objects of the virtual machine.
a Navigate to the vSAN cluster.
b On the Monitor tab, click vSAN and select Virtual Disks.
c Select a virtual machine object.
d Examine the value of the Compliance Status property for the object. If the Compliance Status isdifferent from Compliant, determine the cause for the noncompliance.
n Examine the Operational State of the object to verify whether the object is healthy.
n On the Compliance Failure tab, examine which requirements from the VM storage policythat the object cannot satisfy.
n On the Physical Disk Placement tab, examine the state of the object components.
Accessibility of Virtual Machines Upon a Failure in vSANIf a virtual machine uses vSAN storage, its storage accessibility might change according to the type offailure in the vSAN cluster.
Changes in the accessibility occur when the cluster experiences more failures than the policy for a virtualmachine object tolerates.
As a result from a failure in the vSAN cluster, a virtual machine object might become inaccessible. Anobject is inaccessible if a full replica of the object is not available because the failure affects all replicas, orwhen less than 50 percent of the object's votes are available.
According to the type of object that is inaccessible, virtual machines behave in the following ways:
Table 5‑4. Inaccessibility of Virtual Machine Objects
Object Type Virtual Machine State Virtual Machine Symptoms
VM Home Namespace n Inaccessiblen Orphaned if vCenter Server or the ESXi host
cannot access the .vmx file of the virtualmachine.
The virtual machine process might crashand the virtual machine might bepowered off.
VMDK Inaccessible The virtual machine remains powered onbut the I/O operations on the VMDK arenot being performed. After a certaintimeout passes, the guest operatingsystem ends the operations.
Virtual machine inaccessibility is not a permanent state. After the underlying issue is resolved, and a fullreplica and more than 50 percent of the object's votes are restored, the virtual machine automaticallybecomes accessible again.
Storage Device is Failing in a vSAN ClustervSAN monitors the performance of each storage device and proactively isolates unhealthy devices. Itdetects gradual failure of a storage device and isolates the device before congestion builds up within theaffected host and the entire vSAN cluster.
vSAN Monitoring and Troubleshooting
VMware, Inc. 39

If a disk experiences sustained high latencies or congestion, vSAN considers the device as a dying disk,and evacuates data from the disk. vSAN handles the dying disk by evacuating or rebuilding data. No useraction is required, unless the cluster lacks resources or has inaccessible objects.
Component Failure State and Accessibility
The vSAN components that reside on the magnetic disk or flash capacity device are marked as absent.
Behavior of vSAN
vSAN responds to the storage device failure in the following ways.
Parameter Behavior
Alarms An alarm is generated from each host whenever an unhealthy device is diagnosed. A warning is issuedwhenever a disk is suspected of being unhealthy.
Health check The Disk operation health check issues a warning for the dying disk.
Health status On the Disk Management page, the health status of the dying disk is listed as Unhealthy. When vSANcompletes evacuation of data, the health status is listed as DyingDiskEmpty.
Rebuilding data vSAN examines whether the hosts and the capacity devices can satisfy the requirements for space andplacement rules for the objects on the failed device or disk group. If such a host with capacity is available,vSAN starts the recovery process immediately because the components are marked as degraded.
If resources are available, vSAN automatically reprotects the data.
If vSAN detects a disk with a permanent error, it makes a limited number of attempts to revive the disk byunmounting and mounting it.
Capacity Device Not Accessible in a vSAN ClusterWhen a magnetic disk or flash capacity device fails, vSAN evaluates the accessibility of the objects onthe device and rebuilds them on another host if space is available and the Primary level of failures totolerate is set to 1 or more.
Component Failure State and Accessibility
The vSAN components that reside on the magnetic disk or flash capacity device are marked asdegraded.
Behavior of vSAN
vSAN responds to the capacity device failure in the following ways.
vSAN Monitoring and Troubleshooting
VMware, Inc. 40

Parameter Behavior
Primary level offailures to tolerate
If the Primary level of failures to tolerate in the VM storage policy is equal to or greater than 1, the virtualmachine objects are still accessible from another ESXi host in the cluster. If resources are available, vSANstarts an automatic reprotection.
If the Primary level of failures to tolerate is set to 0, a virtual machine object is inaccessible if one of theobject's components resides on the failed capacity device.
Restore the virtual machine from a backup.
I/O operations onthe capacity device
vSAN stops all running I/O operations for 5-7 seconds until it re-evaluates whether an object is stillavailable without the failed component.
If vSAN determines that the object is available, all running I/O operations are resumed.
Rebuilding data vSAN examines whether the hosts and the capacity devices can satisfy the requirements for space andplacement rules for the objects on the failed device or disk group. If such a host with capacity is available,vSAN starts the recovery process immediately because the components are marked as degraded.
If resources are available, an automatic reprotect will occur.
A Flash Caching Device Is Not Accessible in a vSAN ClusterWhen a flash caching device fails, vSAN evaluates the accessibility of the objects on the disk group thatcontains the cache device, and rebuilds them on another host if possible and the Primary level offailures to tolerate is set to 1 or more.
Component Failure State and Accessibility
Both cache device and capacity devices that reside in the disk group, for example, magnetic disks, aremarked as degraded. vSAN interprets the failure of a single flash caching device as a failure of the entiredisk group.
Behavior of vSAN
vSAN responds to the failure of a flash caching device in the following way:
Parameter Behavior
Primary level offailures to tolerate
If the Primary level of failures to tolerate in the VM storage policy is equal to or greater than 1, thevirtual machine objects are still accessible from another ESXi host in the cluster. If resources areavailable, vSAN starts an automatic reprotection.
If the Primary level of failures to tolerate is set to 0, a virtual machine object is inaccessible if one of theobject's components is on the failed disk group.
I/O operations onthe disk group
vSAN stops all running I/O operations for 5-7 seconds until it re-evaluates whether an object is stillavailable without the failed component.
If vSAN determines that the object is available, all running I/O operations are resumed.
Rebuilding data vSAN examines whether the hosts and the capacity devices can satisfy the requirements for space andplacement rules for the objects on the failed device or disk group. If such a host with capacity is available,vSAN starts the recovery process immediately because the components are marked as degraded.
A Host Is Not Responding in a vSAN ClusterIf a host stops responding because of a failure or reboot of the host, vSAN waits for the host to recoverbefore vSAN rebuilds the components on the host elsewhere in the cluster.
vSAN Monitoring and Troubleshooting
VMware, Inc. 41

Component Failure State and Accessibility
The vSAN components that reside on the host are marked as absent.
Behavior of vSAN
vSAN responds to the host failure in the following way:
Parameter Behavior
Primary level offailures to tolerate
If the Primary level of failures to tolerate in the VM storage policy is equal to or greater than 1, the virtualmachine objects are still accessible from another ESXi host in the cluster. If resources are available, vSANstarts an automatic reprotection.
If the Primary level of failures to tolerate is set to 0, a virtual machine object is inaccessible if the object'scomponents reside on the failed host.
I/O operations onthe host
vSAN stops all running I/O operations for 5-7 seconds until it re-evaluates whether an object is still availablewithout the failed component.
If vSAN determines that the object is available, all running I/O operations are resumed.
Rebuilding data If the host does not rejoin the cluster within 60 minutes, vSAN examines whether some of the other hosts inthe cluster can satisfy the requirements for cache, space and placement rules for the objects on theinaccessible host. If such a host is available, vSAN starts the recovery process.
If the host rejoins the cluster after 60 minutes and recovery has started, vSAN evaluates whether tocontinue the recovery or stop it and resynchronize the original components.
Network Connectivity Is Lost in the vSAN ClusterWhen the connectivity between the hosts in the cluster is lost, vSAN determines the active partition andrebuilds the components from the isolated partition on the active partition if the connectivity is notrestored.
Component Failure State and Accessibility
vSAN determines the partition where more than 50 percent of the votes of an object are available. Thecomponents on the isolated hosts are marked as absent.
Behavior of vSAN
vSAN responds to a network failure in the following way:
vSAN Monitoring and Troubleshooting
VMware, Inc. 42

Parameter Behavior
Primary level offailures to tolerate
If the Primary level of failures to tolerate in the VM storage policy is equal to or greater than 1, the virtualmachine objects are still accessible from another ESXi host in the cluster. If resources are available, vSANstarts an automatic reprotection.
If the Primary level of failures to tolerate is set to 0, a virtual machine object is inaccessible if the object'scomponents are on the isolated hosts.
I/O operations onthe isolated hosts
vSAN stops all running I/O operations for 5-7 seconds until it re-evaluates whether an object is still availablewithout the failed component.
If vSAN determines that the object is available, all running I/O operations are resumed.
Rebuilding data If the host rejoins the cluster within 60 minutes, vSAN synchronizes the components on the host.
If the host does not rejoin the cluster within 60 minutes, vSAN examines whether some of the other hosts inthe cluster can satisfy the requirements for cache, space and placement rules for the objects on theinaccessible host. If such a host is available, vSAN starts the recovery process.
If the host rejoins the cluster after 60 minutes and recovery has started, vSAN evaluates whether tocontinue the recovery or stop it and resynchronize the original components.
A Storage Controller Fails in a vSAN ClusterWhen a storage controller fails, vSAN evaluates the accessibility of the objects on the disk groups thatare attached to the controller and rebuilds them on another host.
Symptoms
If a host contains a single storage controller and multiple disk groups, and all devices in all disk groupsare failed, then you might assume that a failure in the common storage controller is the root cause.Examine the VMkernel log messages to determine the nature of the fault.
Component Failure State and Accessibility
When a storage controller fails, the components on the flash caching devices and capacity devices in alldisk groups that are connected to the controller are marked as degraded.
If a host contains multiple controllers, and only the devices that are attached to an individual controller areinaccessible, then you might assume that this controller has failed.
Behavior of vSAN
vSAN responds to a storage controller failure in the following way:
Parameter Behavior
Primary level offailures to tolerate
If the Primary level of failures to tolerate in the VM storage policy is equal to or greater than 1, the virtualmachine objects are still accessible from another ESXi host in the cluster. If resources are available, vSANstarts an automatic reprotection.
If the Primary level of failures to tolerate is set to 0, a virtual machine object is inaccessible if the object'scomponents reside on the disk groups that are connected to the storage controller.
Rebuilding data vSAN examines whether the hosts and the capacity devices can satisfy the requirements for space andplacement rules for the objects on the failed device or disk group. If such a host with capacity is available,vSAN starts the recovery process immediately because the components are marked as degraded.
vSAN Monitoring and Troubleshooting
VMware, Inc. 43

Stretched Cluster Site Fails or Loses Network ConnectionA vSAN stretched cluster manages failures that occur due to the loss of a network connection betweensites or the temporary loss of one site.
Stretched Cluster Failure Handling
In most cases, the stretched cluster continues to operate during a failure and automatically recovers afterthe failure is resolved.
Table 5‑5. How Stretched Cluster Handles Failures
Type of Failure Behavior
Network Connection Lost Between Active Sites If the network connection fails between the two active sites, the witnesshost and the preferred site continue to service storage operations, andkeep data available. When the network connection returns, the twoactive sites are resynchronized.
Secondary Site Fails or Loses Network Connection If the secondary site goes offline or becomes isolated from the preferredsite and the witness host, the witness host and the preferred sitecontinue to service storage operations, and keep data available. Whenthe secondary site returns to the cluster, the two active sites areresynchronized.
Preferred Site Fails or Loses Network Connection If the preferred site goes offline or becomes isolated from the secondarysite and the witness host, the secondary site continues storageoperations if it remains connected to the witness host. When thepreferred site returns to the cluster, the two active sites areresynchronized.
Witness Host Fails or Loses Network Connection If the witness host goes offline or becomes isolated from the preferredsite or the secondary site, objects become noncompliant but dataremains available. VMs that are currently running are not affected.
Troubleshooting vSANExamine the performance and accessibility of virtual machines to diagnose problems in the vSAN cluster.
Verify Drivers, Firmware, Storage I/O Controllers Against the VMwareCompatibility GuideUse the vSAN Health Service to verify whether your hardware components, drivers, and firmware arecompatible with vSAN.
Using hardware components, drivers, and firmware that are not compatible with vSAN might causeproblems in the operation of the vSAN cluster and the virtual machines running on it.
The hardware compatibility health checks verify your hardware against the VMware Compatibility Guide.For more information about using the vSAN health service, see Chapter 3 Monitoring vSAN Health.
vSAN Monitoring and Troubleshooting
VMware, Inc. 44

Examining Performance in a vSAN ClusterMonitor the performance of virtual machines, hosts, and the vSAN datastore to identify potential storageproblems.
Monitor regularly the following performance indicators to identify faults in vSAN storage, for example, byusing the performance charts in the vSphere Web Client:
n Datastore. Rate of I/O operations on the aggregated datastore.
n Virtual Machine. I/O operations, memory and CPU usage, network throughput and bandwidth.
You can use the vSAN performance service to access detailed performance charts. For information aboutusing the performance service, see Chapter 4 Monitoring vSAN Performance. For more information aboutusing performance data in a vSAN cluster, see the vSAN Troubleshooting Reference Manual.
Network Misconfiguration Status in a vSAN ClusterAfter you enable vSAN on a cluster, the datastore is not assembled correctly because of a detectednetwork misconfiguration.
Problem
After you enable vSAN on a cluster, on the Summary tab for the cluster the Network Status for vSANappears as Misconfiguration detected.
Cause
One or more members of the cluster cannot communicate because of either of the following reasons:
n A host in the cluster does not have a VMkernel adapter for vSAN.
n The hosts cannot connect each other in the network.
Solution
Join the members of the cluster to the same network. See vSAN Planning and Deployment.
Virtual Machine Appears as Noncompliant, Inaccessible or Orphaned in vSANThe state of a virtual machine that stores data on a vSAN datastore appears as noncompliant,inaccessible or orphaned because of failures in the vSAN cluster.
Problem
A virtual machine on a vSAN datastore is in one of the following states that indicate a fault in the vSANcluster.
n The virtual machine is non-compliant and the compliance status of some of its object is noncompliant.See Examine the Compliance of a Virtual Machine in vSAN.
vSAN Monitoring and Troubleshooting
VMware, Inc. 45

n The virtual machine object is inaccessible or orphaned. See Examine the Failure State of aComponent.
If an object replica is still available on another host, vSAN forwards the I/O operations of the virtualmachine to the replica.
Cause
If the object of the virtual machine can no longer satisfy the requirement of the assigned VM storagepolicy, vSAN considers it noncompliant. For example, a host might temporarily lose connectivity. See Object States That Indicate Problems in vSAN.
If vSAN cannot locate a full replica or more than 50 percent of the votes for the object, the virtual machinebecomes inaccessible. If a vSAN detects that the .vmx file is not accessible because the VM HomeNamespace is corrupted, the virtual machine becomes orphaned. See Accessibility of Virtual MachinesUpon a Failure in vSAN.
Solution
If the cluster contains enough resources, vSAN automatically recovers the corrupted objects if the failureis permanent.
If the cluster does not have enough resources to rebuild the corrupted objects, extend the space in thecluster. See Administering VMware vSAN.
Attempt to Create a Virtual Machine on vSAN FailsWhen you try to deploy a virtual machine in a vSAN cluster, the operation fails with an error that thevirtual machine files cannot be created.
Problem
The operation for creating a virtual machine fails with an error status: Cannot complete file creationoperation.
Cause
The deployment of a virtual machine on vSAN might fail for several reasons.
n vSAN cannot allocate space for the virtual machine storage policies and virtual machine objects.Such a failure might occur if the datastore does not have enough usable capacity, for example, if aphysical disk is temporarily disconnected from the host.
n The virtual machine has very large virtual disks and the hosts in the cluster cannot provide storage forthem based on the placement rules in the VM storage policy
vSAN Monitoring and Troubleshooting
VMware, Inc. 46

For example, if the Primary level of failures to tolerate in the VM storage policy is set to 1, vSANmust store two replicas of a virtual disk in the cluster, each replica on a different host. The datastoremight have this space after aggregating the free space on all hosts in the cluster. However, no twohosts can be available in the cluster, each providing enough space to store a separate replica of thevirtual disk.
vSAN does not move components between hosts or disks groups to free space for a new replica,even though the cluster might contain enough space for provisioning the new virtual machine.
Solution
u Verify the state of the capacity devices in the cluster.
a Navigate to the vSAN cluster.
b On the Monitor tab, click vSAN and select Physical Disks.
c Examine the capacity and health status of the devices on the hosts in the cluster.
Stretched Cluster Configuration Error When Adding a HostBefore adding new hosts to a stretched cluster, all current hosts must be connected. If a current host isdisconnected, the configuration of the new host is incomplete.
Problem
After you add a host to a stretched cluster in which some hosts are disconnected, on the Summary tab forthe cluster the Configuration Status for vSAN appears as Unicast agent unset on host.
Cause
When a new host joins a stretched cluster, vSAN must update the configuration on all hosts in the cluster.If one or more hosts are disconnected from the vCenter Server, the update fails. The new hostsuccessfully joins the cluster, but its configuration is incomplete.
Solution
Verify that all hosts are connected to vCenter Server, and click the link provided in the ConfigurationStatus message to update the configuration of the new host.
If you cannot rejoin the disconnected host, remove the disconnected host from the cluster, and click thelink provided in the Configuration Status message to update the configuration of the new host.
Stretched Cluster Configuration Error When Using RVC to Add a HostIf you use the RVC tool to add a host to a stretched cluster, the configuration of the new host isincomplete.
Problem
After you use the RVC tool to add a host to a stretched cluster, on the Summary tab for the cluster theConfiguration Status for vSAN appears as Unicast agent unset on host.
vSAN Monitoring and Troubleshooting
VMware, Inc. 47

Cause
When a new host joins a stretched cluster, vSAN must update the configuration on all hosts in the cluster. If you use the RVC tool to add the host, the update does not occur. The new host successfully joins thecluster, but its configuration is incomplete.
Solution
Verify that all hosts are connected to vCenter Server, and click the link provided in the ConfigurationStatus message to update the configuration of the new host.
Cannot Add or Remove the Witness Host in a Stretched ClusterBefore adding or removing the witness host in a stretched cluster, all current hosts must be connected. Ifa current host is disconnected, you cannot add or remove the witness host.
Problem
When you add or remove a witness host in a stretched cluster in which some hosts are disconnected, theoperation fails with an error status: The operation is not allowed in the current state. Notall hosts in the cluster are connected to Virtual Center.
Cause
When the witness host joins or leaves a stretched cluster, vSAN must update the configuration on allhosts in the cluster. If one or more hosts are disconnected from the vCenter Server, the witness hostcannot be added or removed.
Solution
Verify all hosts are connected to vCenter Server, and retry the operation. If you cannot rejoin thedisconnected host, remove the disconnected host from the cluster, and then you can add or remove thewitness host.
Disk Group Becomes LockedIn an encrypted vSAN cluster, when communication between a host and the KMS is lost, the disk groupcan become locked if the host reboots.
Problem
vSAN locks a host's disk groups when the host reboots and it cannot get the KEK from the KMS. Thedisks behave as if they are unmounted. Objects on the disks become inaccessible.
You can view a disk group's health status on the Disk Management page in the vSphere Web Client. AnEncryption health check warning notifies you that a disk is locked.
Cause
Hosts in an encrypted vSAN cluster do not store the KEK on disk. If a host reboots and cannot get theKEK from the KMS, vSAN locks the host's disk groups.
vSAN Monitoring and Troubleshooting
VMware, Inc. 48

Solution
To exit the locked state, you must restore communication with the KMS and reestablish the trustrelationship.
Replacing Existing Hardware ComponentsUnder certain conditions, you must replace hardware components, drivers, firmware, and storage I/Ocontrollers in the vSAN cluster.
In vSAN, you should replace hardware devices when you encounter failures or if you must upgrade yourcluster.
Replace a Flash Caching Device on a HostYou should replace a flash caching device if you detect a failure or when you must upgrade it. Before youphysically unplug a flash device from the host, you must manually remove the device from vSAN.
Caution If you decommission the flash caching device without removing it from vSAN first, vSAN usessmaller amount of cache than expected. As a result, the cluster performance becomes degraded.
When you replace a flash caching device, the virtual machines on the disk group become inaccessibleand the components on the group are marked as degraded. See A Flash Caching Device Is NotAccessible in a vSAN Cluster.
Prerequisites
n Verify that the storage controllers on the hosts are configured in passthrough mode and support thehot-plug feature.
If the storage controllers are configured in RAID 0 mode, see the vendor documentation forinformation about adding and removing devices.
n If you upgrade the flash caching device, verify the following requirements:
n If you upgrade the flash caching device, verify that the cluster contains enough space to migratethe data from the disk group that is associated with the flash device.
n Place the host in maintenance mode.
Procedure
1 Navigate to the vSAN cluster.
2 On the Configure tab, click Disk Management under vSAN.
3 Select the disk group that contains the device that you want to replace.
4 Select the flash caching device and click Remove selected disk(s) from disk group.
After the flash caching device is deleted from the vSAN cluster, the cluster details reflect the currentcluster capacity and configuration settings. vSAN discards the disk group memberships, deletespartitions, and removes stale data from all devices.
vSAN Monitoring and Troubleshooting
VMware, Inc. 49

What to do next
1 Add a new device to the host.
The host automatically detects the device.
2 If the host is unable to detect the device, perform a device rescan.
Replace a Capacity DeviceYou should replace a flash capacity device or a magnetic disk if you detect a failure or when you upgradeit. Before you physically remove the device from the host, you must manually delete the device fromvSAN.
When you unplug a capacity device without removing it from the vSAN cluster, the components on thedisk are marked as absent. If the capacity device fails, the components on the disk are marked asdegraded. When the number of failures of the object replica with the affected components exceeds theFTT value, the virtual machines on the disk become inaccessible. See Capacity Device Not Accessible ina vSAN Cluster.
Note If your vSAN cluster uses deduplication and compression, you must remove the entire disk groupfrom the cluster before you replace the device.
Prerequisites
n Verify that the storage controllers on the hosts are configured in passthrough mode and support thehot-plug feature.
If the storage controllers are configured in RAID 0 mode, see the vendor documentation forinformation about adding and removing devices.
n If you upgrade the capacity device, verify the following requirements:
n Verify that the cluster contains enough space to migrate the data from the capacity device.
n Place the host in maintenance mode.
Procedure
1 Navigate to the vSAN cluster.
2 On the Configure tab, click Disk Management under vSAN.
3 Select the disk group that contains the device that you want to replace.
4 Select the flash capacity device or magnetic disk, and click Remove selected disk(s) from diskgroup.
What to do next
1 Add a new device to the host.
The host automatically detects the device.
2 If the host is unable to detect the device, perform a device rescan.
vSAN Monitoring and Troubleshooting
VMware, Inc. 50

Remove a Device from a Host by Using an ESXCLI CommandIf you detect a failed storage device or if you upgrade a device, you can manually remove it from a hostby using an ESXCLI command.
If you remove a flash caching device, vSAN deletes the disk group that is associated with the flash deviceand all its member devices.
Prerequisites
Verify that the storage controllers on the hosts are configured in passthrough mode and support the hot-plug feature.
If the storage controllers are configured in RAID 0 mode, see the vendor documentation for informationabout adding and removing devices.
Procedure
1 Open an SSH connection to the ESXi host.
2 To identify the device ID of the failed device, run this command and learn the device ID from theoutput.
esxcli vsan storage list
3 To remove the device from vSAN, run this command.
esxcli vsan storage remove -d device_id
What to do next
1 Add a new device to the host.
The host automatically detects the device.
2 If the host is unable to detect the device, perform a device rescan.
Shutting Down and Restarting the vSAN ClusterWhen necessary, you can shut down the entire vSAN cluster.
If you plan to shut down the vSAN cluster, you do not need to manually disable vSAN on the cluster.
Procedure
1 Power off all virtual machines (VMs) running in the vSAN cluster, unless vCenter Server is running onthe cluster.
If vCenter Server is hosted in the vSAN cluster, do not power off the vCenter Server VM.
vSAN Monitoring and Troubleshooting
VMware, Inc. 51

2 Verify that all resynchronization tasks are complete.
Click the Monitor tab, and select vSAN > Resyncing Objects.
3 If vCenter Server is hosted in the vSAN cluster, power off the vCenter Server VM.
The vSphere Client becomes unavailable.
4 Place the ESXi hosts in maintenance mode.
Connect to the host and use the host client or esxcli command to place the host into maintenancemode with no data migration (no action).
5 Power off the hosts after they have successfully entered maintenance mode.
6 Power on the ESXi hosts.
a On the physical box where ESXi is installed, press the power button until the power-on sequencebegins.
The ESXi host starts, locates its VMs, and functions normally.
After you power on the hosts, the vSAN cluster is automatically recreated.
You can ignore any misconfiguration status message if you did not make network configurationchanges and the vSAN cluster was working as expected before you shut down the cluster. Themessage disappears after at least three hosts join the cluster.
7 Take the hosts out of maintenance mode.
8 Restart the VMs.
vSAN Monitoring and Troubleshooting
VMware, Inc. 52