Troubleshooting Secrets: Infrastructure Revealed! · A Word On `top` A Word On `top` Start ... When...
72
Infrastructure Troubleshooting Secrets: Revealed! Amin Astaneh, DevOps Track, DrupalCon Nashville
Transcript of Troubleshooting Secrets: Infrastructure Revealed! · A Word On `top` A Word On `top` Start ... When...

Infrastructure Troubleshooting Secrets:
Revealed!
Amin Astaneh, DevOps Track, DrupalCon Nashville

Who Am I?
● Amin Astaneh● Senior Manager, SRE at Acquia● Served on Ops Team for 5 years● Been on-call countless times● Been paged countless times● Heavily contributed to incident
response process and tooling● Built SRE competency, DevOps
initiatives for 2 years

Agenda● Intro● The USE Method● Hardware Resources● Software Resources● Process Introspection● Outage Scenarios


Presentation Objectives● Gain a basic understanding of the infrastructure level● Learn a simple set of processes and tools to gather
information about your infrastructure● Learn how these tools can be used to identify current
pain points in your Drupal availability/performance
5 years of Ops experience packed into less than 1 hour!
Slides will be uploaded after the presentation!

Misconceptions AboutPeople That Understand
Infrastructure


The Big Secret● They are HUMAN● They have tools● They have processes● They have heuristics based on past experience
You can learn what they know!

Before We Begin● LAMP (GNU/Linux)● You know CLI basics● You have SSH access to your infrastructure

The USE Method

Origin of USE MethodBrendan Gregg, Performance Engineer at Netflix:
“I developed the USE Method to teach others how to solve common performance issues quickly, without overlooking important areas.. it is intended to be simple, straightforward, complete, and fast.”
http://www.brendangregg.com/usemethod.html

The USE MethodFor every resource, check:
● Utilization● Saturation● Errors

Resources● All physical server functional components
○ CPU(s), Memory, Disk(s), Network Adapter(s)
● All software functional components○ PHP Proc Pool, MySQL innodb_buffer_pool, Varnish cache
● All OS functional components○ Max processes, max open files, max tcp connections

UtilizationThe average time that a resource was busy doing work.
Usually represented as a percentage over an interval.
Eg: 75% of available memory was being used on Server X over the last 5 seconds.

SaturationThe degree to which the resource has extra work which it can't service, often queued.
Eg: queue_wait values in the Drupal request log are increasing due to all PHP processes handling requests.
This can be measured or observed via other signals (logs, error messages, etc)

ErrorsThe total count of a resource demonstrating that it is not functioning as designed or intended (error events).
Eg: The CLI printed ‘Input/output error’ when I tried to read a file from disk.
This can also be measured or observed via other signals (logs, error messages, etc)

Hardware Resources

Main Hardware Resources
● CPU● Memory● Storage (Capacity, I/O)● Network I/O

A Word On `top`

A Word On `top`
Start with single-purpose tools first before using the all-in-one tools like top and its brethren.

CPUThere are several types of CPU Utilization.
Let’s discuss the common ones:
● USR: Time spent in user apps (Eg: Drupal, Cron)● SYS: Time spent in the kernel (Eg: reading/writing to the
network device)● IOWAIT: Time spent waiting on storage devices (Eg:
reading/writing to disks)● IDLE: Time spent not doing anything. (0%=saturation)
You can observe these metrics in aggregate or per CPU core, which is important when considering single-threaded processes (not common).

Measuring CPUSimple:
● `dstat -c`: Recent, colorized● `mpstat 1`: Older, non-colorized
Complex:
● `htop`: colorized● `top`: classic and ubiquitous● `atop`: supports process accounting
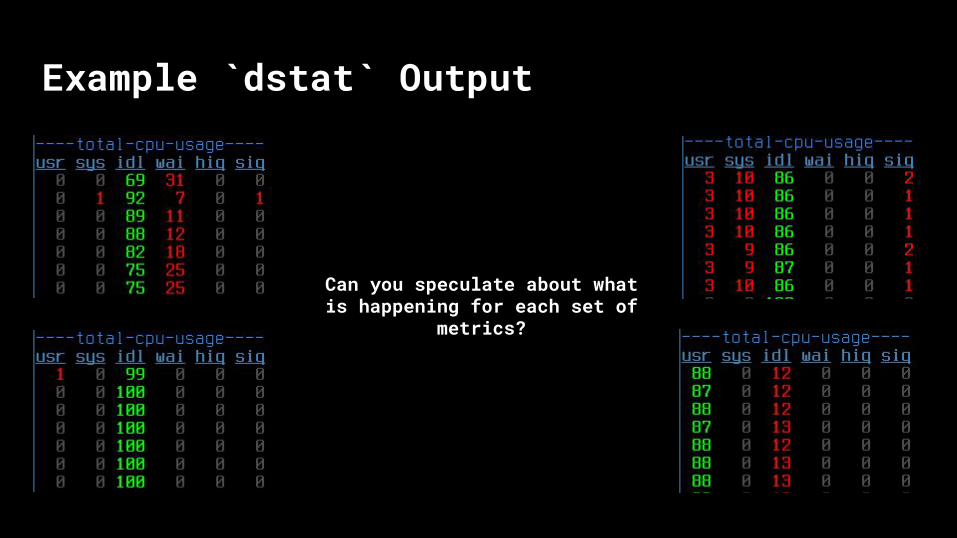
Example `dstat` Output
Can you speculate about what is happening for each set of
metrics?

Example `dstat` Output
Can you speculate about what is happening for each set of
metrics?
SYSTEM IS IDLE
WRITING LARGE FILE
CPU STRESS TEST
NETWORK FILETRANSFER

Let’s Talk About Load Averages`uptime` and `top` displays the load average, which is basically the number of processes competing for CPU resources over 1m, 5m, and 15m.
A general rule: If the load average >= the number of server cores, that is a sign of saturation.
(You can easily find number of cores with `nproc --all`.)

Memory Servers have a pool of RAM used for running applications. You can check its utilization with `free -m`:
● Used: memory used by actual processes● Shared: memory shared between processes● Buffers: used for reading/writing to devices● Cache: stores copies of files in memory for fast access● Available: the actual amount of memory free for use
The metric you will usually care about is ‘available’.

Memory, cont. You might see output from `free -m` that looks like this. Here’s now to determine how much memory is available on a system:
An entertaining reference: https://www.linuxatemyram.com/

Memory SaturationWhat happens when you start to run out of memory?
Swapping.
Contents of RAM will get stored in the swap partition or file, if configured. Hard disk storage is several orders of magnitude slower than RAM, so performance will suffer.
You can check with `free -m`.

Memory SaturationWhen memory is completely exhausted, the Linux Kernel’s OOM-killer will kill processes to free up memory.
You can check for these events by looking at the kernel log or running `dmesg`:
Mar 15 10:10:26 ubuntu kernel: mysqld invoked oom-killer: gfp_mask=0x201da, order=0, oom_score_adj=-1000

Disk StorageTo measure utilization of storage capacity of your local disks and network-attached storage, use `df -m`.
When Use% is at 100%, the disk is full (saturated).
Pretty straightforward, right?

Disk Storage.. or is it?
Another important thing to measure is the number of inodes (or loosely, the total number of files) on the filesystem.
Filesystems have a max number of inodes they can store that cannot be changed.
Watch out for this! Run `df -i`!

Disk I/OThe only command you’ll ever need: `iostat -mxt 1`:
Every second, print eXtended statistics in megabytes.
Let’s discuss what’s happening here! Key metrics are:
● rMB/s and wMB/s: read and write throughput in megabytes● r_await/w_await: average time to service read and write
requests. Sustained high values (> 1000) indicate saturation.

Network I/OMost systems have gigabit network adapters.
You can check the theoretical maximum your network interface can support with ethtool:
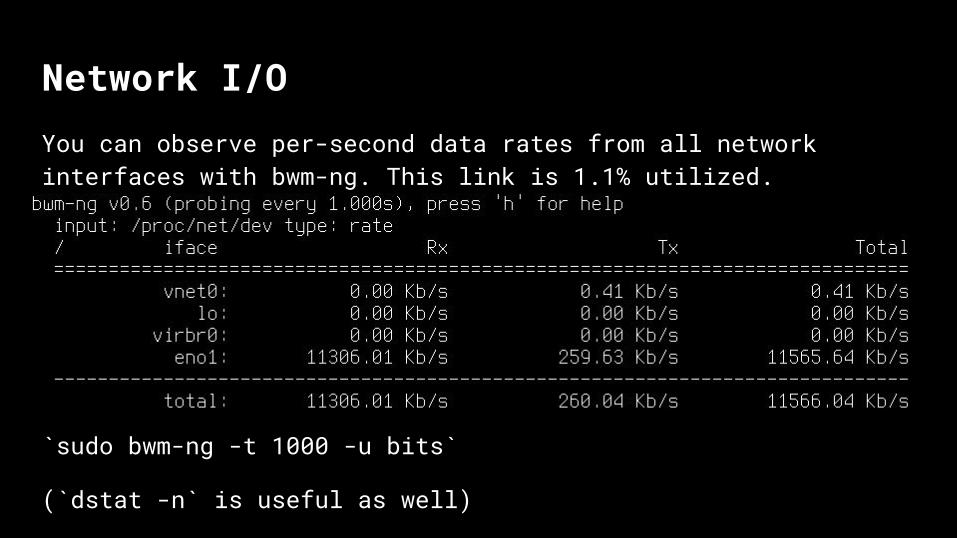
Network I/OYou can observe per-second data rates from all network interfaces with bwm-ng. This link is 1.1% utilized.
`sudo bwm-ng -t 1000 -u bits`
(`dstat -n` is useful as well)

Software Resources
Common Types of Software ResourcesAll software services (Eg: Apache, MySQL, etc) have some form of tunable resources that introduce constraints.
● Process pools● Connection limits● Memory allocations
We’ll discuss the common ones and how to detect saturation.

PHP’s memory_limitThis limits the amount of memory that a single PHP execution can use.
Saturation can be checked in the webserver error logs:
“Fatal error: Allowed memory size of 134217728 bytes exhausted (tried to allocate 44 bytes) in /var/www/html/test.php on line 36”
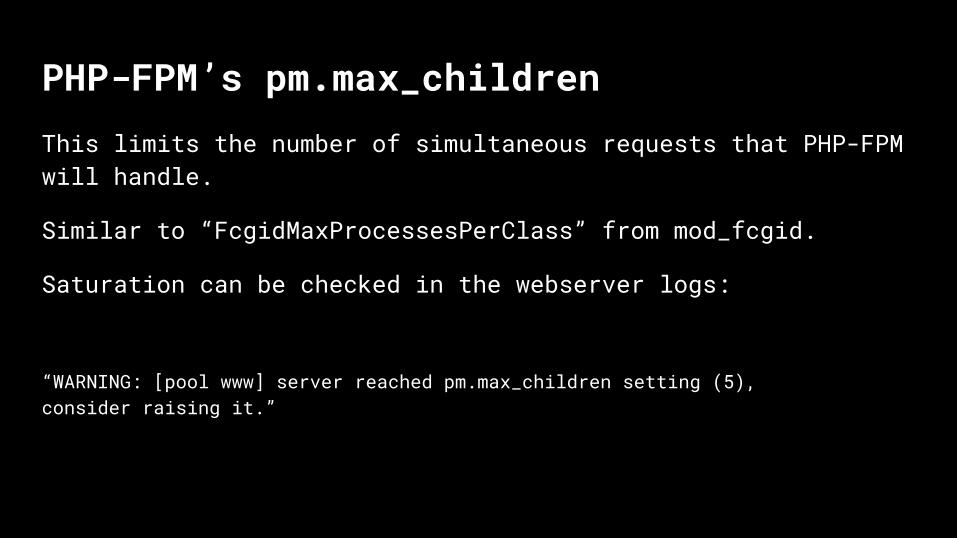
PHP-FPM’s pm.max_children This limits the number of simultaneous requests that PHP-FPM will handle.
Similar to “FcgidMaxProcessesPerClass” from mod_fcgid.
Saturation can be checked in the webserver logs:
“WARNING: [pool www] server reached pm.max_children setting (5), consider raising it.”

MySQL’s max_connectionsThis limits the number of concurrent connections that MySQL will handle.
Saturation can be checked in the webserver error logs:
“SQLSTATE[08004] [1040] Too many connections”

Apache’s MaxRequestWorkersThis limits the number of simultaneous requests that Apache will handle.
Formerly known as MaxClients prior to 2.3.13.
Saturation can be checked in the Apache error logs:
“server reached MaxRequestWorkers setting”

MySQL’s innodb_buffer_pool_sizeThe InnoDB buffer pool is a cache for your data and indexes in MySQL, which speeds up read requests.
Saturation can be checked by seeing how often MySQL performs cache evictions by flushing to disk.
https://dev.mysql.com/doc/refman/5.7/en/server-status-variables.html#statvar_Innodb_buffer_pool_wait_free

Varnish Cache SizeVarnish deflects backend requests to Drupal by caching and serving previous requests, which improves performance.
Saturation can be checked by seeing the rate that Varnish performs cache evictions by rate of change to the n_lru_nuked counter.

Don’t just increase settings!A common urge is to just increase connections and process limits. Resist the temptation.
For example:
Blindly increasing FPM’s pm.max_children may saturate available memory and make a performance problem even worse.
Custom ini_set() of memory_limit to a large value will produce similar results.

Process Introspection

Yes, you can actually do this.(though it doesn’t look as impressive as it does in Hackers...)

strace: a system call tracer● Attaches to running programs and shows in real time their
activity● System calls are basically how a program asks the OS to
do something (file or network read/write, memory mgmt)● Does slow down execution

strace basic example
`strace cat /dev/null`
There’s a manual page for each syscall, too!
`man 2 <syscall>`

Now a more interesting example..
Output from `strace -f -p <PID> -s 1024`, tracing an PHP-FPM parent and its children for https://dri.es

Let’s break it down..● -f: follows child processes● -p: process ID, or PID● -s 1024: print up to 1024 characters of output from each
syscall
Extra flags:
● -e 'trace=sendto,recvfrom': only prints those syscalls● -e 'trace=!gettimeofday': excludes syscalls● -T: print time spent in each syscall

So what can I do with it?When tracing a PHP process:
● Observe MySQL statements● Observe Memcached statements● Observe HTTP responses● Observe file accesses● Measure time spent in each syscall

lsof: list open files● Prints open files and network connections for all running
processes or for a single process (-p PID)● Lists the file descriptor ids, enabling cross-referencing
with strace


Outage Scenarios

My Troubleshooting ‘Kata’● USE Method: Identify all saturated resources (constraints)● Plan: Choose the main constraint and decide how to address it● Do: Implement the change● Check: USE Method: Is the resource still a constraint?● Act
○ If site is back up: SUCCESS○ If improvement but still unresolved: Keep change, plan with
new main constraint○ If unchanged or worse: undo change and plan again


Scenario 1 ● Our site either loads slowly or times out with a 503 when
requesting an uncached page.● We apply USE Method to the balancers and find no saturation.● We apply USE Method to the web servers, and find:
○ All PHP-FPM processes are in use (pm.max_children warnings)○ CPU is mostly idle. When running top/ps, the PHP processes aren’t the
top consumers.○ lsof on all of the php-fpm processes shows this output:
php-fpm 1161 drupal 10u IPv4 126303135 0t0 TCP server-123.custom.domain.tld:23319->ec2-50-123-321-2.compute-1.amazonaws.com:https (ESTABLISHED)
Can you guess what’s happening?

Scenario 1 ● In Acquia Operations, we call this scenario an ‘external call’,
where a Drupal site is making a call to a 3rd party service.● If the third party service is slow/down, it can directly impact
performance of your site as your code is waiting for a response.● We have even seen instances of sites making calls to itself!● The solution:
○ remove dependence on 3rd party services where possible○ program defensively to gracefully degrade when it is
unavailable.

Scenario 2 ● Our site either loads slowly or times out with a 503 when
requesting an uncached page.● We apply USE Method to the balancers and find no saturation.● We apply USE Method to the web servers, and find:
○ All PHP-FPM processes are in use (pm.max_children warnings)○ CPU is 50% utilized by PHP-FPM processes in USR.
● We apply USE Method to the database server, and find this metric for the database volume by running iostat:
What’s happening here?

Scenario 2 We suspect very high write operations on the database, and decide to print MySQL’s processlist. (`mytop -d mysql`). We see a large quantity of statements that look like this:
12514 drupal web-123 drupal 3 Query INSERT INTO watchdog (uid, type, message, variables, severity, link, location, referer, hostname, timestamp) VALUES ('0', 'stuff
What did we discover?

Scenario 2 ● The site had the dblog module enabled.● In situations where a site is emitting a lot of code errors,
massive write operations will happen to the database, saturating the underlying storage.
● Solution: don’t use the dblog module. Use syslog instead.

Scenario 2 ● The site had the dblog module enabled.● In situations where a site is emitting a lot of code errors,
massive write operations will happen to the database, saturating the underlying storage.
● Solution: don’t use the dblog module. Use syslog instead.

Let’s Recap!

Let’s Recap!● Troubleshooting infrastructure is accessible to mortals● The USE Method● Hardware Resources● Software Resources● Process Introspection● PDCA as a process for improving performance

Q/A

What did you think?
Locate this session at the DrupalCon Nashville website:
http://nashville2018.drupal.org/schedule
Take the Survey!
https://www.surveymonkey.com/r/DrupalConNashville

Join us forcontribution sprints
Friday, April 13, 2018
9:00-18:00Room: 103
Mentored Core sprint
First timesprinter workshop
Generalsprint
#drupalsprint
9:00-12:00Room: 101
9:00-18:00Room: 104

Media Credits● The Fellowship of the Ring (New Line Cinema)● Ghost In The Shell (Kodansha, Bandai Visual, Manga Entertainment)● Hackers (United Artists)● Zelda II: The Adventure of Link (Nintendo)● The Princess Bride (Act III Communications)● Superman (Max Fleischer Studios, Paramount Pictures)● PDCA Diagram (Karn G. Bulsuk, http://www.bulsuk.com)

Amin AstanehT: @aastanehIRC: [email protected]