Tropospheric distribution of sulphate aerosols mass and number
12
Atmos. Chem. Phys., 12, 6185–6196, 2012 www.atmos-chem-phys.net/12/6185/2012/ doi:10.5194/acp-12-6185-2012 © Author(s) 2012. CC Attribution 3.0 License. Atmospheric Chemistry and Physics Tropospheric distribution of sulphate aerosols mass and number concentration during INDOEX-IFP and its transport over the Indian Ocean: a GCM study S. Verma 1,* , O. Boucher 2 , M. Shekar Reddy 2 , H. C. Upadhyaya 1 , P. Le Van 3 , F. S. Binkowski 4 , and O. P. Sharma 1 1 Centre for Atmospheric Sciences, Indian Institute of Technology Delhi, New Delhi, India 2 Laboratoire d’Optique Atmosph´ erique, CNRS/Universit´ e des Sciences et Technologies de Lille, 59655 Villeneuve d’Ascq Cedex, France 3 Laboratoire de M´ et´ eorologie Dynamique Ecole Normale Sup´ erieure, 24 rue Lhomond, 75231 Paris Cedex 05, France 4 Environmental Science and Engineering, University of North Carolina, Chapel Hill, USA * now at: Centre of Excellence in Climatology, Birla Institute of Technology (BIT) Mesra, Extn Centre Jaipur, Rajasthan, India Correspondence to: S. Verma ([email protected]) Received: 11 October 2004 – Published in Atmos. Chem. Phys. Discuss.: 31 January 2005 Revised: 14 June 2012 – Accepted: 23 June 2012 – Published: 18 July 2012 Abstract. The sulphate aerosols mass and number concen- tration during the Indian Ocean Experiment (INDOEX) In- tensive Field Phase-1999 (INDOEX-IFP) has been simulated using an interactive chemistry GCM. The model considers an interactive scheme for feedback from chemistry to meteo- rology with internally resolving microphysical properties of aerosols. In particular, the interactive scheme has the ability to predict both particle mass and number concentration for the Aitken and accumulation modes as prognostic variables. On the basis of size distribution retrieved from the ob- servations made along the cruise route during IFP-1999, the model successfully simulates the order of magnitude of aerosol number concentration. The results show the south- ward migration of minimum concentrations, which follows ITCZ (Inter Tropical Convergence Zone) migration. Sulphate surface concentration during INDOEX-IFP at Kaashidhoo (73.46 ◦ E, 4.96 ◦ N) gives an agreement within a factor of 2 to 3. The measured aerosol optical depth (AOD) from all aerosol species at KCO was 0.37 ±0.11 while the model sim- ulated sulphate AOD ranged from 0.05 to 0.11. As sulphate constitutes 29 % of the observed AOD, the model predicted values of sulphate AOD are hence fairly close to the mea- sured values. The model thus has capability to predict the vertically integrated column sulphate burden. Furthermore, the model results indicate that Indian contribution to the es- timated sulphate burden over India is more than 60 % with values upto 40 % over the Arabian Sea. 1 Introduction The aerosol effects on climate can be large and complex due to the fact that aerosols chemical composition, abun- dance and size distribution are highly variable, both spa- tially and temporally. Most of the earliest investigations on direct aerosol forcing have focused on sulphate aerosols be- cause of their importance as an anthropogenic aerosol com- ponent (Charlson et al., 1992; Kiehl and Briegleb, 1993). Sulphate particle is an important component of atmospheric aerosols. Sulphate make up a substantial fraction of tropo- spheric aerosol in both urban and remote/rural areas (Barth and Church, 1999; Ramanathan et al., 2001; Mallet et al., 2004). Sulphate aerosols are capable of modifying the cli- mate not only by scattering incoming sunlight back to space (direct effect) but also by altering the properties of clouds (in- direct effect). In order to further understand sulphate aerosol- climate interactions, the present study is carried out with the Laboratoire de M´ et´ eorologie Dynamique interactive chem- istry global model (Verma et al., 2007) to produce the simu- lation of INDOEX-IFP. The three fundamental objectives of this study are 1. to simulate sulphate aerosol dynamics as prognostic variables, Published by Copernicus Publications on behalf of the European Geosciences Union.
Transcript of Tropospheric distribution of sulphate aerosols mass and number

Atmos. Chem. Phys., 12, 6185–6196, 2012www.atmos-chem-phys.net/12/6185/2012/doi:10.5194/acp-12-6185-2012© Author(s) 2012. CC Attribution 3.0 License.
AtmosphericChemistry
and Physics
Tropospheric distribution of sulphate aerosols mass and numberconcentration during INDOEX-IFP and its transport over theIndian Ocean: a GCM study
S. Verma1,*, O. Boucher2, M. Shekar Reddy2, H. C. Upadhyaya1, P. Le Van3, F. S. Binkowski4, and O. P. Sharma1
1Centre for Atmospheric Sciences, Indian Institute of Technology Delhi, New Delhi, India2Laboratoire d’Optique Atmospherique, CNRS/Universite des Sciences et Technologies de Lille, 59655 Villeneuve d’AscqCedex, France3Laboratoire de Meteorologie Dynamique Ecole Normale Superieure, 24 rue Lhomond, 75231 Paris Cedex 05, France4Environmental Science and Engineering, University of North Carolina, Chapel Hill, USA* now at: Centre of Excellence in Climatology, Birla Institute of Technology (BIT) Mesra, Extn Centre Jaipur, Rajasthan, India
Correspondence to:S. Verma ([email protected])
Received: 11 October 2004 – Published in Atmos. Chem. Phys. Discuss.: 31 January 2005Revised: 14 June 2012 – Accepted: 23 June 2012 – Published: 18 July 2012
Abstract. The sulphate aerosols mass and number concen-tration during the Indian Ocean Experiment (INDOEX) In-tensive Field Phase-1999 (INDOEX-IFP) has been simulatedusing an interactive chemistry GCM. The model considersan interactive scheme for feedback from chemistry to meteo-rology with internally resolving microphysical properties ofaerosols. In particular, the interactive scheme has the abilityto predict both particle mass and number concentration forthe Aitken and accumulation modes as prognostic variables.
On the basis of size distribution retrieved from the ob-servations made along the cruise route during IFP-1999,the model successfully simulates the order of magnitude ofaerosol number concentration. The results show the south-ward migration of minimum concentrations, which followsITCZ (Inter Tropical Convergence Zone) migration. Sulphatesurface concentration during INDOEX-IFP at Kaashidhoo(73.46◦ E, 4.96◦ N) gives an agreement within a factor of2 to 3. The measured aerosol optical depth (AOD) from allaerosol species at KCO was 0.37±0.11 while the model sim-ulated sulphate AOD ranged from 0.05 to 0.11. As sulphateconstitutes 29 % of the observed AOD, the model predictedvalues of sulphate AOD are hence fairly close to the mea-sured values. The model thus has capability to predict thevertically integrated column sulphate burden. Furthermore,the model results indicate that Indian contribution to the es-timated sulphate burden over India is more than 60 % withvalues upto 40 % over the Arabian Sea.
1 Introduction
The aerosol effects on climate can be large and complexdue to the fact that aerosols chemical composition, abun-dance and size distribution are highly variable, both spa-tially and temporally. Most of the earliest investigations ondirect aerosol forcing have focused on sulphate aerosols be-cause of their importance as an anthropogenic aerosol com-ponent (Charlson et al., 1992; Kiehl and Briegleb, 1993).Sulphate particle is an important component of atmosphericaerosols. Sulphate make up a substantial fraction of tropo-spheric aerosol in both urban and remote/rural areas (Barthand Church, 1999; Ramanathan et al., 2001; Mallet et al.,2004). Sulphate aerosols are capable of modifying the cli-mate not only by scattering incoming sunlight back to space(direct effect) but also by altering the properties of clouds (in-direct effect). In order to further understand sulphate aerosol-climate interactions, the present study is carried out with theLaboratoire de Meteorologie Dynamique interactive chem-istry global model (Verma et al., 2007) to produce the simu-lation of INDOEX-IFP. The three fundamental objectives ofthis study are
1. to simulate sulphate aerosol dynamics as prognosticvariables,
Published by Copernicus Publications on behalf of the European Geosciences Union.
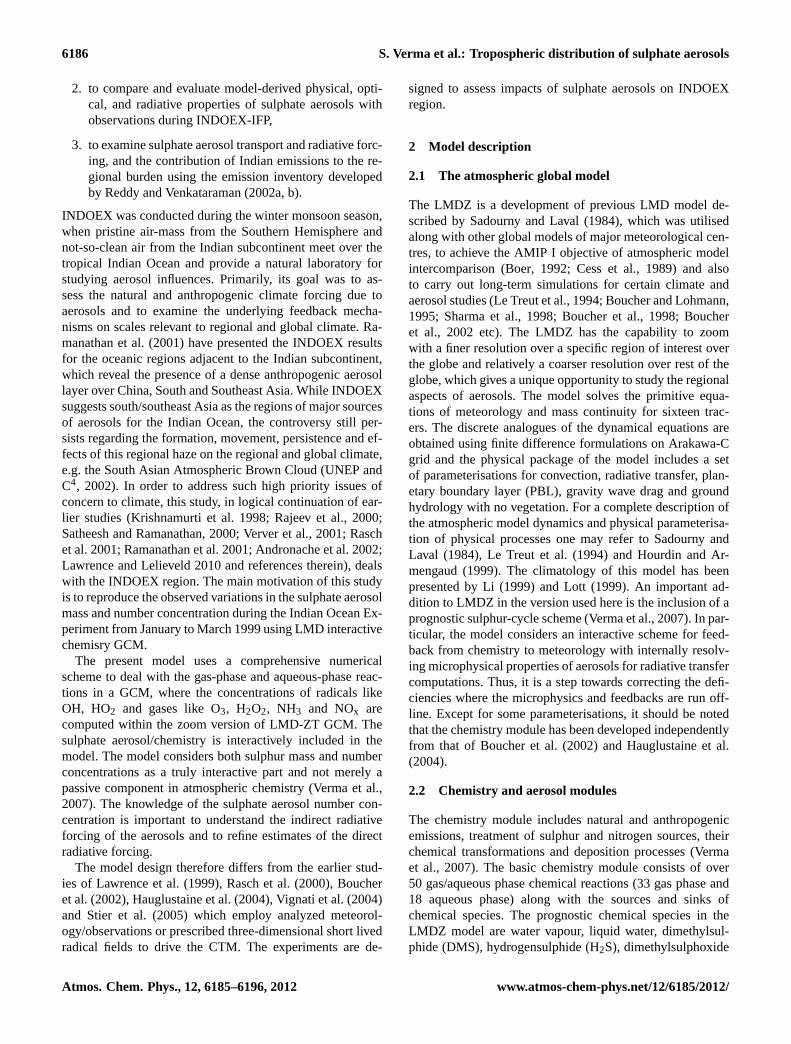
6186 S. Verma et al.: Tropospheric distribution of sulphate aerosols
2. to compare and evaluate model-derived physical, opti-cal, and radiative properties of sulphate aerosols withobservations during INDOEX-IFP,
3. to examine sulphate aerosol transport and radiative forc-ing, and the contribution of Indian emissions to the re-gional burden using the emission inventory developedby Reddy and Venkataraman (2002a, b).
INDOEX was conducted during the winter monsoon season,when pristine air-mass from the Southern Hemisphere andnot-so-clean air from the Indian subcontinent meet over thetropical Indian Ocean and provide a natural laboratory forstudying aerosol influences. Primarily, its goal was to as-sess the natural and anthropogenic climate forcing due toaerosols and to examine the underlying feedback mecha-nisms on scales relevant to regional and global climate.Ra-manathan et al.(2001) have presented the INDOEX resultsfor the oceanic regions adjacent to the Indian subcontinent,which reveal the presence of a dense anthropogenic aerosollayer over China, South and Southeast Asia. While INDOEXsuggests south/southeast Asia as the regions of major sourcesof aerosols for the Indian Ocean, the controversy still per-sists regarding the formation, movement, persistence and ef-fects of this regional haze on the regional and global climate,e.g. the South Asian Atmospheric Brown Cloud (UNEP andC4, 2002). In order to address such high priority issues ofconcern to climate, this study, in logical continuation of ear-lier studies (Krishnamurti et al.1998; Rajeev et al., 2000;Satheesh and Ramanathan, 2000; Verver et al., 2001; Raschet al.2001; Ramanathan et al.2001; Andronache et al.2002;Lawrence and Lelieveld2010and references therein), dealswith the INDOEX region. The main motivation of this studyis to reproduce the observed variations in the sulphate aerosolmass and number concentration during the Indian Ocean Ex-periment from January to March 1999 using LMD interactivechemisry GCM.
The present model uses a comprehensive numericalscheme to deal with the gas-phase and aqueous-phase reac-tions in a GCM, where the concentrations of radicals likeOH, HO2 and gases like O3, H2O2, NH3 and NOx arecomputed within the zoom version of LMD-ZT GCM. Thesulphate aerosol/chemistry is interactively included in themodel. The model considers both sulphur mass and numberconcentrations as a truly interactive part and not merely apassive component in atmospheric chemistry (Verma et al.,2007). The knowledge of the sulphate aerosol number con-centration is important to understand the indirect radiativeforcing of the aerosols and to refine estimates of the directradiative forcing.
The model design therefore differs from the earlier stud-ies of Lawrence et al.(1999), Rasch et al.(2000), Boucheret al.(2002), Hauglustaine et al.(2004), Vignati et al.(2004)and Stier et al.(2005) which employ analyzed meteorol-ogy/observations or prescribed three-dimensional short livedradical fields to drive the CTM. The experiments are de-
signed to assess impacts of sulphate aerosols on INDOEXregion.
2 Model description
2.1 The atmospheric global model
The LMDZ is a development of previous LMD model de-scribed bySadourny and Laval(1984), which was utilisedalong with other global models of major meteorological cen-tres, to achieve the AMIP I objective of atmospheric modelintercomparison (Boer, 1992; Cess et al., 1989) and alsoto carry out long-term simulations for certain climate andaerosol studies (Le Treut et al., 1994; Boucher and Lohmann,1995; Sharma et al., 1998; Boucher et al., 1998; Boucheret al., 2002 etc). The LMDZ has the capability to zoomwith a finer resolution over a specific region of interest overthe globe and relatively a coarser resolution over rest of theglobe, which gives a unique opportunity to study the regionalaspects of aerosols. The model solves the primitive equa-tions of meteorology and mass continuity for sixteen trac-ers. The discrete analogues of the dynamical equations areobtained using finite difference formulations on Arakawa-Cgrid and the physical package of the model includes a setof parameterisations for convection, radiative transfer, plan-etary boundary layer (PBL), gravity wave drag and groundhydrology with no vegetation. For a complete description ofthe atmospheric model dynamics and physical parameterisa-tion of physical processes one may refer toSadourny andLaval (1984), Le Treut et al.(1994) and Hourdin and Ar-mengaud(1999). The climatology of this model has beenpresented byLi (1999) and Lott (1999). An important ad-dition to LMDZ in the version used here is the inclusion of aprognostic sulphur-cycle scheme (Verma et al., 2007). In par-ticular, the model considers an interactive scheme for feed-back from chemistry to meteorology with internally resolv-ing microphysical properties of aerosols for radiative transfercomputations. Thus, it is a step towards correcting the defi-ciencies where the microphysics and feedbacks are run off-line. Except for some parameterisations, it should be notedthat the chemistry module has been developed independentlyfrom that of Boucher et al.(2002) and Hauglustaine et al.(2004).
2.2 Chemistry and aerosol modules
The chemistry module includes natural and anthropogenicemissions, treatment of sulphur and nitrogen sources, theirchemical transformations and deposition processes (Vermaet al., 2007). The basic chemistry module consists of over50 gas/aqueous phase chemical reactions (33 gas phase and18 aqueous phase) along with the sources and sinks ofchemical species. The prognostic chemical species in theLMDZ model are water vapour, liquid water, dimethylsul-phide (DMS), hydrogensulphide (H2S), dimethylsulphoxide
Atmos. Chem. Phys., 12, 6185–6196, 2012 www.atmos-chem-phys.net/12/6185/2012/

S. Verma et al.: Tropospheric distribution of sulphate aerosols 6187
dry & wet
deposition
Emissions dry & wet dry & wet
deposition deposition
OH OH (Gas Phase) Growth
Coagulation
H2O2, O3
(Aqueous Phase)
Evaporation OH
Sources OH dry & wet
deposition
OH
dry & wet dry & wet wet
deposition deposition Sources deposition
SO2 H2SO4
DMSO MSA H2S
SO42-
Mass
dissolved
Mode
SO42-
Number
and Mass
accumulation
Mode
SO42-
Number
and Mass
Aitken Mode
DMS
Fig. 1. The schematic representation of the sulphur module in theLMDZ.
(DMSO), methanesulphonic acid (MSA), sulphur dioxide(SO2), oxides of nitrogen (NOx), nitric acid (HNO3), carbonmonoxide (CO), ozone (O3), hydrogen peroxide (H2O2) andsulphate aerosol mass and number for Aitken (0.005–0.1 µm)and accumulation modes (0.1–2.5 µm). The gas phase con-centrations of SO2, H2O2 and O3 are estimated in thecloud phase assuming Henry’s law and used to calculate theamount of sulphate formed in the cloudy regions (Schwartz,1986). The model does not explicitly take into account masstransfer rates between the gas and the aqueous phase in viewof an examination on mass transfer effect bySchwartz(1986)and Venkataraman et al.(2001) who have shown that themass transfer effect does not limit the rate of sulphate for-mation.
The present approach utilises sulphuric acid produced inthe gas phase as an input to the two-mode, two-momentaerosol module (Binkowski and Shankar, 1995) which cal-culates aerosol mass, number concentration and particle sur-face area for the Aitken and accumulation modes. The vapoursulphuric acid produced by gas phase oxidation is split intotwo parts: one going into Aitken and the other one con-densing onto the existing particles (accumulation mode). Thesulphate produced by aqueous phase oxidation remains dis-solved in cloud droplets. However, when the clouds disap-pear, the sulphate in the dissolved state is added to the ac-cumulation mode mass. Therefore all new sulphate massproduced by aqueous production is added to the accumula-tion mode but the number of accumulation mode particlesremains unchanged (Fig. 1). The model represents a sim-plified version of the aqueous model ofWalcek and Taylor(1986) and is similar to an earlier equilibrium model ofOhtaet al. (1981). The equations for chemical equilibrium of theSO2-NH3-CO2-HNO3-H2O system are those fromChen andCrutzen(1994).
The mass fluxes, simulated by theTiedtke(1989) scheme,are used to parameterise convective transport of gases and
Fig. 2. The simulated SO2 emissions in the(a) RV and(b) GEIA inventories averaged for the INDOEX-IFP period(105 mg S m−2 s−1).
aerosols. Vertical transport of trace species is incorporatedin updrafts and downdrafts, accounting for entrainment anddetrainment. All chemical species along with aerosol massand number concentration in the two modes are advected inthe model. These species evolve consistently with dynamical,physical, cloud and chemical processes as the model state in-tegrates forward with each time step. Convective transport isperformed after wet scavenging calculation, in order to avoidupward transport of material that is scavenged by precipita-tion.
Dry deposition is parameterised through deposition veloc-ities, which are prescribed for each chemical species andsurface types. The model uses a simple parameterisationscheme, which assumes that the rate of deposition at the sur-face is directly proportional to the mixing ratio (i.e. concen-tration) of the respective species in the lowest model layer.To account for the effect of clouds in the grid box, the clearsky photolytic rates are multiplied by a correction factor.The wet removal scheme considers both in-cloud and below-cloud scavenging in the model. Rainfall is computed at everytime step in the GCM. Removal of gases and aerosols by rainwas parameterised using the model generated precipitationformation rate followingGiorgi and Chameides(1986).
The CO2 concentration is held constant (370 ppm)throughout the model integration. Mie theory is employedto compute the optical properties with prescribed size dis-tribution and refractive indices. Optical properties are com-puted over the entire shortwave spectrum (0.25–4.0 µm) at24 wavelengths and grouped into the two model wavebandsas weighted averages with a typical spectral distribution ofthe incoming solar radiation flux at the surface (Verma et al.,2006). The physical, cloud and chemical processes consid-ered in the present model are described in details in (Vermaet al., 2007).
www.atmos-chem-phys.net/12/6185/2012/ Atmos. Chem. Phys., 12, 6185–6196, 2012

6188 S. Verma et al.: Tropospheric distribution of sulphate aerosols
Table 1. Global annual sulphur emissions in the model (Tg S yr−1).
Source Global Indian IndianEmission Emission Emission
(GEIA) (GEIA) (RV)
Biomass Burning 3.39 0.24 0.33Fossil-Fuel 66.31 1.44 2.38Total 70.30 1.68 2.71
2.3 Emissions
Three SO2 scenarios, which differ over India only, are usedin the present study,
i. SCN-GEIA: emissions given for India in the GlobalEmission Inventory Activity (GEIA) inventory,
ii. SCN-RV: emissions of Reddy and Venkataraman(2002a, b) inventory (RV) for India,
iii. SCN-zero: emission from all over the world except In-dia (i.e. emissions over India are set to zero).
The global sulphur emissions in GEIA database includeemissions from fossil fuels combustion and industrial pro-cesses. The biomass burning sulphur emissions are fromPham et al.(1995). A fixed 5 % of sulphur from combus-tion sources is assumed to be emitted directly as sulfuricacid gas and condenses immediately on ambient aerosolparticles. The annual anthropogenic SO2 emissions (man-made) from fossil fuel combustion and industrial activitiesare 66.31 Tg S yr−1 globally with a contribution from Indiaof 1.44 Tg S yr−1 which increases to 2.38 Tg S yr−1 if RV in-ventory is used (Table 1). The simulated SO2 emissions inthe RV and GEIA inventories averaged for the INDOEX-IFPperiod are shown in Fig. 2. The RV emission inventory isconstructed with very high source resolution. The sulphuremissions are estimated using plant specific fuel combustion(Reddy and Venkataraman, 2002b). For biomass burning, theemission inventory for India is constructed from spatially re-solved data sets, which results in 0.33 Tg S yr−1 as projectionof SO2 emission for the INDOEX period (1998–1999).
3 Results
3.1 Numerical simulations
The model simulations have been performed using 72 paral-lels between North and South Poles with 96 points on eachparallel. There are 19 vertical levels and a basic time step ofhalf an hour is used for the model physics and chemistry. Forthis study, the LMDZ was run in zoom mode over the IN-DOEX study domain (25◦ S–35◦ N, 50–100◦ E) with a uni-form resolution of 1.25◦ in longitude and 1.25◦ in latitude
at best around the zoom centre (60◦ E, 0◦). The model ini-tial state is prepared from 20 December 1999 European Cen-tre for Medium-Range Weather Forecast (ECMWF) analysis.The surface albedo, soil moisture and sea-ice were also spec-ified from the ECMWF analysis.
3.2 Model evaluation
3.2.1 The Kaashidhoo climate observatory
The simulated sulphate concentrations at the surface arecompared with measured concentrations during INDOEX-IFP (February–March 1999) at Kaashidhoo Climate Obser-vatory (KCO), Maldives in the Indian Ocean. KCO was es-tablished as a part of INDOEX in the island of Kaashidhoo(4.965◦ N, 73.466◦ E) about 500 km southwest of the south-ern tip of India, where the aerosol chemical, radiative, andmicrophysical properties were continuously measured sinceFebruary 1998. The observatory serves as a key platform inthe Indian Ocean. The aerosol characteristics observed at thislocation, from December to March, include both aerosolstransported from the continents to the ocean and naturallyproduced at the ocean surface. The concentrations and prop-erties of aerosols depend on the prevailing meteorologicalconditions. During the winter monsoon, the air mass overKCO mostly (about 90 % of the time) originates from Indiaand South Asia (Krishnamurti et al., 1998).
Here we compare the simulated sulphate concentrationwith corresponding measured concentration at KCO duringINDOEX-IFP (Fig. 3). Modelled surface sulphate concen-trations agree with the measured values within a factor of2–3. The inventory developed by Reddy and Venkataraman(RV) has fine resolution (0.25×0.25) with specific emissionfactors for Indian regions. The identification of large pointsources in the RV inventory is an advantage over the globalinventories, where the emissions are estimated at countrylevel. The aerosol concentrations downwind of Indian sub-continent are sensitive to the geographical location of theemission sources over the sub-continent. Model simulationshows an increase in concentration in the month of Febru-ary with RV inventory. This result is in general agreementwith the meteorological conditions at KCO as most of theair mass during February originated from India in contrast toMarch when the air mass originated from East Asia (Ververet al., 2001) flows towards it. The resolution of RV inventorythus gives a better agreement of sulphate concentrations withmeasurements at KCO.
In contrast to surface concentrations, aerosol optical depth(AOD) is a measure of the entire aerosol column. The mea-sured AOD from all aerosol species averaged over IFP atKCO was 0.37± 0.11. Model simulated sulphate AOD atKCO ranged from 0.05 to 0.11 during the IFP period. TheKCO aerosol measurements reveal that sulphate is respon-sible for 29 % (Satheesh and Ramanathan, 2000; Satheeshet al., 1999) of the observed aerosol optical depth. Taking
Atmos. Chem. Phys., 12, 6185–6196, 2012 www.atmos-chem-phys.net/12/6185/2012/
S. Verma et al.: Tropospheric distribution of sulphate aerosols 6189
0
2
4
6
8
10
11-Feb 16-Feb 21-Feb 26-Feb 3-Mar 8-Mar 13-Mar 18-Mar 23-Mar
Date
Su
lph
ate
Co
nc
en
tra
tio
n (
μg
m-3
)
MeasuredSCN-GEIASCN-RV
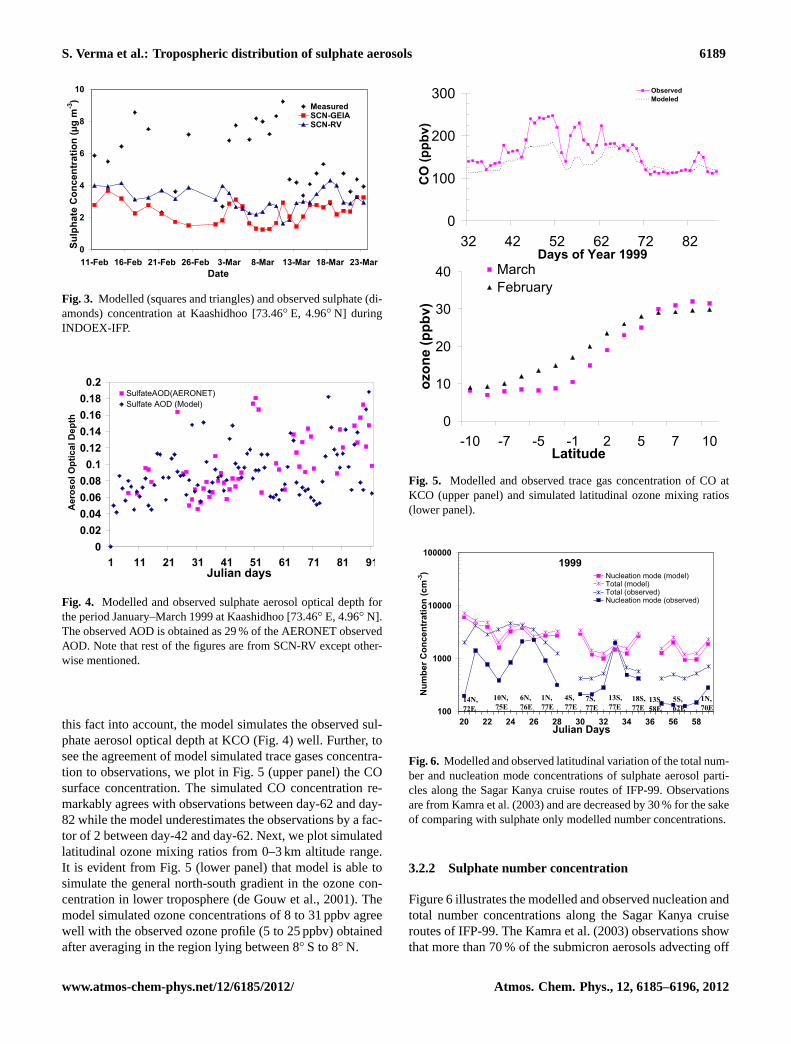
Fig. 3. Modelled (squares and triangles) and observed sulphate (di-amonds) concentration at Kaashidhoo [73.46◦ E, 4.96◦ N] duringINDOEX-IFP.
0
0.02
0.04
0.06
0.08
0.1
0.12
0.14
0.16
0.18
0.2
1 11 21 31 41 51 61 71 81 91Julian days
Ae
ros
ol
Op
tic
al
De
pth
SulfateAOD(AERONET)
Sulfate AOD (Model)
Fig. 4. Modelled and observed sulphate aerosol optical depth forthe period January–March 1999 at Kaashidhoo [73.46◦ E, 4.96◦ N].The observed AOD is obtained as 29 % of the AERONET observedAOD. Note that rest of the figures are from SCN-RV except other-wise mentioned.
this fact into account, the model simulates the observed sul-phate aerosol optical depth at KCO (Fig. 4) well. Further, tosee the agreement of model simulated trace gases concentra-tion to observations, we plot in Fig. 5 (upper panel) the COsurface concentration. The simulated CO concentration re-markably agrees with observations between day-62 and day-82 while the model underestimates the observations by a fac-tor of 2 between day-42 and day-62. Next, we plot simulatedlatitudinal ozone mixing ratios from 0–3 km altitude range.It is evident from Fig. 5 (lower panel) that model is able tosimulate the general north-south gradient in the ozone con-centration in lower troposphere (de Gouw et al., 2001). Themodel simulated ozone concentrations of 8 to 31 ppbv agreewell with the observed ozone profile (5 to 25 ppbv) obtainedafter averaging in the region lying between 8◦ S to 8◦ N.
0
100
200
300
32 42 52 62 72 82Days of Year 1999
CO
(p
pb
v)
Observed
Modeled
0
10
20
30
40
-10 -7 -5 -1 2 5 7 10Latitude
ozo
ne (
pp
bv)
March
February
Fig. 5. Modelled and observed trace gas concentration of CO atKCO (upper panel) and simulated latitudinal ozone mixing ratios(lower panel).
100
1000
10000
100000
20 22 24 26 28 30 32 34 36 56 58Julian Days
Nu
mb
er
Co
ncen
trati
on
(cm
-3) Nucleation mode (model)
Total (model)Total (observed)Nucleation mode (observed)
14N,
72E
10N,
75E
6N,
76E
1N,
77E
4S,
77E
7S,
77E
13S,
77E
18S,
77E
13S,
58E
5S,
62E
1N,
70E
1999
Fig. 6. Modelled and observed latitudinal variation of the total num-ber and nucleation mode concentrations of sulphate aerosol parti-cles along the Sagar Kanya cruise routes of IFP-99. Observationsare fromKamra et al.(2003) and are decreased by 30 % for the sakeof comparing with sulphate only modelled number concentrations.
3.2.2 Sulphate number concentration
Figure 6 illustrates the modelled and observed nucleation andtotal number concentrations along the Sagar Kanya cruiseroutes of IFP-99. TheKamra et al.(2003) observations showthat more than 70 % of the submicron aerosols advecting off
www.atmos-chem-phys.net/12/6185/2012/ Atmos. Chem. Phys., 12, 6185–6196, 2012
6190 S. Verma et al.: Tropospheric distribution of sulphate aerosols
the continent consists of sulphate aerosols and for this rea-son we report 70 % of their concentrations for the sake ofcomparing with the sulphate only modelled concentrations.
In general, a strong northeasterly flow has been observedover the Indian continent in February and March 1999 lead-ing to a greater transport of atmospheric pollutants overoceanic regions downwind of source regions (Verver et al.,2001; Rasch et al., 2001). The simulated wind pattern inFig. 13 depicts the above fact very well with a strong north-easterly flow and anti-cyclonic motion near the oceanic re-gions resulting in higher number concentrations in northerncruise track. The model simulates the order of magnitudeand the general north-south gradient feature in aerosol num-ber concentrations very well. The feature is thus in generalagreement with the transport pattern prevalent over the re-gion (Fig. 13).
3.2.3 Sulphate mass concentration and AOD at KCO
3.3 Latitudinal variations
The latitudinal variation of sulphate number concentrationand AOD in the Arabian Sea and Bay of Bengal for eachmonth is discussed in this section. The latitudinal variationsare obtained by separately averaging the values of a vari-able in the longitude ranges 60–80◦ E (Arabian Sea – IndianOcean sector) and 80–100◦ E (Bay of Bengal – Indian Oceansector).
3.3.1 Sulphate aerosol number concentration
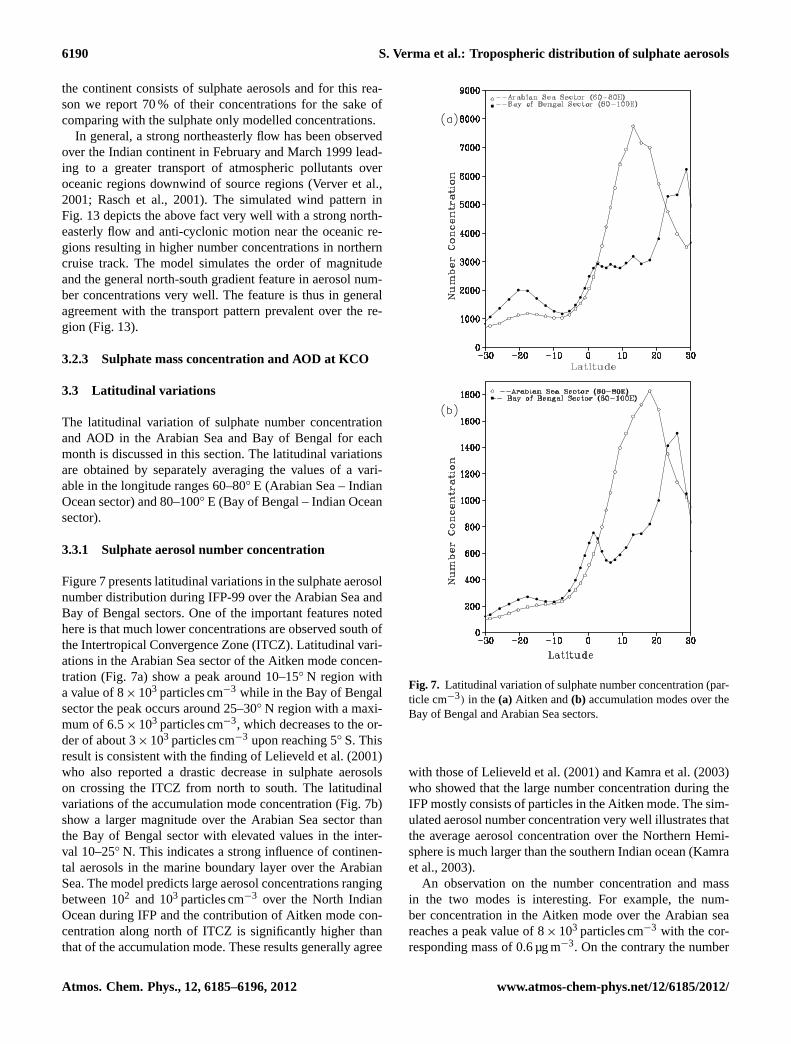
Figure 7 presents latitudinal variations in the sulphate aerosolnumber distribution during IFP-99 over the Arabian Sea andBay of Bengal sectors. One of the important features notedhere is that much lower concentrations are observed south ofthe Intertropical Convergence Zone (ITCZ). Latitudinal vari-ations in the Arabian Sea sector of the Aitken mode concen-tration (Fig. 7a) show a peak around 10–15◦ N region witha value of 8× 10³ particles cm−3 while in the Bay of Bengalsector the peak occurs around 25–30◦ N region with a maxi-mum of 6.5× 10³ particles cm−3, which decreases to the or-der of about 3× 10³ particles cm−3 upon reaching 5◦ S. Thisresult is consistent with the finding ofLelieveld et al.(2001)who also reported a drastic decrease in sulphate aerosolson crossing the ITCZ from north to south. The latitudinalvariations of the accumulation mode concentration (Fig. 7b)show a larger magnitude over the Arabian Sea sector thanthe Bay of Bengal sector with elevated values in the inter-val 10–25◦ N. This indicates a strong influence of continen-tal aerosols in the marine boundary layer over the ArabianSea. The model predicts large aerosol concentrations rangingbetween 102 and 103 particles cm−3 over the North IndianOcean during IFP and the contribution of Aitken mode con-centration along north of ITCZ is significantly higher thanthat of the accumulation mode. These results generally agree
Fig. 7. Latitudinal variation of sulphate number concentration (par-ticle cm−3) in the(a) Aitken and(b) accumulation modes over theBay of Bengal and Arabian Sea sectors.
with those ofLelieveld et al.(2001) andKamra et al.(2003)who showed that the large number concentration during theIFP mostly consists of particles in the Aitken mode. The sim-ulated aerosol number concentration very well illustrates thatthe average aerosol concentration over the Northern Hemi-sphere is much larger than the southern Indian ocean (Kamraet al., 2003).
An observation on the number concentration and massin the two modes is interesting. For example, the num-ber concentration in the Aitken mode over the Arabian seareaches a peak value of 8× 10³ particles cm−3 with the cor-responding mass of 0.6 µg m−3. On the contrary the number
Atmos. Chem. Phys., 12, 6185–6196, 2012 www.atmos-chem-phys.net/12/6185/2012/
S. Verma et al.: Tropospheric distribution of sulphate aerosols 6191
concentration in the accumulation mode reaches a maximumvalue of 1800 particles cm−3 and the corresponding massthere is about 4.6 µg m−3. This result is consistent with otherstudies, which have mentioned that most of the sulphate massresides in the accumulation mode (Binkowski and Roselle,2003).
3.3.2 Sulphate AOD
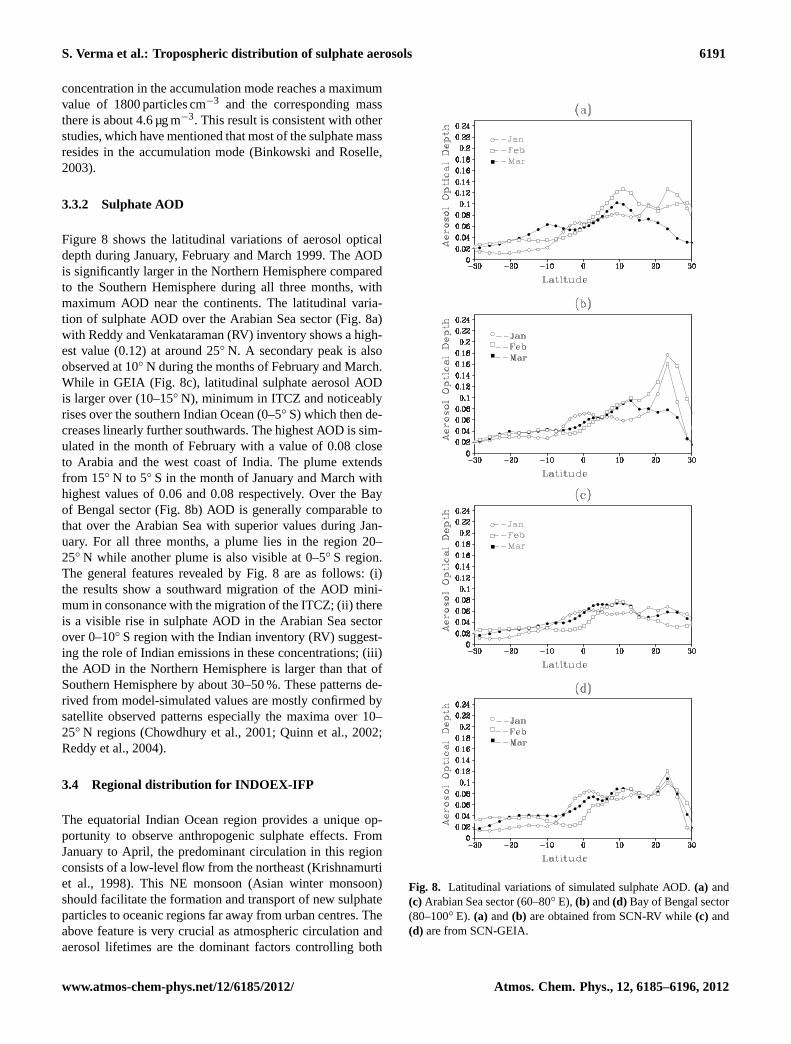
Figure 8 shows the latitudinal variations of aerosol opticaldepth during January, February and March 1999. The AODis significantly larger in the Northern Hemisphere comparedto the Southern Hemisphere during all three months, withmaximum AOD near the continents. The latitudinal varia-tion of sulphate AOD over the Arabian Sea sector (Fig. 8a)with Reddy and Venkataraman (RV) inventory shows a high-est value (0.12) at around 25◦ N. A secondary peak is alsoobserved at 10◦ N during the months of February and March.While in GEIA (Fig. 8c), latitudinal sulphate aerosol AODis larger over (10–15◦ N), minimum in ITCZ and noticeablyrises over the southern Indian Ocean (0–5◦ S) which then de-creases linearly further southwards. The highest AOD is sim-ulated in the month of February with a value of 0.08 closeto Arabia and the west coast of India. The plume extendsfrom 15◦ N to 5◦ S in the month of January and March withhighest values of 0.06 and 0.08 respectively. Over the Bayof Bengal sector (Fig. 8b) AOD is generally comparable tothat over the Arabian Sea with superior values during Jan-uary. For all three months, a plume lies in the region 20–25◦ N while another plume is also visible at 0–5◦ S region.The general features revealed by Fig. 8 are as follows: (i)the results show a southward migration of the AOD mini-mum in consonance with the migration of the ITCZ; (ii) thereis a visible rise in sulphate AOD in the Arabian Sea sectorover 0–10◦ S region with the Indian inventory (RV) suggest-ing the role of Indian emissions in these concentrations; (iii)the AOD in the Northern Hemisphere is larger than that ofSouthern Hemisphere by about 30–50 %. These patterns de-rived from model-simulated values are mostly confirmed bysatellite observed patterns especially the maxima over 10–25◦ N regions (Chowdhury et al., 2001; Quinn et al., 2002;Reddy et al., 2004).
3.4 Regional distribution for INDOEX-IFP
The equatorial Indian Ocean region provides a unique op-portunity to observe anthropogenic sulphate effects. FromJanuary to April, the predominant circulation in this regionconsists of a low-level flow from the northeast (Krishnamurtiet al., 1998). This NE monsoon (Asian winter monsoon)should facilitate the formation and transport of new sulphateparticles to oceanic regions far away from urban centres. Theabove feature is very crucial as atmospheric circulation andaerosol lifetimes are the dominant factors controlling both
Fig. 8. Latitudinal variations of simulated sulphate AOD.(a) and(c) Arabian Sea sector (60–80◦ E), (b) and(d) Bay of Bengal sector(80–100◦ E). (a) and(b) are obtained from SCN-RV while(c) and(d) are from SCN-GEIA.
www.atmos-chem-phys.net/12/6185/2012/ Atmos. Chem. Phys., 12, 6185–6196, 2012
6192 S. Verma et al.: Tropospheric distribution of sulphate aerosols
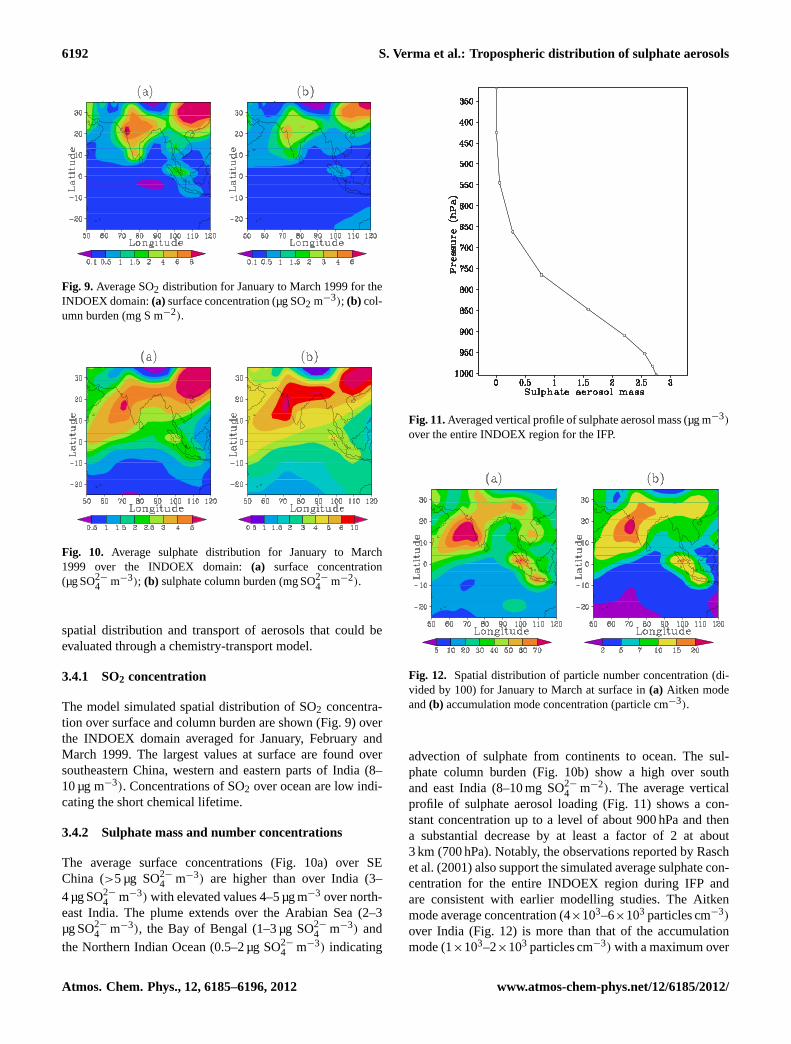
Fig. 9. Average SO2 distribution for January to March 1999 for theINDOEX domain:(a) surface concentration (µg SO2 m−3); (b) col-umn burden (mg S m−2).
Fig. 10. Average sulphate distribution for January to March1999 over the INDOEX domain:(a) surface concentration(µg SO2−
4 m−3); (b) sulphate column burden (mg SO2−
4 m−2).
spatial distribution and transport of aerosols that could beevaluated through a chemistry-transport model.
3.4.1 SO2 concentration
The model simulated spatial distribution of SO2 concentra-tion over surface and column burden are shown (Fig. 9) overthe INDOEX domain averaged for January, February andMarch 1999. The largest values at surface are found oversoutheastern China, western and eastern parts of India (8–10 µg m−3). Concentrations of SO2 over ocean are low indi-cating the short chemical lifetime.
3.4.2 Sulphate mass and number concentrations
The average surface concentrations (Fig. 10a) over SEChina (>5 µg SO2−
4 m−3) are higher than over India (3–4 µg SO2−
4 m−3) with elevated values 4–5 µg m−3 over north-east India. The plume extends over the Arabian Sea (2–3µg SO2−
4 m−3), the Bay of Bengal (1–3 µg SO2−
4 m−3) andthe Northern Indian Ocean (0.5–2 µg SO2−
4 m−3) indicating
Fig. 11.Averaged vertical profile of sulphate aerosol mass (µg m−3)
over the entire INDOEX region for the IFP.
Fig. 12. Spatial distribution of particle number concentration (di-vided by 100) for January to March at surface in(a) Aitken modeand(b) accumulation mode concentration (particle cm−3).
advection of sulphate from continents to ocean. The sul-phate column burden (Fig. 10b) show a high over southand east India (8–10 mg SO2−
4 m−2). The average verticalprofile of sulphate aerosol loading (Fig. 11) shows a con-stant concentration up to a level of about 900 hPa and thena substantial decrease by at least a factor of 2 at about3 km (700 hPa). Notably, the observations reported byRaschet al.(2001) also support the simulated average sulphate con-centration for the entire INDOEX region during IFP andare consistent with earlier modelling studies. The Aitkenmode average concentration (4×10³–6×10³ particles cm−3)
over India (Fig. 12) is more than that of the accumulationmode (1×10³–2×10³ particles cm−3) with a maximum over
Atmos. Chem. Phys., 12, 6185–6196, 2012 www.atmos-chem-phys.net/12/6185/2012/
S. Verma et al.: Tropospheric distribution of sulphate aerosols 6193
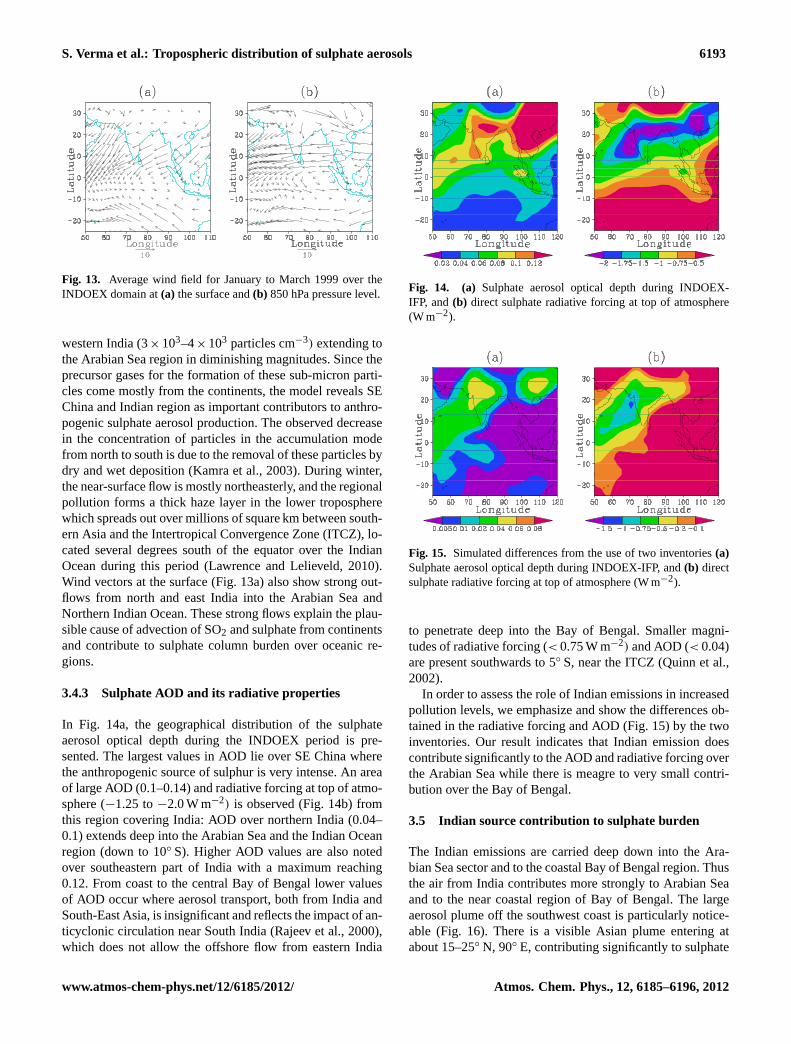
Fig. 13. Average wind field for January to March 1999 over theINDOEX domain at(a) the surface and(b) 850 hPa pressure level.
western India (3×10³–4×10³ particles cm−3) extending tothe Arabian Sea region in diminishing magnitudes. Since theprecursor gases for the formation of these sub-micron parti-cles come mostly from the continents, the model reveals SEChina and Indian region as important contributors to anthro-pogenic sulphate aerosol production. The observed decreasein the concentration of particles in the accumulation modefrom north to south is due to the removal of these particles bydry and wet deposition (Kamra et al., 2003). During winter,the near-surface flow is mostly northeasterly, and the regionalpollution forms a thick haze layer in the lower tropospherewhich spreads out over millions of square km between south-ern Asia and the Intertropical Convergence Zone (ITCZ), lo-cated several degrees south of the equator over the IndianOcean during this period (Lawrence and Lelieveld, 2010).Wind vectors at the surface (Fig. 13a) also show strong out-flows from north and east India into the Arabian Sea andNorthern Indian Ocean. These strong flows explain the plau-sible cause of advection of SO2 and sulphate from continentsand contribute to sulphate column burden over oceanic re-gions.
3.4.3 Sulphate AOD and its radiative properties
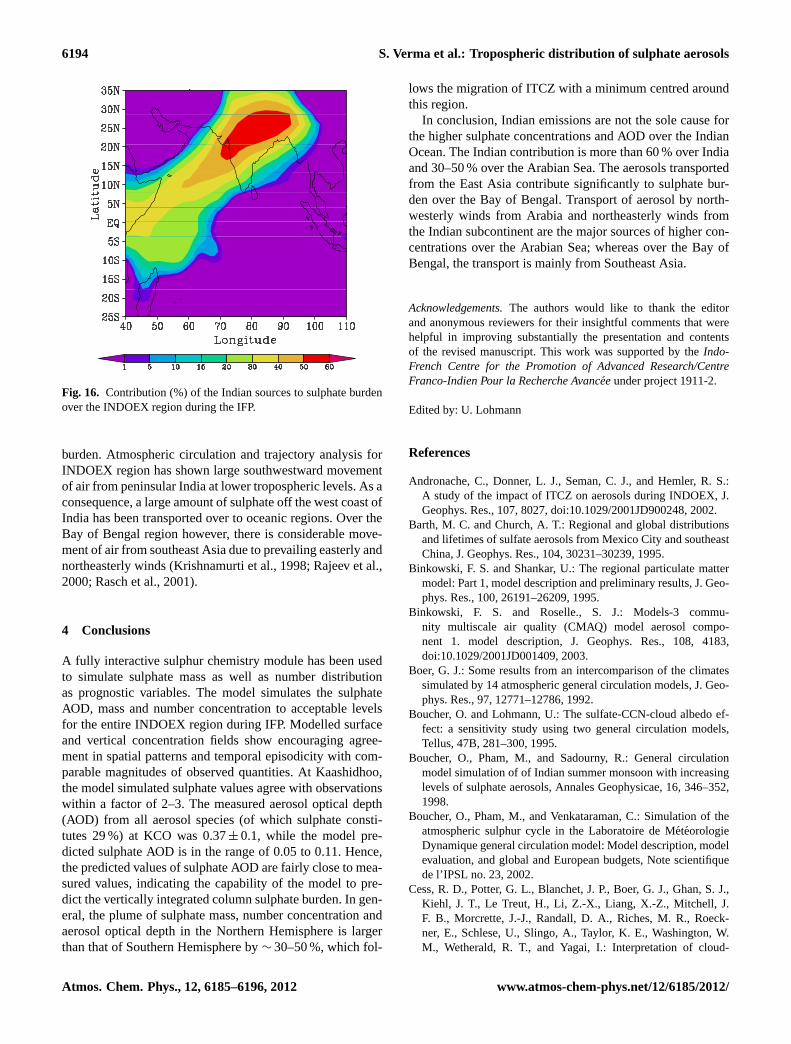
In Fig. 14a, the geographical distribution of the sulphateaerosol optical depth during the INDOEX period is pre-sented. The largest values in AOD lie over SE China wherethe anthropogenic source of sulphur is very intense. An areaof large AOD (0.1–0.14) and radiative forcing at top of atmo-sphere (−1.25 to−2.0 W m−2) is observed (Fig. 14b) fromthis region covering India: AOD over northern India (0.04–0.1) extends deep into the Arabian Sea and the Indian Oceanregion (down to 10◦ S). Higher AOD values are also notedover southeastern part of India with a maximum reaching0.12. From coast to the central Bay of Bengal lower valuesof AOD occur where aerosol transport, both from India andSouth-East Asia, is insignificant and reflects the impact of an-ticyclonic circulation near South India (Rajeev et al., 2000),which does not allow the offshore flow from eastern India
Fig. 14. (a) Sulphate aerosol optical depth during INDOEX-IFP, and(b) direct sulphate radiative forcing at top of atmosphere(W m−2).
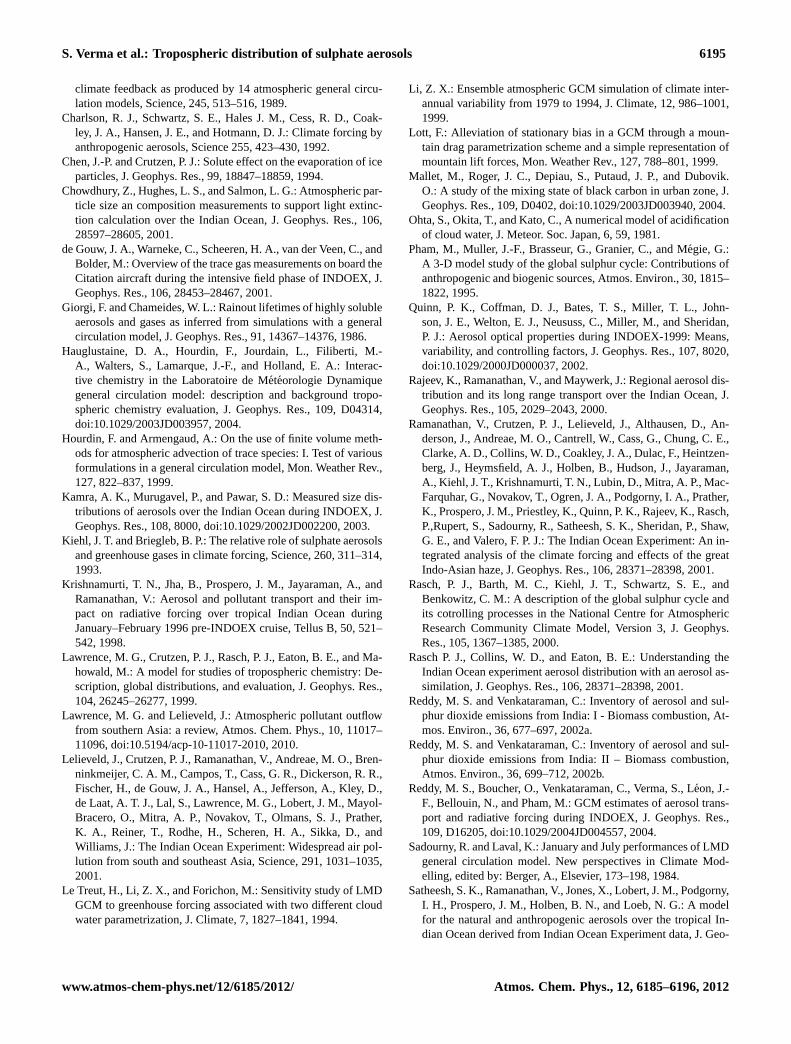
Fig. 15. Simulated differences from the use of two inventories(a)Sulphate aerosol optical depth during INDOEX-IFP, and(b) directsulphate radiative forcing at top of atmosphere (W m−2).
to penetrate deep into the Bay of Bengal. Smaller magni-tudes of radiative forcing (< 0.75 W m−2) and AOD (< 0.04)are present southwards to 5◦ S, near the ITCZ (Quinn et al.,2002).
In order to assess the role of Indian emissions in increasedpollution levels, we emphasize and show the differences ob-tained in the radiative forcing and AOD (Fig. 15) by the twoinventories. Our result indicates that Indian emission doescontribute significantly to the AOD and radiative forcing overthe Arabian Sea while there is meagre to very small contri-bution over the Bay of Bengal.
3.5 Indian source contribution to sulphate burden
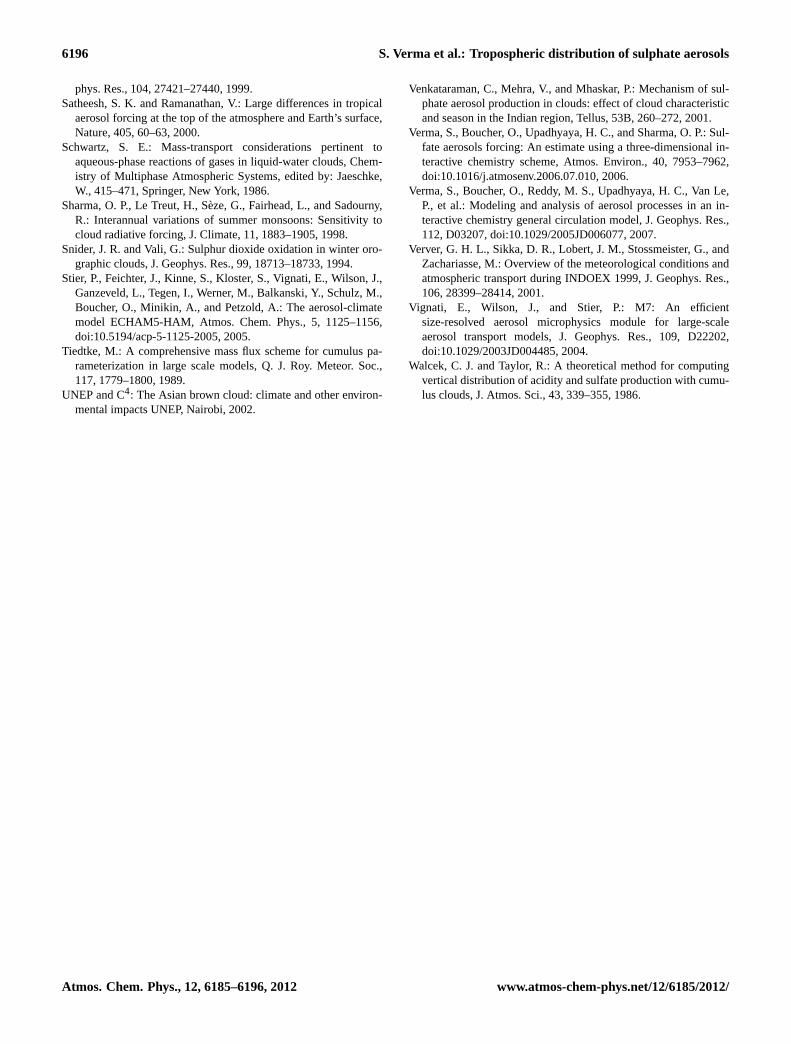
The Indian emissions are carried deep down into the Ara-bian Sea sector and to the coastal Bay of Bengal region. Thusthe air from India contributes more strongly to Arabian Seaand to the near coastal region of Bay of Bengal. The largeaerosol plume off the southwest coast is particularly notice-able (Fig. 16). There is a visible Asian plume entering atabout 15–25◦ N, 90◦ E, contributing significantly to sulphate
www.atmos-chem-phys.net/12/6185/2012/ Atmos. Chem. Phys., 12, 6185–6196, 2012
6194 S. Verma et al.: Tropospheric distribution of sulphate aerosols
Fig. 16. Contribution (%) of the Indian sources to sulphate burdenover the INDOEX region during the IFP.
burden. Atmospheric circulation and trajectory analysis forINDOEX region has shown large southwestward movementof air from peninsular India at lower tropospheric levels. As aconsequence, a large amount of sulphate off the west coast ofIndia has been transported over to oceanic regions. Over theBay of Bengal region however, there is considerable move-ment of air from southeast Asia due to prevailing easterly andnortheasterly winds (Krishnamurti et al., 1998; Rajeev et al.,2000; Rasch et al., 2001).
4 Conclusions
A fully interactive sulphur chemistry module has been usedto simulate sulphate mass as well as number distributionas prognostic variables. The model simulates the sulphateAOD, mass and number concentration to acceptable levelsfor the entire INDOEX region during IFP. Modelled surfaceand vertical concentration fields show encouraging agree-ment in spatial patterns and temporal episodicity with com-parable magnitudes of observed quantities. At Kaashidhoo,the model simulated sulphate values agree with observationswithin a factor of 2–3. The measured aerosol optical depth(AOD) from all aerosol species (of which sulphate consti-tutes 29 %) at KCO was 0.37± 0.1, while the model pre-dicted sulphate AOD is in the range of 0.05 to 0.11. Hence,the predicted values of sulphate AOD are fairly close to mea-sured values, indicating the capability of the model to pre-dict the vertically integrated column sulphate burden. In gen-eral, the plume of sulphate mass, number concentration andaerosol optical depth in the Northern Hemisphere is largerthan that of Southern Hemisphere by∼ 30–50 %, which fol-
lows the migration of ITCZ with a minimum centred aroundthis region.
In conclusion, Indian emissions are not the sole cause forthe higher sulphate concentrations and AOD over the IndianOcean. The Indian contribution is more than 60 % over Indiaand 30–50 % over the Arabian Sea. The aerosols transportedfrom the East Asia contribute significantly to sulphate bur-den over the Bay of Bengal. Transport of aerosol by north-westerly winds from Arabia and northeasterly winds fromthe Indian subcontinent are the major sources of higher con-centrations over the Arabian Sea; whereas over the Bay ofBengal, the transport is mainly from Southeast Asia.
Acknowledgements.The authors would like to thank the editorand anonymous reviewers for their insightful comments that werehelpful in improving substantially the presentation and contentsof the revised manuscript. This work was supported by theIndo-French Centre for the Promotion of Advanced Research/CentreFranco-Indien Pour la Recherche Avanceeunder project 1911-2.
Edited by: U. Lohmann
References
Andronache, C., Donner, L. J., Seman, C. J., and Hemler, R. S.:A study of the impact of ITCZ on aerosols during INDOEX, J.Geophys. Res., 107, 8027,doi:10.1029/2001JD900248, 2002.
Barth, M. C. and Church, A. T.: Regional and global distributionsand lifetimes of sulfate aerosols from Mexico City and southeastChina, J. Geophys. Res., 104, 30231–30239, 1995.
Binkowski, F. S. and Shankar, U.: The regional particulate mattermodel: Part 1, model description and preliminary results, J. Geo-phys. Res., 100, 26191–26209, 1995.
Binkowski, F. S. and Roselle., S. J.: Models-3 commu-nity multiscale air quality (CMAQ) model aerosol compo-nent 1. model description, J. Geophys. Res., 108, 4183,doi:10.1029/2001JD001409, 2003.
Boer, G. J.: Some results from an intercomparison of the climatessimulated by 14 atmospheric general circulation models, J. Geo-phys. Res., 97, 12771–12786, 1992.
Boucher, O. and Lohmann, U.: The sulfate-CCN-cloud albedo ef-fect: a sensitivity study using two general circulation models,Tellus, 47B, 281–300, 1995.
Boucher, O., Pham, M., and Sadourny, R.: General circulationmodel simulation of of Indian summer monsoon with increasinglevels of sulphate aerosols, Annales Geophysicae, 16, 346–352,1998.
Boucher, O., Pham, M., and Venkataraman, C.: Simulation of theatmospheric sulphur cycle in the Laboratoire de MeteorologieDynamique general circulation model: Model description, modelevaluation, and global and European budgets, Note scientifiquede l’IPSL no. 23, 2002.
Cess, R. D., Potter, G. L., Blanchet, J. P., Boer, G. J., Ghan, S. J.,Kiehl, J. T., Le Treut, H., Li, Z.-X., Liang, X.-Z., Mitchell, J.F. B., Morcrette, J.-J., Randall, D. A., Riches, M. R., Roeck-ner, E., Schlese, U., Slingo, A., Taylor, K. E., Washington, W.M., Wetherald, R. T., and Yagai, I.: Interpretation of cloud-
Atmos. Chem. Phys., 12, 6185–6196, 2012 www.atmos-chem-phys.net/12/6185/2012/
S. Verma et al.: Tropospheric distribution of sulphate aerosols 6195
climate feedback as produced by 14 atmospheric general circu-lation models, Science, 245, 513–516, 1989.
Charlson, R. J., Schwartz, S. E., Hales J. M., Cess, R. D., Coak-ley, J. A., Hansen, J. E., and Hotmann, D. J.: Climate forcing byanthropogenic aerosols, Science 255, 423–430, 1992.
Chen, J.-P. and Crutzen, P. J.: Solute effect on the evaporation of iceparticles, J. Geophys. Res., 99, 18847–18859, 1994.
Chowdhury, Z., Hughes, L. S., and Salmon, L. G.: Atmospheric par-ticle size an composition measurements to support light extinc-tion calculation over the Indian Ocean, J. Geophys. Res., 106,28597–28605, 2001.
de Gouw, J. A., Warneke, C., Scheeren, H. A., van der Veen, C., andBolder, M.: Overview of the trace gas measurements on board theCitation aircraft during the intensive field phase of INDOEX, J.Geophys. Res., 106, 28453–28467, 2001.
Giorgi, F. and Chameides, W. L.: Rainout lifetimes of highly solubleaerosols and gases as inferred from simulations with a generalcirculation model, J. Geophys. Res., 91, 14367–14376, 1986.
Hauglustaine, D. A., Hourdin, F., Jourdain, L., Filiberti, M.-A., Walters, S., Lamarque, J.-F., and Holland, E. A.: Interac-tive chemistry in the Laboratoire de Meteorologie Dynamiquegeneral circulation model: description and background tropo-spheric chemistry evaluation, J. Geophys. Res., 109, D04314,doi:10.1029/2003JD003957, 2004.
Hourdin, F. and Armengaud, A.: On the use of finite volume meth-ods for atmospheric advection of trace species: I. Test of variousformulations in a general circulation model, Mon. Weather Rev.,127, 822–837, 1999.
Kamra, A. K., Murugavel, P., and Pawar, S. D.: Measured size dis-tributions of aerosols over the Indian Ocean during INDOEX, J.Geophys. Res., 108, 8000,doi:10.1029/2002JD002200, 2003.
Kiehl, J. T. and Briegleb, B. P.: The relative role of sulphate aerosolsand greenhouse gases in climate forcing, Science, 260, 311–314,1993.
Krishnamurti, T. N., Jha, B., Prospero, J. M., Jayaraman, A., andRamanathan, V.: Aerosol and pollutant transport and their im-pact on radiative forcing over tropical Indian Ocean duringJanuary–February 1996 pre-INDOEX cruise, Tellus B, 50, 521–542, 1998.
Lawrence, M. G., Crutzen, P. J., Rasch, P. J., Eaton, B. E., and Ma-howald, M.: A model for studies of tropospheric chemistry: De-scription, global distributions, and evaluation, J. Geophys. Res.,104, 26245–26277, 1999.
Lawrence, M. G. and Lelieveld, J.: Atmospheric pollutant outflowfrom southern Asia: a review, Atmos. Chem. Phys., 10, 11017–11096,doi:10.5194/acp-10-11017-2010, 2010.
Lelieveld, J., Crutzen, P. J., Ramanathan, V., Andreae, M. O., Bren-ninkmeijer, C. A. M., Campos, T., Cass, G. R., Dickerson, R. R.,Fischer, H., de Gouw, J. A., Hansel, A., Jefferson, A., Kley, D.,de Laat, A. T. J., Lal, S., Lawrence, M. G., Lobert, J. M., Mayol-Bracero, O., Mitra, A. P., Novakov, T., Olmans, S. J., Prather,K. A., Reiner, T., Rodhe, H., Scheren, H. A., Sikka, D., andWilliams, J.: The Indian Ocean Experiment: Widespread air pol-lution from south and southeast Asia, Science, 291, 1031–1035,2001.
Le Treut, H., Li, Z. X., and Forichon, M.: Sensitivity study of LMDGCM to greenhouse forcing associated with two different cloudwater parametrization, J. Climate, 7, 1827–1841, 1994.
Li, Z. X.: Ensemble atmospheric GCM simulation of climate inter-annual variability from 1979 to 1994, J. Climate, 12, 986–1001,1999.
Lott, F.: Alleviation of stationary bias in a GCM through a moun-tain drag parametrization scheme and a simple representation ofmountain lift forces, Mon. Weather Rev., 127, 788–801, 1999.
Mallet, M., Roger, J. C., Depiau, S., Putaud, J. P., and Dubovik.O.: A study of the mixing state of black carbon in urban zone, J.Geophys. Res., 109, D0402,doi:10.1029/2003JD003940, 2004.
Ohta, S., Okita, T., and Kato, C., A numerical model of acidificationof cloud water, J. Meteor. Soc. Japan, 6, 59, 1981.
Pham, M., Muller, J.-F., Brasseur, G., Granier, C., and Megie, G.:A 3-D model study of the global sulphur cycle: Contributions ofanthropogenic and biogenic sources, Atmos. Environ., 30, 1815–1822, 1995.
Quinn, P. K., Coffman, D. J., Bates, T. S., Miller, T. L., John-son, J. E., Welton, E. J., Neususs, C., Miller, M., and Sheridan,P. J.: Aerosol optical properties during INDOEX-1999: Means,variability, and controlling factors, J. Geophys. Res., 107, 8020,doi:10.1029/2000JD000037, 2002.
Rajeev, K., Ramanathan, V., and Maywerk, J.: Regional aerosol dis-tribution and its long range transport over the Indian Ocean, J.Geophys. Res., 105, 2029–2043, 2000.
Ramanathan, V., Crutzen, P. J., Lelieveld, J., Althausen, D., An-derson, J., Andreae, M. O., Cantrell, W., Cass, G., Chung, C. E.,Clarke, A. D., Collins, W. D., Coakley, J. A., Dulac, F., Heintzen-berg, J., Heymsfield, A. J., Holben, B., Hudson, J., Jayaraman,A., Kiehl, J. T., Krishnamurti, T. N., Lubin, D., Mitra, A. P., Mac-Farquhar, G., Novakov, T., Ogren, J. A., Podgorny, I. A., Prather,K., Prospero, J. M., Priestley, K., Quinn, P. K., Rajeev, K., Rasch,P.,Rupert, S., Sadourny, R., Satheesh, S. K., Sheridan, P., Shaw,G. E., and Valero, F. P. J.: The Indian Ocean Experiment: An in-tegrated analysis of the climate forcing and effects of the greatIndo-Asian haze, J. Geophys. Res., 106, 28371–28398, 2001.
Rasch, P. J., Barth, M. C., Kiehl, J. T., Schwartz, S. E., andBenkowitz, C. M.: A description of the global sulphur cycle andits cotrolling processes in the National Centre for AtmosphericResearch Community Climate Model, Version 3, J. Geophys.Res., 105, 1367–1385, 2000.
Rasch P. J., Collins, W. D., and Eaton, B. E.: Understanding theIndian Ocean experiment aerosol distribution with an aerosol as-similation, J. Geophys. Res., 106, 28371–28398, 2001.
Reddy, M. S. and Venkataraman, C.: Inventory of aerosol and sul-phur dioxide emissions from India: I - Biomass combustion, At-mos. Environ., 36, 677–697, 2002a.
Reddy, M. S. and Venkataraman, C.: Inventory of aerosol and sul-phur dioxide emissions from India: II – Biomass combustion,Atmos. Environ., 36, 699–712, 2002b.
Reddy, M. S., Boucher, O., Venkataraman, C., Verma, S., Leon, J.-F., Bellouin, N., and Pham, M.: GCM estimates of aerosol trans-port and radiative forcing during INDOEX, J. Geophys. Res.,109, D16205,doi:10.1029/2004JD004557, 2004.
Sadourny, R. and Laval, K.: January and July performances of LMDgeneral circulation model. New perspectives in Climate Mod-elling, edited by: Berger, A., Elsevier, 173–198, 1984.
Satheesh, S. K., Ramanathan, V., Jones, X., Lobert, J. M., Podgorny,I. H., Prospero, J. M., Holben, B. N., and Loeb, N. G.: A modelfor the natural and anthropogenic aerosols over the tropical In-dian Ocean derived from Indian Ocean Experiment data, J. Geo-
www.atmos-chem-phys.net/12/6185/2012/ Atmos. Chem. Phys., 12, 6185–6196, 2012
6196 S. Verma et al.: Tropospheric distribution of sulphate aerosols
phys. Res., 104, 27421–27440, 1999.Satheesh, S. K. and Ramanathan, V.: Large differences in tropical
aerosol forcing at the top of the atmosphere and Earth’s surface,Nature, 405, 60–63, 2000.
Schwartz, S. E.: Mass-transport considerations pertinent toaqueous-phase reactions of gases in liquid-water clouds, Chem-istry of Multiphase Atmospheric Systems, edited by: Jaeschke,W., 415–471, Springer, New York, 1986.
Sharma, O. P., Le Treut, H., Seze, G., Fairhead, L., and Sadourny,R.: Interannual variations of summer monsoons: Sensitivity tocloud radiative forcing, J. Climate, 11, 1883–1905, 1998.
Snider, J. R. and Vali, G.: Sulphur dioxide oxidation in winter oro-graphic clouds, J. Geophys. Res., 99, 18713–18733, 1994.
Stier, P., Feichter, J., Kinne, S., Kloster, S., Vignati, E., Wilson, J.,Ganzeveld, L., Tegen, I., Werner, M., Balkanski, Y., Schulz, M.,Boucher, O., Minikin, A., and Petzold, A.: The aerosol-climatemodel ECHAM5-HAM, Atmos. Chem. Phys., 5, 1125–1156,doi:10.5194/acp-5-1125-2005, 2005.
Tiedtke, M.: A comprehensive mass flux scheme for cumulus pa-rameterization in large scale models, Q. J. Roy. Meteor. Soc.,117, 1779–1800, 1989.
UNEP and C4: The Asian brown cloud: climate and other environ-mental impacts UNEP, Nairobi, 2002.
Venkataraman, C., Mehra, V., and Mhaskar, P.: Mechanism of sul-phate aerosol production in clouds: effect of cloud characteristicand season in the Indian region, Tellus, 53B, 260–272, 2001.
Verma, S., Boucher, O., Upadhyaya, H. C., and Sharma, O. P.: Sul-fate aerosols forcing: An estimate using a three-dimensional in-teractive chemistry scheme, Atmos. Environ., 40, 7953–7962,doi:10.1016/j.atmosenv.2006.07.010, 2006.
Verma, S., Boucher, O., Reddy, M. S., Upadhyaya, H. C., Van Le,P., et al.: Modeling and analysis of aerosol processes in an in-teractive chemistry general circulation model, J. Geophys. Res.,112, D03207,doi:10.1029/2005JD006077, 2007.
Verver, G. H. L., Sikka, D. R., Lobert, J. M., Stossmeister, G., andZachariasse, M.: Overview of the meteorological conditions andatmospheric transport during INDOEX 1999, J. Geophys. Res.,106, 28399–28414, 2001.
Vignati, E., Wilson, J., and Stier, P.: M7: An efficientsize-resolved aerosol microphysics module for large-scaleaerosol transport models, J. Geophys. Res., 109, D22202,doi:10.1029/2003JD004485, 2004.
Walcek, C. J. and Taylor, R.: A theoretical method for computingvertical distribution of acidity and sulfate production with cumu-lus clouds, J. Atmos. Sci., 43, 339–355, 1986.
Atmos. Chem. Phys., 12, 6185–6196, 2012 www.atmos-chem-phys.net/12/6185/2012/