Tropical Storm Ian - National Hurricane Center · The genesis of Ian occurred much later than...
13
NATIONAL HURRICANE CENTER TROPICAL CYCLONE REPORT TROPICAL STORM IAN (AL102016) 12 – 16 September 2016 Lixion. A. Avila National Hurricane Center 3 January 2017 MICROWAVE IMAGE AT 1753 UTC 13 SEPTEMBER SHOWING THE LOW-LEVEL CENTER OF IAN WELL REMOVED FROM THE CONVECTION. IMAGE COURTESY OF THE NAVAL RESEARCH LABORATORY. Ian was a sheared cyclone that spent its lifetime over the Atlantic Ocean.
Transcript of Tropical Storm Ian - National Hurricane Center · The genesis of Ian occurred much later than...

NATIONAL HURRICANE CENTER TROPICAL CYCLONE REPORT
TROPICAL STORM IAN (AL102016) 12 – 16 September 2016
Lixion. A. Avila National Hurricane Center
3 January 2017
MICROWAVE IMAGE AT 1753 UTC 13 SEPTEMBER SHOWING THE LOW-LEVEL CENTER OF IAN WELL REMOVED FROM THE CONVECTION. IMAGE COURTESY OF THE NAVAL RESEARCH LABORATORY.
Ian was a sheared cyclone that spent its lifetime over the Atlantic Ocean.
Tropical Storm Ian 2
Tropical Storm Ian 12 – 16 SEPTEMBER 2016
SYNOPTIC HISTORY Ian originated from a tropical wave that crossed the west coast of Africa on 6 September, accompanied by a large area of cloudiness and thunderstorms that exhibited signs of cyclonic rotation on satellite images. The wave and its associated convective activity continued westward for a few days, and when the wave was reaching 50°W on 10 September, it encountered a broad mid- to upper level trough. A low pressure area was spawned from the wave and then moved northward within the southerly flow ahead of the trough. On 11 September, the low was already producing winds of near tropical storm force, but the system lacked a well-defined center. Late that day there was evidence that a well-defined center had formed, but due to strong southwesterly shear, the convection was well removed to the northeast and north of the center. The organization of the cloud pattern improved when the shear relaxed slightly, and it is estimated that Tropical Storm Ian formed at 0600 UTC 12 September over the open waters of the Atlantic about 990 n mi southeast of Bermuda. The “best track” chart of the tropical cyclone’s path is given in Fig. 1, with the wind and pressure histories shown in Figs. 2 and 3, respectively. The best track positions and intensities are listed in Table 11.
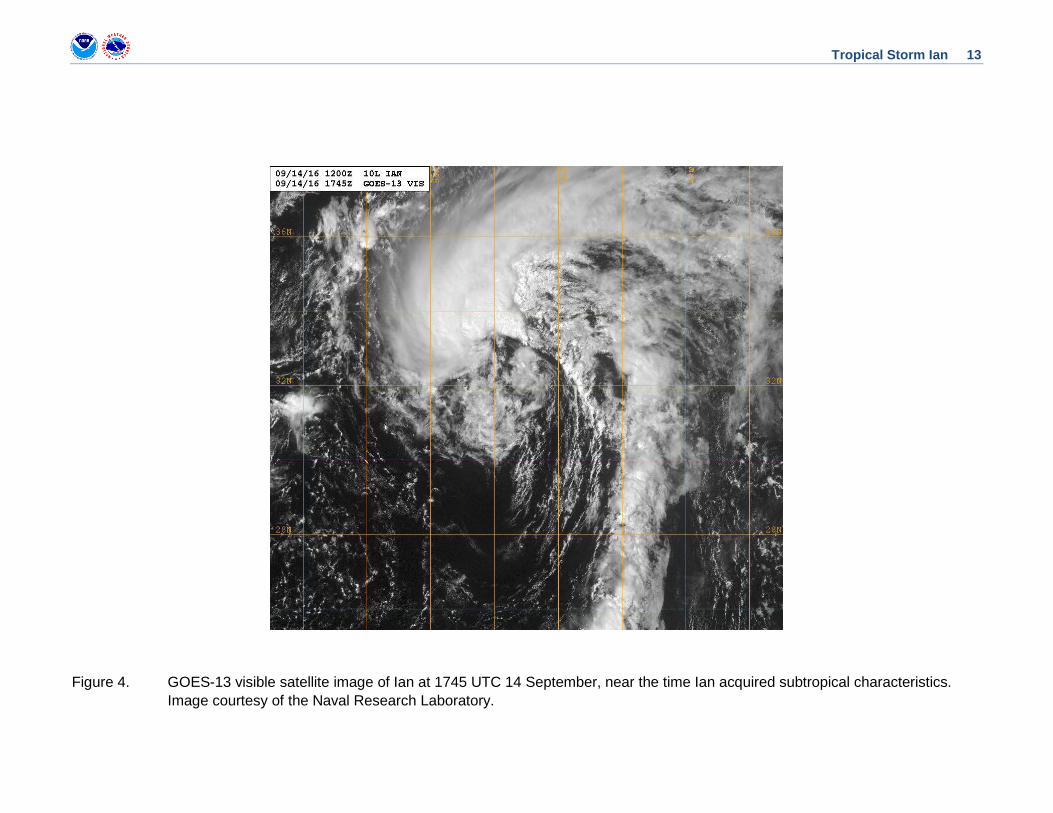
Ian moved toward the north-northwest and north between the trough and a subtropical ridge over the eastern Atlantic for a couple of days. Ian then became collocated with the upper-trough, and both the convection and the strongest winds spread out away from the center. With this change in structure, Ian is best classified as a subtropical storm for a short period beginning late on 14 September. Figure 4 shows the subtropical cloud pattern associated with Ian. By 1200 UTC the next day, Ian had turned northeastward away from the trough, and deep convection re-developed near the center. The cyclone reacquired tropical storm status, and it is estimated that Ian reached its peak intensity of 50 kt at 0600 UTC 16 September while it continued to move northeastward within the mid-latitude flow. Ian reached the cooler waters of the North Atlantic and became a strengthening extratropical cyclone 6 h later. It was finally absorbed by a much larger extratropical low at 0600 UTC 17 September.
METEOROLOGICAL STATISTICS Observations in Tropical Storm Ian (Figs. 2 and 3) include subjective satellite-based Dvorak technique intensity estimates from the Tropical Analysis and Forecast Branch (TAFB) and the Satellite Analysis Branch (SAB), and objective Advanced Dvorak Technique (ADT) estimates
1 A digital record of the complete best track, including wind radii, can be found on line at ftp://ftp.nhc.noaa.gov/atcf. Data for the current year’s storms are located in the btk directory, while previous years’ data are located in the archive directory.

Tropical Storm Ian 3
from the Cooperative Institute for Meteorological Satellite Studies/University of Wisconsin-Madison. Data and imagery from NOAA polar-orbiting satellites including the Advanced Microwave Sounding Unit (AMSU), the NASA Global Precipitation Mission (GPM), the European Space Agency’s Advanced Scatterometer (ASCAT), and Defense Meteorological Satellite Program (DMSP) satellites, among others, were also useful in constructing the best track of Ian.
The estimated peak intensity of Ian was based on ASCAT surface wind data.
CASUALTY AND DAMAGE STATISTICS There were no reports of damage or casualties associated with Ian.
FORECAST AND WARNING CRITIQUE
The genesis of Ian occurred much later than anticipated, particularly in the long range. The system that became Ian was introduced into the Tropical Weather Outlook (TWO) with a low (< 40%) chance of formation during the next 5 days 162 h before genesis, and it was included in the 48-h TWO 132 h before formation. The probability first reached the high category (> 60% chance of formation) 132 h before genesis in the 5-day TWO, but the genesis was delayed, and the probabilities were lowered to the medium category for about a day and half. The probability reached the high category (> 60% chance of formation) 54 h before formation in the 48-h TWO. All of the genesis forecast lead times are given in Table 2.
A verification of NHC official track forecasts for Tropical Storm Ian is given in Table 3a. Official forecast track errors were higher than the mean official errors for the previous 5-yr period for all forecast periods. A homogeneous comparison of the official track errors with selected guidance models is given in Table 3b. The lowest track errors were produced by the GFS, the GFS ensemble mean (AEMI) and the HCCA models for the three days that Ian existed.
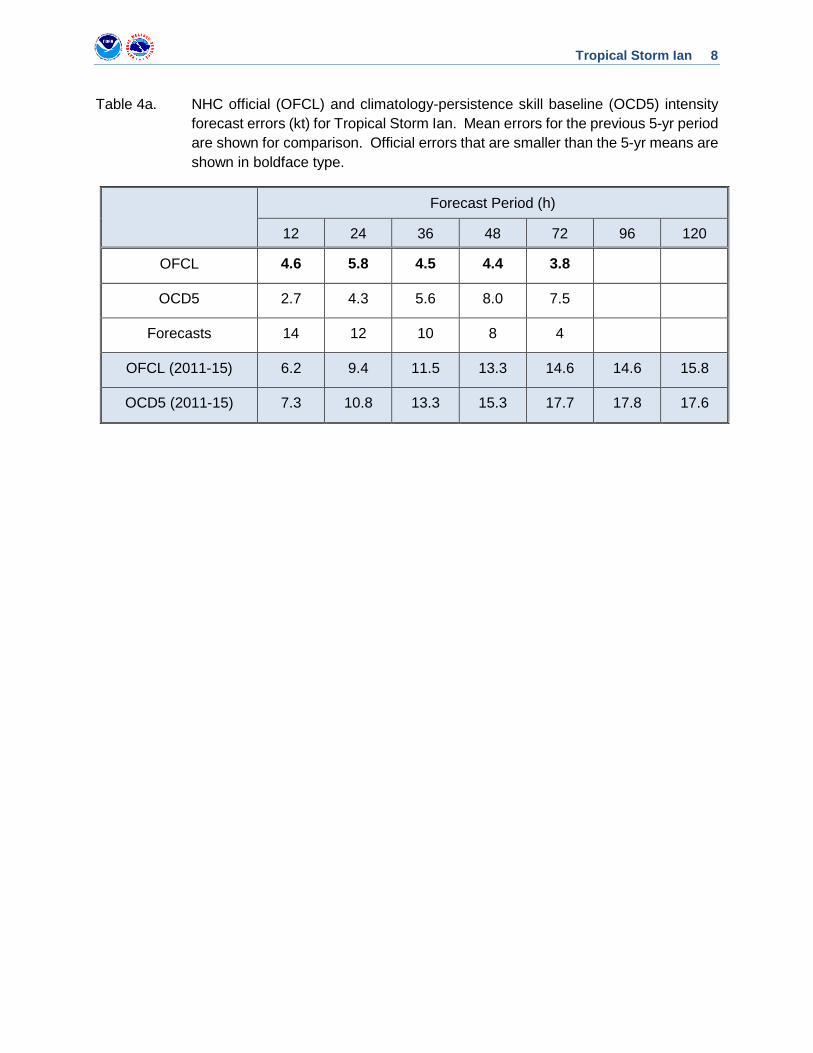
A verification of NHC official intensity forecasts for Tropical Storm Ian is given in Table 4a. Official forecast intensity errors were lower than the mean official errors for the previous 5-yr period. A homogeneous comparison of the official intensity errors with selected guidance models is given in Table 4b. Only the ECMWF scored better than the official forecast at most of the forecast periods.
There were no coastal watches and warnings associated with Ian.

Tropical Storm Ian 4
Table 1. Best track for Tropical Storm Ian, 12-16 September 2016.
Date/Time (UTC)
Latitude (°N)
Longitude (°W)
Pressure (mb)
Wind Speed (kt) Stage
12/ 0000 20.0 48.5 1007 35 low
12 / 0600 20.5 49.3 1007 35 tropical storm
12 / 1200 21.2 50.2 1006 35 "
12 / 1800 22.2 50.6 1003 35 "
13 / 0000 23.0 51.2 1000 35 "
13 / 0600 23.9 51.7 1000 40 "
13 / 1200 24.8 52.1 999 45 "
13 / 1800 26.0 52.4 998 45 "
14 / 0000 27.3 52.6 998 45 "
14 / 0600 28.9 53.0 998 45 "
14 / 1200 30.5 53.5 998 45 "
14 / 1800 32.1 53.8 998 45 subtropical storm
15 / 0000 33.5 53.5 998 45 "
15 / 0600 34.9 53.0 998 45 "
15 / 1200 36.3 51.5 998 45 tropical storm
15 / 1800 38.3 49.2 998 45 "
16 / 0000 41.2 46.8 998 45 "
16 / 0600 43.2 42.9 994 50 "
16 / 1200 46.8 38.6 990 55 extratropical

Tropical Storm Ian 5
16 / 1800 50.4 34.4 985 55 "
17 / 0000 55.1 30.3 984 55 "
17 / 0600 Absorbed by a larger cyclone
16 / 0600 43.2 42.9 994 50 minimum pressure
Table 2. Number of hours in advance of formation associated with the first NHC Tropical Weather Outlook forecast in the indicated likelihood category. Note that the timings for the “Low” category do not include forecasts of a 0% chance of genesis.
Hours Before Genesis
48-Hour Outlook 120-Hour Outlook
Low (<40%) 132 162
Medium (40%-60%) 60 144
High (>60%) 54 132

Tropical Storm Ian 6
Table 3a. NHC official (OFCL) and climatology-persistence skill baseline (OCD5) track forecast errors (n mi) for Tropical Storm Ian. Mean errors for the previous 5-yr period are shown for comparison. Official errors that are smaller than the 5-yr means are shown in boldface type.
Forecast Period (h)
12 24 36 48 72 96 120
OFCL 30.2 48.6 65.3 98.0 213.4
OCD5 62.3 131.7 191.4 317.9 555.7
Forecasts 14 12 10 8 4
OFCL (2011-15) 28.4 45.0 60.4 77.1 113.1 157.8 210.0
OCD5 (2011-15) 48.3 101.5 161.5 222.6 329.8 412.6 483.9

Tropical Storm Ian 7
Table 3b. Homogeneous comparison of selected track forecast guidance models (in n mi) for Tropical Storm Ian. Errors smaller than the NHC official forecast are shown in boldface type. The number of official forecasts shown here will generally be smaller than that shown in Table 3a due to the homogeneity requirement.
Model ID Forecast Period (h)
12 24 36 48 72 96 120
OFCL 27.3 49.2 67.7 101.7 240.2
OCD5 56.3 133.6 219.6 362.1 740.2
GFSI 33.9 51.2 62.5 75.6 188.2
EMXI 28.7 49.8 75.4 107.5 190.1
EGRI 30.8 58.8 95.6 157.3 288.1
NVGI 39.4 65.7 101.1 180.3 394.1
CMCI 28.9 50.6 88.1 137.0 135.5
GHMI 31.7 56.8 96.8 175.0 483.1
HWFI 32.7 55.4 87.2 139.7 335.0
CTCI 29.4 58.3 105.1 158.7 377.2
GFNI 28.8 61.0 107.6 180.8 458.1
TVCA 28.4 47.5 78.0 127.1 307.8
TVCX 29.3 45.9 77.1 123.0 291.1
TCON 28.2 48.9 78.5 130.2 321.9
GFEX 30.2 41.5 56.5 74.8 185.2
FSSE 28.3 42.7 58.0 96.7 260.7
AEMI 33.2 48.9 63.8 82.9 228.1
BAMM 49.8 88.8 127.3 146.7 311.2
BAMD 42.8 61.6 70.9 79.5 67.0
HCCA 27.9 42.1 56.1 80.8 196.5
Forecasts 10 9 8 6 2
Tropical Storm Ian 8
Table 4a. NHC official (OFCL) and climatology-persistence skill baseline (OCD5) intensity forecast errors (kt) for Tropical Storm Ian. Mean errors for the previous 5-yr period are shown for comparison. Official errors that are smaller than the 5-yr means are shown in boldface type.
Forecast Period (h)
12 24 36 48 72 96 120
OFCL 4.6 5.8 4.5 4.4 3.8
OCD5 2.7 4.3 5.6 8.0 7.5
Forecasts 14 12 10 8 4
OFCL (2011-15) 6.2 9.4 11.5 13.3 14.6 14.6 15.8
OCD5 (2011-15) 7.3 10.8 13.3 15.3 17.7 17.8 17.6

Tropical Storm Ian 9
Table 4b. Homogeneous comparison of selected intensity forecast guidance models (in kt) for Tropical Storm Ian. Errors smaller than the NHC official forecast are shown in boldface type. The number of official forecasts shown here will generally be smaller than that shown in Table 4a due to the homogeneity requirement.
Model ID Forecast Period (h)
12 24 36 48 72 96 120
OFCL 4.5 5.0 4.4 5.8 2.5
OCD5 2.8 4.7 7.0 9.5 7.5
DSHP 4.2 6.3 7.8 8.0 2.0
LGEM 3.8 5.7 6.9 7.3 7.0
GHMI 5.3 6.9 12.1 10.3 10.5
CTCI 3.6 8.4 10.3 12.5 17.0
GFNI 7.5 9.6 8.4 8.0 7.5
ICON 3.5 5.3 7.0 7.5 2.5
IVCN 3.3 5.1 7.5 8.0 4.5
FSSE 3.8 7.6 10.9 10.2 2.5
GFSI 4.2 5.8 8.1 7.3 8.5
EMXI 3.6 2.9 4.1 4.0 5.0
HWFI 3.2 4.6 7.4 11.7 3.5
HCCA 3.3 4.7 6.9 8.3 3.0
Forecasts 10 9 8 6 2

Tropical Storm Ian 10
Figure 1. Best track positions for Tropical Storm Ian, 12-16 September 2016. Track during the extratropical stage is partially based on analyses from the NOAA Ocean Prediction Center.

Tropical Storm Ian 11
Figure 2. Selected wind observations and best track maximum sustained surface wind speed curve for Tropical Storm Ian, 12-16 September 2016. Dashed vertical lines correspond to 0000 UTC.
10
20
30
40
50
60
70
9/6 9/8 9/10 9/12 9/14 9/16 9/18
BEST TRACK
Sat (TAFB)
Sat (SAB)
Scatterometer
AMSU
Win
d Sp
eed
(kt)
Date (Month/Day)
Tropical Storm Ian12-16 September 2016

Tropical Storm Ian 12
Figure 3. Selected pressure observations and best track minimum central pressure curve for Tropical Storm Ian, 12-16 September 2016. . AMSU intensity estimates are from the Cooperative Institute for Meteorological Satellite Studies technique. KZC P-W refers to pressure estimates derived using the Knaff-Zehr-Courtney pressure-wind relationship. Dashed vertical lines correspond to 0000 UTC.
980
990
1000
1010
1020
9/10 9/11 9/12 9/13 9/14 9/15 9/16 9/17 9/18
BEST TRACK
KZC P-W
Sat (TAFB)
Sat (SAB)
AMSU
Pres
sure
(mb)
Date (Month/Day)
Tropical Storm Ian12 - 16 September 2016
Tropical Storm Ian 13
Figure 4. GOES-13 visible satellite image of Ian at 1745 UTC 14 September, near the time Ian acquired subtropical characteristics. Image courtesy of the Naval Research Laboratory.