Tropical Depression Eight
15
NATIONAL HURRICANE CENTER TROPICAL CYCLONE REPORT TROPICAL DEPRESSION EIGHT (AL082016) 28 August – 1 September 2016 John P. Cangialosi National Hurricane Center 6 December 2016 VISIBLE SATELLITE IMAGE OF TROPICAL DEPRESSION EIGHT AT 1825 UTC AUGUST 29 2016 FROM THE SUOMI NATIONAL POLAR-ORBITING PARTNERSHIP SATELLITE. Tropical Depression Eight was a short-lived tropical depression that passed just offshore of the southeast coast of the United States.
Transcript of Tropical Depression Eight

NATIONAL HURRICANE CENTER TROPICAL CYCLONE REPORT
TROPICAL DEPRESSION EIGHT (AL082016) 28 August – 1 September 2016
John P. Cangialosi National Hurricane Center
6 December 2016
VISIBLE SATELLITE IMAGE OF TROPICAL DEPRESSION EIGHT AT 1825 UTC AUGUST 29 2016 FROM THE SUOMI NATIONAL
POLAR-ORBITING PARTNERSHIP SATELLITE.
Tropical Depression Eight was a short-lived tropical depression that passed just
offshore of the southeast coast of the United States.

Tropical Depression Eight 2
Tropical Depression Eight 28 AUGUST – 1 SEPTEMBER 2016
SYNOPTIC HISTORY Tropical Depression Eight had non-tropical origins, forming from the southern portion of a frontal boundary over the western Atlantic that became stationary on 25 August. The front weakened the next day, and a broad area of low pressure formed near the tail end of the dissipating boundary. The low pressure system became well defined around 0000 UTC 27 August when it was located about 100 n mi south of Bermuda, but deep convection was intermittent and disorganized until a large burst occurred near and to the west of the center around 1200 UTC 28 August, marking the formation of a tropical depression. A sequence of infrared satellite images shows the evolution of genesis (Fig. 1). The “best track” chart of the tropical cyclone’s path is given in Fig. 2, with the wind and pressure histories shown in Figs. 3 and 4, respectively. The best track positions and intensities are listed in Table 11.
At the time of genesis the depression was located about 350 n mi southeast of Cape Hatteras, North Carolina, and was moving west-northwestward to the south of a mid-level ridge. In an environment of moderate easterly shear and dry air, the depression failed to intensity throughout its lifetime. The cyclone slowed and turned northward on 30 August when it neared a pronounced break in the subtropical ridge, and it reached its closest point of approach to the coast that day, passing about 60 n mi south-southeast of Cape Hatteras. Although the depression was not far offshore, no significant rains, winds, or surf in association with the system were experienced along the coastline. The cyclone turned northeastward the next day when it became embedded in the mid-latitude flow. As the system accelerated northeastward, satellite-derived wind data indicate that the circulation became elongated, and it is estimated that the depression dissipated shortly after 0000 UTC 1 September about 250 n mi east of Virginia Beach, Virginia. The remnants of the cyclone were absorbed into a frontal system about a day later.
METEOROLOGICAL STATISTICS Observations in Tropical Depression Eight (Figs. 3 and 4) include subjective satellite-based Dvorak technique intensity estimates from the Tropical Analysis and Forecast Branch (TAFB) and the Satellite Analysis Branch (SAB), and objective Advanced Dvorak Technique (ADT) estimates from the Cooperative Institute for Meteorological Satellite Studies/University of Wisconsin-Madison. Observations also include flight-level, stepped frequency microwave radiometer (SFMR), and dropwindsonde observations from flights of the 53rd Weather
1 A digital record of the complete best track, including wind radii, can be found on line at ftp://ftp.nhc.noaa.gov/atcf. Data for the current year’s storms are located in the btk directory, while previous years’ data are located in the archive directory.

Tropical Depression Eight 3
Reconnaissance Squadron of the U. S. Air Force Reserve Command. Data and imagery from NOAA polar-orbiting satellites including the Advanced Microwave Sounding Unit (AMSU), the NASA Global Precipitation Mission (GPM), the European Space Agency’s Advanced Scatterometer (ASCAT), and Defense Meteorological Satellite Program (DMSP) satellites, among others, were also useful in constructing the best track of Tropical Depression Eight.
There were no reports of winds of tropical storm force associated with Tropical Depression Eight.
The estimated maximum wind speed of 30 kt during the lifetime of the depression is largely based on flight-level and SFMR wind data from five U.S. Air Force reconnaissance aircraft missions, which consistently showed the highest reliable winds in the 25 to 30 kt range.
CASUALTY AND DAMAGE STATISTICS There were no reports of damage or casualties associated with Tropical Depression Eight.
FORECAST AND WARNING CRITIQUE
The genesis of Tropical Depression Eight was not well forecast. The low from which the depression developed was introduced in the Tropical Weather Outlook only 36 h prior to genesis, and was never assessed to have more than a low chance of development (Table 2). The global models did not show much deepening of this system, and it was believed that dry air and moderate shear would make genesis unlikely.
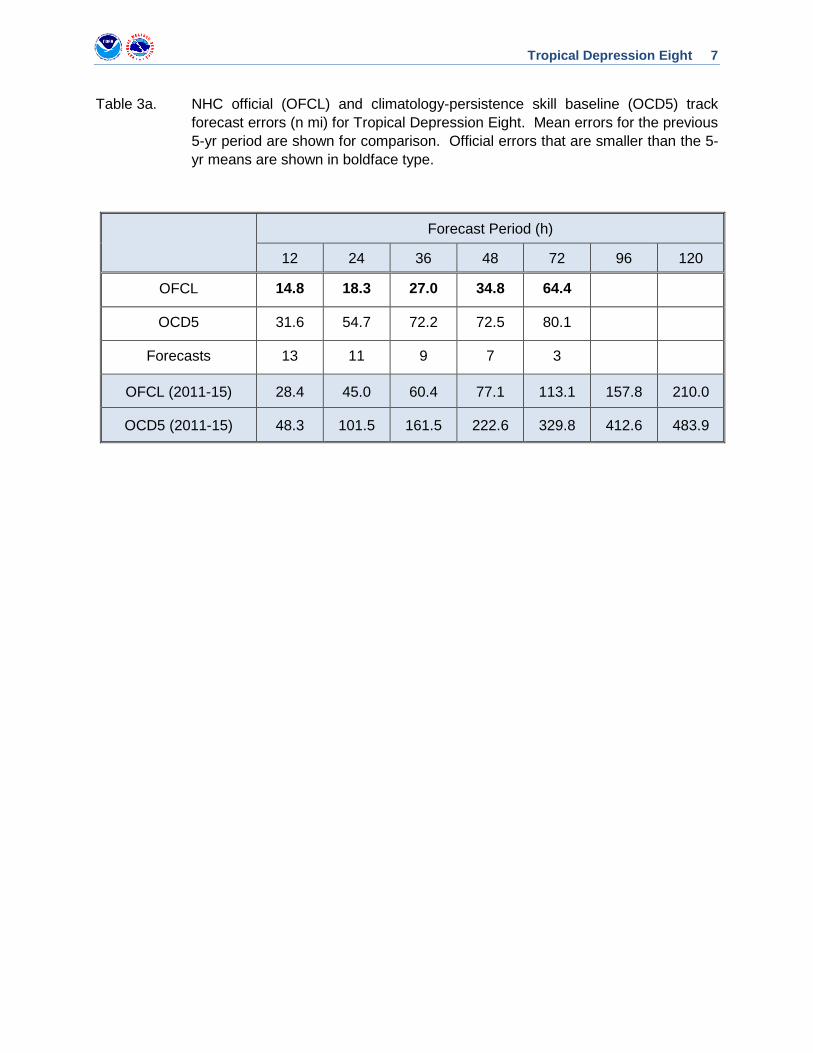
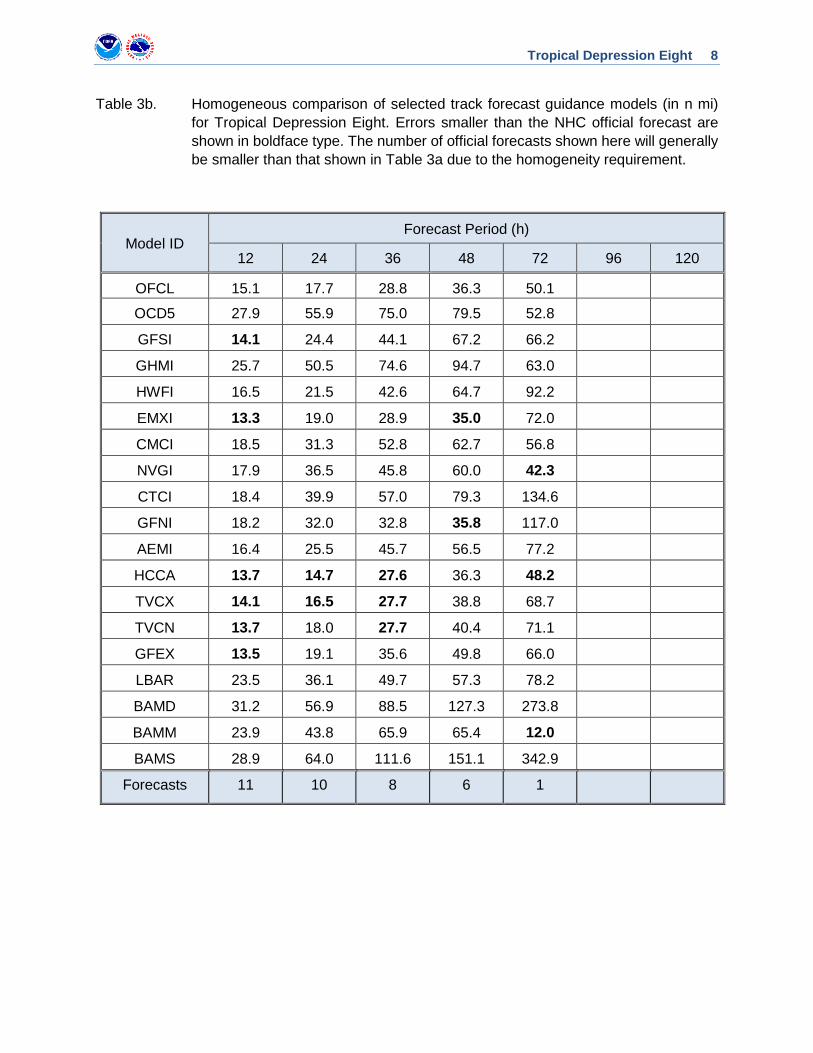
A verification of NHC official track forecasts for Tropical Depression Eight is given in Table 3a. Official forecast track errors were much lower than the mean official errors for the previous 5-yr period. A homogeneous comparison of the official track errors with selected guidance models is given in Table 3b. The NOAA corrected consensus HCCA and consensus aid TVCX were the best-performing models and beat the official forecasts at a few time periods. It should be noted that most of the dynamical models and climatology and persistence model OCD5 had relatively low errors for Tropical Depression Eight, indicating that the system was likely easier to forecast than average.
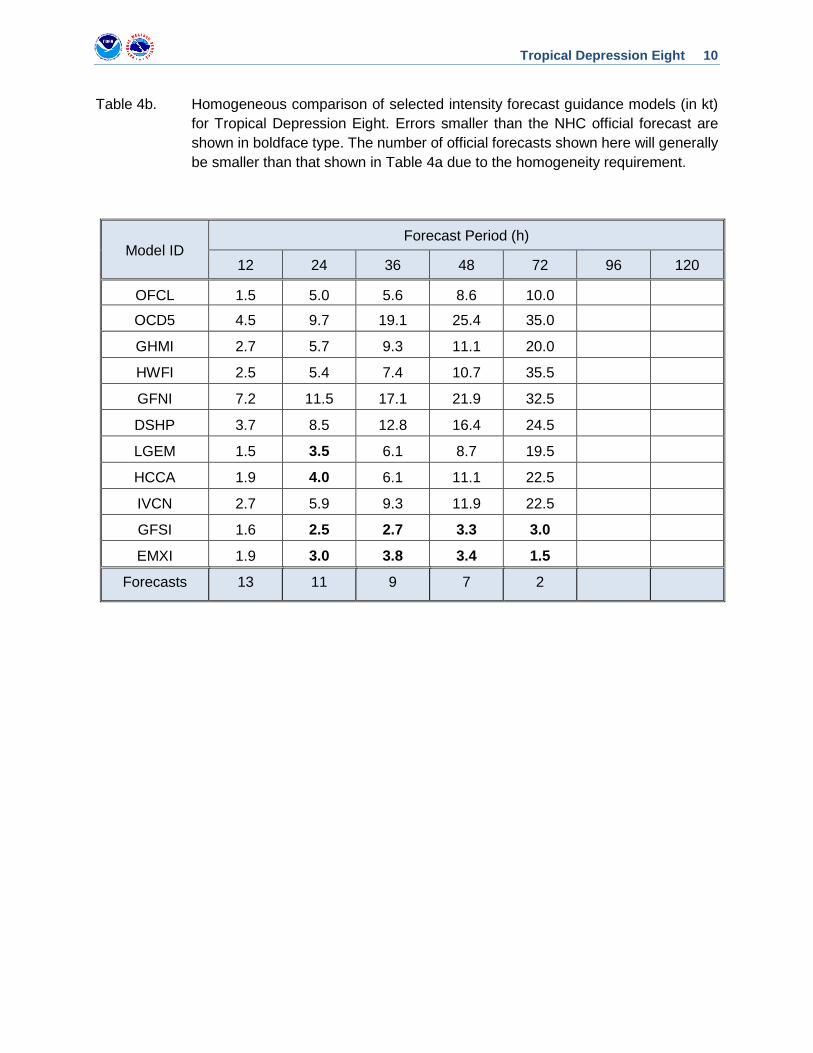
A verification of NHC official intensity forecasts for Tropical Depression Eight is given in Table 4a. Official forecast intensity errors were also much lower than the mean official errors for the previous 5-yr period. A homogeneous comparison of the official intensity errors with selected guidance models is given in Table 4b. The official forecasts outperformed the standard intensity guidance, which incorrectly predicted the depression to strengthen. GFNI and HWFI were among the poorest-performing models, showing the depression reaching hurricane strength in a few runs. Conversely, the global models GFSI and EMXI had the lowest intensity errors and beat the official forecasts at 24 h and beyond.

Tropical Depression Eight 4
Since the depression was initially forecast to strengthen as it approached the southeast coast of the United States, tropical storm watches and warnings were issued for a portion of North Carolina (Table 5).
Tropical Depression Eight 5
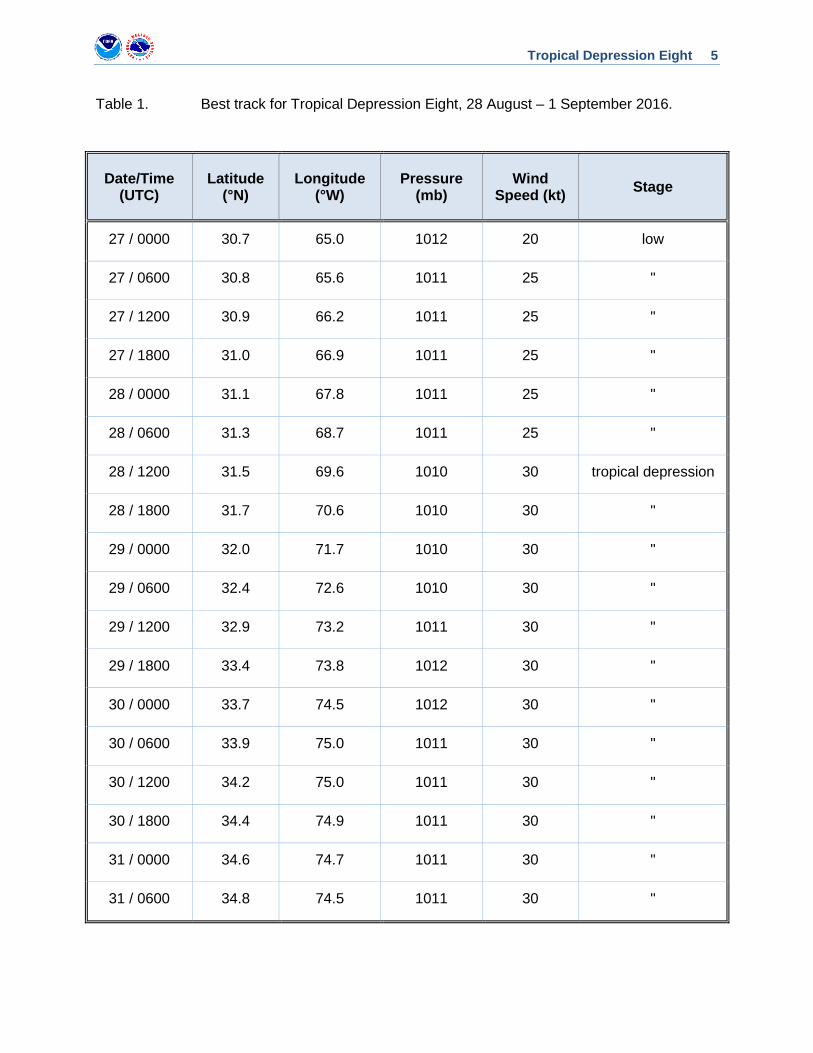
Table 1. Best track for Tropical Depression Eight, 28 August – 1 September 2016.
Date/Time (UTC)
Latitude (°N)
Longitude (°W)
Pressure (mb)
Wind Speed (kt) Stage
27 / 0000 30.7 65.0 1012 20 low
27 / 0600 30.8 65.6 1011 25 "
27 / 1200 30.9 66.2 1011 25 "
27 / 1800 31.0 66.9 1011 25 "
28 / 0000 31.1 67.8 1011 25 "
28 / 0600 31.3 68.7 1011 25 "
28 / 1200 31.5 69.6 1010 30 tropical depression
28 / 1800 31.7 70.6 1010 30 "
29 / 0000 32.0 71.7 1010 30 "
29 / 0600 32.4 72.6 1010 30 "
29 / 1200 32.9 73.2 1011 30 "
29 / 1800 33.4 73.8 1012 30 "
30 / 0000 33.7 74.5 1012 30 "
30 / 0600 33.9 75.0 1011 30 "
30 / 1200 34.2 75.0 1011 30 "
30 / 1800 34.4 74.9 1011 30 "
31 / 0000 34.6 74.7 1011 30 "
31 / 0600 34.8 74.5 1011 30 "
Tropical Depression Eight 6
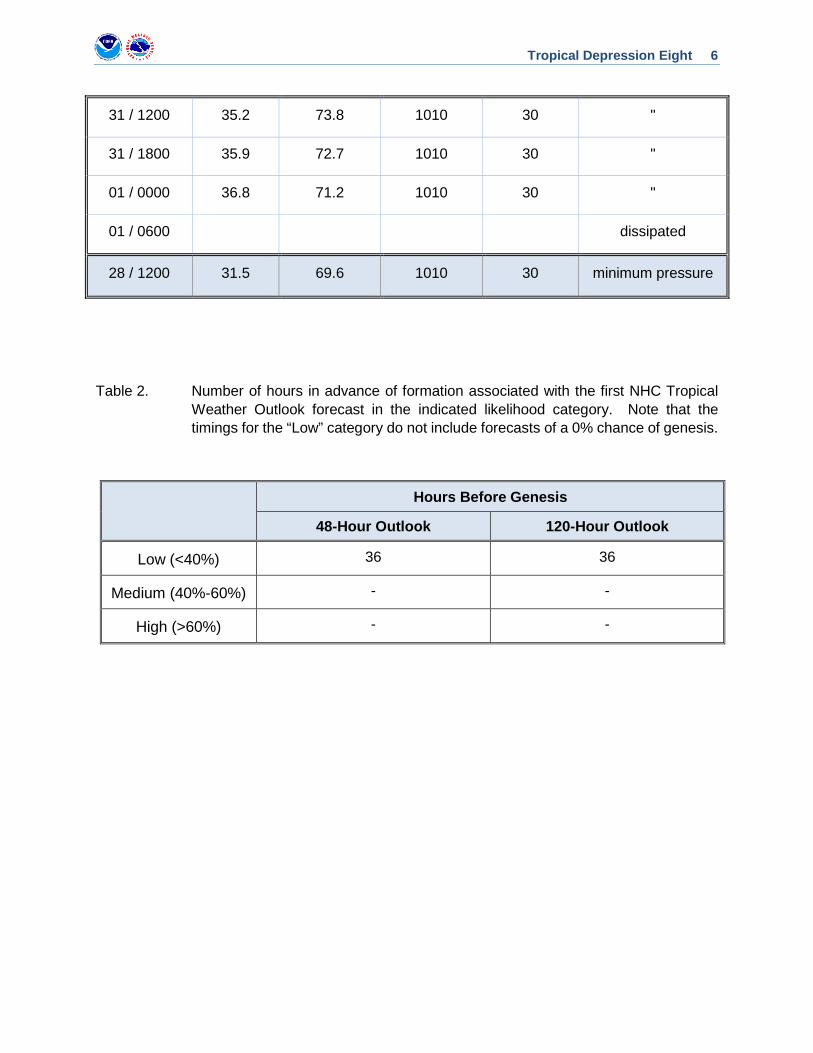
31 / 1200 35.2 73.8 1010 30 "
31 / 1800 35.9 72.7 1010 30 "
01 / 0000 36.8 71.2 1010 30 "
01 / 0600 dissipated
28 / 1200 31.5 69.6 1010 30 minimum pressure
Table 2. Number of hours in advance of formation associated with the first NHC Tropical Weather Outlook forecast in the indicated likelihood category. Note that the timings for the “Low” category do not include forecasts of a 0% chance of genesis.
Hours Before Genesis
48-Hour Outlook 120-Hour Outlook
Low (<40%) 36 36
Medium (40%-60%) - -
High (>60%) - -
Tropical Depression Eight 7
Table 3a. NHC official (OFCL) and climatology-persistence skill baseline (OCD5) track forecast errors (n mi) for Tropical Depression Eight. Mean errors for the previous 5-yr period are shown for comparison. Official errors that are smaller than the 5-yr means are shown in boldface type.
Forecast Period (h)
12 24 36 48 72 96 120
OFCL 14.8 18.3 27.0 34.8 64.4
OCD5 31.6 54.7 72.2 72.5 80.1
Forecasts 13 11 9 7 3
OFCL (2011-15) 28.4 45.0 60.4 77.1 113.1 157.8 210.0
OCD5 (2011-15) 48.3 101.5 161.5 222.6 329.8 412.6 483.9
Tropical Depression Eight 8
Table 3b. Homogeneous comparison of selected track forecast guidance models (in n mi) for Tropical Depression Eight. Errors smaller than the NHC official forecast are shown in boldface type. The number of official forecasts shown here will generally be smaller than that shown in Table 3a due to the homogeneity requirement.
Model ID Forecast Period (h)
12 24 36 48 72 96 120
OFCL 15.1 17.7 28.8 36.3 50.1
OCD5 27.9 55.9 75.0 79.5 52.8
GFSI 14.1 24.4 44.1 67.2 66.2
GHMI 25.7 50.5 74.6 94.7 63.0
HWFI 16.5 21.5 42.6 64.7 92.2
EMXI 13.3 19.0 28.9 35.0 72.0
CMCI 18.5 31.3 52.8 62.7 56.8
NVGI 17.9 36.5 45.8 60.0 42.3
CTCI 18.4 39.9 57.0 79.3 134.6
GFNI 18.2 32.0 32.8 35.8 117.0
AEMI 16.4 25.5 45.7 56.5 77.2
HCCA 13.7 14.7 27.6 36.3 48.2
TVCX 14.1 16.5 27.7 38.8 68.7
TVCN 13.7 18.0 27.7 40.4 71.1
GFEX 13.5 19.1 35.6 49.8 66.0
LBAR 23.5 36.1 49.7 57.3 78.2
BAMD 31.2 56.9 88.5 127.3 273.8
BAMM 23.9 43.8 65.9 65.4 12.0
BAMS 28.9 64.0 111.6 151.1 342.9
Forecasts 11 10 8 6 1

Tropical Depression Eight 9
Table 4a. NHC official (OFCL) and climatology-persistence skill baseline (OCD5) intensity forecast errors (kt) for Tropical Depression Eight. Mean errors for the previous 5-yr period are shown for comparison. Official errors that are smaller than the 5-yr means are shown in boldface type.
Forecast Period (h)
12 24 36 48 72 96 120
OFCL 1.5 5.0 5.6 8.6 8.3
OCD5 4.5 9.7 19.1 25.4 35.3
Forecasts 13 11 9 7 3
OFCL (2011-15) 6.2 9.4 11.5 13.3 14.6 14.6 15.8
OCD5 (2011-15) 7.3 10.8 13.3 15.3 17.7 17.8 17.6
Tropical Depression Eight 10
Table 4b. Homogeneous comparison of selected intensity forecast guidance models (in kt) for Tropical Depression Eight. Errors smaller than the NHC official forecast are shown in boldface type. The number of official forecasts shown here will generally be smaller than that shown in Table 4a due to the homogeneity requirement.
Model ID Forecast Period (h)
12 24 36 48 72 96 120
OFCL 1.5 5.0 5.6 8.6 10.0
OCD5 4.5 9.7 19.1 25.4 35.0
GHMI 2.7 5.7 9.3 11.1 20.0
HWFI 2.5 5.4 7.4 10.7 35.5
GFNI 7.2 11.5 17.1 21.9 32.5
DSHP 3.7 8.5 12.8 16.4 24.5
LGEM 1.5 3.5 6.1 8.7 19.5
HCCA 1.9 4.0 6.1 11.1 22.5
IVCN 2.7 5.9 9.3 11.9 22.5
GFSI 1.6 2.5 2.7 3.3 3.0
EMXI 1.9 3.0 3.8 3.4 1.5
Forecasts 13 11 9 7 2

Tropical Depression Eight 11
Table 5. Watch and warning summary for Tropical Depression Eight, 28 August – 1 September.
Date/Time (UTC) Action Location
29 / 0300 Tropical Storm Watch issued Cape Lookout to Oregon Inlet, North Carolina
29 / 2100 Tropical Storm Warning issued Cape Lookout to Oregon Inlet including Pamlico Sound, North Carolina
31/ 0000 Tropical Storm Warning discontinued
Cape Lookout to Oregon Inlet including Pamlico Sound, North Carolina

Tropical Depression Eight 12
(a) (b) (c)
Figure 1. GOES-E Infrared satellite images showing the evolution of the genesis of Tropical Depression Eight as a stationary frontal boundary at 1200 UTC 25 August (a), low at 0000 UTC 27 August (b), and tropical depression at 1200 UTC 28 August (c).
25/1200 UTC 27/0000 UTC 28/1200 UTC

Tropical Depression Eight 13
Figure 2. Best track positions for Tropical Depression Eight, 28 August – 1 September 2016.

Tropical Depression Eight 14
Figure 3. Selected wind observations and best track maximum sustained surface wind speed curve for Tropical Depression Eight, 28 August – 1 September. Aircraft observations have been adjusted for elevation using 80% and 75% adjustment factors for observations from 850 mb and 925 mb, respectively. Dropwindsonde observations include actual 10 m winds (sfc), as well as surface estimates derived from the mean wind over the lowest 150 m of the wind sounding (LLM). Advanced Dvorak Technique estimates represent the Current Intensity at the nominal observation time. AMSU intensity estimates are from the Cooperative Institute for Meteorological Satellite Studies technique. Dashed vertical lines correspond to 0000 UTC.
15
20
25
30
35
40
45
50
55
8/27 8/28 8/29 8/30 8/31 9/1 9/2
BEST TRACKSat (TAFB)Sat (SAB)ADTAC (sfc)AC (flt->sfc)AC (DVK P->W)ScatterometerDrop (sfc)Drop (LLM xtrp)AMSU
Win
d Sp
eed
(kt)
Date (Month/Day)
Tropical Depression Eight28 August - 1 September 2016

Tropical Depression Eight 15
Figure 4. Selected pressure observations and best track minimum central pressure curve for Tropical Depression Eight, 28 August -1 Septemeber. Advanced Dvorak Technique estimates represent the Current Intensity at the nominal observation time. AMSU intensity estimates are from the Cooperative Institute for Meteorological Satellite Studies technique. KZC P-W refers to pressure estimates derived using the Knaff-Zehr-Courtney pressure-wind relationship. Dashed vertical lines correspond to 0000 UTC.
996
1000
1004
1008
1012
8/27 8/28 8/29 8/30 8/31 9/1 9/2
BEST TRACKKZC P-WSat (TAFB)Sat (SAB)ADTAMSUAC (sfc)
Pres
sure
(mb)
Date (Month/Day)
Tropical Depresion Eight28 August - 1 September 2016