Tropical Cyclone Report Hurricane Maria (AL142011 ... · Hurricane Maria (AL142011) ......
25
1 Tropical Cyclone Report Hurricane Maria (AL142011) 6-16 September 2011 Michael J. Brennan National Hurricane Center 11 January 2012 Maria formed in the eastern Atlantic Ocean and brought tropical storm conditions to portions of the Lesser Antilles. Maria then became a category 1 hurricane (on the Saffir- Simpson Hurricane Wind Scale) as it recurved through the northwestern Atlantic before it made landfall in Newfoundland as a strong tropical storm. a. Synoptic History Maria originated from a tropical wave that moved across the west coast of Africa on 2 September. The wave moved westward well to the south of the Cape Verde islands on 3-4 September with little in the way of organized deep convection. Thunderstorm activity increased markedly early on 5 September but remained displaced to the west of the broad surface circulation due to strong easterly vertical wind shear. On 6 September, the low-level center became better defined and deep convection increased further and a tropical depression formed by 1800 UTC that day, centered about 700 n mi west-southwest of the southern Cape Verde Islands. The cyclone moved quickly west-northwestward at 15 to 20 kt and reached tropical storm intensity 6 h later, while centered about 790 n mi west-southwest of the southern Cape Verde Islands. The “best track” chart of Maria’s path is given in Fig. 1, with the wind and pressure histories shown in Figs. 2 and 3, respectively. The best track positions and intensities are listed in Table 1 1 . Maria moved quickly west-northwestward to the south of a subtropical ridge on 7 September and reached an intensity of 45 kt around 1200 UTC that day. However, by early the next day southwesterly vertical wind shear increased over the cyclone, and the deep convection became displaced to the northeast of the fast-moving low-level center. By early on 9 September, the forward speed of Maria slowed to around 15 kt as the storm turned west-northwestward, and deep convection began to redevelop closer to the low-level circulation. However, data from an Air Force Reserve Hurricane Hunter aircraft mission into Maria later that day indicated that the low-level circulation lost definition, even as the system was producing maximum sustained winds of around 45 kt mainly to the northeast of the center. Based on the aircraft data, satellite imagery, and surface observations, it is estimated that Maria no longer had a well-defined center and dissipated as a tropical cyclone around 1200 UTC 9 September. 1 A digital record of the complete best track, including wind radii, can be found on line at ftp://ftp.nhc.noaa.gov/atcf. Data for the current year’s storms are located in the btk directory, while previous years’ data are located in the archive directory.
Transcript of Tropical Cyclone Report Hurricane Maria (AL142011 ... · Hurricane Maria (AL142011) ......

1
Tropical Cyclone Report Hurricane Maria
(AL142011) 6-16 September 2011
Michael J. Brennan
National Hurricane Center 11 January 2012
Maria formed in the eastern Atlantic Ocean and brought tropical storm conditions to portions of the Lesser Antilles. Maria then became a category 1 hurricane (on the Saffir-Simpson Hurricane Wind Scale) as it recurved through the northwestern Atlantic before it made landfall in Newfoundland as a strong tropical storm. a. Synoptic History Maria originated from a tropical wave that moved across the west coast of Africa on 2 September. The wave moved westward well to the south of the Cape Verde islands on 3-4 September with little in the way of organized deep convection. Thunderstorm activity increased markedly early on 5 September but remained displaced to the west of the broad surface circulation due to strong easterly vertical wind shear. On 6 September, the low-level center became better defined and deep convection increased further and a tropical depression formed by 1800 UTC that day, centered about 700 n mi west-southwest of the southern Cape Verde Islands. The cyclone moved quickly west-northwestward at 15 to 20 kt and reached tropical storm intensity 6 h later, while centered about 790 n mi west-southwest of the southern Cape Verde Islands. The “best track” chart of Maria’s path is given in Fig. 1, with the wind and pressure histories shown in Figs. 2 and 3, respectively. The best track positions and intensities are listed in Table 11. Maria moved quickly west-northwestward to the south of a subtropical ridge on 7 September and reached an intensity of 45 kt around 1200 UTC that day. However, by early the next day southwesterly vertical wind shear increased over the cyclone, and the deep convection became displaced to the northeast of the fast-moving low-level center. By early on 9 September, the forward speed of Maria slowed to around 15 kt as the storm turned west-northwestward, and deep convection began to redevelop closer to the low-level circulation. However, data from an Air Force Reserve Hurricane Hunter aircraft mission into Maria later that day indicated that the low-level circulation lost definition, even as the system was producing maximum sustained winds of around 45 kt mainly to the northeast of the center. Based on the aircraft data, satellite imagery, and surface observations, it is estimated that Maria no longer had a well-defined center and dissipated as a tropical cyclone around 1200 UTC 9 September.
1 A digital record of the complete best track, including wind radii, can be found on line at ftp://ftp.nhc.noaa.gov/atcf. Data for the current year’s storms are located in the btk directory, while previous years’ data are located in the archive directory.

2
The remnants of Maria, accompanied by a strong mid-level circulation, turned northwestward and approached the Lesser Antilles by late on 9 September. Satellite imagery and surface and aircraft observations indicate that a new center developed around 1200 UTC 10 September about 40 n mi east-southeast of Antigua, and Maria again became a tropical storm at that time. Maria continued to experience strong westerly vertical wind shear while it moved northwestward and then west-northwestward, and its forward motion slowed as the center passed to the north of the Virgin Islands and Puerto Rico the next day. The forward speed of Maria slowed considerably on 12 September when the cyclone reached the southwestern periphery of the subtropical ridge. Maria then turned northwestward while its forward speed increased to around 10 kt by 0000 UTC 14 September. Vertical wind shear relaxed somewhat during the next day or so and Maria began to be steered by a deep-layer trough moving off of the east coast of North America. The cyclone slowly strengthened on 14 September as deep convection became more concentrated near the center. Maria turned northward by 15 September and continued strengthening, reaching hurricane intensity around 1800 UTC that day while centered about 135 n mi northwest of Bermuda (Fig. 4). On 16 September, Maria became embedded in the mid-latitude flow and accelerated northeastward, reaching an estimated peak intensity of 70 kt at 0000 UTC that day, before weakening due to cooler waters and increased vertical wind shear. Maria was a 60-kt tropical storm when the center made landfall around 1830 UTC 16 September near Cape St. Mary’s on the Avalon Peninsula of Newfoundland, Canada. The cyclone’s circulation was absorbed by a frontal system shortly thereafter. b. Meteorological Statistics Observations in Maria (Figs. 2 and 3) include subjective satellite-based Dvorak technique intensity estimates from the Tropical Analysis and Forecast Branch (TAFB) and the Satellite Analysis Branch (SAB), and objective Advanced Dvorak Technique (ADT) estimates from the Cooperative Institute for Meteorological Satellite Studies/University of Wisconsin-Madison. Observations also include flight-level, stepped frequency microwave radiometer (SFMR), and dropwindsonde observations from six flights of the 53rd Weather Reconnaissance Squadron of the U.S. Air Force Reserve Command. Data and imagery from NOAA polar-orbiting satellites, including the Advanced Microwave Sounding Unit, the NASA Tropical Rainfall Measuring Mission (TRMM) and Aqua, the European Space Agency’s Advanced Scatterometer (ASCAT), and Defense Meteorological Satellite Program (DMSP) satellites, among others, were also useful in constructing the best track of Maria. Ship and fixed platform reports of winds of tropical storm force associated with Maria are given in Table 2, and selected surface observations from land stations and data buoys are given in Table 3. As Maria and its remnants passed near and north of the Leeward Islands and the Virgin Islands on 9-11 September, the strongest observed sustained wind was 45 kt at La Desirade, located just to the east of Guadeloupe. Tropical-storm-force wind gusts were observed on Antigua, Guadeloupe, Marie-Galante, Barbuda, St. Maarten/St. Martin, St. Croix, and St.

3
Thomas, but sustained winds remained below tropical storm force. In several of these locations, the strongest winds occurred before Maria regenerated into a tropical cyclone.
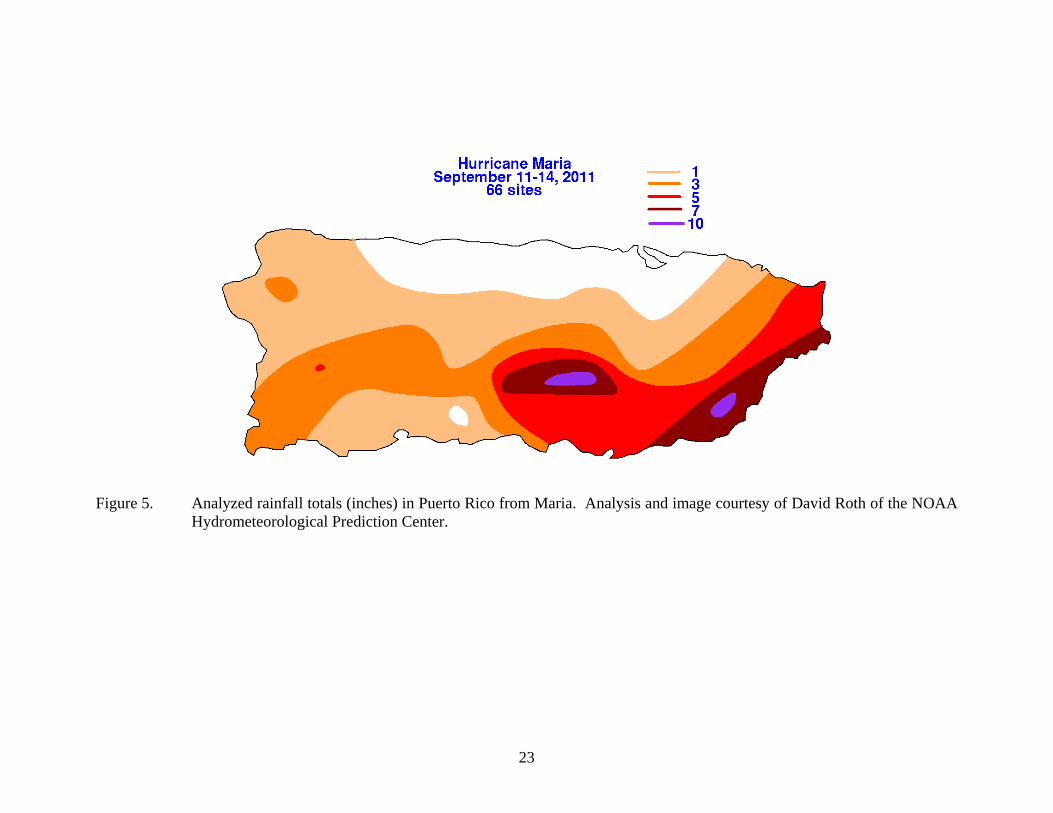
Widespread rainfall totals of 5 to 11 inches were observed in Puerto Rico (Fig. 5), with a maximum of 11.60 inches at Aibonito. Rainfall totals in the Leeward Islands were generally 1 to 2 inches.
Maria produced storm surge values of 0.50 to 0.75 ft in Barbuda, St. Croix, St. John, Vieques, Mona Island, and Puerto Rico. The highest observed storm tide was 2.03 ft above Mean Lower Low Water at Arecibo on the northern coast of Puerto Rico. As Maria passed west of Bermuda on 15 September, sustained winds of 34 kt were reported at L.F. Wade International airport, along with a peak wind gust of 43 kt. Maria’s analyzed peak intensity of 70 kt is based on a blend of subjective Dvorak intensity estimates of 77 kt from TAFB and 65 kt from SAB and a 3-h average ADT intensity estimate of 72 kt from UW-CIMSS at 0600 UTC 16 September. The estimated minimum central pressure of 983 mb is based on an observed pressure of 985.4 mb with 25-kt winds at Environment Canada buoy 44141 around 1200 UTC 16 September. Maria made landfall in Newfoundland around 1830 UTC 16 September on the Avalon Peninsula near Cape St. Mary’s as a strong tropical storm with maximum sustained wind of 60 kt. The estimated landfall intensity is based on subjective Dvorak intensity estimates of 55 kt from TAFB and SAB at 1800 UTC and a 10-min wind of 52 kt from Environment Canada buoy 44138 at 1520 UTC, which suggests a peak 1-min wind of 57 kt when applying an adjustment factor of 1.11 (Harper et al. 2009). The analyzed minimum central pressure of 983 mb at landfall is based on an observed pressure at Grate’s Cove of 983.9 mb, which occurred with 16 kt of wind. The strongest winds associated with Maria remained offshore to the southeast of Newfoundland, though sustained tropical-storm-force winds were observed at Cape Race, Bonavista, and Sagona Island, with wind gusts above 50 kt observed at all of those locations as well as at St. Lawrence. Rainfall amounts in the Burin Peninsula and the south coast of Newfoundland were around 2.35 inches (60 mm), with a total of 2.48 inches (63 mm) observed at St. Lawrence. c. Casualty and Damage Statistics There were no reports of casualties associated with Maria.
In Puerto Rico numerous roads were flooded due to rainfall and 20 homes were flooded in Cabo Rojo. Thirty families were moved to shelters after their homes were flooded in Ceiba, Juana Diaz, and Barranquitas. A total of 15,700 people lost power in Puerto Rico due to the storm. No monetary damage estimates are available.
No other reports of damage or impacts were received.

4
d. Forecast and Warning Critique The genesis of Maria was not well anticipated. The precursor system that developed into Maria was not introduced into the Tropical Weather Outlook until 30 h before genesis, when it was given a low (< 30%) chance of development. However, the genesis probability was raised to the high category (> 50% chance of development) 6 h later and remained in that category until genesis occurred.
A verification of NHC official track forecasts for Maria is given in Table 4a. Official
forecast track errors (OFCL) were generally 20% to 25% larger than the mean official errors for the previous 5-yr period, except at 72 h when the average error was only about 10% above the mean 5-yr value. Errors from the CLIPER climatology-persistence baseline model (OCD5) were higher than the previous 5-yr mean through 72 h, suggesting that the track of Maria was somewhat more difficult to forecast than average through 3 days. A homogeneous comparison of the OFCL track errors with selected guidance models is given in Table 4b. The TCON, TVCA, TVCE, and TVCC consensus models beat OFCL at all time periods. The best-performing individual model was the GFS (GFSI), which had smaller errors than OFCL through 72 h. The GFDN model (GFNI) had the smallest errors of any single model at days 4 and 5. The largest OFCL errors occurred for forecasts made on 8-9 September. At these times OFCL and the TVCA consensus model both showed Maria moving to the left of the observed track through the Lesser Antilles and closer to Puerto Rico before reaching a 5-day position east of the central Bahamas (Fig. 6). These errors appear to be due in part to difficulty analyzing the initial position of Maria prior to its dissipation at 1200 UTC 9 September, as the initial position and short term forecasts were south of the observed track.
A verification of NHC official intensity forecasts for Maria is given in Table 5a. Official
forecast intensity errors (OFCL) were 40% to 60% lower than the mean official errors for the previous 5-yr period at all lead times. Average errors from the SHIFOR5 climatology-persistence baseline model (OCD5) were also lower than the previous 5-yr mean, suggesting that the intensity of Maria was somewhat easier to forecast than average. A homogeneous comparison of the official intensity errors with selected guidance models is given in Table 5b. The official forecast had smaller average errors than all of the model guidance, except for the LGEM at 48 and 72 h. The regional hurricane models, the GFDL (GHMI), the U.S. Navy version of the GFDL (GFNI), and the HWRF (HWFI), all had large positive intensity biases for Maria (Fig. 7). In particular, from 10-12 September the GHMI and GFNI repeatedly forecast Maria to strengthen to near-major or major hurricane intensity despite the notably sheared environment in which the cyclone was embedded. While the official forecast also had a small positive intensity bias, OFCL forecasts issued on 10-12 September correctly predicted that Maria would not become stronger than a category 1 hurricane.
Watches and warnings associated with Maria are given in Table 6.

5
Acknowledgements Thanks are expressed to the Antigua and Barbuda Meteorological Service, Meteo France, and the Canadian Hurricane Centre, who all provided meteorological data included in this report, as well as the NOAA National Data Buoy Center and the NOAA National Ocean Service who also provided post-storm observations. David Roth of the NOAA Hydrometeorological Prediction Center provided the rainfall analysis for Puerto Rico. References Harper, B.A., J.D. Kepert, and J.D. Ginger, 2009: Guidelines for Converting Between Various Wind Averaging Periods in Tropical Cyclone Conditions. World Meteorological Organization, 52 pp.

6
Table 1. Best track for Hurricane Maria, 6–16 September 2011.
Date/Time (UTC)
Latitude (N)
Longitude (W)
Pressure (mb)
Wind Speed (kt)
Stage
06 / 1800 11.5 35.9 1008 30 tropical depression 07 / 0000 11.9 37.5 1007 35 tropical storm 07 / 0600 12.3 39.1 1006 40 " 07 / 1200 12.8 41.0 1004 45 " 07 / 1800 13.0 43.0 1004 45 " 08 / 0000 13.2 45.2 1003 45 " 08 / 0600 13.2 47.7 1002 45 " 08 / 1200 13.0 50.1 1004 40 " 08 / 1800 13.2 52.1 1004 40 " 09 / 0000 13.5 53.7 1004 40 " 09 / 0600 13.9 55.2 1003 40 " 09 / 1200 14.3 56.6 1003 45 disturbance 09 / 1800 14.9 57.9 1004 45 " 10 / 0000 15.4 59.0 1004 45 " 10 / 0600 16.0 60.0 1005 45 " 10 / 1200 16.9 61.1 1005 45 tropical storm 10 / 1800 17.8 62.0 1005 45 " 11 / 0000 18.3 62.7 1005 45 " 11 / 0600 18.7 63.4 1004 50 " 11 / 1200 19.1 64.1 1004 50 " 11 / 1800 19.6 64.7 1005 50 " 12 / 0000 20.0 65.3 1005 50 " 12 / 0600 20.4 66.1 1005 50 " 12 / 1200 20.6 66.9 1006 50 " 12 / 1800 20.8 67.1 1006 50 " 13 / 0000 21.0 67.3 1006 45 " 13 / 0600 21.3 67.5 1006 45 " 13 / 1200 21.7 67.7 1006 45 " 13 / 1800 22.3 68.0 1005 45 " 14 / 0000 23.1 68.5 1004 45 " 14 / 0600 23.9 69.0 1001 50 " 14 / 1200 24.7 69.3 1001 50 " 14 / 1800 25.8 69.3 1000 55 " 15 / 0000 27.2 68.9 999 60 " 15 / 0600 28.8 68.4 995 60 " 15 / 1200 30.9 67.8 991 60 " 15 / 1800 33.7 66.9 987 65 hurricane

7
16 / 0000 36.8 64.8 984 70 " 16 / 0600 39.8 62.1 983 70 " 16 / 1200 42.9 58.2 983 65 " 16 / 1800 46.7 53.9 983 60 tropical storm 16 / 2100 dissipated 16 / 1830 47.0 53.5 983 60 Landfall near
Cape St. Mary’s, Newfoundland, Canada
16 / 0600 39.8 62.1 983 70 minimum pressure

8
Table 2. Selected ship and fixed platform reports with winds of at least 34 kt for Hurricane Maria and its remnants, 6–16 September 2011.
Date/Time (UTC)
Ship/Platform call sign
Latitude (N)
Longitude (W)
Wind dir/speed (kt)
Pressure (mb)
13 / 0000 DEDI 21.7 64.2 140 / 40 1015.0 13 / 1200 A8IN8 21.0 62.7 020 / 35 1014.0 14 / 0000 VRXL7 24.8 64.6 170 / 38 1015.5 14 / 1200 A8SE8 23.6 62.6 130 / 35 1016.5 16 / 0300 WPGK 37.7 72.7 340 / 40 1012.3 16 / 0300 NWS002 42.2 69.8 320 / 37 1011.3 16 / 0700 ZCDG8 40.5 69.3 330 / 50 1012.3 16 / 1300 VRGT8 41.9 65.5 320 / 36 1012.0 16 / 1400 WKAP 43.3 63.4 310 / 35 1012.9 16 / 1500 YJUF7 46.7 48.0 170 / 41 1015.4 16 / 1800 VCXF 46.4 48.4 160 / 43 1008.8 16 / 1800 VEP717a 46.7 48.7 160 / 58 1009.1 16 / 1800 YJUF7 46.7 48.0 170 / 44 1010.3 16 / 1800 VXKF 47.1 59.6 300 / 45 999.8 16 / 1800 YJQN7 48.3 46.2 180 / 38 1013.6 16 / 1900 VCRG 46.7 61.8 280 / 42 1007.8
a Hibernia oil platform; anemometer height is 456 ft.

9
Table 3. Selected surface observations for Hurricane Maria and its remnants, 6–16 September 2011.
Location
Minimum Sea Level Pressure
Maximum Surface Wind Speed
Storm surge (ft)c
Storm tide (ft)d
Total rain (in) Date/
time (UTC)
Press. (mb)
Date/ time
(UTC)a
Sustained (kt)b
Gust (kt)
Lesser Antilles
International Civil Aviation Organization
(ICAO) Sites
Antigua (TAPA) 10/1830 1007.0 10/0245 20f 37 0.91
Guadeloupe (TFFR) 10/1600 1007.4 09/1500 26 42 1.40
Marie-Galante (TFFM) 10/0300 1006.6 09/1700 20 35 1.32
La Desirade (TFFA) 10/1800 1006.8 09/1400 45 55 0.39
Dominica (TDPD) 10/1900 1007 09/2000 22 32
Martinique (TFFF) 09/1600 1007.7 09/0900 21 31 1.32
Nevis (TKPN) 11/1500 28 31
St. Kitts (TKPK) 10/1900 1007 11/1300 20
St. Maarten – Juliana Airport (TNCM)
11/0600 1006 11/1500 25 35
St. Martin – Grand Case Airport (TFFG)
11/0200 1006.5 11/1400 21f 47 1.97
St. Barthelemy (TFFJ) 11/0200 1006.5 09/1600 23f 43 0.94
National Ocean Service (NOS) Sites
Barbuda 17.59°N 61.82°W
10/1954 1005.1 11/0812 30 42 0.67 1.25
United States
U.S. Virgin Islands
ICAO Sites
Charlotte Amalie St. Thomas, VI (TIST)
11/0853 1008.5 12/1303 29 42 1.65
NOS Sites
Christiansted Harbor, St. Croix, VI
17.75°N 64.71°W 11/0718 1008.1 10/2224 21 48 0.55 1.01
Lameshur Bay, St. John, VI
18.32°N 64.72°W 11/0936 1007.9 0.59 1.15
Charlotte Amalie, St. Thomas, VI
18.34°N 64.92°W 11/0754 1007.5 0.41 1.18

10
Location
Minimum Sea Level Pressure
Maximum Surface Wind Speed
Storm surge (ft)c
Storm tide (ft)d
Total rain (in) Date/
time (UTC)
Press. (mb)
Date/ time
(UTC)a
Sustained (kt)b
Gust (kt)
Lime Tree Bay, St. Croix, VI
17.69°N 64.75°W 11/0712 1008.1 12/1618 27 33 0.25 0.97
Puerto Rico
ICAO Sites
Roosevelt Roads, PR (TJNR)
9.48
NOS Sites
Culebra, PR 18.30°N 65.30°W
11/0718 1010.5 13/0236 26 33 0.59 1.45
Isabel Segunada, Vieques Island, PR 18.15°N 66.44°W
12/1606 17 28 0.30 1.53
Esperanza, Vieques Island, PR 18.09°N 65.47°W
11/0718 1009.5 12/2036 24 28 0.66 1.01
Fajardo, PR 18.34°N 65.63°W
11/1848 1010.4 11/0500 24 30 0.32 1.83
Yabucoa Harbor, PR 18.06°N 65.83°W
13/0724 15 22 0.57 1.02
San Juan, PR 18.46°N 66.12°W
12/2000 1009.8 08/2106 22 29 0.31 1.73
Arecibo, PR 18.48°N 66.70°W
12/2006 1013.0 12/2012 18 24 0.73 2.03
Magueyes Island, PR 17.97°N 67.05°W
11/1924 1010.0 13/0706 21 27 0.26 0.98
Mayaguez, PR 18.22°N 67.16°W
11/1930 1014.1 13/1200 16 30 0.62 1.58
Aguadilla, PR 18.46°N 67.16°W
14/0854 1011.7 0.48 1.48
Mona Island, PR 18.09°N 67.94°W
0.55 1.08
Public/Other
Aibonito, PR (AIBP4) 18.14°N 66.27°W
11.60
Yabucoa, PR (YBUP4) 18.06°N 65.88°W
11.10
Villalba, PR (TOXP4) 18.13°N 66.48°W
9.02
Ceiba, PR (CEIBP4) 18.26°N 65.65°W
8.03
Patillas, PR (PASP4) 18.00°N 66.01°W
7.09

11
Location
Minimum Sea Level Pressure
Maximum Surface Wind Speed
Storm surge (ft)c
Storm tide (ft)d
Total rain (in) Date/
time (UTC)
Press. (mb)
Date/ time
(UTC)a
Sustained (kt)b
Gust (kt)
Luquillo, PR (MSCP4) 18.37°N 65.72°W
6.32
Coamo, PR (COAP4) 18.08°N 66.36°W
6.21
Naguabo, PR (NGHP4) 18.21°N 65.74°W
5.75
San Lorenzo (SLGP4) 18.19°N 65.97°W
5.42
Juana Diaz (JUBP4) 18.05°N 66.50°W
5.24
Bermuda
ICAO Sites
L.F. Wade International Airport (TXKF) 15/1555 1013 15/1531 34f 43 0.16
Canada
Newfoundland
ICAO Sites
Sagona Island (CWZN) 16/1900 990.8 16/2040 44f 52
Bonavista (CAVA) 16/2000 986.0 16/2200 40f 54
Cape Race (CWRA) 16/1800 985.0 16/1800 36f 54
St. Lawrence (CADS) 16/1700 990.0 16/2000 33f 51 2.48
Argentia (CWAR) 16/1800 987.7 16/2300 33f 45
Grates’s Cove (CWVW) 16/2000 983.9 16/2100 31f 47
Terra Nova National Park (CXTP)
16/2000 988.1 16/2200 20f 38
Burgeo (CWBD) 2.40
Nova Scotia
ICAO Sites
Sable Island (CWSA) 16/1200 998.0 16/1641 27f 33
Buoys
NDBC Buoy 41041 Mid-Atlantic
14.18°N 46.00°W 08/0650 1009.8 08/0126 42e 53
NDBC Buoy 41040 West Atlantic
14.48°N 53.01°W 08/2245 1007.1 08/1923 35e 41
NDBC Buoy 42060 Eastern Caribbean
10/2034 1007.8 11/1742 35e 41

12
Location
Minimum Sea Level Pressure
Maximum Surface Wind Speed
Storm surge (ft)c
Storm tide (ft)d
Total rain (in) Date/
time (UTC)
Press. (mb)
Date/ time
(UTC)a
Sustained (kt)b
Gust (kt)
16.33°N 63.40°W
NDBC Buoy 41043 Southwest Atlantic 21.06°N 64.97°W
11/2250 1010.6 12/0451 41e 45
NDBC Buoy 41046 E Bahamas
23.84°N 68.33°W 14/0547 1004.1 14/1611 41 e 47
Environment Canada Buoy 44138
SW Grand Banks 44.25°N 56.63°W
16/1520 997.6 16/1520 52f 70
Environment Canada Buoy 44141
Laurentian Fan 42.99°N 57.96°W
16/1120 985.4 16/1220 43f 58
Environment Canada Buoy 44251
Nickerson Bank 46.44°N 53.39°W
16/1720 986.1 16/1820 37f 48
Environment Canada Buoy 44255
NE Burgeo Bank 47.27°N 57.34°W
16/1720 995.0 16/2020 35f 45
Environment Canada Buoy 44140
Tail of the Bank 47.87°N 51.47°W
16/1620 1010.8 16/1620 30f 37
Environment Canada Buoy 44137
Scotian Slope 42.23°N 62.02°W
16/0820 999.7 16/1320 28f 35
Environment Canada Buoy 44150
La Have Bank 42.50°N 64.02°W
16/0620 1003.9 16/1420 27f 34
Environment Canada Buoy 44139
Banqureau Banks 44.24°N 57.10°W
16/1320 988.9 16/1820 26f 33
a Date/time is for sustained wind when both sustained and gust are listed. b Except as noted, sustained wind averaging periods for C-MAN and land-based ASOS reports
are 2 min; buoy averaging periods are 8 min. c Storm surge is water height above normal astronomical tide level. d Storm tide is water height above Mean Lower Low Water.

13
e Sustained wind averaging period is 1 min. f Sustained wind averaging period is 10 min.

14
Table 4a. NHC official (OFCL) and climatology-persistence skill baseline (OCD5) track forecast errors (n mi) for Hurricane Maria, 6–16 September 2011. Mean errors for the 5-yr period 2006-10 are shown for comparison. Official errors that are smaller than the 5-yr means are shown in boldface type.
Forecast Period (h)
12 24 36 48 72 96 120
OFCL (Maria) 36.6 62.8 88.6 109.1 144.9 210.1 268.8
OCD5 (Maria) 52.1 124.7 207.9 277.8 355.0 397.1 442.1
Forecasts 35 33 31 29 25 21 17
OFCL (2006-10) 31.0 50.6 69.9 89.5 133.2 174.2 214.8
OCD5 (2006-10) 47.7 98.3 156.4 218.1 323.3 402.2 476.1

15
Table 4b. Homogeneous comparison of selected track forecast guidance models (in n mi) for Hurricane Maria, 6–16 September 2011. Errors smaller than the NHC official forecast are shown in boldface type. The number of official forecasts shown here will generally be smaller than that shown in Table 4a due to the homogeneity requirement.
Model ID Forecast Period (h)
12 24 36 48 72 96 120
OFCL 37.2 68.1 89.8 110.7 158.4 232.6 313.3
OCD5 50.5 103.3 184.2 273.6 313.3 411.8 459.1
GFSI 35.1 61.4 80.1 99.2 134.8 246.5 335.1
GHMI 37.9 71.2 102.0 134.4 207.2 295.4 406.3
HWFI 42.3 84.0 109.1 138.0 209.0 322.4 333.7
GFNI 36.4 73.3 103.2 127.2 157.7 203.7 183.0
NGPI 46.5 88.9 124.5 152.8 204.1 292.6 334.4
EGRI 41.4 63.6 76.5 98.9 162.5 275.0 358.5
FSSE 39.1 74.1 101.2 137.0 215.7 291.3 369.0
TCON 36.0 65.6 83.8 104.4 150.6 230.3 302.1
TVCA 32.9 62.6 80.7 98.0 132.4 202.1 263.7
TVCE 34.2 66.0 85.9 105.3 141.5 214.0 273.3
TVCC 32.6 61.6 79.2 98.8 136.2 203.2 270.8
GUNA 37.0 66.7 87.1 107.6 155.2 243.3 306.8
LBAR 45.5 80.9 129.5 180.1 248.0 327.9 387.6
BAMD 47.3 75.8 101.6 124.8 200.2 276.0 303.7
BAMM 48.4 71.6 107.8 142.4 181.9 296.6 269.0
BAMS 63.5 103.6 162.5 224.8 264.3 347.9 270.6
Forecasts 30 27 27 26 21 18 11

16
Table 5a. NHC official (OFCL) and climatology-persistence skill baseline (OCD5) intensity forecast errors (kt) for Hurricane Maria, 6–16 September 2011. Mean errors for the 5-yr period 2006-10 are shown for comparison. Official errors that are smaller than the 5-yr means are shown in boldface type.
Forecast Period (h)
12 24 36 48 72 96 120
OFCL (Maria) 3.9 5.0 5.6 7.6 8.8 6.9 10.9
OCD5 (Maria) 5.3 7.4 8.2 10.0 14.2 15.7 21.2
Forecasts 35 33 31 29 25 21 17
OFCL (2006-10) 7.2 11.0 13.2 15.1 17.2 17.9 18.7
OCD5 (2006-10) 8.5 12.3 15.4 17.8 20.2 21.9 21.7
Table 5b. Homogeneous comparison of selected intensity forecast guidance models (in kt)
for Hurricane Maria, 6–16 September 2011. Errors smaller than the NHC official forecast are shown in boldface type. The number of official forecasts shown here will generally be smaller than that shown in Table 5a due to the homogeneity requirement.
Model ID Forecast Period (h)
12 24 36 48 72 96 120
OFCL 3.4 5.0 5.9 7.3 8.6 5.8 10.0
OCD5 4.9 7.5 8.7 10.1 15.0 15.6 21.4
GHMI 4.1 7.9 13.4 19.5 31.0 35.7 44.3
HWFI 5.6 8.9 11.3 14.4 18.1 17.1 20.6
GFNI 5.2 6.7 10.5 14.9 26.4 28.7 36.6
FSSE 4.0 6.3 7.1 9.2 11.1 10.5 14.6
DSHP 4.1 5.1 6.7 7.8 11.8 12.8 14.6
LGEM 4.7 6.2 7.0 7.1 8.0 7.9 10.0
ICON 3.8 5.3 6.6 8.5 13.9 15.2 17.9
IVCN 3.7 5.3 6.7 9.2 16.2 17.7 20.8
Forecasts 32 30 28 26 21 18 14

17
Table 6. Watch and warning summary for Hurricane Maria, 6–16 September 2011.
Date/Time (UTC)
Action Location
08/0300 Tropical Storm Watch issued Antigua, Anguilla, Barbuda, Montserrat, Nevis, St. Kitts
08/1200 Tropical Storm Watch issued Martinique, Guadeloupe,
St. Barthelemy, St. Martin
08/1500 Tropical Storm Watch issued Dominica, St. Maarten, Saba, St.
Eustatius
08/2230 Tropical Storm Watch changed to
Tropical Storm Warning Guadeloupe
09/0300 Tropical Storm Watch changed to
Tropical Storm Warning St. Maarten, Saba, St. Eustatius
09/0300 Tropical Storm Watch issued British Virgin Islands, Puerto Rico,
U.S. Virgin Islands
09/0900 Tropical Storm Watch changed to
Tropical Storm Warning
Antigua, Anguilla, Barbuda, Montserrat, Nevis, St. Kitts, British Virgin Islands, U.S. Virgin Islands
09/1500 Tropical Storm Watch changed to
Tropical Storm Warning Puerto Rico, Dominica
09/1615 Tropical Storm Watch changed to
Tropical Storm Warning Martinique, St. Barthelemy,
St. Martin
10/1200 Tropical Storm Warning discontinued Dominica, Guadeloupe, Martinique
10/1500 Tropical Storm Warning discontinued All
13/0900 Tropical Storm Watch issued Bermuda
13/2100 Tropical Storm Watch changed to
Tropical Storm Warning Bermuda
14/1200 Hurricane Watch issued Bermuda
15/1800 Tropical Storm Watch issued Arnolds Cove to Brigus South,
Newfoundland, Canada
15/1800 Hurricane Watch discontinued Bermuda

18
15/2100 Hurricane Watch issued Arnolds Cove to Brigus South,
Newfoundland, Canada
15/2100 Tropical Storm Warning issued Arnolds Cove to Jones Harbor,
Newfoundland, Canada
15/2100 Tropical Storm Warning discontinued Bermuda
16/0600 Hurricane Watch and Tropical Storm
Warning changed to Hurricane Warning
Arnolds Cove to Brigus South, Newfoundland, Canada
16/0600 Tropical Storm Warning modified to Arnolds Cove to Stones Cove,
Newfoundland, Canada
16/0600 Tropical Storm Warning issued Brigus South to Charlottestown,
Newfoundland, Canada
16/2100 All Warnings discontinued

19
Figure 1. Best track positions for Hurricane Maria, 6–16 September 2011.

20
20
30
40
50
60
70
80
90
100
9/5 9/7 9/9 9/11 9/13 9/15 9/17
BEST TRACKSat (TAFB)Sat (SAB)ADTAC (sfc)AC (flt->sfc)AC (DVK P->W)ScatterometerSurfaceAMSUAnalysis
Win
d Sp
eed
(kt)
Date (Month/Day)
Hurricane Maria6- 16 September 2011
Figure 2. Selected wind observations and best track maximum sustained surface wind speed curve for Hurricane Maria, 6–16 September 2011. Aircraft observations have been adjusted for elevation using an 80% adjustment factor for observations from 850 mb. Advanced Dvorak Technique estimates represent linear averages over a three-hour period centered on the nominal observation time. AMSU intensity estimates are from the Cooperative Institute for Meteorological Satellite Studies technique. Dashed vertical lines correspond to 0000 UTC and solid vertical line corresponds to landfall.

21
960
970
980
990
1000
1010
9/5 9/7 9/9 9/11 9/13 9/15 9/17
BEST TRACKKZC P-WSat (TAFB)Sat (SAB)ADTAMSUAC (sfc)SurfaceAnalysis
Pres
sure
(mb)
Date (Month/Day)
Hurricane Maria6-16 September 2011
Figure 3. Selected pressure observations and best track minimum central pressure curve for Hurricane Maria, 6–16 September 2011. Advanced Dvorak Technique estimates represent linear averages over a three-hour period centered on the nominal observation time. AMSU intensity estimates are from the Cooperative Institute for Meteorological Satellite Studies technique. The KZC P-W values are obtained by applying the Knaff-Zehr-Courtney pressure-wind relationship to the best track wind data. Dashed vertical lines correspond to 0000 UTC and solid vertical line corresponds to landfall.

22
Figure 4. SSMIS 91-GHz color composite satellite image of Hurricane Maria at 2108 UTC 15 September 2011 at the time of
peak intensity. Image courtesy U.S. Navy Fleet Numerical Meteorology and Oceanography Center, Monterey, California.
23
Figure 5. Analyzed rainfall totals (inches) in Puerto Rico from Maria. Analysis and image courtesy of David Roth of the NOAA
Hydrometeorological Prediction Center.

24
Figure 6. Official (blue) and TVCA consensus model (orange) 5-day track forecasts for Maria issued from 1200 UTC 8 September through 0600 UTC 9 September 2011. The black line shows the best track of Maria.

25
20
30
40
50
60
70
80
90
100
110
120
130
9/10 9/11 9/12 9/13 9/14 9/15 9/16 9/17
BEST TRACK
1012
1018
1100
1106
1112
1118
1200
1206
1212
Win
d Sp
eed
(kt)
Date (Month/Day)
GFDL (GHMI) Intensity ForecastsHurricane Maria (2011)
20
30
40
50
60
70
80
90
100
110
120
130
9/10 9/11 9/12 9/13 9/14 9/15 9/16 9/17
BEST TRACK
1018
1100
1106
1112
1118
1200
1206
1212
Win
d Sp
eed
(kt)
Date (Month/Day)
GFDN (GFNI) Intensity ForecastsHurricane Maria (2011)
20
30
40
50
60
70
80
90
100
110
120
130
9/10 9/11 9/12 9/13 9/14 9/15 9/16 9/17
BEST TRACK
1012
1018
1100
1106
1112
1118
1200
1206
1212
Win
d Sp
eed
(kt)
Date (Month/Day)
HWRF (HWFI) Intensity ForecastsHurricane Maria (2011)
20
30
40
50
60
70
80
90
100
110
120
130
9/10 9/11 9/12 9/13 9/14 9/15 9/16 9/17
BEST TRACK101210181100110611121118120012061212
Win
d Sp
eed
(kt)
Date (Month/Day)
OFCL Intensity ForecastsHurricane Maria (2011)
Figure 7. Intensity forecasts (colored lines, kt) for Hurricane Maria from 1200 UTC 10 September through 1200 UTC 12 September 2011 from the GFDL model (GHMI, upper left), the U.S. Navy version of the GFDL model (GFNI, upper right), the HWRF model (HWFI, lower left), and the official forecast (OFCL, lower right). The solid black line represents the best track intensity of Maria.